sir2018-5141 - spatial distribution of nutrients, chloride ... · we would like to acknowledge our...
TRANSCRIPT

Prepared in cooperation with the U.S. Environmental Protection Agency and Environment and Climate Change Canada
Spatial Distribution of Nutrients, Chloride, and Suspended Sediment Concentrations and Loads Determined by Using Different Sampling Methods in a Cross Section of the Trenton Channel of the Detroit River, Michigan, November 2014–November 2015
Scientific Investigations Report 2018–5141
U.S. Department of the InteriorU.S. Geological Survey

Cover. Velocity map of ADCP data displayed using the Velocity Mapping Toolbox and a georeferenced background at U.S. Geological Survey station 041686401 Trenton Channel of Detroit River at Grosse Ile, Michigan.

Spatial Distribution of Nutrients, Chloride, and Suspended Sediment Concentrations and Loads Determined by Using Different Sampling Methods in a Cross Section of the Trenton Channel of the Detroit River, Michigan, November 2014–November 2015
By Alexander R. Totten and Joseph W. Duris
Prepared in cooperation with the U.S. Environmental Protection Agency and Environment and Climate Change Canada
Scientific Investigations Report 2018–5141
U.S. Department of the InteriorU.S. Geological Survey

U.S. Department of the InteriorDAVID BERNHARDT, Acting Secretary
U.S. Geological SurveyJames P. Reilly II, Director
U.S. Geological Survey, Reston, Virginia: 2019
For more information on the USGS—the Federal source for science about the Earth, its natural and living resources, natural hazards, and the environment—visit https://www.usgs.gov or call 1–888–ASK–USGS.
For an overview of USGS information products, including maps, imagery, and publications, visit https://store.usgs.gov.
Any use of trade, firm, or product names is for descriptive purposes only and does not imply endorsement by the U.S. Government.
Although this information product, for the most part, is in the public domain, it also may contain copyrighted materials as noted in the text. Permission to reproduce copyrighted items must be secured from the copyright owner.
Suggested citation:Totten, A.R., and Duris, J.W., 2019, Spatial distribution of nutrients, chloride, and suspended sediment concentrations and loads determined by using different sampling methods in a cross section of the Trenton Channel of the Detroit River, Michigan, November 2014–November 2015: U.S. Geological Survey Scientific Investigations Report 2018–5141, 25 p., https://doi.org/10.3133/sir20185141.
ISSN 2328-0328 (online)

iii
Acknowledgments
We would like to acknowledge our project partners including those in the U.S. Geological Survey Upper Midwest Water Science Center (Lansing, Michigan), U.S. Environmental Protection Agency, Environment and Climate Change Canada, and others who contributed to the project summarized in this report. For their exceptional support, we would like to specifically thank Alice Dove, Environmental Scientist; Sean Backus, Manager; Greg Koltun, Reviewer; and Paul Terrio, Reviewer.

iv
ContentsAcknowledgments ........................................................................................................................................iiiAbstract ...........................................................................................................................................................1Introduction.....................................................................................................................................................2Purpose and Scope .......................................................................................................................................2Description of Study Area ............................................................................................................................2Methods...........................................................................................................................................................4
Determination of Stream Velocity, Discharge, and Channel Bathymetry....................................4Water-Quality Sample Collection .......................................................................................................4
Multiple-Vertical Depth-Integrated Sampling .........................................................................5Fixed-point Sampling ...................................................................................................................5Discrete Sampling .......................................................................................................................8
Processing Water-Quality Samples ...................................................................................................8Analytical Methods...............................................................................................................................8Quality Assurance for Water Quality .................................................................................................8
Velocity and Discharge .................................................................................................................................9Concentrations and Loads of Nutrients, Chloride, and Suspended Sediment ..................................12
Constituent Concentrations Measured in Paired MVDI and Fixed-point Samples ........12Chemical Constituent Distribution .........................................................................................16Constituent Loads ......................................................................................................................19
Summary........................................................................................................................................................23References ....................................................................................................................................................23

v
Figures
1. Map showing Trenton Channel of the Detroit River study area between Lake St. Clair and Lake Erie ..................................................................................................................3
2. Illustration showing multiple-vertical depth-integrated composite profiles, discrete locations, and fixed-point sample locations in the Trenton Channel of the Detroit River downstream from the Grosse Ile Parkway Bridge from November 2014 through November 2015 ..................................................................................6
3. Map showing fixed-point, multiple-vertical depth-integrated, and discrete locations on the sampling transect of Trenton Channel downstream from Grosse Ile Parkway Bridge ................................................................................................7
4. Plan view velocity map of ADCP data at a range of 40–100 centimers per second displayed by using the Velocity Mapping Toolbox and a geospatial reference background at U.S. Geological Survey station 041686401 Trenton Channel of Detroit River at Grosse Ile, Michigan, November 18, 2015 ..............................................10
5. Cross section showing relation between streamwise velocity and secondary flow at U.S. Geological Survey station 041686401 Trenton Channel of Detroit River at Grosse Ile, Michigan, November 18, 2015 ..........................................................................11
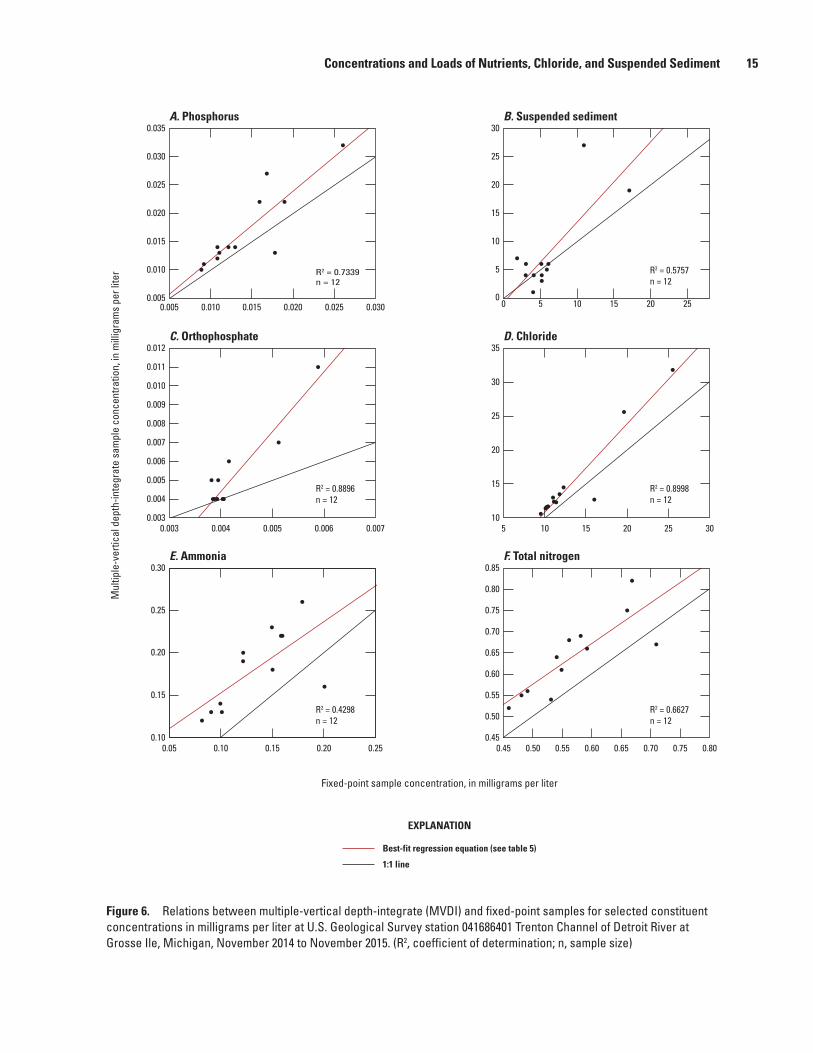
6. Graphs showing relations between multiple-vertical depth-integrate and fixed-point samples for selected constituent concentrations in milligrams per liter at U.S. Geological Survey station 041686401 Trenton Channel of Detroit River at Grosse Ile, Michigan, November 2014 to November 2015 ...................15
7. Tile graphs of discrete constituent concentrations measured at U.S. Geological Survey station 041686401 Trenton Channel of Detroit River at Grosse Ile, Michigan, March 18, 2015 .........................................................................................................17
8. Boxplots showing selected constituent concentrations based on horizontal location or type of sample at U.S. Geological Survey station 041686401 Trenton Channel of Detroit River at Gross Ile, Michigan, November 2014 to November 2015 .....................18
9. Horizontal boxplots showing selected constituent concentrations based on vertical location at U.S. Geological Survey station 041686401 Trenton Channel of Detroit River at Grosse Ile, Michigan, November 2014 to November 2015 ...................20
10. Graph showing comparison of phosphorus loads computed by use of multiple- vertical depth-integrated and fixed-point measurements and instantaneous discharge at U.S. Geological Survey station 041686401 Trenton Channel of Detroit River at Grosse Ile, Michigan, November 2014 to November 2015 ...................22

vi
Tables
1. Average channel velocity and discharge at U.S. Geological Survey station 041686401 Trenton Channel of Detroit River at Grosse Ile, Michigan, from November 2014 to November 2015 .........................................................................................................................9
2. Summary statistics for constituents measured in water-quality samples collected by multiple-vertical depth-integrated, fixed-point, and discrete sampling methods at U.S. Geological Survey station 041686401 Trenton Channel of Detroit River at Grosse Ile, Michigan, November 2014 to November 2015 ...............................................13
3. Summary statistics for physical properties measured in water-quality samples collected by multiple-vertical depth-integrated, fixed-point, and discrete sampling methods at U.S. Geological Survey station 041686401 Trenton Channel of Detroit River at Grosse Ile, Michigan, November 2014 to November 2015 ...................14
4. Wilcoxon signed-rank test of differences in median concentrations for samples collected by use of multple-vertical depth-integrated and fixed-point methods at U.S. Geological Survey station 041686401 Trenton Channel of Detroit River at Grosse Ile, Michigan ..............................................................................................................14
5. Simple linear regression equations for all major constituents collected at U.S. Geological Survey station 041686401 Trenton Channel of Detroit River at Grosse Ile, Michigan, November 2014 to November 2015 ...............................................16
6. Constituent load estimates from multiple-vertical depth-integrated and fixed-point sampling methods at U.S. Geological Survey station 041686401 Trenton Channel of Detroit River at Grosse Ile, Michigan, November 2014 to November 2015 ...................21

vii
Conversion Factors
International System of Units to U.S. customary units
Multiply By To obtain
Length
meter (m) 3.281 foot (ft) kilometer (km) 0.6214 mile (mi)
Flow rate
cubic meter per second (m3/s) 35.31 cubic foot per second (ft3/s)Mass
kilogram (kg) 2.205 pound avoirdupois (lb)
Temperature in degrees Celsius (°C) may be converted to degrees Fahrenheit (°F) as follows:
°F = (1.8 × °C) + 32.
Temperature in degrees Fahrenheit (°F) may be converted to degrees Celsius (°C) as follows:
°C = (°F – 32) / 1.8.
DatumVertical coordinate information is referenced to the North American Vertical Datum of 1988 (NAVD 88).
Horizontal coordinate information is referenced to the North American Datum of 1983 (NAD 83).
Depth, as used in this report, refers to distance below the vertical datum.
Supplemental InformationSpecific conductance is given in microsiemens per centimeter at 25 degrees Celsius (µS/cm at 25 °C).
Concentrations of chemical constituents in water are given in either milligrams per liter (mg/L) or micrograms per liter (µg/L).

viii
AbbreviationsADCP acoustic Doppler current profiler
EDI equal-discharge-increment
EWI equal width increment
HDPE high density polyethylene
NWIS National Water Information System
NWQL National Water Quality Lab
MVDI multiple-vertical depth integrated
EPA U.S. Environmental Protection Agency
USGS U.S. Geological Survey

Spatial Distribution of Nutrients, Chloride, and Suspended Sediment Concentrations and Loads Determined by Using Different Sampling Methods in a Cross Section of the Trenton Channel of the Detroit River, Michigan, November 2014–November 2015
By Alexander R. Totten and Joseph W. Duris
AbstractThe Detroit River separates the United States and Canada
as it flows from Lake St. Clair to Lake Erie. The Trenton Channel is a 13-kilometer-long branch of the Detroit River that flows to the west of Grosse Ile before rejoining the Detroit River near its mouth, just before the Detroit River flows into Lake Erie. The U.S. Environmental Protection Agency has listed both the Trenton Channel and Detroit River as Areas of Concern because of a list of Beneficial Use Impairments such as interrupted drinking-water services, loss of aquatic life, and reduced recreational use. Phosphorus loading from tributaries such as the Trenton Channel is one of the primary drivers of eutrophication in Lake Erie. The complex flow patterns and variable distribution of chemical constituents in the Tren-ton Channel make it difficult to accurately characterize the concentrations and loads of nutrients and other constituents conveyed through the channel to Lake Erie.
In order to better understand the Trenton Channel’s con-tributions of nutrients (total phosphorus, orthophosphate, total nitrogen, and ammonia), chloride, and suspended sediment to Lake Erie and evaluate differences in results obtained by using different sample methodologies, the U.S. Geological Survey, in cooperation with the U.S. Environmental Protection Agency and Environment Canada, completed 12 sampling campaigns on the Trenton Channel in Detroit, Michigan, from November 2014 through November 2015.
Acoustic Doppler current profiler (ADCP) techniques were used to characterize the distribution of velocity compo-nents within a cross section corresponding to a transect of the Trenton Channel at U.S. Geological Survey station 041686401 Trenton Channel of Detroit River at Grosse Ile, Mich. Three methods of collecting water-quality data at the same transect of the Trenton Channel were used: multiple-vertical depth-integrated (MVDI), fixed-point, and discrete samples. Hori-zontal and vertical variations in concentrations of nutrients,
chloride, and suspended sediment were analyzed from discrete samples to better understand distributions of these constituents throughout the channel. Constituent loads were calculated by using individual sample concentrations and ADCP measure-ments for discharge made on the same day that the water-qual-ity samples were collected. Constituent loads calculated from MVDI and fixed-point sampling methods were compared. The relation between MVDI and fixed-point samples helped quantify the differences between the sampling methods. Linear regression equations depicting the relation between concen-trations measured by using MVDI and fixed-point samples were prepared.
ADCP data indicates that velocities throughout the sam-pled transect remain uniform except for one location around 200 meters from the west bank of the channel. Secondary flow vectors suggest the presence of counter-rotating helical flow cells, and these helical flow cells could affect the mixing of constituents in transport by preventing cross-channel mixing. Flow discharges throughout the sampling campaign showed small variations, although lower flow rates were observed in the early winter months than in the summer months. Dis-crete sampling methods results displayed both heterogeneity throughout the channel horizontally, representing limited horizontal mixing in the channel, and displayed homogene-ity throughout vertical transects, indicating mixing vertically. Comparisons between MVDI and fixed-point methods found consistently higher concentrations were measured in MVDI samples compared to concentrations measured in fixed-point samples. To correct for this bias between MVDI and fixed-point sample results, simple linear-regression equations were developed for all major constituents to help estimate constitu-ent concentrations from fixed-point samples equivalent to those measured by using MVDI sampling techniques. Instanta-neous constituent loads were developed by using velocity and discharge data obtained from ADCPs and constituent concen-trations obtained from MVDI and fixed-point samples.

2 Spatial Distribution of Concentrations and Loads Using Different Sampling Methods, Trenton Channel, Michigan
IntroductionThe Detroit River separates the United States and Canada
as it flows from Lake St. Clair to Lake Erie. The Trenton Channel is a 13-kilometer (km) branch of the Detroit River that flows between the mainland of Michigan and the eastern edge of Grosse Ile before rejoining the Detroit River near its mouth just before the Detroit River flows into Lake Erie (fig. 1). The Detroit River splits at the northern tip of Grosse Ile; the Trenton Channel conveys about 22 percent of the flow to Lake Erie and is thus a major contributor to water quality in Lake Erie (Derecki, 1984). Since 1991 The U.S. Environ-mental Protection Agency (EPA) has listed both the Trenton Channel and the Detroit River as Areas of Concern because of Beneficial Use Impairments such as interrupted drinking-water services, loss of aquatic life, and reduced recreational use (EPA, 2015). Since 1991, remediation has helped shorten the list of Beneficial Use Impairments for the Detroit River and the Trenton Channel in hopes of ultimately removing these rivers from the list of Areas of Concern.
In the last decade, there has been intense focus on under-standing eutrophication issues in Lake Erie. Persistent and widespread algal blooms have resulted in decreased recre-ational opportunities and increased human health risks (Francy and others, 2015). The primary eutrophication driver in Lake Erie is phosphorus loading to the lake from its tributaries and internal phosphorus loading from the lake sediment (Lake Erie Lakewide Management Plan , 2011). The International Joint Commission (IJC), EPA, Great Lakes Binational Committee (GLBC), and Ohio EPA (OHEPA) have recognized that esti-mating nutrient loads from tributaries is essential to under-standing the recent changes in the lake ecosystem.
A previous study conducted by Environment Canada evaluated the phosphorus loading from the Detroit River and the Trenton Channel into Lake Erie from August through November 2007 (Burniston and others, 2010). Combinations of automated Isco samples and grab samples collected at five equal width increments along a transect at U.S. Geologi-cal Survey (USGS) station 041686401 Trenton Channel of Detroit River at Grosse Ile, Mich. (hereinafter referred to as the “Trenton Channel station”), were used by Burniston and others (2010) to develop estimated phosphorus concentrations throughout 2007. A two-dimensional hydrodynamic model of Lake St. Clair-Detroit River was used to estimate average flow per day in the southern part of the Trenton Channel throughout 2007 (Holtschlag and Koschik, 2002). The combination of estimated concentrations and flow was used to determine an annual phosphorus load.
Advances in technology have improved the ability to accurately measure flow in complex systems such as the Detroit River and Trenton Channel. During the last 10 years, the USGS has transitioned from using mechanical velocity meters to using Acoustic Doppler Current Profilers (ADCPs) for collecting discharge measurements in rivers that have com-plex directional patterns and unsteady-flow characteristics like the Trenton Channel.
The USGS uses standardized techniques to monitor water quality. One technique that provides scientists with a high level of confidence in water-quality monitoring data is the collection of depth- and width-integrated samples that can be analyzed for representative flow-weighted mean concentra-tions (U.S. Geological Survey, 2006).
In order to better understand the Trenton Channel’s con-tributions of nutrients (total phosphorus, orthophosphate, total nitrogen, and ammonia), chloride, and suspended sediment to Lake Erie and evaluate differences in results obtained by using different sample methodologies, the USGS, in cooperation with the EPA and Environment and Climate Change Canada, completed 12 sampling campaigns on the Trenton Channel in Detroit, Mich., from November 2014 through November 2015. In addition to fixed-point samples, a composited multiple-vertical depth-integrated (MVDI) sample was collected along a cross section approximately 130 meters (m) downstream from Grosse Ile Parkway. On 4 of the 12 sampling dates, 24 discrete samples were collected at 4 verticals across the cross section using a 1–L Van Dorn sampler. An ADCP was used directly after sampling to measure stream velocity, discharge, and bathymetry within the cross section. ADCP data were examined using the Velocity Mapping Toolbox to evaluate the velocity distribution and secondary flow patterns in the sampling cross section.
Purpose and ScopeThis report describes the results of discharge measure-
ments and water-quality sampling done by the USGS in cooperation with the EPA and Environment Climate Change Canada in the southern part of the Trenton Channel from November 2014 through November 2015 to characterize nutrient loads. This report (1) compares analytical results for nutrients (total phosphorus, orthophosphate, total nitrogen, and ammonia), chloride, and suspended sediment measured with MVDI, fixed-point, and discrete sample methods in a cross section of the Trenton Channel; (2) describes the spatial distribution of velocities and major constituent concentrations within the cross section; and (3) compares loading estimates computed with concentrations obtained from MVDI and fixed-point samples.
Description of Study AreaThe Detroit River separates the United States and Canada
as it flows from Lake St. Clair to Lake Erie. The Trenton Channel of the Detroit River is located on the eastern side of Michigan’s Lower Peninsula (fig. 1). Grosse Ile separates Trenton Channel from the main channel of the Detroit River, creating a 13-km channel starting near Wyandotte, Mich., on the American side originating in the Detroit River, and terminating 8 km from Lake Erie near Gibraltar, Mich. The

Description of Study Area 3
LAKE ERIE
LAKEST. CLAIR
DET
ROIT
RIV
ER
RIVER ROUGE
Gibraltar
Tren
ton
C hann
el
04168640
#04165710
UN
ITED
STAT
ESC
AN
AD
A
42°00'
42°05'
42°10'
42°15'
42°20'
83°20' 83°10' 83°00'
1510
10
5
5
0
0
20 KILOMETERS
MILES
EXPLANATION
Surface water site
Study area
Water flow direction
International boundary
Map image is the intellectual property of Esri and is used herein under license. Copyright © 2019 Esri and its licensors. All rights reserved.Universal Transverse Mercator, projection zone 17North American Datum 1983, 1:350,000
Map area
Figure 1. Trenton Channel of the Detroit River study area between Lake St. Clair and Lake Erie.

4 Spatial Distribution of Concentrations and Loads Using Different Sampling Methods, Trenton Channel, Michigan
Trenton Channel generally flows from north to south, although the direction of flow in the Trenton Channel can be reversed or stopped temporarily by oscillating standing waves (seiches) on Lake Erie caused by strong winds or changes in atmospheric pressure (National Oceanic and Atmospheric Administration, 2018). The Trenton Channel is deep (average depth is 8.5 m) and wide (average width is 330 m), with an average discharge of approximately 1,370 cubic meters per second (m3/s). Urban and industrial land cover of Detroit and the surrounding areas make up a majority of the Trenton Channel’s watershed (Homer and others, 2015). Trenton Channel is frequently used by local anglers, recreationists, and commercial transport ves-sels. The Rogue River is one of the primary local tributaries contributing to the Detroit River and enters the Detroit River from the west, approximately 9 km upstream from the north-ern end of the Trenton Channel (fig. 1).
MethodsFrom November 2014 through November 2015, the
USGS collected data to characterize nutrient loads in the Trenton Channel. In order to accurately measure nutrient loads in the Trenton Channel, accurate measurements of stream velocity, discharge, and channel bathymetry are needed. The methods used to measure stream velocity and bathymetry are described in Mueller and Wager (2009) and Mueller and others (2013). The water-quality sampling techniques used to mea-sure physical properties, nutrients, chloride, and suspended sediment concentrations are described. Quality assurance and quality control measures pertaining to the sampling techniques are also described. The water quality processing techniques that were used to ensure reproducible results are described, as well as the laboratory analytical methods. All of the data used in this assessment were collected by the USGS and are stored in the National Water Information System (NWIS) database (U.S. Geological Survey, 2018).
Determination of Stream Velocity, Discharge, and Channel Bathymetry
An ADCP was used to measure stream velocity, dis-charge, and bathymetry in a cross section of the Trenton Channel downstream from the Grosse Ile Parkway Bridge at the Trenton station. ADCPs produce beams of ultrasonic sound that bounce off small particles of material in the water and the bed of the channel before traveling back to the ADCP. The frequency and travel time of the reflected acoustic signals are measured upon arrival back at the ADCP. Veloc-ity is calculated from the change in frequency of the acoustic signal reflected to the ADCP, resulting from the Doppler effect (Mueller and Wagner, 2009). Bathymetry is measured based on the two-way travel time of the signals. Stream discharge is
computed from the product of velocity and area of the chan-nel. ADCPs use four transducers in a Janus configuration to send and receive acoustic signals (Mueller and others, 2013). The use of four beams to detect velocity at four different angles gives the ADCP the ability to calculate bathymetry and three-dimensional velocity. The ADCP was deployed at a depth of approximately 0.75 m below the water surface; a “blank zone” in which accurate acoustic signals could be mea-sured extended approximately 0.5 m below the depth at which the ADCP was deployed. The combined depth (approximately 1.25 m) is considered the superficial zone and no velocity measurements could be made within this zone. Because of a high amount of interference produced by bed sediment, known as side-lobe interference, the ADCP cannot develop velocity measurements near the bed of the channel (Mueller and others, 2013). Side-lobe interference affects about 6 to 13 percent of the measured system, and data cannot be accurately collected in this area. However, extrapolation of velocities and discharge can be calculated for this area.
A boat-mounted ADCP was used. In order to compen-sate for the velocity of the moving boat while making the measurement, a global positioning system was mounted over the ADCP to determine the boat velocity. The ADCP was configured and calibrated onsite before every sample. Move-ment of near-bed sediment during the ADCP data collection can produce errors in the discharge measurement. A moving-bed test is done at every sampling site before the discharge measurement begins to compensate for this possible source of error. For each sampling effort a measurement consisted of four separate ADCP transects made along the cross sec-tion for which velocity and discharge were calculated. If the discharge measurements from the four transects did not differ from each other by more than 5 percent, they were used to compute an average velocity and discharge (U.S. Geologi-cal Survey 2002). None of the 12 ADCP discharge measure-ments during sampling campaigns had differences between individual transects that exceeded 5 percent. Average velocity and total discharge data for the measurements can be found on the NWIS website at https://waterdata.usgs.gov/nwis/measurements/?site_no=041686401.
Version 4.0.9 of the Velocity Mapping Toolbox (VMT) was used to display and examine the data collected with the ADPCs (Parsons and others, 2013). VMT is a Matlab-based software used for processing and visualizing ADCP data. The software produces transverse three-dimensional flow models and plan-view depth-averaged flow maps (Lane and others 2000). Velocity maps were produced for every viable ADCP measurement with available global positioning systems and complete flow data.
Water-Quality Sample Collection
Similar to the velocity and discharge measurement, all of the water-quality samples were collected at the Trenton station

Methods 5
downstream from the Grosse Ile Parkway Bridge. A water-quality sonde (YSI ProPlus) (Xylem Inc., 2018) was used to make onsite measurements of selected physical properties of the water (temperature, pH, specific conductance, and dis-solved oxygen). The water-quality sonde was calibrated before each sampling event in accordance with standard USGS procedures (Gibs and others, 2007). Concurrent with MVDI and fixed-point sample collection, the water-quality sonde was placed 0.5 m below the water surface to obtain point physical-property measurements traversing the cross section from which discharge data and water-quality samples were collected. Results were stored in the NWIS database (U.S. Geological Survey, 2018). Physical properties were recorded at each discrete location concurrent with discrete sampling. A weighted DH–2 sampler was used to obtain physical proper-ties at each discrete location. The YSI ProPlus was attached to the DH–2 sampler with zip-ties and lowered to the depth corresponding to the discrete sampling location.
Three methods were used to collect water-quality samples: (1) a MVDI method; (2) a fixed-point sampling method; and (3) a discrete sampling method. The MVDI method consisted of 10 vertical isokinetic depth-integrated samples collected by using a DH–2 sampler; the 10 depth-integrated samples were subsequently composited to form a single sample. For the fixed-point sampling method, sequen-tial samples were collected about 20 m from the east bank by using a DH–2 sampler positioned 2 m below the water surface. Discrete samples collected using a 1–L Van Dorn sampler at four locations along the transect. At three locations along the transect, the discrete samples were collected at increments of 1 m of depth; at a fourth location near the west bank, discrete samples were collected at increments of 0.5 m of depth. USGS personnel carried out all three of these water-quality sampling techniques in a consistent manner along the same sampling transect at the Trenton Channel station. A total of 12 MVDI and 12 fixed-point samples were collected during the Novem-ber 2014–November 2015 sampling period. On four dates within the sampling period, 24 discrete samples were collected in four verticals along the sampling transect of Trenton Chan-nel (fig. 2). After all water-quality samples had been collected, a series of 4 boat mounted ADCP measurements were aver-aged to produce velocities, bathymetry, and discharge in the sampling cross section.
Multiple-Vertical Depth-Integrated SamplingThe USGS commonly uses MVDI sampling methods
in water-quality analysis because MVDI sampling provides an accurate depth integrated isokinetic sample that spatially characterizes the cross section (Topping and others, 2011). MVDI samples were collected 12 times during the sampling period from a cross section about 100 m downstream from Grosse Ile Pkwy road (figs. 2 and 3; fixed-point and discrete samples were also collected from this cross section). Because
of interference from a marina, it was not possible to collect MVDI samples from a small section of the channel near the east bank, and as a result the sampling method is better cat-egorized as a MVDI than a common equal width increment (EWI) sample. The approximately 310-m-wide sampling cross section was subdivided into 10 approximately equal-width intervals. Vertical sampling profiles along the sam-pling transect were collected at the 10 points of intersection between adjacent intervals. Based on the velocity of the river and river depth, a single vertical transit rate was calculated and used at each vertical (U.S. Geological Survey, 2006). At each MVDI vertical, a boat-mounted crane was used to lower the DH–2 sampler at the specified transit rate to just above the bed of the channel then back up. A DH–2 sampler was used because of the depth of the Trenton Channel exceeded 7 m in some locations. A DH–2 bag sampler is used instead of a bottle sampler if the sampling depth exceeds 7 m to off-set the water pressure at such deep depths (Davis, 2005). The sample obtained from each vertical profile was emptied into a 14-L polyethylene churn splitter. After all 10 verticals were sampled and emptied into the churn splitter, the mixture was homogenized using the churn paddle, and individual bottles for analysis were filled from the churn.
Fixed-point SamplingFixed-point samples were collected from a boat using a
DH–2 weighted bag sampler lowered by a crane to a dis-crete depth of 2 m. Ambient water flowed into a 1-liter (L) high-density polyethylene (HDPE) bag through a 5/16-inch diameter nozzle (7.94 millimeter) attached to the DH–2 bag sampler. The sampling location was approximately 20 m from the east bank and about 130 m downstream from Grosse Ile Pkwy Bridge (figs. 2 and 3). The DH–2 sampler is not a point sampler; it was quickly lowered to a depth of 2 m below the surface so that most of the water it collected was from the desired sampling depth. Because the DH–2 sampler is not a true point sampler, the samples collected with the DH–2 sampler are referred to herein as “fixed-point samples.” The water collected from each sample bag consti-tuting a fixed-point sample was poured into a 14–L HDPE churn. The 5 sample bags were collected over a 5-minute time period. A total of 5 sample bags were composted into the 14–L churn and then the sample was homogenized using the churn paddle and decanted individual bottles for analy-sis. The USGS often deploys automated samplers in order to obtain accurate temporal water-quality results. Automated samplers can provide temporally accurate data, but at a cost of bias in spatial representation of sample area (Anderson and Rounds, 2010). The location and methods used for collecting fixed-point samples were selected for the purpose of obtain-ing samples similar to those obtained by using an automated sampler. Cross sectionally composited sampling methods like MVDI sampling provide a sample that represents the sample

6 Spatial Distribution of Concentrations and Loads Using Different Sampling Methods, Trenton Channel, Michigan
0.5
met
er
1.5
met
ers
2 m
eter
s
1 m
eter
2 m
eter
s
3 m
eter
s
4 m
eter
s
5 m
eter
s
6 m
eter
s
7 m
eter
sif
poss
ible
1 m
eter
2 m
eter
s
3 m
eter
s
4 m
eter
s
5 m
eter
s
6 m
eter
s
7 m
eter
s
1 m
eter
2 m
eter
s
3 m
eter
s
4 m
eter
s
5 m
eter
s
6 m
eter
s
7 m
eter
s
2 m
eter
s
Wes
t ban
kEa
st b
ank
10m
eter
s60
met
ers
170
met
ers
280
met
ers
EXPL
AN
ATIO
N
Mul
tiple
-ver
tical
dep
th-i
nteg
rate
d co
mpo
site
—Pr
ofile
loca
tions
thro
ugho
ut th
e cr
oss
sect
ion
whe
re v
ertic
al d
epth
-inte
grat
ed w
ater
-qua
lity
sam
ples
wer
e ta
ken
Dis
cret
e sa
mpl
ing
poin
t—De
pths
at w
hich
di
scre
te w
ater
-qua
lity
sam
ples
wer
e co
llect
ed a
t eac
h ve
rtica
l pro
file,
in m
eter
s
Fixe
d-po
int s
ampl
ing
poin
t—Sa
mpl
es c
olle
cted
from
a s
ingl
e de
pth
(2 m
eter
s)
usin
g DH
-2 s
ampl
er
Bed
of c
hann
el—
Estim
ated
and
ext
rapo
late
d de
pth
to th
e be
d of
cha
nnel
Figu
re 2
. M
ultip
le-v
ertic
al d
epth
-inte
grat
ed c
ompo
site
pro
files
, dis
cret
e lo
catio
ns, a
nd fi
xed-
poin
t sam
ple
loca
tions
in th
e Tr
ento
n Ch
anne
l of t
he D
etro
it Ri
ver d
owns
tream
fro
m th
e Gr
osse
Ile
Park
way
Brid
ge fr
om N
ovem
ber 2
014
thro
ugh
Nov
embe
r 201
5 (w
est b
ank
is o
n th
e le
ft).

Methods 7
83°10'45" 83°10'40" 83°10'35" 83°10'30" 83°10'25"
42°07'40"
42°07'35"
42°07'30"
42°07'25"
Map area
LAKEST. CLAIR
LAKE ERIE
DET
ROIT
RIV
ER
Tren
ton
Chan
nel
UNITEDSTATES
CANADA
83°30' 83°20' 83°10' 83°00' 82°50'42°30'
42°20'
42°10'
150
400200
0 75
0 FEET
METERSMap image is the intellectual property of Esri and is used herein under license. Copyright © 2019 Esri and its licensors. All rights reserved.Universal Transverse Mercator, projection zone 17North American Datum 1983
EXPLANATION
Multiple-vertical depth-integrated location
Discrete location
Fixed-point location
International boundary
Figure 3. Fixed-point, multiple-vertical depth-integrated, and discrete locations on the sampling transect of Trenton Channel downstream from Grosse Ile Parkway Bridge.

8 Spatial Distribution of Concentrations and Loads Using Different Sampling Methods, Trenton Channel, Michigan
cross section spatially (Topping and others, 2011). The purpose for deploying the fixed-point method was to statisti-cally build a linear regression between the fixed-point and MVDI methods.
Discrete SamplingMultiple discrete samples were collected throughout the
cross section to help describe the distribution of nutrients, chloride, and suspended sediment in the Trenton Channel. A total of 24 discrete samples were collected at four verti-cals along the sampling cross section using a 1–L Van Dorn sampler. These verticals were located at 10 m, 60 m, 170 m, and 280 m from the west bank of the channel (figs. 2 and 3). At most verticals, discrete samples were collected at 1-m intervals below the water surface to the bed of the channel (fig. 2). At the western-most vertical, samples were collected at intervals ranging from 0.5 to 1 m because of the shallow waters at this vertical transect. For each discrete sample, the open Van Dorn sampler was lowered to the indicated depth along with a messenger weight that follows the suspension line and triggers sample acquisition. The sample obtained from the Van Dorn sampler was then decanted into a sterile 1-L HDPE bottle for later processing. During two of the four discrete sampling dates, the water was too shallow to collect a 7-m deep sample at the 60-m location.
Processing Water-Quality Samples
Prior to each sample event, 500-milliliter HDPE sample bottles were rinsed with deionized water to condition the bottles for sampling. The capsule filter with 0.45 microm-eter pore size used in the processing of filtered samples was flushed with approximately 2 L of deionized water to condition the filter. All sample splitting, decanting, filtering, and processing was done in a mobile laboratory van. Filter-ing was done by pumping water through the capsule filters using a peristaltic pump with clean tubing. One milliliter of 1:7 sulfuric acid preservation was done after samples were split. Samples were shipped on ice the day of collection to the USGS National Water Quality Laboratory (NWQL) for processing and analysis for all constituents except turbidity.
A conditioned 250-milliliter HDPE bottle was used to store the turbidity sample until analysis. Turbidity was mea-sured at the USGS Water Science Center in Lansing, Mich. by using a Hach 2100Q turbidity meter (Hach Company, 2018). The median value of three separate quantifications was entered into the NWIS database. All water-quality results can be obtained from the NWIS: Web Interface (NWISWeb)
(https://nwis.waterdata.usgs.gov/usa/nwis/qwdata). To retrieve the water-quality data, check the box next to Site Number and click the Submit button. Enter 041686401 as the Site Number and click on the Submit button. From the resulting web page, a variety of options are offered for retrieving the water-quality data.
Analytical Methods
All water samples collected by USGS personnel were analyzed and processed by the NWQL located in Lake-wood, Colorado, in accordance with analytical procedures as described in the USGS methods of analysis by the USGS NWQL (Fishman, 1993). All suspended sediment samples collected by the USGS were analyzed for suspended-sediment concertation by the USGS Kentucky Sediment Laboratory located at the Kentucky Water Science Center in Louisville. Suspended sediment samples analysis was conducted accord-ing to the USGS methods and procedures, as described in the Quality Assurance Plan for the Kentucky Water Science Center Sediment Laboratory (Shreve and Downs, 2005; Guy, 1969).
Quality Assurance for Water Quality
A part of producing accurate and unbiased data is implementing some form of quality assurance and quality control (QA/QC). For this study, 5 percent of all samples were QA/QC samples in the form of blanks or replicates. Three blanks and one replicate were collected during the sampling period to assess possible bias, as well as variability and reproducibility of the results. Blank sample concentrations were below the equipment’s observed limits or near estimated detection levels. The field blank collected on May 29, 2015, had a total phosphorus concentration of 0.0072 milligrams per liter (mg/L) which is above the NWQL minimum report-ing level of 0.004 mg/L. The minimum reporting level is the smallest concentration of a substance that can be reliably measured by a given analytical method (Childress and others, 1999). The field blank collected on August 26, 2015, had an ammonia as nitrogen concentration of 0.012 mg/L which is above the NWQL minimum reporting level of 0.010 mg/L. Blanks collected in this study demonstrated that field sample collection did not show evidence of gross contamination. Study results were not censored because of detections in field blanks, because the exceedance was close to NWQL detec-tion limits. Replicate sample concentrations were found to be within 5 percent of concentrations in the corresponding environmental samples.

Velocity and Discharge 9
Velocity and DischargeA summary of average channel velocity and discharge
measured in a cross section of the Trenton Channel at the Trenton Channel station is provided (table 1). Example plots of depth-average velocity vectors and cross-sectional velocity distribution with vectors that show transverse velocity patterns are shown in figures 4 and 5. ADCP velocity measurements ranged from 20–100 centimeter per second (cm/s) as depicted by VMT (fig. 5).
The discharge measured at Trenton Channel for this study ranged from 1,200 to 1,450 m3/sec (table 1). Average channel velocities ranged from 0.515 to 0.640 m/sec (table 1). Flow velocities throughout the sampling campaign varied little with no seasonal pattern evident; some of highest discharge values of 1,450 m3/sec and 1,440 m3/sec were measured during the winter (December 17, 2014, and March 18, 2015, respectively). Some of the lowest discharge values of 1,210 m3/sec and 1,260 m3/sec were measured in fall mid-winter (October 21, 2015, and January 18, 2015, respectively).
Figure 4 shows depth-averaged velocity vectors measured on November 18, 2015, displayed in plan view (shown with the western edge of the river on the left). The velocity vectors were superimposed onto a georeferenced tagged image file format, or GeoTIFF, plan-view image of the Trenton Channel. Plots for measurements made on the other dates looked similar to fig-ure 4. The length and color of the vectors are indicative of the velocity magnitudes. It should be noted that the measurement cross section did not extend across the entire channel because of the presence of docks on the east bank, and so velocities were not measured throughout the entire cross section. Even so, discharge was computed by estimating the discharge in the unmeasured area using a ratio-interpolation method based on velocities and depths in the measured portion of the channel
Table 1. Average channel velocity and discharge at U.S. Geological Survey station 041686401 Trenton Channel of Detroit River at Grosse Ile, Michigan, from November 2014 to November 2015.
[m/sec, meter per second; m3/sec, cubic meter per second]
DateAverage channel velocity (m/sec)
Trenton Channel discharge (m3/sec)
December 17, 2014 0.631 1,450March 18, 2015 0.640 1,440April 9, 2015 0.548 1,390 May 4, 2015 0.564 1,340May 29, 2015 0.585 1,330August 12, 2015 0.579 1,420 August 26, 2015 0.582 1,420September 1, 2015 0.554 1,330September 23, 2015 0.557 1,350September 30, 2015 0.600 1,450October 21, 2015 0.515 1,210November 18, 2015 0.542 1,260
and measurements of distance from the bank (Fulford and Sauer, 1986). Depth-averaged velocity vectors were fairly uniform in magnitude and direction along most of the cross section; however, a few sections had noticeably higher average velocity. Depth-averaged velocities in those sections ranged from approximately 85 to 108 centimeters per second (cm/s) as compared to the rest of the cross section where depth-aver-aged velocities typically ranged from about 45 to 65 cm/s.
VMT was used to plot streamwise velocities (that is, velocities perpendicular to the transect) obtained from ADCP data collected at the Trenton Channel station. The different colors indicate the streamwise velocities throughout the cross section of the Trenton Channel (fig. 5). The black arrows in figure 5 represent the magnitudes and directions of com-ponents of velocity vectors in the plane of the cross section referred to as secondary flow. Secondary flow is orientated perpendicular to the streamwise flow and plays an important role in sediment routing and mixing of flow (Lane and others, 2000). The bold white line represents the bottom bathymetry of the cross section corresponding to the bed of the channel. Discrete sampling locations are shown to illustrate their depths and position within the cross section. Like figure 4, the stream-wise velocity map shown in figure 5 was developed from data collected on November 18, 2015.
This section of the Trenton Channel shares characteris-tic of alluvial rivers for two reasons: (1) subcritical flow can be seen near the edges of the transect and near the bed of the channel, and (2) the highest flows are at surface throughout the cross section of the river (Magirl and others, 2009). The plan and streamwise figures have many traits in common. Sections of higher than average velocities can be seen in both types of figures. One particular high-velocity section, located approxi-mately 200 m from left bank plus or minus 10 m, stands out in both plan and streamwise view maps. This particular sec-tion of river had the highest velocities, accounting for about 25 percent of the flow. Secondary flow vectors suggest the presence of counter-rotating helical flow cells. These helical flow cells could affect the mixing of constituents in transport by preventing cross-channel mixing.
Bathymetry displayed in velocity maps show a depth range of about 4.75 m to 8.75 m in the cross section. About 50 percent of the cross section (east side) had an approxi-mate depth of 8 m and the remaining portion (west side) was approximately 6 m in depth. Transverse velocity maps can also be used to help define an appropriate sampling method for this section of the Trenton Channel based on velocity distribution and presence of secondary flow. If the depth and velocities are highly variable along the cross section, an equal-discharge-increment (EDI) sampling method is necessary because the EDI method uses varying transit rates to accommodate for varying of depths and velocities. If the flow and depths are uniform throughout the cross section, then an Equal Width Increment sample is appropriate (U.S. Geological Survey, 2006). Based on the variability of the depth and velocities on the Trenton Channel, an EDI sampling method is most appro-priate for future sampling.

10 Spatial Distribution of Concentrations and Loads Using Different Sampling Methods, Trenton Channel, Michigan
42°07’38”
83°10’39”
42°07’36”
83°10’35”
42°07’34”
42°07’33”
42°07’31”
83°10’30” 83°10’26” 83°10’22” 83°10’17” 83°10’13” 83°10’09”100
90
80
70
60
50
40
Dept
h-av
erag
ed v
eloc
ities
, in
cent
imet
ers
per s
econ
d
EXPLANATION
Multiple-vertical depth-integrated location
Discrete location
Fixed-point location
Velocity measurement—Arrow head indicatesdirection of flow based on true north. Size of arrow indicates the relative velocity magnitude. Arrow color indicates actual velocity magintude.
150
400200
0 75
0 FEET
METERSMap image is the intellectual property of Esri and is used herein under license. Copyright © 2019 Esri and its licensors. All rights reserved.Universal Transverse Mercator, projection zone 17North American Datum 1983
Figure 4. Plan view velocity map of ADCP data at a range of 40–100 centimers per second displayed by using the Velocity Mapping Toolbox (VMT) and a geospatial reference background at U.S. Geological Survey station 041686401 Trenton Channel of Detroit River at Grosse Ile, Michigan, November 18, 2015.

Velocity and Discharge 11
Blan
king
zone
Blan
king
zone
Refe
renc
e ve
ctor
sho
win
g30
cen
timet
ers
per s
econ
dve
ctor
mag
nitu
de
050
100
150
200
250
300
0 1 7 82 3 4 5 6
Dist
ance
from
wes
t ban
k, in
met
ers
Depth, in meters below water surface
Wes
t ban
kEa
st b
ank
100
80 60 40 20
Velocity, in centimeters per second
EXPL
AN
ATIO
N
Dis
cret
e sa
mpl
ing
loca
tion
Bed
of c
hann
el
Wat
er v
eloc
ity, p
aral
lel a
nd v
ertic
alto
tran
sect
dir
ectio
n—Ar
row
hea
din
dica
tes
dire
ctio
n of
flow
. Size
of a
rrow
indi
cate
s ve
loci
ty, i
nce
ntim
eter
s pe
r sec
ond
Bla
nkin
g zo
ne—
Size
of a
rrow
indi
cate
sar
ea o
f no
mea
sure
men
t due
to s
ide
lobe
inte
rfere
nce
or d
epth
of A
DCP
Figu
re 5
. Re
latio
n be
twee
n st
ream
wis
e ve
loci
ty a
nd s
econ
dary
flow
at U
.S. G
eolo
gica
l Sur
vey
stat
ion
0416
8640
1 Tr
ento
n Ch
anne
l of D
etro
it Ri
ver a
t Gro
sse
Ile, M
ichi
gan,
Nov
embe
r 18,
201
5.

12 Spatial Distribution of Concentrations and Loads Using Different Sampling Methods, Trenton Channel, Michigan
Concentrations and Loads of Nutrients, Chloride, and Suspended Sediment
A summary of nutrients, chloride, suspended-sediment, and physical-property concentrations measured at the Trenton Channel cross section at various distances from the west bank is provided (tables 2 and 3). Statistical differences in the ana-lytical results for nutrients (total phosphorus, orthophosphate, total nitrogen, and ammonia), chloride, and suspended sedi-ment measured with MVDI, fixed-point, and discrete sample methods are also assessed in this section. The relation between concentrations of nutrients, chloride, and suspended sedi-ment measured by using the MVDI and fixed-point sampling methods is determined by linear regression. Tile graphs and boxplots are used to depict the spatial distribution of constitu-ent concentrations within the cross section. Estimates of the loads of nutrients, chloride, and suspended-sediment conveyed through the Trenton Channel are also provided.
Constituent Concentrations Measured in Paired MVDI and Fixed-point Samples
Differences in constituent concentrations obtained from paired MVDI and fixed-point samples were evaluated by using the Wilcoxon signed-rank test (Helsel and Hirsch, 2002). The Wilcoxon signed-rank test was applied to the data because this test is not sensitive to the distributions of the data. The null hypothesis is that the median difference between the paired observations is zero. The Wilcoxon signed-rank test is used to evaluate for a statistically significant difference between two datasets based on the probability of rejecting the null hypoth-esis when it is true (referred to as the alpha value). An alpha value of 0.05 was used for tests of significance; if the prob-ability value (p-value) is less than or equal to the alpha value, the difference is considered statistically significant and the null hypothesis is rejected (Helsel and Hirsch, 2002). The null hypothesis was rejected for total phosphorus, total nitrogen, ammonia, and chloride, but not for suspended sediment or orthophosphate (table 4). In this case, rejection of the null hypothesis implies that concentrations in the MVDI samples tended to be significantly larger or smaller than those in the corresponding fixed-point samples. The most representative type of future sampling would include a combination of these two methods or a method that is more representative of the sample area considering the statistically significant difference observed in median values for total phosphorus, total nitrogen, ammonia, and chloride.
Liner regression analysis was used to determine the relation between constituent concentrations measured by using MVDI and fixed-point sampling methods. Correlations
between methods and constituents have been fitted with a black 1:1 line and a red best-fit line. Sample size (n) and coef-ficient of determination (R2) summary statistic information is provided for each regression equation (fig. 6).
Linear regressions produced from the comparison of MVDI and fixed-point methods represent the relation between the concentrations measured by the two methods. The 1:1 line represents line of agreement between the two methods. An overall pattern of higher constituent concentrations measured using the MVDI method compared to the constituent concen-tration measured using the fixed-point samples is evident in the regression analyses. Suspended sediment shows a pattern of sporadic distribution of points around the 1:1 line with few high MVDI concentrations. Higher concentrations from MVDI samples in relation to fixed-point samples likely repre-sent the heterogeneity of constituent distributions in the Tren-ton Channel. MVDI samples consist of a composite of equal sections of the channel. Therefore, MVDI samples represent a much larger portion of the channel and flow in comparison to fixed-point samples. Higher MVDI concentrations than fixed-point samples also indicate a distribution of higher constituent concentrations west of the fixed-point sampling location in Trenton Channel. Constituents such as chloride, phosphorus, and orthophosphate show a strong correlation (R2 values greater than 0.70) and represent a consistently higher concen-tration from the MVDI sampling method per those constitu-ents. Correlations between these three particular constituents could provide a relation between the MVDI and fixed-point methods, providing data for future sampling method applica-tions in Trenton Channel.
A simple linear regression equation was produced for each major constituent measured in samples obtained from the Trenton Channel during the sampling campaign (table 5). These simple linear regressions can be used to estimate instan-taneous concentrations, daily loads, or annual loads in Trenton Channel. All linear models were produced in R Program-ming language (R Core Team, 2018). Residual standard error, adjusted-R2, and p-values were developed to assess the fit of each regression equation to the major constituent concentra-tions. For each major constituent, the fit of the regression equation was statistically significant. Regression equations are expressed as:
yi = b + mxi (1)
where yi is the i th observation of the response
(dependent) variable (concentration); xi is the independent variable (observed
fixed-point sample); m is the slope; and b is the intercept.

Concentrations and Loads of Nutrients, Chloride, and Suspended Sediment 13Ta
ble
2.
Sum
mar
y st
atis
tics
for c
onst
ituen
ts m
easu
red
in w
ater
-qua
lity
sam
ples
col
lect
ed b
y m
ultip
le-v
ertic
al d
epth
-inte
grat
ed (M
VDI),
fixe
d-po
int,
and
disc
rete
sam
plin
g m
etho
ds a
t U.S
. Geo
logi
cal S
urve
y st
atio
n 04
1686
401
Tren
ton
Chan
nel o
f Det
roit
Rive
r at G
ross
e Ile
, Mic
higa
n, N
ovem
ber 2
014
to N
ovem
ber 2
015.
[mg/
L, m
illig
ram
per
lite
r; P,
pho
spho
rous
; N, n
itrog
en; n
, num
ber o
f sam
ples
col
lect
ed fr
om N
ovem
ber 2
014
to N
ovem
ber 2
015;
Min
., m
inim
um; M
ax.,
max
imum
; Avg
., av
erag
e; m
, met
er]
Sam
ple
type
an
d di
stan
ce
from
ban
k
Tota
l pho
spho
rus
(m
g/L
as P
)O
rtho
phos
phat
e
(mg/
L as
P)
Tota
l nitr
ogen
(m
g/L
as N
)A
mm
onia
(m
g/L
as N
)Ch
lori
de
(mg/
L)Su
spen
ded
sedi
men
t (m
g/L)
nM
in.
Max
.Av
g.M
in.
Max
.Av
g.M
in.
Max
.Av
g.M
in.
Max
.Av
g.M
in.
Max
.Av
g.M
in.
Max
.Av
g.
MV
DI–
va
rious
di
stan
ces
from
wes
t ba
nk
0.01
0.03
20.
017
0.00
40.
011
0.00
50.
520.
820.
640.
120.
260.
1810
.631
.815
.11
27
812
Fixe
d-po
int–
ab
out 2
0 m
fr
om e
ast
bank
0.09
0.02
60.
014
0.00
40.
006
0.00
40.
460.
710.
570.
080.
200.
139.
525
.513
.22
176
12
Dis
cret
e–
10 m
from
w
est b
ank
0.01
0.03
70.
026
0.00
40.
007
0.00
60.
620.
900.
770.
150.
270.
2316
.038
.722
.22
218
12
Dis
cret
e–
60 m
from
w
est b
ank
0.01
0.04
90.
024
0.00
40.
011
0.00
70.
590.
880.
730.
140.
290.
2314
.638
.020
.71
318
26
Dis
cret
e–
170
m fr
om
wes
t ban
k0.
010.
035
0.02
00.
004
0.01
10.
006
0.50
00.
810.
666
0.12
00.
240.
189
10.6
0034
.217
.814
222
8.53
28
Dis
cret
e–
280
m fr
om
wes
t ban
k0.
010.
035
0.01
80.
004
0.00
90.
006
0.47
00.
900.
618
0.10
00.
200.
151
10.4
0030
.616
.164
220
7.75
28

14 Spatial Distribution of Concentrations and Loads Using Different Sampling Methods, Trenton Channel, Michigan
Table 3. Summary statistics for physical properties measured in water-quality samples collected by multiple-vertical depth-integrated (MVDI), fixed-point, and discrete sampling methods at U.S. Geological Survey station 041686401 Trenton Channel of Detroit River at Grosse Ile, Michigan, November 2014 to November 2015.
[°C, degrees Celsius; µS/cm, microsiemen per centimeter at 25°C; mg/L, milligram per liter; n; number of samples; Min., minimum; Max., maximum; Avg., average; m, meter]
Sample type and distance
from bank (fig. 2)
Water temperature (°C)
Specific conductance (µS/cm)
pH (standard units)
Dissolved oxygen (mg/L) n
Min. Max. Avg. Min. Max. Avg. Min. Max. Avg. Min. Max. Avg.
MVDI– various distances from west bank
1.40 22.9 13.68 228.00 322 249.50 7.90 8.5 8.09 8.00 16.3 10.91 12
Fixed-point– about 20 from east bank
1.00 22.7 13.55 226.00 294 243.08 7.80 8.5 8.09 8.00 16.1 10.90 12
Discrete– 10 m from west bank
1.90 21.7 12.38 255.00 347 281.42 7.80 8.2 7.91 7.20 14.4 10.88 12
Discrete– 60 m from west bank
1.30 21.7 12.50 252.00 336 270.92 7.80 8.2 7.93 7.70 14.3 11.18 26
Discrete– 170 m from west bank
1.40 21.5 12.16 228.00 325 260.25 7.90 8.4 8.06 8.00 14.2 11.35 28
Discrete– 280 m from west bank
1.30 21.5 11.94 225.00 310 253.19 7.90 8.4 8.12 8.00 14.5 11.49 8
Table 4. Wilcoxon signed-rank test of differences in median concentrations for samples collected by use of multple-vertical depth-integrated (MVDI) and fixed-point methods at U.S. Geological Survey station 041686401 Trenton Channel of Detroit River at Grosse Ile, Michigan.
[p-value, probability value, bold values are significant (p-value ≤ 0.05); mg/L, milligram per liter; ≤, less than or equal to]
ConstituentMVDI versus fixed-point
p-valueMedian difference
(mg/L)
Phosphorus 0.020 0.001Suspended sediment 0.355 0.5Orthophosphate 0.056 0Total nitrogen 0.004 0.095Ammonia 0.008 0.05Chloride 0.025 1.3
Concentrations and Loads of Nutrients, Chloride, and Suspended Sediment 15
Mul
tiple
-ver
tical
dep
th-in
tegr
ate
sam
ple
conc
entra
tion,
in m
illig
ram
s pe
r lite
r
Fixed-point sample concentration, in milligrams per liter
A. Phosphorus
R2 = 0.7339n = 12
0.010
0.005
0.015
0.020
0.030
0.035
0.025
0.0100.005 0.015 0.020 0.025 0.030
B. Suspended sediment
R2 = 0.5757n = 12
0
5
10
15
20
25
30
0 5 10 15 20 25
F. Total nitrogen
R2 = 0.6627n = 12
0.45
0.50
0.55
0.60
0.65
0.70
0.75
0.80
0.85
0.45 0.50 0.55 0.60 0.65 0.70 0.75 0.80
E. Ammonia
R2 = 0.4298n = 12
0.10
0.15
0.20
0.30
0.25
0.100.05 0.15 0.20 0.25
C. Orthophosphate
R2 = 0.8896n = 120.004
0.003
0.005
0.006
0.007
0.008
0.009
0.010
0.011
0.012
0.004 0.0050.003 0.006 0.007
D. Chloride
R2 = 0.8998n = 12
10
15
20
25
30
35
105 15 20 25 30
EXPLANATION
Best-fit regression equation (see table 5)
1:1 line
Figure 6. Relations between multiple-vertical depth-integrate (MVDI) and fixed-point samples for selected constituent concentrations in milligrams per liter at U.S. Geological Survey station 041686401 Trenton Channel of Detroit River at Grosse Ile, Michigan, November 2014 to November 2015. (R2, coefficient of determination; n, sample size)

16 Spatial Distribution of Concentrations and Loads Using Different Sampling Methods, Trenton Channel, Michigan
Table 5. Simple linear regression equations for all major constituents collected at U.S. Geological Survey station 041686401 Trenton Channel of Detroit River at Grosse Ile, Michigan, November 2014 to November 2015.
[R2, coefficient of determination; p-value, probability value, bold values are significant (p-value ≤ 0.05); n, number of observations; ≤, less than or equal to]
ConstituentRegression
equationResidual
standard errorAdjusted-R2 p-value n
Phosphorus yi = −0.00043 + 1.2165xi 0.003628 0.7339 2.284 × 10⁻⁴ 12
Suspended sediment yi = −0.7215 + 1.4177xi 4.909 0.5757 2.556 × 10⁻³ 12
Orthophosphate yi = −0.00833 + 3.1764xi 0.0006917 0.8896 2.619 × 10⁻⁶ 12
Chloride yi = −2.128 + 1.3003xi 2.08 0.8998 1.604 × 10⁻⁶ 12
Ammonia yi = 0.06924 + 0.9579xi 0.03465 0.4298 1.228 × 10⁻² 12
Total nitrogen yi = 0.0964 + 0.9579xi 0.05245 0.6627 7.745 × 10⁻⁴ 12
Chemical Constituent Distribution Discrete samples were collected at 1-m intervals at profile
locations 10 m, 60 m, 170 m, and 280 m from the west bank to help describe the distribution of nutrients, chloride, and suspended sediment at the Trenton Channel station. R pack-ages were used to create tile graphs of constituent concentra-tions throughout the horizontal and vertical planes sampled in Trenton Channel (Wickham, 2009). The tile graphs display color-scale tiles representing observed discrete constituent concentrations (fig. 7). ADCP channel depth data are graphed in a solid black line and extrapolated depths estimated from initial site investigation are graphed in dashed black lines. Graphs display data collected on March 18, 2015.
Tile graphs are displayed for all major constituents collected and represent constituent concentrations collected at each discrete sample location. Although concentrations varied between sampling dates, there are some patterns in the distribution of concentrations that were typical. Constituent concentrations where generally highest near the west bank of the channel. All constituents except suspended sediment display a distribution of higher concentrations near the west bank than the east bank and in some cases, concentrations near the west bank are three times as high (phosphorus). Chloride is considered a conservative ion: when ionized in the environment it stays in that particular ionic state and is rarely affected by sediment and other particles. Because chloride is a conservative ion, it is a good indicator of point sources of chemicals (Mullaney and others, 2009). The distribution of higher concentrations (especially chloride) near the west bank could indicate a source influence upstream on the Michigan side of the channel, but more data would need to be collected throughout the channel to make any determination. Tile graphs also show the distribution of concentrations vertically through the water column. There is less than 10 percent vertical variation of constituent concentrations and in some cases less than a 5 percent difference vertically among concentrations (orthophosphate, ammonia, and chloride). The concentration of suspended sediment had no consistent pattern of vertical or horizontal distribution across sampling dates.
In general, the tile graphs show horizontal heterogene-ity and vertical homogeneity. A distribution of higher con-centrations to the west side of the channel is present for all major constituents except suspended sediment. This hori-zontal distribution could be the result of a source influence upstream near the west side of the channel. Discrete samples show little change in concentrations vertically throughout the transect of Trenton Channel for all major constituents. Patterns in horizontal and vertical distribution can provide insight for the application of future sampling methods in this part of the Trenton Channel, potentially focusing sam-pling efforts to capture the unique horizontal distribution of constituent concentrations.
Boxplot summaries of constituent concentrations col-lected throughout the sampling campaign using the MVDI method are displayed in figures 7 and 8. Median constituent concentrations are shown by a bold line in the middle of the boxplot, the upper 75th percentile is represented by the top of the boxes, and the lower 25th percentile by the bottom of the box. Vertical lines located above the box represent samples within the 90th percentile. Vertical lines located below the box represent samples within the 10th percentile. Numbers of sample values indicated at the top of each boxplot represent sample sizes. Constituent concentrations are color-coded by date for reference. Constituents summarized in figures 7 and 8 include phosphorus, suspended sediment, orthophosphate, total nitrogen, ammonia, and chloride.
Discrete sampling results are depicted with boxplot graphs for each constituent (fig. 8). All constituents showed that samples collected at the 280 m transect had the lowest median concentrations, except suspended sediment. Sus-pended sediment did not exhibit the same pattern as other constituents, and suspended-sediment mean concentrations did not vary much throughout the transect. The 280 m sample generally represents water quality from the eastern and upper most parts of the channel, and the locality of the 10 m samples generally represent the western most part of the Trenton Chan-nel. The highest average constituent concentrations at the 10 m location and the lowest concentrations at the 280 m location is evidence the highest constituent concentrations are near

Concentrations and Loads of Nutrients, Chloride, and Suspended Sediment 17A
. Pho
spho
rus
010
020
030
0
Dist
ance
from
wes
t ban
k, in
met
ers
20 4 6 8
Discrete sampling depth, in metersEX
PLA
NAT
ION
0.02
0
0.02
5
0.03
0
0.03
5
Conc
entr
atio
n,
in m
illig
ram
s pe
r lite
r
Bed
of c
hann
el
0.02
1
0.03
60.
027
0.02
6
0.02
5
0.02
5
0.02
4
0.02
6
0.02
9
0.02
1
0.01
9
0.02
1
0.02
1
0.02
1
0.02
1
0.02
2
0.01
7
0.01
8
0.01
9
0.01
7
0.01
8
0.01
8
0.01
9
0.01
6
B. S
uspe
nded
sed
imen
t
010
020
030
0
Dist
ance
from
wes
t ban
k, in
met
ers
20 4 6 8
Discrete sampling depth, in meters
EXPL
AN
ATIO
N
510
Conc
entr
atio
n,
in m
illig
ram
s pe
r lite
r
Bed
of c
hann
el
3 4 4 4 6 4
2 3 5 5 5 5 5
14 4 3 3 5 4 4
5
4 7 2
C. O
rthp
hosp
hate
0.00
7
0.00
7
0.00
7
0.00
7
0.00
6
0.00
6
0.00
6
0.00
6
0.00
6
0.00
5
0.00
6
0.00
7
0.00
7
0.00
5
0.00
5
0.00
6
0.00
5
0.00
6
0.00
6
0.00
6
0.00
4
0.00
4
0.00
40.
004
EXPL
AN
ATIO
N
0.00
4
0.00
5
0.00
6
0.00
7
Conc
entr
atio
n,
in m
illig
ram
s pe
r lite
r
Bed
of c
hann
el0
100
200
300
Dist
ance
from
wes
t ban
k, in
met
ers
20 4 6 8
Discrete sampling depth, in meters
D. C
hlor
ide
010
020
030
0Di
stan
ce fr
om w
est b
ank,
in m
eter
s
20 4 6 8
Discrete sampling depth, in meters
37.6
37.7
38 37.8
37.5
37.2
34 34.1
34 34 34.2
34.1
34.1
30.4
30.4
30.4
30.3
30.6
30.3
30.3
25.5
38.7
38.5
38
EXPL
AN
ATIO
N
3035
Conc
entr
atio
n,
in m
illig
ram
s pe
r lite
r
Bed
of c
hann
el
E. A
mm
onia
0.27
0.27
0.29
0.29
0.29
0.28
0.19
0.19 0.2
0.18 0.2
0.2
0.21
0.17
0.17
0.17
0.17
0.17
0.17
0.18
0.18
0.27
0.27
0.27
EXPL
AN
ATIO
N
0.17
5
0.20
0
0.22
5
0.25
0
0.27
5
Conc
entr
atio
n,
in m
illig
ram
s pe
r lite
r
Bed
of c
hann
el0
100
200
300
Dist
ance
from
wes
t ban
k, in
met
ers
20 4 6 8
Discrete sampling depth, in meters
F. To
tal n
itrog
en
010
020
030
0Di
stan
ce fr
om w
est b
ank,
in m
eter
s
20 4 6 8
Discrete sampling depth, in meters
0.81
0.83
0.88
0.81
0.88
0.87
0.75
0.71
0.75
0.71
0.72
0.76
0.74
0.73
0.71
0.77 0.7
0.71
0.71
0.71
0.67
0.88 0.9
0.87
EXPL
AN
ATIO
N
0.70
0.75
0.80
0.85
0.90
Conc
entr
atio
n,
in m
illig
ram
s pe
r lite
r
Bed
of c
hann
el
Figu
re 7
. Di
scre
te c
onst
ituen
t con
cent
ratio
ns m
easu
red
at U
.S. G
eolo
gica
l Sur
vey
stat
ion
0416
8640
1 Tr
ento
n Ch
anne
l of D
etro
it Ri
ver a
t Gro
sse
Ile, M
ichi
gan,
Mar
ch 1
8,
2015
.

18 Spatial Distribution of Concentrations and Loads Using Different Sampling Methods, Trenton Channel, Michigan
Concentration of discrete depth samples, in milligrams per liter
Dist
ance
from
wes
t ban
k, in
met
ers
Dat
e Mar
ch 1
8, 2
015
May
29,
201
5
Aug
ust 2
6, 2
015
Nov
embe
r 18,
201
5
90th
per
cent
ile
75th
per
cent
ile
Med
ian
10th
per
cent
ile
25th
per
cent
ile
Num
ber o
f val
ues
12
EXPL
AN
ATIO
N
A. P
hosp
horu
s
1060
170
280
0.01 0
0.02
0.03
0.04
0.05
0.06
1226
2828
B. S
uspe
nded
sed
imen
t
1060
170
280
01020304012
2628
28
C. O
rtho
phos
phat
e
1060
170
280
0.00
4
0.00
2
0.00
6
0.00
8
0.01
0
0.01
212
2628
28
F. To
tal n
itrog
en
1060
170
280
0.5
0.4
0.6
0.7
0.8
0.9
1.0
1226
2828
E. A
mm
onia
1060
170
280
0.10
0.05
0.15
0.20
0.25
0.30
1226
2828
D. C
hlor
ide
1060
170
280
1020304012
2628
28
Figu
re 8
. Se
lect
ed c
onst
ituen
t con
cent
ratio
ns b
ased
on
horiz
onta
l loc
atio
n or
type
of s
ampl
e at
U.S
. Geo
logi
cal S
urve
y st
atio
n 04
1686
401
Tren
ton
Chan
nel o
f Det
roit
Rive
r at G
ross
Ile,
Mic
higa
n, N
ovem
ber 2
014
to N
ovem
ber 2
015.
Ver
tical
-tran
sect
dis
tanc
es in
met
ers
from
the
wes
t ban
k.

Concentrations and Loads of Nutrients, Chloride, and Suspended Sediment 19
the west side of the channel. Higher-than-average concentra-tions of nutrients, chloride, and suspended sediment at the 10 m sampling location could be because of source influence upstream in the tributary, but without more data this cannot be confirmed. The distribution of constituent concentrations within the sampling period is indicative of lower concentra-tions for all constituents in the summer through fall period (May through October) and higher concentrations in the winter through spring period (November through April). More data (a longer sampling period) would need to be collected to confirm the seasonal distribution of constituents. Spikes of chloride concentrations around the March 28, 2015, sample date may represent road salting in the winter months. Road salting has increased since 1950 for deicing roads, parking lots, and other impervious sources (Mullaney and others, 2009). Road salt can directly increase the concentrations of chloride in surface water from runoff.
Boxplot summaries displaying the horizontal distribution of constituents in this section of Trenton Channel can help to provide appropriate and representative methods for categoriz-ing major nutrient, chloride, and suspended-sediment con-centrations based on scope and purpose of analysis. Sample results obtained throughout the study were grouped by vertical discrete transect locations then summarized using boxplots (fig. 9). Boxplots of vertical discrete samples were developed for each constituent sampled. The boxplots display generally consistent vertical distribution of average concentrations for all constituents for each sampling date. The consistent con-stituent concentrations vertically indicate mixing and homoge-neity throughout the water column. Differences in concentra-tions throughout the sampling period follow a distinct pattern of vertical symmetry; distribution of concentrations vertically by sample date is apparent for almost all major constituents. Higher concentrations are typical in the winter through spring and lower concentrations are typical in the summer through fall; this same pattern is seen at every discrete location throughout the water column. Homogeneity throughout the water column provides evidence for diversification of samples horizontally instead of vertically to capture the distribution of constituent concentrations more efficiently in the future.
The horizontal boxplots (fig. 8) show constituent concen-trations tended to be highest near the west side of the channel and lowest near the east side of the channel. There was no con-sistent pattern of concentration varying by depth in the water column; vertical homogeneity was evident (fig. 9). Higher-than-average constituent concentrations were observed in the winter through spring and lower-than-average concentrations were observed in the summer through fall. Documented dif-ferences in constituent concentrations horizontally indicates a sampling method which captures horizontal differences in water quality would likely be most effective for determining the water chemistry of the Trenton Channel at this location. Cross sectional methods like EDI or Equal Width Increment would likely be most effective for capturing horizontal distri-bution of constituent concentrations in the southern part of the Trenton Channel.
Constituent LoadsAn estimated daily constituent load was calculated
using all major constituent concertation values from MVDI and fixed-point methods, as well as discharge values from ADCP data collected on all 12 sampling dates. Daily loads in kilograms per day were aggregated by summing instantaneous loads throughout the course of a day. Instantaneous loads were calculated using equation 2.
TCLi = TCi × Qi × C (2)
where TCLi is daily constituent load, in kilograms per
day; TCi is instantaneous constituent concentration,
in milligrams per liter; Qi is instantaneous discharge, in cubic meters
per second; and C is the constant 86.4 to convert units of load
to kilograms per day.
Table 6 lists estimated constituent loads based on MVDI and fixed-point concentrations and measured discharges. All concentrations obtained from MVDI and fixed-point sampling techniques were above the laboratory minimum reporting levels and thus represent a quantifiable value reported by the NWQL.
Phosphorus load calculations in Trenton Channel were further analyzed because of its contribution and relation to eutrophication in Lake Erie (Ohio EPA, 2013). Phosphorus loads calculated using the MVDI method produced higher loads in comparison to fixed-point methods on all sampling dates except one (fig. 10). This pattern of higher MVDI esti-mated loads is likely the result of the difference in sampling approach between MVDI and fixed-point methods. The MVDI method incorporates transects from the entire chan-nel and represents more channel area than the fixed-point method. Compared to the fixed-point method, the MVDI method is able to better represent the overall phosphorus concentration by incorporating the gradients in phosphorus concentration found in the channel (fig. 9), which results in a higher and more representable phosphorus load. Phosphorus loads obtained from both the MVDI and fixed-point methods are closely related to streamflow patterns because of a direct relation between streamflow and load. During the sampling interval, phosphorus loads tended to be lower during the summer months than the winter months, likely because of the high concentrations observed during these times (fig. 10). Overall, we can conclude from these data that fixed-point sampling produces results that are biased low for most of the sampling period.

20 Spatial Distribution of Concentrations and Loads Using Different Sampling Methods, Trenton Channel, Michigan
Conc
entra
tion,
in m
illig
ram
s pe
r lite
r
Discrete sampling depth, in metersA
. Pho
spho
rus
0.01
00.
020.
030.
040.
050.
06
765432116 20 12 12 12 12 10
B. S
uspe
nded
sed
imen
t
010
2030
40
16 20 12 12 12 12 10
C. O
rtho
phos
phat
e
0.00
40.
002
0.00
60.
008
0.01
00.
012
0.01
4
16 20 12 12 12 12 10
F. T
otal
nitr
ogen
7654321
0.5
0.4
0.6
0.7
0.8
0.9
1.0
16 20 12 12 12 12 10
E. A
mm
onia
0.10
0.05
0.15
0.20
0.25
0.30
0.35
16 20 12 12 12 12 10
D. C
hlor
ide 10
020
3040
50
16 20 12 12 12 12 10
Dat
e Mar
ch 1
8, 2
015
May
29,
201
5
Aug
ust 2
6, 2
015
Nov
embe
r 18,
201
5
90th
per
cent
ile
75th
per
cent
ile
Med
ian
10th
per
cent
ile
25th
per
cent
ile
Num
ber o
f val
ues
1212
EXPL
AN
ATIO
N
Figu
re 9
. Se
lect
ed c
onst
ituen
t con
cent
ratio
ns b
ased
on
verti
cal l
ocat
ion
at U
.S. G
eolo
gica
l Sur
vey
stat
ion
0416
8640
1 Tr
ento
n Ch
anne
l of D
etro
it Ri
ver a
t Gro
sse
Ile, M
ichi
gan,
N
ovem
ber 2
014
to N
ovem
ber 2
015.
Dis
cret
e sa
mpl
es w
ere
colle
cted
at v
ertic
al d
epth
s of
1, 2
, 3, 4
, 5, 6
, and
7 m
eter
s (m
).

Concentrations and Loads of Nutrients, Chloride, and Suspended Sediment 21Ta
ble
6.
Cons
titue
nt lo
ad e
stim
ates
from
mul
tiple
-ver
tical
dep
th-in
tegr
ated
and
fixe
d-po
int s
ampl
ing
met
hods
at U
.S. G
eolo
gica
l Sur
vey
stat
ion
0416
8640
1 Tr
ento
n Ch
anne
l of
Detro
it Ri
ver a
t Gro
sse
Ile, M
ichi
gan,
Nov
embe
r 201
4 to
Nov
embe
r 201
5.
[m3 /s
ec, c
ubic
met
ers p
er se
cond
; kg/
day,
kilo
gram
per
day
]
Dat
eD
isch
arge
(m
3 /sec
)
Mul
tiple
-ver
tical
dep
th-i
nteg
rate
d sa
mpl
ing
Fixe
d-po
int s
ampl
ing
Tota
l ph
osph
orus
(k
g/da
y)
Susp
ende
d se
dim
ent
(kg/
day)
Ort
hoph
os-
phat
e
(kg/
day)
Tota
l ni
trog
en
(kg/
day)
Am
mon
ia
(kg/
day)
Chlo
ride
(k
g/da
y)Ph
osph
orus
(k
g/da
y)
Susp
ende
d se
dim
ent
(kg/
day)
Ort
hoph
os-
phat
e
(kg/
day)
Tota
l ni
trog
en
(kg/
day)
Am
mon
ia
(kg/
day)
Chlo
ride
(k
g/da
y)
Dec
embe
r 17,
201
41,
450
1,63
075
1,00
050
183
,900
20,0
001,
590,
000
2,25
075
1,00
050
188
,900
25,0
002,
000,
000
Mar
ch 1
8, 2
015
1,44
02,
740
374,
000
749
102,
000
32,4
003,
970,
000
2,00
062
4,00
049
983
,600
22,5
003,
180,
000
Apr
il 9,
201
51,
380
1,32
071
9,00
047
979
,100
21,6
003,
070,
000
1,08
036
0,00
047
970
,700
18,0
002,
350,
000
May
4, 2
015
1,34
01,
160
116,
000
463
79,8
0022
,000
1,68
0,00
01,
040
463,
000
463
67,1
0013
,900
1,42
0,00
0
May
29,
201
51,
330
1,61
046
0,00
046
073
,500
23,0
001,
490,
000
1,26
034
5,00
046
062
,100
13,8
001,
260,
000
Aug
ust 1
2, 2
015
1,42
01,
720
613,
000
490
67,4
0014
,700
1,51
0,00
01,
590
735,
000
490
58,8
009,
800
1,40
0,00
0
Aug
ust 2
6, 2
015
1,42
01,
470
490,
000
490
63,7
0015
,900
1,40
0,00
01,
350
613,
000
490
56,4
0012
,300
1,24
0,00
0
Sept
embe
r 1, 2
015
1,33
01,
610
804,
000
575
64,4
0014
,900
1,42
0,00
01,
380
230,
000
460
56,3
0010
,300
1,28
0,00
0
Sept
embe
r 23,
201
51,
350
1,51
046
6,00
046
662
,800
16,3
001,
350,
000
1,28
046
6,00
046
661
,700
11,6
001,
190,
000
Sept
embe
r 30,
201
51,
350
2,75
075
0,00
087
576
,200
27,5
001,
460,
000
2,37
062
5,00
062
568
,700
20,0
001,
300,
000
Oct
ober
21,
201
51,
200
2,82
02,
820,
000
522
71,0
0024
,000
1,11
0,00
01,
780
1,15
0,00
041
858
,500
15,7
0099
3,00
0
Nov
embe
r 18,
201
51,
260
3,50
02,
080,
000
1,20
082
,000
24,0
001,
480,
000
2,84
01,
860,
000
656
72,1
0017
,500
1,29
0,00
0
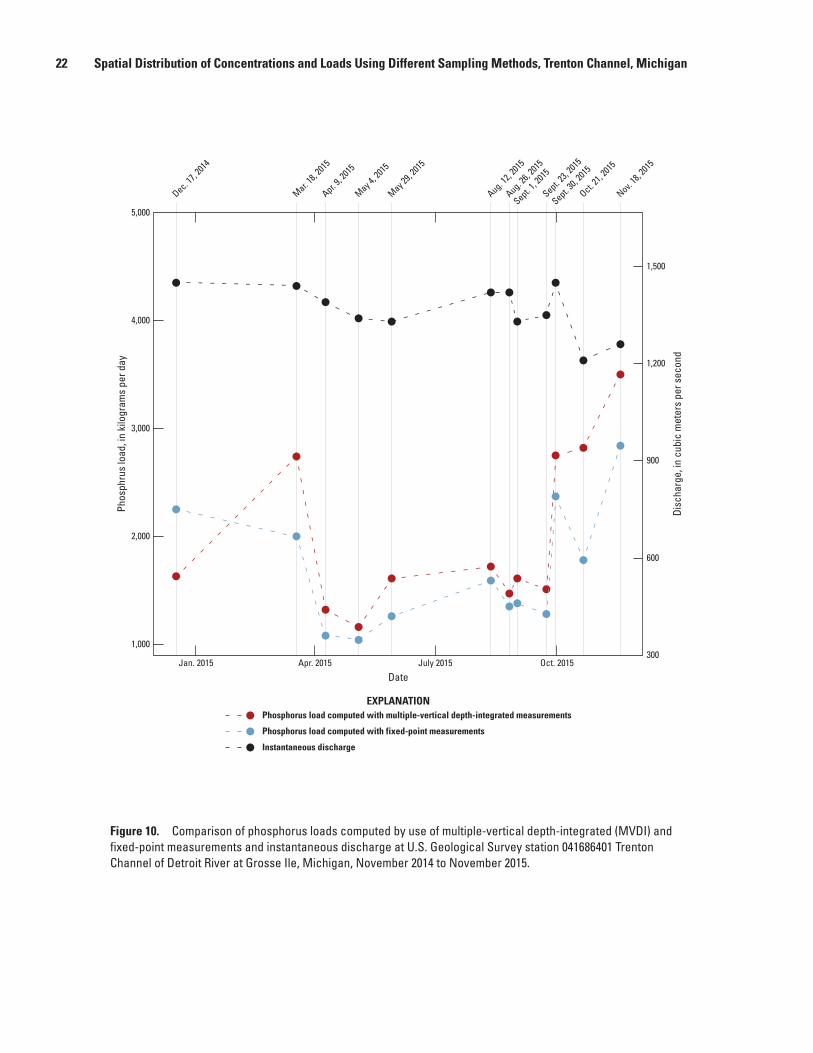
22 Spatial Distribution of Concentrations and Loads Using Different Sampling Methods, Trenton Channel, Michigan
EXPLANATIONPhosphorus load computed with multiple-vertical depth-integrated measurements
Phosphorus load computed with fixed-point measurements
Instantaneous discharge
300
600
900
1,200
1,500
Disc
harg
e, in
cub
ic m
eter
s pe
r sec
ond
Jan. 2015 Apr. 2015 July 2015 Oct. 2015
Date
1,000
2,000
3,000
4,000
5,000
Phos
phru
s lo
ad, i
n ki
logr
ams
per d
ay
Dec. 17,
2014
Mar. 18,
2015
Apr. 9, 2
015
May 4, 2
015
May 29,
2015
Aug. 12,
2015
Aug. 26,
2015
Sept. 1, 2
015
Sept. 23,
2015
Sept. 30,
2015
Oct. 21,
2015
Nov. 18,
2015
Figure 10. Comparison of phosphorus loads computed by use of multiple-vertical depth-integrated (MVDI) and fixed-point measurements and instantaneous discharge at U.S. Geological Survey station 041686401 Trenton Channel of Detroit River at Grosse Ile, Michigan, November 2014 to November 2015.

References 23
SummaryThe Detroit River separates the United States and Canada
as it flows from Lake St. Clair to Lake Erie. The Trenton Channel is a 13-kilometer-long branch of the Detroit River that flows to the west of Grosse Ile before rejoining the Detroit River near the mouth of Lake Erie. The U.S. Environmental Protection Agency has listed both the Trenton Channel and Detroit River as Areas of Concern because of Beneficial Use Impairments such as interrupted drinking-water services, loss of aquatic life, and reduced recreational use. About 22 percent of the Detroit River flows past the western side of Gross Ile through the Trenton Channel. Flow from the Trenton Channel rejoins the Detroit River near its mouth, just before it flows into Lake Erie. The U.S. Geological Survey, in cooperation with the U.S. Environmental Protection Agency and Envi-ronment Canada, investigated concentrations and loads of nutrients (total phosphorus, orthophosphate, total nitrogen, and ammonia), suspended sediment, and flow velocities at U.S. Geological Society station 041686401 Trenton Channel of Detroit River at Grosse Ile, Mich., (Trenton Channel Site) from November 2014 through November 2015. The site was selected to better understand the distribution of constituents and loading that is contributing to eutrophication in Lake Erie. Also, the site was chosen for study to improve future sampling efforts in Trenton Channel. Three water-quality sampling methods—multiple-vertical depth-integrated (MVDI), fixed-point sampling, and discrete sampling—were compared to describe the distribution of nutrients, chloride, and suspended sediment. Also, flow velocity data were collected by acoustic Doppler current profiling (ADCP) throughout this study period to understand the distribution of velocity in the sampled tran-sect of Trenton Channel.
Maps of flow velocities were developed using the Veloc-ity Mapping Toolbox and are displayed in plan and streamwise view near the sampling cross section. Plan view velocity maps display depth averaged velocity in comparison to sampling locations, where higher than average velocities are apparent approximately 200 meters (m) from the west bank of Trenton Channel. Transverse streamwise velocity components as well as secondary flow patterns confirm plan view velocity maps and show the distribution of velocity. Secondary flow vectors suggest the presence of counter-rotating helical flow cells, these cells could contribute to distribution of constituents. Flow depths at the Trenton Channel Sampling Cross Section range from 4.75 to 8.75 m, with an average depth of 6–8 m. Velocity maps provide the velocity and bathymetry throughout the sampled cross section of Trenton Channel.
MVDI, fixed-point, and discrete samples were collected on 12 different days from November 2014 to November 2015. MVDI and fixed-point samples were collected for each sampling event, and four sampling events included a set of discrete samples. All sampling methods tested for selected
nutrients, chloride, and suspended sediment. Both tile and boxplot graphs of constituent concentrations show heteroge-neity horizontally and homogeneity vertically throughout the cross section.
Differences between MVDI and fixed-point sampling results likely arise in part from the unsampled part of the cross section not accounted for in the fixed-point sample. Simple linear-regressions models developed regression equations to estimate MVDI concentrations for future sampling.
Constituent loads were developed using ADCP discharge values and concentrations derived from MVDI and fixed-point methods. Constituent loads closely followed trends in concen-trations collected from both MVDI and fixed-point methods. Phosphorus loads in particular were analyzed and higher loads were seen in the winter months of this study, directly related to higher phosphorus concentrations are evident in both MVDI and fixed-point methods. This relation of phosphorus loads and concentrations directly relates to the influence of concen-trations on phosphorus loads.
In conclusion, this investigative study was intended to provide information to our cooperators regarding the distribu-tion of constituents, velocities, and sampling applications for the Trenton Channel. The importance of continuing future investigations to fully understand the Trenton Channel of the Detroit River is paramount, but the information in this report begins to pave the way for effective management decisions and potential for a healthy water system.
References
Anderson, C.W., and Rounds, S.A., 2010, Use of continuous monitors and autosamplers to predict unmeasured water-quality constituents in tributaries of the Tualatin River, Oregon: U.S. Geological Survey Scientific Investigations Report 2010–5008, 76 p. [Also available at https://pubs.er.usgs.gov/publication/sir20105008.]
Burniston, Debbie, McCera, Robert, Klawunn, Paul, Ellison, Rosanne, Thompson, Aaron, and Bruxer, Jacob, 2010, Detroit River phosphorus loading determination: Environ-ment Canada, scientific report, 44 p., accessed 12 Novem-ber 2017, at http://www.westernlakeerie.org/phosphorous_detroit_river__07_2010.pdf.
Childress, C.J.O., Foreman, W.T., Connor, B.F., and Malo-ney, T.J., 1999, New reporting procedures based on long term method detection levels and some considerations for interpretations of water-quality data provided by the U.S. Geological Survey National Water Quality Labora-tory: U.S. Geological Survey Open-File Report 99–193, 19 p., accessed 5 June 2014, at https://water.usgs.gov/owq/OFR_99-193/.
24 Spatial Distribution of Concentrations and Loads Using Different Sampling Methods, Trenton Channel, Michigan
Davis, B.E., 2005, A Guide to the proper selection and use of federally approved sediment and water-quality samplers: Vicksburg, MS, U.S. Geological Survey, Open File Report 2005–1087, 20 p., accessed May 9, 2018, at https://pubs.usgs.gov/of/2005/1087/pdf/OFR_2005-1087.pdf.
Derecki, J.A., 1984, Detroit River physical and hydraulic characteristics: National Oceanic and Atmospheric Admin-istration GLERL Open File report No. 417, 2 p., accessed 3 January 2017, at https://www.glerl.noaa.gov/pubs/fulltext/1984/19840013.pdf.
Fishman, M.J., ed., 1993, Methods of analysis by the U.S. Geological Survey National Water Quality Laboratory— Determination of inorganic and organic constituents in water and fluvial sediments: U.S. Geological Survey Open-File Report 93–125, 217 p.
Francy, D.S., Graham, J.L., Stelzer, E.A., Ecker, C.D., Brady, A.M.G., Struffolino, Pamela, and Loftin, K.A., 2015, Water quality, cyanobacteria, and environmental factors and their relations to microcystin concentrations for use in predic-tive models at Ohio Lake Erie and inland lake recreational sites, 2013–14: U.S. Geological Survey Scientific Investi-gations Report 2015–5120, 2 p., 2 appendixes, https://doi.org/10.3133/sir20155120.
Fulford, J.M., and Sauer, V.B., 1986, Comparison of veloc-ity interpolation methods for computing open-channel discharge in Subitsky, S.Y., ed., Selected papers in the hydrologic sciences: U.S. Geological Survey Water-Supply Paper 2290, 154 p., accessed 10 January 2017, at https://pubs.usgs.gov/wsp/wsp2290/pdf/wsp_2290.pdf.
Gibs, Jacob, Wilde, F.D., and Heckathorn, H.A., 2007, Use of multiparameter instruments for routine field measurements (ver. 1.1): U.S. Geological Survey Techniques of Water-Resources Investigations, book 9, chap. A6, section 6.8, 48 p., accessed 13 November 2017 at https://water.usgs.gov/owq/FieldManual/Chapter6/6.8_contents.html.
Guy, H.P., 1969, Laboratory theory and methods for sediment analysis: U.S. Geological Survey Techniques of Water-Resources Investigations, book 5, chap. C1, 58 p.
Hach Company, 2018, 2100Q Portable Turbidimeter, accessed May 8, 2018, at https://www.hach.com/2100q-portable-turbidimeter/product?id=7640450963.
Helsel, D.R., and Hirsch, R.M., 2002, Statistical methods in water resources: U.S. Geological Survey Techniques of Water-Resources Investigations, book 4, chap. A3, 524 p.
Holtschlag, D.J. and Koschik, J.A., 2002, A two-dimensional hydrodynamic model of the St. Clair and Detroit Rivers within the Great Lakes Basin: U.S. Geological Survey Water- Resources Investigations Report 01-4236, 63 p., accessed 28 January 2017, at http://mi.water.usgs.gov/pubs/WRIR/WRIR01-4236/.
Homer, C.G., Dewitz, J.A., Yang, L., Jin, S., Danielson, P., Xian, G., Coulston, J., Herold, N.D., Wickham, J.D., and Megown, K., 2015, Completion of the 2011 National Land Cover Database for the conterminous United States-Repre-senting a decade of land cover change information: Photo-grammetric Engineering and Remote Sensing, v. 81, no. 5, p. 345–354.
Lake Erie Lake Side Management Plan [LaMP], 2011, Lake Erie binational nutrient management strategy—Protect-ing Lake Erie by managing phosphorus: Prepared by the Lake Erie LaMP Work Group Nutrient Management Task Group, 21 p. [Also available at https://www.epa.gov/sites/production/files/2015-10/documents/binational_nutrient_management.pdf.]
Lane, S.N., Bradbrook, K.F., Richards, K.S., Biron, P.M., and Roy, A.G., 2000, Secondary circulation cells in river channel confluences: Measurement artefacts or coherent flow structures: Hydrological Processes, v. 14, no. 11–12, p. 2047–2071.
Magirl, C. S., Gartner, J.W., Smart, G.M., and Webb, R.H., 2009, Water velocity and the nature of critical flow in large rapids on the Colorado River, Utah: Water Resources Research, v. 45, no. 5, accessed January 20, 2017, at http://onlinelibrary.wiley.com/doi/10.1029/2009WR007731/abstract.
Mueller, D.S., Wagner, C.R., Rehmel, M.S., Oberg, K.A., and Rainville, Francois, 2013, Measuring discharge with acous-tic Doppler current profilers from a moving boat (ver. 2.0, December 2013): U.S. Geological Survey Techniques and Methods, book 3, chap. A22, 95 p., accessed 28 January 2017, at https://doi.org/10.3133/tm3A22.
Mueller, D.S., and Wagner, C.R., 2009, Measuring discharge with acoustic Doppler current profilers from a moving boat: U.S. Geological Survey Techniques and Methods 3A–22, book 3, chapter 22, section A, 72 p. [Also available at http://pubs.water.usgs.gov/tm3a22.]
Mullaney, J.R., Lorenz, D.L., and Arntson, A.D., 2009, Chlo-ride in groundwater and surface water in areas underlain by the glacial aquifer system, northern United States: U.S. Geological Survey Scientific Investigations Report 2009–5086, 41 p
National Oceanic and Atmospheric Administration, 2018, National Ocean Service, What is a seiche?, accessed May 4, 2018, at https://oceanservice.noaa.gov/facts/seiche.html.
Parsons, D.R., Jackson, P.R., Czuba, J.A., Engel, F.L., Rhoads, B.L., Oberg, K.A., Best, J.L., Mueller, D.S., Johnson, K.K., and Riley, J.D., 2013, Velocity Mapping Toolbox (VMT): a processing and visualization suite for moving‐vessel ADCP measurements: Earth Surface Processes and Landforms v. 38, no. 11, p. 1244–1260.

References 25
R Core Team, 2018, R—A language and environment for statistical computing: Vienna, Austria, R Foundation for Statistical Computing, accessed May 16, 2018, at http://www.R-project.org/.
Topping, D.J., Rubin, D.M., Wright, S.A., and Melis, T.S., 2011, Field evaluation of the error arising from inadequate time averaging in the standard use of depth-integrating suspended-sediment samplers: U.S. Geological Survey Professional Paper 1774, 95 p.
Shreve, E.A., and Downs, A.C., 2005, Quality-assurance plan for the analysis of fluvial sediment by the U.S. Geological Survey Kentucky Water Science Center Sediment Labora-tory: U.S. Geological Survey Open-File Report 2005–1230, 28 p.
U.S. Geological Survey, 2002, Policy and technical guid-ance on discharge measurements using acoustic Dop-pler Current Profilers: U.S. Geological Survey, Office of Surface Water Technical Memorandum 2002.02, accessed 28 January 2017, at https://hydroacoustics.usgs.gov/memos/OSW2002-02.pdf.
U.S. Geological Survey, 2006, Collection of water samples (ver. 2.0): U.S. Geological Survey Techniques of Water-Resources Investigations, book 9, chap. A4, September 2006, accessed January 12, 2018, at http://pubs.water.usgs.gov/twri9A4/.
U.S. Geological Survey, 2018, National Water Information System: Accessed May 4, 2018, at https://doi.org/10.5066/F7P55KJN.
Wickham, Hadley, 2009, ggplot2—Elegant graphics for data analysis: New York, Springer-Verlag, 213 p. [Also available at https://doi.org/10.1007/978-0-387-98141-3]
Xylem, Inc., 2018, YSI Professional Plus (Pro Plus) multipa-rameter instrument, accessed May 7, 2018, at https://www.ysi.com/proplus.


For additional information, contact: Director, Upper Midwest Water Science Center U.S. Geological Survey 6520 Mercantile Way, Suite 5 Lansing, MI 48911
or visit our website at: https://mi.water.usgs.gov/
Publishing support provided by the Madison and West Trenton Publishing Service Centers

Totten and Duris—Spatial D
istribution of Concentrations and Loads Using D
ifferent Sampling M
ethods, Trenton Channel, Michigan—
Scientific Investigations Report 2018–5141
ISSN 2328-0328 (online)https://doi.org/10.3133/sir20185141