sip performance of select schemes - advisorkhoj.com filesip performance of select schemes (as on...
TRANSCRIPT

1
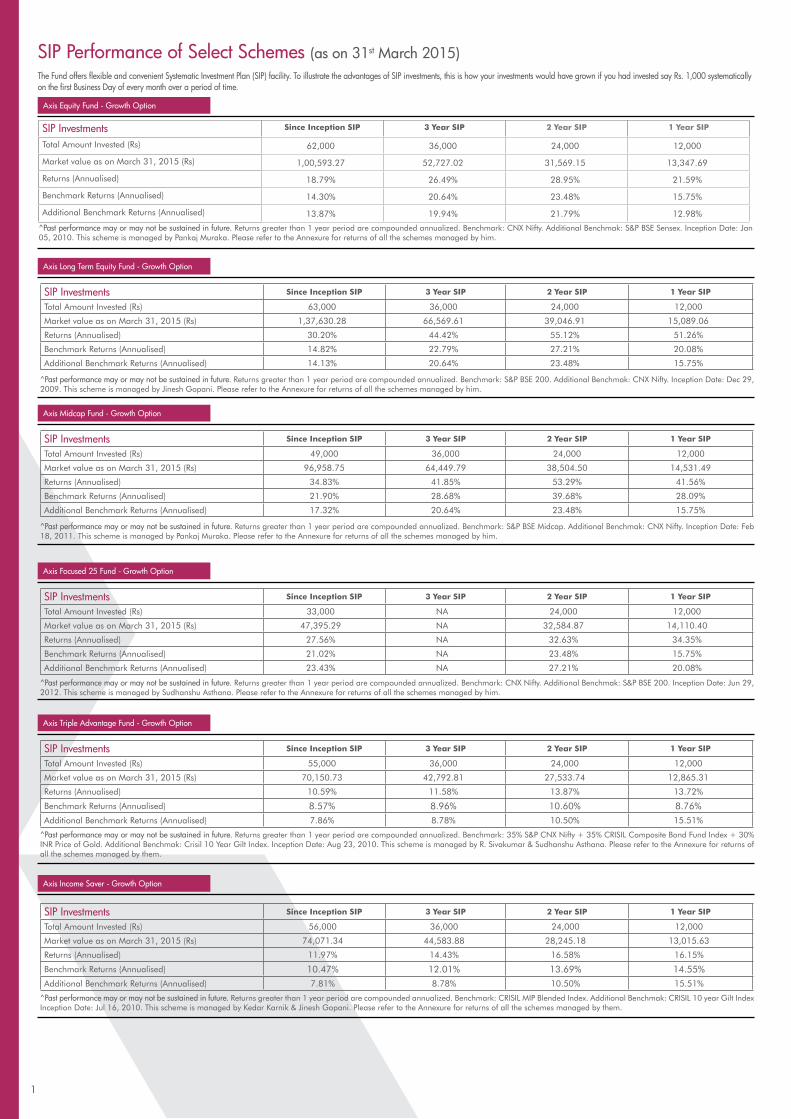
SIP Performance of Select Schemes (as on 31st March 2015)The Fund offers flexible and convenient Systematic Investment Plan (SIP) facility. To illustrate the advantages of SIP investments, this is how your investments would have grown if you had invested say Rs. 1,000 systematically on the first Business Day of every month over a period of time.
^Past performance may or may not be sustained in future. Returns greater than 1 year period are compounded annualized. Benchmark: CNX Nifty. Additional Benchmak: S&P BSE Sensex. Inception Date: Jan 05, 2010. This scheme is managed by Pankaj Muraka. Please refer to the Annexure for returns of all the schemes managed by him.
Axis Equity Fund - Growth Option
^Past performance may or may not be sustained in future. Returns greater than 1 year period are compounded annualized. Benchmark: S&P BSE 200. Additional Benchmak: CNX Nifty. Inception Date: Dec 29, 2009. This scheme is managed by Jinesh Gopani. Please refer to the Annexure for returns of all the schemes managed by him.
SIP Investments Since Inception SIP 3 Year SIP 2 Year SIP 1 Year SIP
Total Amount Invested (Rs) 63,000 36,000 24,000 12,000
Market value as on March 31, 2015 (Rs) 1,37,630.28 66,569.61 39,046.91 15,089.06
Returns (Annualised) 30.20% 44.42% 55.12% 51.26%
Benchmark Returns (Annualised) 14.82% 22.79% 27.21% 20.08%
Additional Benchmark Returns (Annualised) 14.13% 20.64% 23.48% 15.75%
Axis Long Term Equity Fund - Growth Option
^Past performance may or may not be sustained in future. Returns greater than 1 year period are compounded annualized. Benchmark: S&P BSE Midcap. Additional Benchmak: CNX Nifty. Inception Date: Feb 18, 2011. This scheme is managed by Pankaj Muraka. Please refer to the Annexure for returns of all the schemes managed by him.
SIP Investments Since Inception SIP 3 Year SIP 2 Year SIP 1 Year SIP
Total Amount Invested (Rs) 49,000 36,000 24,000 12,000
Market value as on March 31, 2015 (Rs) 96,958.75 64,449.79 38,504.50 14,531.49
Returns (Annualised) 34.83% 41.85% 53.29% 41.56%
Benchmark Returns (Annualised) 21.90% 28.68% 39.68% 28.09%
Additional Benchmark Returns (Annualised) 17.32% 20.64% 23.48% 15.75%
Axis Midcap Fund - Growth Option
^Past performance may or may not be sustained in future. Returns greater than 1 year period are compounded annualized. Benchmark: CNX Nifty. Additional Benchmak: S&P BSE 200. Inception Date: Jun 29, 2012. This scheme is managed by Sudhanshu Asthana. Please refer to the Annexure for returns of all the schemes managed by him.
SIP Investments Since Inception SIP 3 Year SIP 2 Year SIP 1 Year SIP
Total Amount Invested (Rs) 33,000 NA 24,000 12,000
Market value as on March 31, 2015 (Rs) 47,395.29 NA 32,584.87 14,110.40
Returns (Annualised) 27.56% NA 32.63% 34.35%
Benchmark Returns (Annualised) 21.02% NA 23.48% 15.75%
Additional Benchmark Returns (Annualised) 23.43% NA 27.21% 20.08%
Axis Focused 25 Fund - Growth Option
^Past performance may or may not be sustained in future. Returns greater than 1 year period are compounded annualized. Benchmark: 35% S&P CNX Nifty + 35% CRISIL Composite Bond Fund Index + 30% INR Price of Gold. Additional Benchmak: Crisil 10 Year Gilt Index. Inception Date: Aug 23, 2010. This scheme is managed by R. Sivakumar & Sudhanshu Asthana. Please refer to the Annexure for returns of all the schemes managed by them.
SIP Investments Since Inception SIP 3 Year SIP 2 Year SIP 1 Year SIP
Total Amount Invested (Rs) 55,000 36,000 24,000 12,000
Market value as on March 31, 2015 (Rs) 70,150.73 42,792.81 27,533.74 12,865.31
Returns (Annualised) 10.59% 11.58% 13.87% 13.72%
Benchmark Returns (Annualised) 8.57% 8.96% 10.60% 8.76%
Additional Benchmark Returns (Annualised) 7.86% 8.78% 10.50% 15.51%
Axis Triple Advantage Fund - Growth Option
^Past performance may or may not be sustained in future. Returns greater than 1 year period are compounded annualized. Benchmark: CRISIL MIP Blended Index. Additional Benchmak: CRISIL 10 year Gilt Index Inception Date: Jul 16, 2010. This scheme is managed by Kedar Karnik & Jinesh Gopani. Please refer to the Annexure for returns of all the schemes managed by them.
SIP Investments Since Inception SIP 3 Year SIP 2 Year SIP 1 Year SIP
Total Amount Invested (Rs) 56,000 36,000 24,000 12,000
Market value as on March 31, 2015 (Rs) 74,071.34 44,583.88 28,245.18 13,015.63
Returns (Annualised) 11.97% 14.43% 16.58% 16.15%
Benchmark Returns (Annualised) 10.47% 12.01% 13.69% 14.55%
Additional Benchmark Returns (Annualised) 7.81% 8.78% 10.50% 15.51%
Axis Income Saver - Growth Option
SIP Investments Since Inception SIP 3 Year SIP 2 Year SIP 1 Year SIP
Total Amount Invested (Rs) 62,000 36,000 24,000 12,000
Market value as on March 31, 2015 (Rs) 1,00,593.27 52,727.02 31,569.15 13,347.69
Returns (Annualised) 18.79% 26.49% 28.95% 21.59%
Benchmark Returns (Annualised) 14.30% 20.64% 23.48% 15.75%
Additional Benchmark Returns (Annualised) 13.87% 19.94% 21.79% 12.98%
FUND STYLE
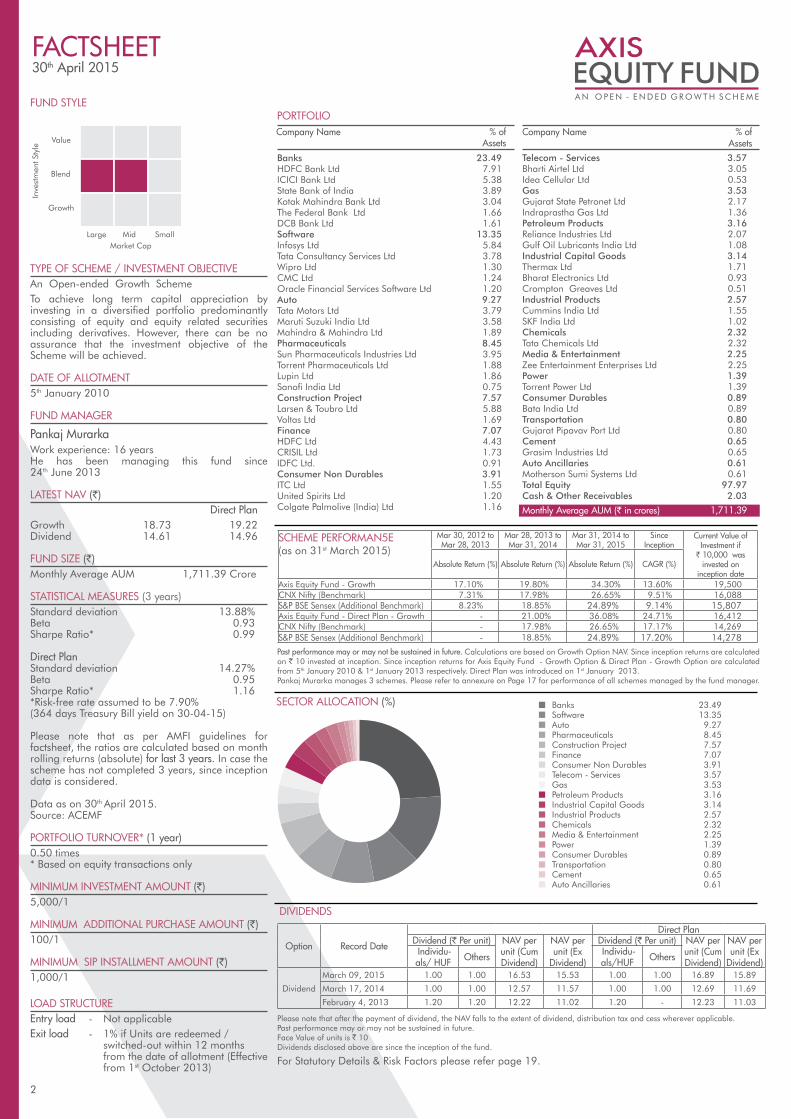
TYPE OF SCHEME / INVESTMENT OBJECTIVEAn Open-ended Growth SchemeTo achieve long term capital appreciation by investing in a diversified portfolio predominantly consisting of equity and equity related securities including derivatives. However, there can be no assurance that the investment objective of the Scheme will be achieved.
DATE OF ALLOTMENT5th January 2010
FUND MANAGER
Pankaj MurarkaWork experience: 16 yearsHe has been managing this fund since 24th June 2013
LATEST NAV (`) Direct PlanGrowth 18.73 19.22Dividend 14.61 14.96
FUND SIZE (`)Monthly Average AUM 1,711.39 Crore
STATISTICAL MEASURES (3 years)Standard deviation 13.88%Beta 0.93Sharpe Ratio* 0.99
Direct PlanStandard deviation 14.27%Beta 0.95Sharpe Ratio* 1.16*Risk-free rate assumed to be 7.90%(364 days Treasury Bill yield on 30-04-15)
Please note that as per AMFI guidelines for factsheet, the ratios are calculated based on month rolling returns (absolute) for last 3 years. In case the scheme has not completed 3 years, since inception data is considered.
Data as on 30th April 2015. Source: ACEMF
PORTFOLIO TURNOVER* (1 year)0.50 times* Based on equity transactions only
MINIMUM INVESTMENT AMOUNT (`)5,000/1
MINIMUM ADDITIONAL PURCHASE AMOUNT (`)100/1
MINIMUM SIP INSTALLMENT AMOUNT (`)1,000/1
LOAD STRUCTUREEntry load - Not applicableExit load - 1% if Units are redeemed / switched-out within 12 months from the date of allotment (Effective from 1st October 2013)
Banks 23.49HDFC Bank Ltd 7.91ICICI Bank Ltd 5.38State Bank of India 3.89Kotak Mahindra Bank Ltd 3.04The Federal Bank Ltd 1.66DCB Bank Ltd 1.61Software 13.35Infosys Ltd 5.84Tata Consultancy Services Ltd 3.78Wipro Ltd 1.30CMC Ltd 1.24Oracle Financial Services Software Ltd 1.20Auto 9.27Tata Motors Ltd 3.79Maruti Suzuki India Ltd 3.58Mahindra & Mahindra Ltd 1.89Pharmaceuticals 8.45Sun Pharmaceuticals Industries Ltd 3.95Torrent Pharmaceuticals Ltd 1.88Lupin Ltd 1.86Sanofi India Ltd 0.75Construction Project 7.57Larsen & Toubro Ltd 5.88Voltas Ltd 1.69Finance 7.07HDFC Ltd 4.43CRISIL Ltd 1.73IDFC Ltd. 0.91Consumer Non Durables 3.91ITC Ltd 1.55United Spirits Ltd 1.20Colgate Palmolive (India) Ltd 1.16
Telecom - Services 3.57Bharti Airtel Ltd 3.05Idea Cellular Ltd 0.53Gas 3.53Gujarat State Petronet Ltd 2.17Indraprastha Gas Ltd 1.36Petroleum Products 3.16Reliance Industries Ltd 2.07Gulf Oil Lubricants India Ltd 1.08Industrial Capital Goods 3.14Thermax Ltd 1.71Bharat Electronics Ltd 0.93Crompton Greaves Ltd 0.51Industrial Products 2.57Cummins India Ltd 1.55SKF India Ltd 1.02Chemicals 2.32Tata Chemicals Ltd 2.32Media & Entertainment 2.25Zee Entertainment Enterprises Ltd 2.25Power 1.39Torrent Power Ltd 1.39Consumer Durables 0.89Bata India Ltd 0.89Transportation 0.80Gujarat Pipavav Port Ltd 0.80Cement 0.65Grasim Industries Ltd 0.65Auto Ancillaries 0.61Motherson Sumi Systems Ltd 0.61Total Equity 97.97Cash & Other Receivables 2.03
Monthly Average AUM (` in crores) 1,711.39
Company Name % of Assets
Company Name % of Assets
PORTFOLIO
DIVIDENDS
FACTSHEET30th April 2015
Value
Inve
stm
ent S
tyle
Market Cap
Blend
Growth
Large Mid Small
Past performance may or may not be sustained in future. Calculations are based on Growth Option NAV. Since inception returns are calculated on ` 10 invested at inception. Since inception returns for Axis Equity Fund - Growth Option & Direct Plan - Growth Option are calculated from 5th January 2010 & 1st January 2013 respectively. Direct Plan was introduced on 1st January 2013.Pankaj Murarka manages 3 schemes. Please refer to annexure on Page 17 for performance of all schemes managed by the fund manager.
Please note that after the payment of dividend, the NAV falls to the extent of dividend, distribution tax and cess wherever applicable.Past performance may or may not be sustained in future. Face Value of units is ` 10Dividends disclosed above are since the inception of the fund.
Option Record Date
Direct PlanDividend (` Per unit) NAV per
unit (Cum Dividend)
NAV per unit (Ex
Dividend)
Dividend (` Per unit) NAV per unit (Cum Dividend)
NAV per unit (Ex
Dividend) Individu-als/ HUF Others Individu-
als/HUF Others
Dividend
March 09, 2015 1.00 1.00 16.53 15.53 1.00 1.00 16.89 15.89
March 17, 2014 1.00 1.00 12.57 11.57 1.00 1.00 12.69 11.69
February 4, 2013 1.20 1.20 12.22 11.02 1.20 - 12.23 11.03
For Statutory Details & Risk Factors please refer page 19.
2
SECTOR ALLOCATION (%) Banks 23.49Software 13.35Auto 9.27Pharmaceuticals 8.45Construction Project 7.57Finance 7.07Consumer Non Durables 3.91Telecom - Services 3.57Gas 3.53Petroleum Products 3.16Industrial Capital Goods 3.14Industrial Products 2.57Chemicals 2.32Media & Entertainment 2.25Power 1.39Consumer Durables 0.89Transportation 0.80Cement 0.65Auto Ancillaries 0.61
¢¢¢¢¢¢¢¢¢¢¢¢¢¢¢¢¢¢¢
SCHEME PERFORMAN5E (as on 31st March 2015)
Mar 30, 2012 to Mar 28, 2013
Mar 28, 2013 to Mar 31, 2014
Mar 31, 2014 to Mar 31, 2015
Since Inception
Current Value of Investment if
` 10,000 wasinvested on
inception dateAbsolute Return (%) Absolute Return (%) Absolute Return (%) CAGR (%)
Axis Equity Fund - Growth 17.10% 19.80% 34.30% 13.60% 19,500CNX Nifty (Benchmark) 7.31% 17.98% 26.65% 9.51% 16,088S&P BSE Sensex (Additional Benchmark) 8.23% 18.85% 24.89% 9.14% 15,807Axis Equity Fund - Direct Plan - Growth - 21.00% 36.08% 24.71% 16,412CNX Nifty (Benchmark) - 17.98% 26.65% 17.17% 14,269S&P BSE Sensex (Additional Benchmark) - 18.85% 24.89% 17.20% 14,278
FUND STYLE
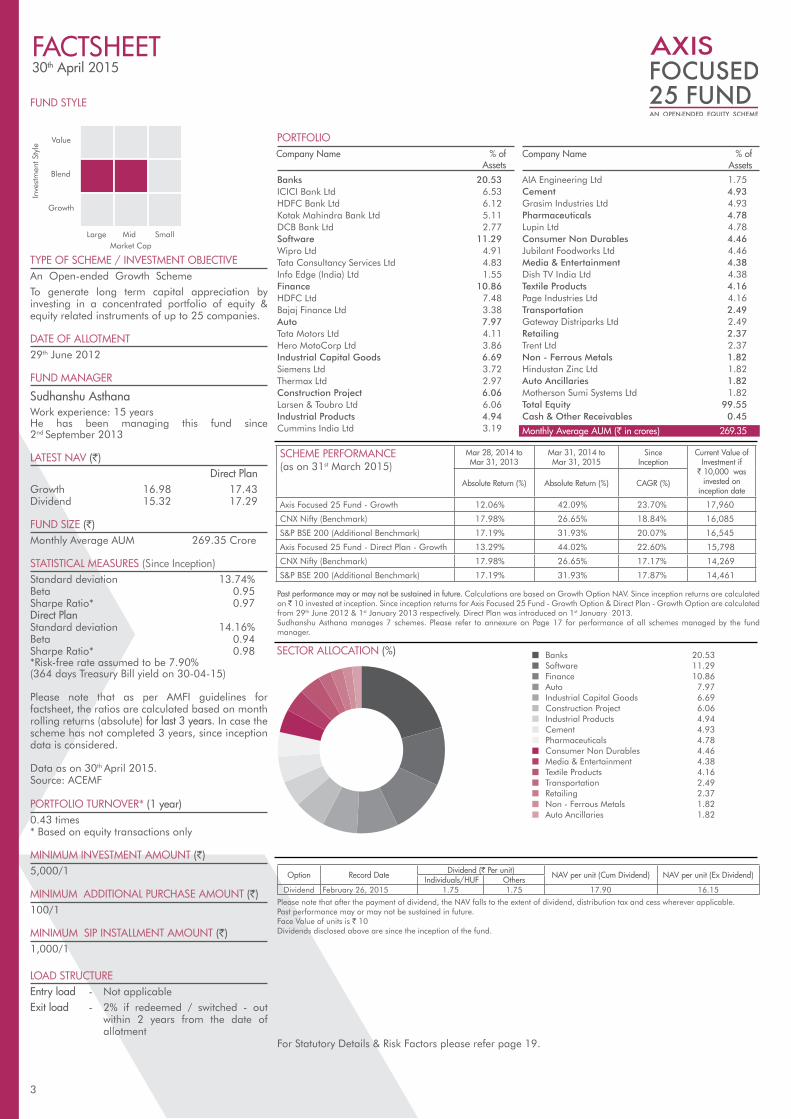
TYPE OF SCHEME / INVESTMENT OBJECTIVEAn Open-ended Growth SchemeTo generate long term capital appreciation by investing in a concentrated portfolio of equity & equity related instruments of up to 25 companies.
DATE OF ALLOTMENT29th June 2012
FUND MANAGER
Sudhanshu AsthanaWork experience: 15 yearsHe has been managing this fund since 2nd September 2013
LATEST NAV (`) Direct PlanGrowth 16.98 17.43Dividend 15.32 17.29
FUND SIZE (`)Monthly Average AUM 269.35 Crore
STATISTICAL MEASURES (Since Inception)Standard deviation 13.74%Beta 0.95Sharpe Ratio* 0.97Direct PlanStandard deviation 14.16%Beta 0.94Sharpe Ratio* 0.98*Risk-free rate assumed to be 7.90%(364 days Treasury Bill yield on 30-04-15)
Please note that as per AMFI guidelines for factsheet, the ratios are calculated based on month rolling returns (absolute) for last 3 years. In case the scheme has not completed 3 years, since inception data is considered.
Data as on 30th April 2015.Source: ACEMF
PORTFOLIO TURNOVER* (1 year)0.43 times* Based on equity transactions only
MINIMUM INVESTMENT AMOUNT (`)5,000/1
MINIMUM ADDITIONAL PURCHASE AMOUNT (`)100/1
MINIMUM SIP INSTALLMENT AMOUNT (`)1,000/1
LOAD STRUCTUREEntry load - Not applicableExit load - 2% if redeemed / switched - out within 2 years from the date of allotment
Banks 20.53ICICI Bank Ltd 6.53HDFC Bank Ltd 6.12Kotak Mahindra Bank Ltd 5.11DCB Bank Ltd 2.77Software 11.29Wipro Ltd 4.91Tata Consultancy Services Ltd 4.83Info Edge (India) Ltd 1.55Finance 10.86HDFC Ltd 7.48Bajaj Finance Ltd 3.38Auto 7.97Tata Motors Ltd 4.11Hero MotoCorp Ltd 3.86Industrial Capital Goods 6.69Siemens Ltd 3.72Thermax Ltd 2.97Construction Project 6.06Larsen & Toubro Ltd 6.06Industrial Products 4.94Cummins India Ltd 3.19
AIA Engineering Ltd 1.75Cement 4.93Grasim Industries Ltd 4.93Pharmaceuticals 4.78Lupin Ltd 4.78Consumer Non Durables 4.46Jubilant Foodworks Ltd 4.46Media & Entertainment 4.38Dish TV India Ltd 4.38Textile Products 4.16Page Industries Ltd 4.16Transportation 2.49Gateway Distriparks Ltd 2.49Retailing 2.37Trent Ltd 2.37Non - Ferrous Metals 1.82Hindustan Zinc Ltd 1.82Auto Ancillaries 1.82Motherson Sumi Systems Ltd 1.82Total Equity 99.55Cash & Other Receivables 0.45
Monthly Average AUM (` in crores) 269.35
Company Name % of Assets
Company Name % of Assets
PORTFOLIO
FACTSHEET30th April 2015
Past performance may or may not be sustained in future. Calculations are based on Growth Option NAV. Since inception returns are calculated on ̀ 10 invested at inception. Since inception returns for Axis Focused 25 Fund - Growth Option & Direct Plan - Growth Option are calculated from 29th June 2012 & 1st January 2013 respectively. Direct Plan was introduced on 1st January 2013.Sudhanshu Asthana manages 7 schemes. Please refer to annexure on Page 17 for performance of all schemes managed by the fund manager.
For Statutory Details & Risk Factors please refer page 19.
Market CapLarge Mid Small
Value
Inve
stm
ent S
tyle
Blend
Growth
3
SECTOR ALLOCATION (%) Banks 20.53Software 11.29Finance 10.86Auto 7.97Industrial Capital Goods 6.69Construction Project 6.06Industrial Products 4.94Cement 4.93Pharmaceuticals 4.78Consumer Non Durables 4.46Media & Entertainment 4.38Textile Products 4.16Transportation 2.49Retailing 2.37Non - Ferrous Metals 1.82Auto Ancillaries 1.82
¢¢¢¢¢¢¢¢¢¢¢¢¢¢¢¢
Option Record Date Dividend (` Per unit) NAV per unit (Cum Dividend) NAV per unit (Ex Dividend) Individuals/HUF OthersDividend February 26, 2015 1.75 1.75 17.90 16.15
Please note that after the payment of dividend, the NAV falls to the extent of dividend, distribution tax and cess wherever applicable.Past performance may or may not be sustained in future. Face Value of units is ` 10Dividends disclosed above are since the inception of the fund.
SCHEME PERFORMANCE (as on 31st March 2015)
Mar 28, 2014 to Mar 31, 2013
Mar 31, 2014 to Mar 31, 2015
Since Inception
Current Value of Investment if
` 10,000 wasinvested on
inception dateAbsolute Return (%) Absolute Return (%) CAGR (%)
Axis Focused 25 Fund - Growth 12.06% 42.09% 23.70% 17,960
CNX Nifty (Benchmark) 17.98% 26.65% 18.84% 16,085
S&P BSE 200 (Additional Benchmark) 17.19% 31.93% 20.07% 16,545
Axis Focused 25 Fund - Direct Plan - Growth 13.29% 44.02% 22.60% 15,798
CNX Nifty (Benchmark) 17.98% 26.65% 17.17% 14,269
S&P BSE 200 (Additional Benchmark) 17.19% 31.93% 17.87% 14,461

FUND STYLE
TYPE OF SCHEME / INVESTMENT OBJECTIVEAn Open-ended Equity-Linked Savings Scheme with a 3 year lock in. Eligible investors in the Scheme (who are “Assessee” as per the ELSS Rules) are entitled to deductions of the amount invested in Units of the Scheme under Section 80C of the Income Tax Act, 1961 to such extent and subject to such conditions as may be notified from time to time.To generate income and long-term capital appreciation from a diversified portfolio of predominantly equity and equity-related securities. However, there can be no assurance that the investment objective of the Scheme will be achieved.
DATE OF ALLOTMENT29th December 2009
FUND MANAGER
Jinesh Gopani Work experience: 13 yearsHe has been managing this fund since 1st April 2011
LATEST NAV (`) Direct PlanGrowth 30.01 30.90Dividend 21.95 26.32
FUND SIZE (`)Monthly Average AUM 5,047.49 Crore
STATISTICAL MEASURES (3 years)Standard deviation 13.87%Beta 0.88Sharpe Ratio* 1.80
Direct PlanStandard deviation 14.01%Beta 0.90Sharpe Ratio* 2.55*Risk-free rate assumed to be 7.90%(364 days Treasury Bill yield on 30-04-15)
Please note that as per AMFI guidelines for factsheet, the ratios are calculated based on month rolling returns (absolute) for last 3 years. In case the scheme has not completed 3 years, since inception data is considered.
Data as on 30th April 2015. Source: ACEMF
PORTFOLIO TURNOVER* (1 year)0.33 times* Based on equity transactions only
MINIMUM INVESTMENT AMOUNT (`)500/500
MINIMUM ADDITIONAL PURCHASE AMOUNT (`)500/500
MINIMUM SIP INSTALLMENT AMOUNT (`)500/500
LOAD STRUCTUREEntry load - Not applicableExit load - Nil
Corporate Bond 1.01NABARD CRISIL AAA 1.01Banks 14.80HDFC Bank Ltd 8.03Kotak Mahindra Bank Ltd 6.78Finance 13.57HDFC Ltd 4.96Gruh Finance Ltd 2.47Multi Commodity Exchange of India Ltd 2.43Sundaram Finance Ltd 1.93Bajaj Finance Ltd 1.79Software 11.85Tata Consultancy Services Ltd 6.07Tech Mahindra Ltd 4.40Info Edge (India) Ltd 1.38Pharmaceuticals 10.62Sun Pharmaceuticals Industries Ltd 5.25Divi’s Laboratories Ltd 1.95Cadila Healthcare Ltd 1.37IPCA Laboratories Ltd 1.32Ttk Healthcare Ltd 0.72Auto Ancillaries 6.92Motherson Sumi Systems Ltd 3.69Wabco India Ltd 1.63Bosch Ltd 1.60Auto 6.83Maruti Suzuki India Ltd 3.95Eicher Motors Ltd 2.89Consumer Durables 6.54TTK Prestige Ltd 3.54
Symphony Ltd 1.53Bata India Ltd 1.47Construction Project 5.93Larsen & Toubro Ltd 5.93Industrial Products 4.66Cummins India Ltd 2.76Astral Poly Technik Ltd 1.19AIA Engineering Ltd 0.71Chemicals 3.33Pidilite Industries Ltd 3.33Pesticides 3.25PI Industries Ltd 3.25Transportation 2.98Gujarat Pipavav Port Ltd 1.67Blue Dart Express Ltd 1.31Power 2.29Torrent Power Ltd 2.29Industrial Capital Goods 1.45Siemens Ltd 1.45Textile Products 1.10Page Industries Ltd 1.10Telecom - Equipment & Accessories 0.95Astra Microwave Products Ltd 0.95Consumer Non Durables 0.82Nestle India Ltd 0.82Other Equity (less than 0.50% of the corpus) 0.37Total Equity 99.27Debt, Cash & Other Receivables 0.73
Monthly Average AUM (` in crores) 5,047.49
Company Name % of Assets
Company Name % of Assets
PORTFOLIO
DIVIDENDS
FACTSHEET30th April 2015
Past performance may or may not be sustained in future. Calculations are based on Growth Option NAV. Since inception returns are calculated on ` 10 invested at inception. Since inception returns for Axis Long Term Equity Fund - Growth Option & Direct Plan - Growth Option are calculated from 29th December 2009 & 1st January 2013 respectively. Direct Plan was introduced on 1st January 2013.Jinesh Gopani manages 13 schemes. Please refer to annexure on Page 17 for performance of all schemes managed by the fund manager.
Please note that after the payment of dividend, the NAV falls to the extent of dividend, distribution tax and cess wherever applicable.Past performance may or may not be sustained in future. Face Value of units is ` 10Dividends disclosed above are since the inception of the fund.
Option Record DateDividend (` Per unit)
NAV per unit (Cum Dividend) Individuals/ HUF Others
Regular Dividend
January 22, 2015 2.00 2.00 24.2942
January 6, 2014 1.00 1.00 14.6918
August 7, 2012 0.80 0.80 12.1041
SCHEME PERFORMANCE (as on 31st March 2015)
Mar 30, 2012 to
March 28, 2013
Mar 28, 2013 to
Mar 31, 2014
Mar 31, 2014 to
Mar 31, 2015
Since Inception
Current Value of Investment if
` 10,000 wasinvested on
inception dateAbsolute Return
(%)Absolute Return
(%)Absolute Return
(%) CAGR (%)
Axis Long Term Equity Fund - Growth 13.14% 35.40% 62.03% 24.07% 31,063S&P BSE 200 (Benchmark) 6.03% 17.19% 31.93% 9.71% 16,271CNX Nifty (Additional Benchmark) 7.31% 17.98% 26.65% 9.83% 16,367Axis Long Term Equity Fund - Direct Plan - Growth - 36.76% 64.51% 40.42% 21,419S&P BSE 200 (Benchmark) - 17.19% 31.93% 17.87% 14,461CNX Nifty (Additional Benchmark) - 17.98% 26.65% 17.17% 14,269
For Statutory Details & Risk Factors please refer page 19.
Market CapLarge Mid Small
Value
Inve
stm
ent S
tyle
Blend
Growth
4
SECTOR ALLOCATION (%)Banks 14.80Finance 13.57Software 11.85Pharmaceuticals 10.62Auto Ancillaries 6.92Auto 6.83Consumer Durables 6.54Construction Project 5.93Industrial Products 4.66Chemicals 3.33Pesticides 3.25Transportation 2.98Power 2.29Industrial Capital Goods 1.45Textile Products 1.10Telecom - Equipment & Accessories 0.95Consumer Non Durables 0.82Hotels, Resorts And Other Recreational Activities 0.37
¢¢¢¢¢¢¢¢¢¢¢¢¢¢¢¢¢¢
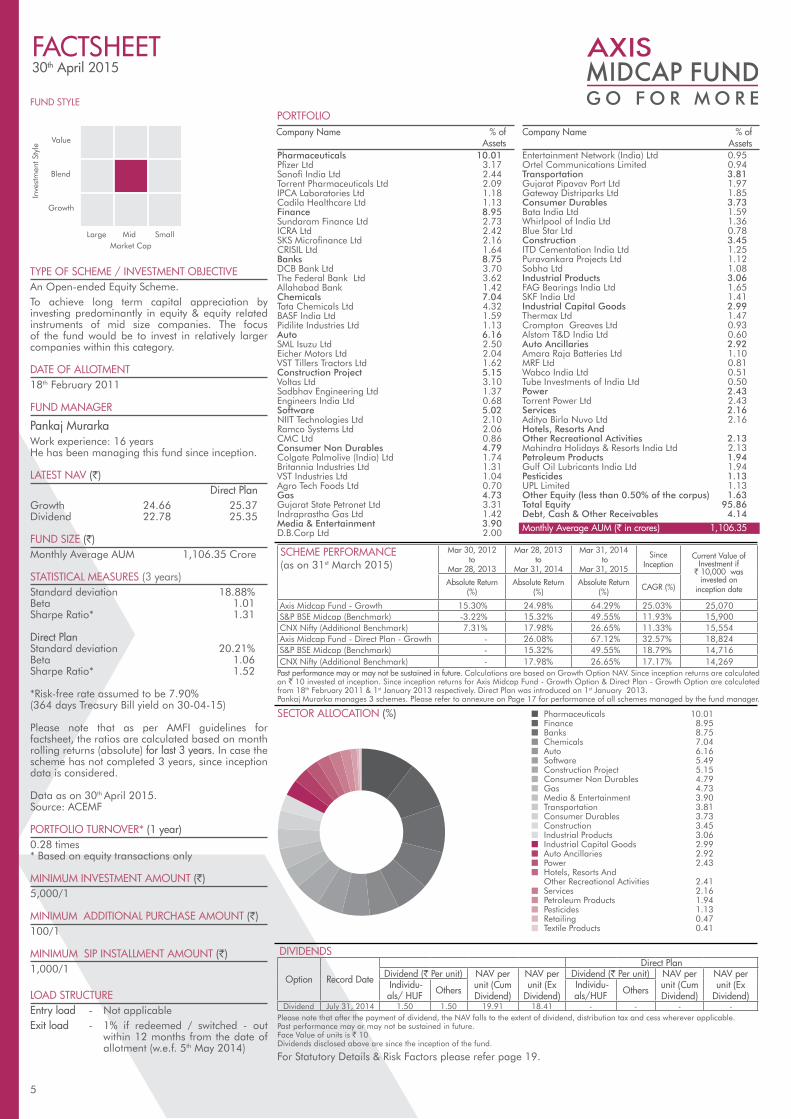
Pharmaceuticals 10.01Pfizer Ltd 3.17Sanofi India Ltd 2.44Torrent Pharmaceuticals Ltd 2.09IPCA Laboratories Ltd 1.18Cadila Healthcare Ltd 1.13Finance 8.95Sundaram Finance Ltd 2.73ICRA Ltd 2.42SKS Microfinance Ltd 2.16CRISIL Ltd 1.64Banks 8.75DCB Bank Ltd 3.70The Federal Bank Ltd 3.62Allahabad Bank 1.42Chemicals 7.04Tata Chemicals Ltd 4.32BASF India Ltd 1.59Pidilite Industries Ltd 1.13Auto 6.16SML Isuzu Ltd 2.50Eicher Motors Ltd 2.04VST Tillers Tractors Ltd 1.62Construction Project 5.15Voltas Ltd 3.10Sadbhav Engineering Ltd 1.37Engineers India Ltd 0.68Software 5.02NIIT Technologies Ltd 2.10Ramco Systems Ltd 2.06CMC Ltd 0.86Consumer Non Durables 4.79Colgate Palmolive (India) Ltd 1.74Britannia Industries Ltd 1.31VST Industries Ltd 1.04Agro Tech Foods Ltd 0.70Gas 4.73Gujarat State Petronet Ltd 3.31Indraprastha Gas Ltd 1.42Media & Entertainment 3.90D.B.Corp Ltd 2.00
Entertainment Network (India) Ltd 0.95Ortel Communications Limited 0.94Transportation 3.81Gujarat Pipavav Port Ltd 1.97Gateway Distriparks Ltd 1.85Consumer Durables 3.73Bata India Ltd 1.59Whirlpool of India Ltd 1.36Blue Star Ltd 0.78Construction 3.45ITD Cementation India Ltd 1.25Puravankara Projects Ltd 1.12Sobha Ltd 1.08Industrial Products 3.06FAG Bearings India Ltd 1.65SKF India Ltd 1.41Industrial Capital Goods 2.99Thermax Ltd 1.47Crompton Greaves Ltd 0.93Alstom T&D India Ltd 0.60Auto Ancillaries 2.92Amara Raja Batteries Ltd 1.10MRF Ltd 0.81Wabco India Ltd 0.51Tube Investments of India Ltd 0.50Power 2.43Torrent Power Ltd 2.43Services 2.16Aditya Birla Nuvo Ltd 2.16Hotels, Resorts And Other Recreational Activities 2.13Mahindra Holidays & Resorts India Ltd 2.13Petroleum Products 1.94Gulf Oil Lubricants India Ltd 1.94Pesticides 1.13UPL Limited 1.13Other Equity (less than 0.50% of the corpus) 1.63Total Equity 95.86Debt, Cash & Other Receivables 4.14
Monthly Average AUM (` in crores) 1,106.35
Company Name % of Assets
Company Name % of Assets
PORTFOLIO
FACTSHEET30th April 2015
Past performance may or may not be sustained in future. Calculations are based on Growth Option NAV. Since inception returns are calculated on ` 10 invested at inception. Since inception returns for Axis Midcap Fund - Growth Option & Direct Plan - Growth Option are calculated from 18th February 2011 & 1st January 2013 respectively. Direct Plan was introduced on 1st January 2013.Pankaj Murarka manages 3 schemes. Please refer to annexure on Page 17 for performance of all schemes managed by the fund manager.
SCHEME PERFORMANCE (as on 31st March 2015)
Mar 30, 2012to
Mar 28, 2013
Mar 28, 2013to
Mar 31, 2014
Mar 31, 2014 to
Mar 31, 2015
Since Inception
Current Value of Investment if
` 10,000 wasinvested on
inception dateAbsolute Return
(%)Absolute Return
(%)Absolute Return
(%) CAGR (%)
Axis Midcap Fund - Growth 15.30% 24.98% 64.29% 25.03% 25,070S&P BSE Midcap (Benchmark) -3.22% 15.32% 49.55% 11.93% 15,900CNX Nifty (Additional Benchmark) 7.31% 17.98% 26.65% 11.33% 15,554Axis Midcap Fund - Direct Plan - Growth - 26.08% 67.12% 32.57% 18,824S&P BSE Midcap (Benchmark) - 15.32% 49.55% 18.79% 14,716CNX Nifty (Additional Benchmark) - 17.98% 26.65% 17.17% 14,269
For Statutory Details & Risk Factors please refer page 19.
5
DIVIDENDS
Please note that after the payment of dividend, the NAV falls to the extent of dividend, distribution tax and cess wherever applicable.Past performance may or may not be sustained in future. Face Value of units is ` 10Dividends disclosed above are since the inception of the fund.
Option Record Date
Direct PlanDividend (` Per unit) NAV per
unit (Cum Dividend)
NAV per unit (Ex
Dividend)
Dividend (` Per unit) NAV per unit (Cum Dividend)
NAV per unit (Ex
Dividend) Individu-als/ HUF Others Individu-
als/HUF Others
Dividend July 31, 2014 1.50 1.50 19.91 18.41 - - - -
SECTOR ALLOCATION (%) Pharmaceuticals 10.01Finance 8.95Banks 8.75Chemicals 7.04Auto 6.16Software 5.49Construction Project 5.15Consumer Non Durables 4.79Gas 4.73Media & Entertainment 3.90Transportation 3.81Consumer Durables 3.73Construction 3.45Industrial Products 3.06Industrial Capital Goods 2.99Auto Ancillaries 2.92Power 2.43Hotels, Resorts And Other Recreational Activities 2.41Services 2.16Petroleum Products 1.94Pesticides 1.13Retailing 0.47Textile Products 0.41
FUND STYLE
TYPE OF SCHEME / INVESTMENT OBJECTIVEAn Open-ended Equity Scheme.To achieve long term capital appreciation by investing predominantly in equity & equity related instruments of mid size companies. The focus of the fund would be to invest in relatively larger companies within this category.
DATE OF ALLOTMENT18th February 2011
FUND MANAGER
Pankaj MurarkaWork experience: 16 yearsHe has been managing this fund since inception.
LATEST NAV (`) Direct PlanGrowth 24.66 25.37Dividend 22.78 25.35
FUND SIZE (`)Monthly Average AUM 1,106.35 Crore
STATISTICAL MEASURES (3 years)Standard deviation 18.88%Beta 1.01Sharpe Ratio* 1.31
Direct Plan Standard deviation 20.21% Beta 1.06 Sharpe Ratio* 1.52
*Risk-free rate assumed to be 7.90%(364 days Treasury Bill yield on 30-04-15)
Please note that as per AMFI guidelines for factsheet, the ratios are calculated based on month rolling returns (absolute) for last 3 years. In case the scheme has not completed 3 years, since inception data is considered.
Data as on 30th April 2015. Source: ACEMF
PORTFOLIO TURNOVER* (1 year)0.28 times* Based on equity transactions only
MINIMUM INVESTMENT AMOUNT (`)5,000/1
MINIMUM ADDITIONAL PURCHASE AMOUNT (`)100/1
MINIMUM SIP INSTALLMENT AMOUNT (`)1,000/1
LOAD STRUCTUREEntry load - Not applicableExit load - 1% if redeemed / switched - out within 12 months from the date of allotment (w.e.f. 5th May 2014)
Market CapLarge Mid Small
Value
Inve
stm
ent S
tyle
Blend
Growth
¢¢¢¢¢¢¢¢¢¢¢¢¢¢¢¢¢¢
¢¢¢¢¢

FUND STYLE
TYPE OF SCHEME / INVESTMENT OBJECTIVEAn Open-ended Hybrid Fund
To generate long term capital appreciation by investing in a diversified portfolio of equity and equity related instruments, fixed income instruments & gold exchange traded funds.
DATE OF ALLOTMENT23rd August 2010
FUND MANAGER
R. Sivakumar Work experience: 16 yearsHe has been managing the fund since 14th September 2010
Sudhanshu Asthana Work experience: 15 yearsHe has been managing the fund since 1st April 2011
LATEST NAV (`) Direct PlanGrowth 15.1009 15.4776Dividend 12.3164 13.3314FUND SIZE (`) Monthly Average AUM 456.97 Crore
AVERAGE MATURITY@*9.8 years
MODIFIED DURATION@*6.0 years
YIELD TO MATURITY &
8.73%
MINIMUM INVESTMENT AMOUNT (`)5,000/1
MINIMUM ADDITIONAL PURCHASE AMOUNT (`)100/1
MINIMUM SIP INSTALLMENT AMOUNT (`)1,000/1
LOAD STRUCTUREEntry load - Not applicableExit load - 3% if redeemed / switched - out within 1 year from date of allotment 2% if redeemed / switched - out after 1 year and upto 2 years from the date of allotment 1% if redeemed / switched - out after 2 years and upto 3 years from the date of allotment
PORTFOLIO
DIVIDENDS
FACTSHEET30th April 2015
Equity
Ass
et C
lass
Credit Quality
Debt
Gold
High Mid Low
Past performance may or may not be sustained in future. Calculations are based on Growth Option NAV. Since inception returns are calculated on ` 10 invested at inception. Since inception returns for Axis Triple Advantage Fund - Growth Option & Direct Plan - Growth Option are calculated from 23rd August 2010 & 1st January 2013 respectively. Direct Plan was introduced on 1st January 2013.R. Sivakumar manages 2 schemes & Sudhanshu Asthana manages 7 schemes. Please refer to annexure on Page 17&18 for performance of all schemes managed by the fund managers. Scheme Performance may not be strictly comparable with that of its additional benchmark in view of hybrid nature of the scheme.
Please note that after the payment of dividend, the NAV falls to the extent of dividend, distribution tax and cess wherever applicable. Past performance may or may not be sustained in future. Face Value of units is ̀ 10. Dividends disclosed above are since the inception of the fund. @ Based on debt portfolio only.* For instruments with put/call option, the put/call date has been taken as the maturity date.& The yield to maturity given above is based on the portfolio of funds as on date given above. This should not be taken as an indication of the returns that maybe generated by the fund and the securities bought by the fund may or may not be held till their respective maturities. The calculation is based on the invested corpus of the debt portfolio.
SCHEME PERFORMANCE (as on 31st March 2015)
Mar 30, 2012 to Mar 28, 2013
Mar 28, 2013 to Mar 31, 2014
Mar 31, 2014 to Mar 31, 2015
Since Inception
Current Value of Investment if
` 10,000 wasinvested on
inception date
Absolute Return (%)
Absolute Return (%)
Absolute Return (%) CAGR (%)
Axis Triple Advantage Fund - Growth 9.88% 5.92% 16.40% 9.50% 15,19135% of CNX Nifty + 35% of Crisil Composite Bond Fund Index + 30% Of INR Price of Gold (Benchmark)
6.92% 4.99% 12.63% 8.77% 14,726
CRISIL 10 year Gilt Index (Additional Benchmark) 11.25% -0.96% 14.57% 6.87% 13,577Axis Triple Advantage Fund - Direct Plan Growth - 6.73% 17.95% 9.44% 12,24335% of CNX Nifty + 35% of Crisil Composite Bond Fund Index + 30% Of INR Price of Gold (Benchmark)
- 4.99% 12.63% 6.67% 11,560
CRISIL 10 year Gilt Index (Additional Benchmark) - -0.96% 14.57% 6.82% 11,595
For Statutory Details & Risk Factors please refer page 19.
Option Record Date Dividend (` Per unit) NAV per unit (Cum Dividend) NAV per unit (Ex Dividend) Individuals/HUF Others
DividendApril 17, 2014 0.4676 0.4478 11.3222 10.7222 September 17, 2012 0.7047 0.6040 11.2694 10.4694 September 21, 2011 0.7047 0.6040 10.9561 10.1561
Total Debt 32.00Corporate Bond 21.42Reliance Gas Transportation Infrastructure Ltd CRISIL AAA 7.18Rural Electrification Corporation Ltd CRISIL AAA 5.55Hindalco Industries Ltd CRISIL AA 3.40Tata Power Company Ltd CRISIL AA- 2.77Tata Steel Ltd CARE AA 0.96Power Finance Corporation Ltd CRISIL AAA 0.82India Infrastructure Fin Co Ltd CRISIL AAA 0.62The Indian Hotels Company Ltd CARE AA+ 0.12Government Bond 10.589.20% GOI SOVEREIGN 6.658.28% GOI SOVEREIGN 2.068.24% GOI SOVEREIGN 1.158.83% GOI SOVEREIGN 0.358.35% GOI SOVEREIGN 0.158.40% GOI SOVEREIGN 0.118.60% GOI SOVEREIGN 0.098.12% GOI SOVEREIGN 0.02Total Equity 35.51Banks 6.70Kotak Mahindra Bank Ltd 2.31HDFC Bank Ltd 2.27ICICI Bank Ltd 2.12Software 4.41Tata Consultancy Services Ltd 2.12Wipro Ltd 1.18Info Edge (India) Ltd 1.12Finance 4.02HDFC Ltd 1.74Sundaram Finance Ltd 1.48Max India Ltd 0.79
Industrial Capital Goods 2.55Thermax Ltd 1.54Siemens Ltd 1.01Construction Project 2.14Larsen & Toubro Ltd 2.14Pharmaceuticals 1.94Sun Pharmaceuticals Industries Ltd 1.10Lupin Ltd 0.84Auto Ancillaries 1.87Wabco India Ltd 1.02Motherson Sumi Systems Ltd 0.86Auto 1.82Maruti Suzuki India Ltd 1.13Hero MotoCorp Ltd 0.69Industrial Products 1.59Cummins India Ltd 1.59Cement 1.56Ultratech Cement Ltd 0.79The Ramco Cements Ltd 0.76Consumer Non Durables 1.39Jubilant Foodworks Ltd 0.89Asian Paints Ltd 0.50Pesticides 1.07PI Industries Ltd 1.07Power 0.81Torrent Power Ltd 0.81Petroleum Products 0.59Castrol India Ltd 0.59Other Equity (less than 0.50% of the corpus) 3.07Exchange Traded Funds 30.28Axis Gold ETF 30.28Net Current Assets 2.21
Average AUM (` in crores) 456.97
Company Name Rating % of Assets
Company Name Rating % of Assets
6
COMPOSITION BY ASSET (%) COMPOSITION BY RATING (%)@
¢ CRISIL AAA & Equivalent ¢ SOV ¢ CRISIL AA/ CARE AA ¢ CRISIL AA- ¢ CARE AA+
¢ Equity ¢ Exchange Traded Funds ¢ Corporate Bond ¢ Government Bond¢ Total Money Market Instruments^
^ Includes Net Current Assets
35.51%
30.28%
21.42%
10.58%2.21%
16.38%10.58%
4.36%
2.77% 0.12%
FUND STYLE
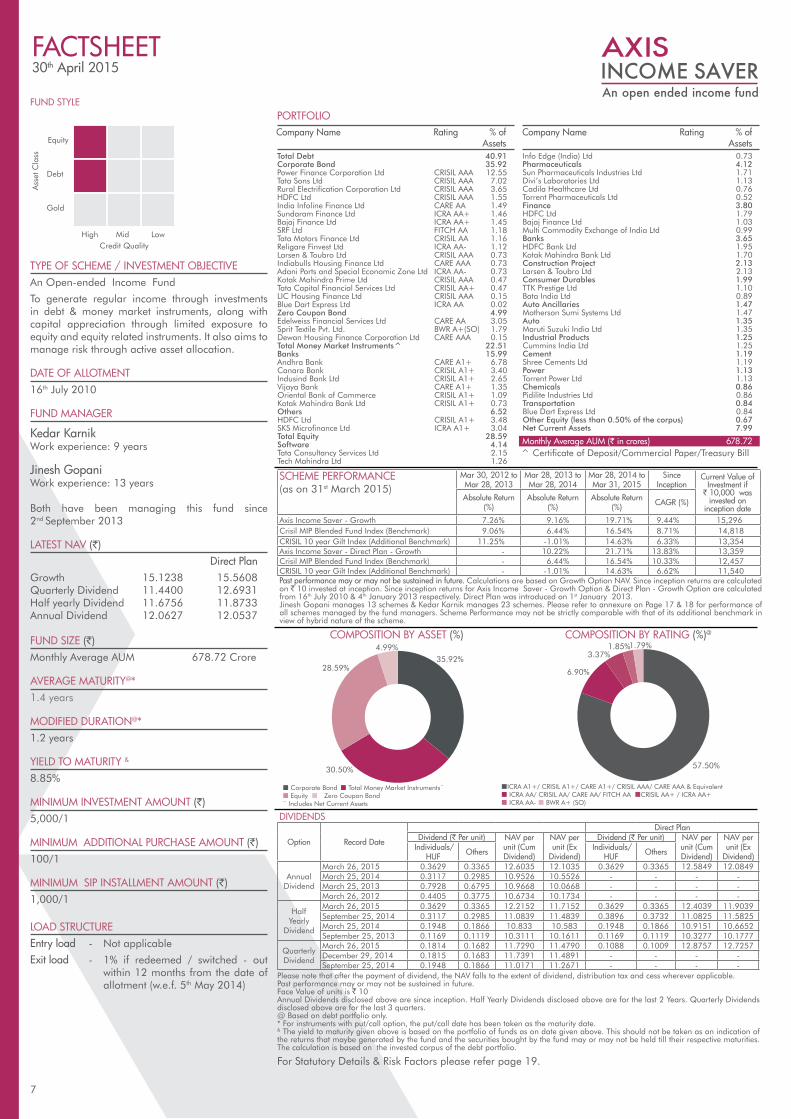
TYPE OF SCHEME / INVESTMENT OBJECTIVEAn Open-ended Income Fund
To generate regular income through investments in debt & money market instruments, along with capital appreciation through limited exposure to equity and equity related instruments. It also aims to manage risk through active asset allocation.
DATE OF ALLOTMENT16th July 2010
FUND MANAGER
Kedar KarnikWork experience: 9 years
Jinesh GopaniWork experience: 13 years
Both have been managing this fund since 2nd September 2013
LATEST NAV (`) Direct PlanGrowth 15.1238 15.5608Quarterly Dividend 11.4400 12.6931Half yearly Dividend 11.6756 11.8733Annual Dividend 12.0627 12.0537
FUND SIZE (`)Monthly Average AUM 678.72 Crore
AVERAGE MATURITY@*1.4 years
MODIFIED DURATION@*1.2 years
YIELD TO MATURITY &
8.85%
MINIMUM INVESTMENT AMOUNT (`)5,000/1
MINIMUM ADDITIONAL PURCHASE AMOUNT (`)100/1
MINIMUM SIP INSTALLMENT AMOUNT (`)1,000/1
LOAD STRUCTUREEntry load - Not applicable
Exit load - 1% if redeemed / switched - out within 12 months from the date of allotment (w.e.f. 5th May 2014)
PORTFOLIO
DIVIDENDS
FACTSHEET30th April 2015
Please note that after the payment of dividend, the NAV falls to the extent of dividend, distribution tax and cess wherever applicable.Past performance may or may not be sustained in future.Face Value of units is ` 10Annual Dividends disclosed above are since inception. Half Yearly Dividends disclosed above are for the last 2 Years. Quarterly Dividends disclosed above are for the last 3 quarters.@ Based on debt portfolio only.* For instruments with put/call option, the put/call date has been taken as the maturity date.& The yield to maturity given above is based on the portfolio of funds as on date given above. This should not be taken as an indication of the returns that maybe generated by the fund and the securities bought by the fund may or may not be held till their respective maturities. The calculation is based on the invested corpus of the debt portfolio.
SCHEME PERFORMANCE (as on 31st March 2015)
Mar 30, 2012 to Mar 28, 2013
Mar 28, 2013 to Mar 28, 2014
Mar 28, 2014 to Mar 31, 2015
Since Inception
Current Value of Investment if
` 10,000 wasinvested on
inception dateAbsolute Return
(%)Absolute Return
(%)Absolute Return
(%) CAGR (%)
Axis Income Saver - Growth 7.26% 9.16% 19.71% 9.44% 15,296Crisil MIP Blended Fund Index (Benchmark) 9.06% 6.44% 16.54% 8.71% 14,818CRISIL 10 year Gilt Index (Additional Benchmark) 11.25% -1.01% 14.63% 6.33% 13,354Axis Income Saver - Direct Plan - Growth - 10.22% 21.71% 13.83% 13,359Crisil MIP Blended Fund Index (Benchmark) - 6.44% 16.54% 10.33% 12,457CRISIL 10 year Gilt Index (Additional Benchmark) - -1.01% 14.63% 6.62% 11,540
For Statutory Details & Risk Factors please refer page 19.
Total Debt 40.91Corporate Bond 35.92Power Finance Corporation Ltd CRISIL AAA 12.55Tata Sons Ltd CRISIL AAA 7.02Rural Electrification Corporation Ltd CRISIL AAA 3.65HDFC Ltd CRISIL AAA 1.55India Infoline Finance Ltd CARE AA 1.49Sundaram Finance Ltd ICRA AA+ 1.46Bajaj Finance Ltd ICRA AA+ 1.45SRF Ltd FITCH AA 1.18Tata Motors Finance Ltd CRISIL AA 1.16Religare Finvest Ltd ICRA AA- 1.12Larsen & Toubro Ltd CRISIL AAA 0.73Indiabulls Housing Finance Ltd CARE AAA 0.73Adani Ports and Special Economic Zone Ltd ICRA AA- 0.73Kotak Mahindra Prime Ltd CRISIL AAA 0.47Tata Capital Financial Services Ltd CRISIL AA+ 0.47LIC Housing Finance Ltd CRISIL AAA 0.15Blue Dart Express Ltd ICRA AA 0.02Zero Coupon Bond 4.99Edelweiss Financial Services Ltd CARE AA 3.05Sprit Textile Pvt. Ltd. BWR A+(SO) 1.79Dewan Housing Finance Corporation Ltd CARE AAA 0.15Total Money Market Instruments^ 22.51Banks 15.99Andhra Bank CARE A1+ 6.78Canara Bank CRISIL A1+ 3.40Indusind Bank Ltd CRISIL A1+ 2.65Vijaya Bank CARE A1+ 1.35Oriental Bank of Commerce CRISIL A1+ 1.09Kotak Mahindra Bank Ltd CRISIL A1+ 0.73Others 6.52HDFC Ltd CRISIL A1+ 3.48SKS Microfinance Ltd ICRA A1+ 3.04Total Equity 28.59Software 4.14Tata Consultancy Services Ltd 2.15Tech Mahindra Ltd 1.26
Info Edge (India) Ltd 0.73Pharmaceuticals 4.12Sun Pharmaceuticals Industries Ltd 1.71Divi’s Laboratories Ltd 1.13Cadila Healthcare Ltd 0.76Torrent Pharmaceuticals Ltd 0.52Finance 3.80HDFC Ltd 1.79Bajaj Finance Ltd 1.03Multi Commodity Exchange of India Ltd 0.99Banks 3.65HDFC Bank Ltd 1.95Kotak Mahindra Bank Ltd 1.70Construction Project 2.13Larsen & Toubro Ltd 2.13Consumer Durables 1.99TTK Prestige Ltd 1.10Bata India Ltd 0.89Auto Ancillaries 1.47Motherson Sumi Systems Ltd 1.47Auto 1.35Maruti Suzuki India Ltd 1.35Industrial Products 1.25Cummins India Ltd 1.25Cement 1.19Shree Cements Ltd 1.19Power 1.13Torrent Power Ltd 1.13Chemicals 0.86Pidilite Industries Ltd 0.86Transportation 0.84Blue Dart Express Ltd 0.84Other Equity (less than 0.50% of the corpus) 0.67Net Current Assets 7.99
Monthly Average AUM (` in crores) 678.72
Company Name Rating % of Assets
Company Name Rating % of Assets
Option Record Date
Direct PlanDividend (` Per unit) NAV per
unit (Cum Dividend)
NAV per unit (Ex
Dividend)
Dividend (` Per unit) NAV per unit (Cum Dividend)
NAV per unit (Ex
Dividend) Individuals/
HUF Others Individuals/HUF Others
Annual Dividend
March 26, 2015 0.3629 0.3365 12.6035 12.1035 0.3629 0.3365 12.5849 12.0849March 25, 2014 0.3117 0.2985 10.9526 10.5526 - - - -March 25, 2013 0.7928 0.6795 10.9668 10.0668 - - - -March 26, 2012 0.4405 0.3775 10.6734 10.1734 - - - -
Half Yearly
Dividend
March 26, 2015 0.3629 0.3365 12.2152 11.7152 0.3629 0.3365 12.4039 11.9039September 25, 2014 0.3117 0.2985 11.0839 11.4839 0.3896 0.3732 11.0825 11.5825March 25, 2014 0.1948 0.1866 10.833 10.583 0.1948 0.1866 10.9151 10.6652September 25, 2013 0.1169 0.1119 10.3111 10.1611 0.1169 0.1119 10.3277 10.1777
QuarterlyDividend
March 26, 2015 0.1814 0.1682 11.7290 11.4790 0.1088 0.1009 12.8757 12.7257December 29, 2014 0.1815 0.1683 11.7391 11.4891 - - - -September 25, 2014 0.1948 0.1866 11.0171 11.2671 - - - -
Past performance may or may not be sustained in future. Calculations are based on Growth Option NAV. Since inception returns are calculated on ` 10 invested at inception. Since inception returns for Axis Income Saver - Growth Option & Direct Plan - Growth Option are calculated from 16th July 2010 & 4th January 2013 respectively. Direct Plan was introduced on 1st January 2013.Jinesh Gopani manages 13 schemes & Kedar Karnik manages 23 schemes. Please refer to annexure on Page 17 & 18 for performance of all schemes managed by the fund managers. Scheme Performance may not be strictly comparable with that of its additional benchmark in view of hybrid nature of the scheme.
^ Certificate of Deposit/Commercial Paper/Treasury Bill
Equity
Ass
et C
lass
Credit Quality
Debt
Gold
High Mid Low
7
COMPOSITION BY ASSET (%) COMPOSITION BY RATING (%)@
¢ICRA A1+/ CRISIL A1+/ CARE A1+/ CRISIL AAA/ CARE AAA & Equivalent ¢ ICRA AA/ CRISIL AA/ CARE AA/ FITCH AA ¢CRISIL AA+ / ICRA AA+¢ ICRA AA- ¢ BWR A+ (SO)
¢ Corporate Bond ¢ Total Money Market Instruments^
¢ Equity ¢ Zero Coupon Bond ^ Includes Net Current Assets
28.59%
30.50%
35.92%4.99%
57.50%
6.90%
3.37%1.85%1.79%
FUND STYLE
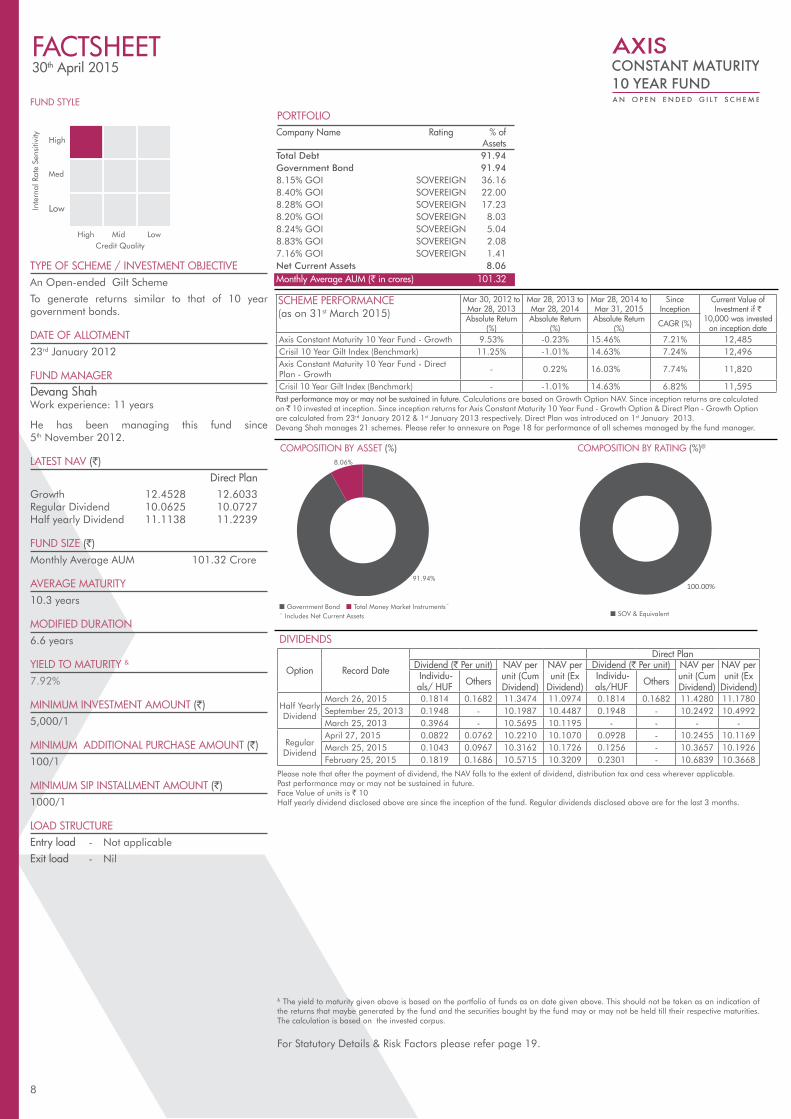
TYPE OF SCHEME / INVESTMENT OBJECTIVEAn Open-ended Gilt Scheme
To generate returns similar to that of 10 year government bonds.
DATE OF ALLOTMENT23rd January 2012
FUND MANAGERDevang ShahWork experience: 11 years
He has been managing this fund since 5th November 2012.
LATEST NAV (`) Direct PlanGrowth 12.4528 12.6033Regular Dividend 10.0625 10.0727Half yearly Dividend 11.1138 11.2239
FUND SIZE (`)Monthly Average AUM 101.32 Crore
AVERAGE MATURITY10.3 years
MODIFIED DURATION6.6 years
YIELD TO MATURITY &
7.92%
MINIMUM INVESTMENT AMOUNT (`)5,000/1
MINIMUM ADDITIONAL PURCHASE AMOUNT (`)100/1
MINIMUM SIP INSTALLMENT AMOUNT (`)1000/1
LOAD STRUCTUREEntry load - Not applicable
Exit load - Nil
PORTFOLIO
FACTSHEET30th April 2015
High
Inte
rnal
Rat
e Se
nsiti
vity
Credit Quality
Med
Low
High Mid Low
& The yield to maturity given above is based on the portfolio of funds as on date given above. This should not be taken as an indication of the returns that maybe generated by the fund and the securities bought by the fund may or may not be held till their respective maturities. The calculation is based on the invested corpus.
SCHEME PERFORMANCE (as on 31st March 2015)
Mar 30, 2012 to Mar 28, 2013
Mar 28, 2013 to Mar 28, 2014
Mar 28, 2014 to Mar 31, 2015
Since Inception
Current Value of Investment if `
10,000 was invested on inception date
Absolute Return (%)
Absolute Return (%)
Absolute Return (%) CAGR (%)
Axis Constant Maturity 10 Year Fund - Growth 9.53% -0.23% 15.46% 7.21% 12,485Crisil 10 Year Gilt Index (Benchmark) 11.25% -1.01% 14.63% 7.24% 12,496Axis Constant Maturity 10 Year Fund - Direct Plan - Growth
- 0.22% 16.03% 7.74% 11,820
Crisil 10 Year Gilt Index (Benchmark) - -1.01% 14.63% 6.82% 11,595
For Statutory Details & Risk Factors please refer page 19.
Company Name Rating % of Assets Total Debt 91.94Government Bond 91.948.15% GOI SOVEREIGN 36.168.40% GOI SOVEREIGN 22.008.28% GOI SOVEREIGN 17.238.20% GOI SOVEREIGN 8.038.24% GOI SOVEREIGN 5.048.83% GOI SOVEREIGN 2.087.16% GOI SOVEREIGN 1.41Net Current Assets 8.06Monthly Average AUM (` in crores) 101.32
DIVIDENDS
Please note that after the payment of dividend, the NAV falls to the extent of dividend, distribution tax and cess wherever applicable.Past performance may or may not be sustained in future.Face Value of units is ` 10Half yearly dividend disclosed above are since the inception of the fund. Regular dividends disclosed above are for the last 3 months.
Option Record Date
Direct PlanDividend (` Per unit) NAV per
unit (Cum Dividend)
NAV per unit (Ex
Dividend)
Dividend (` Per unit) NAV per unit (Cum Dividend)
NAV per unit (Ex
Dividend) Individu-als/ HUF Others Individu-
als/HUF Others
Half Yearly Dividend
March 26, 2015 0.1814 0.1682 11.3474 11.0974 0.1814 0.1682 11.4280 11.1780September 25, 2013 0.1948 - 10.1987 10.4487 0.1948 - 10.2492 10.4992 March 25, 2013 0.3964 - 10.5695 10.1195 - - - -
RegularDividend
April 27, 2015 0.0822 0.0762 10.2210 10.1070 0.0928 - 10.2455 10.1169March 25, 2015 0.1043 0.0967 10.3162 10.1726 0.1256 - 10.3657 10.1926February 25, 2015 0.1819 0.1686 10.5715 10.3209 0.2301 - 10.6839 10.3668
Past performance may or may not be sustained in future. Calculations are based on Growth Option NAV. Since inception returns are calculated on ̀ 10 invested at inception. Since inception returns for Axis Constant Maturity 10 Year Fund - Growth Option & Direct Plan - Growth Option are calculated from 23rd January 2012 & 1st January 2013 respectively. Direct Plan was introduced on 1st January 2013.Devang Shah manages 21 schemes. Please refer to annexure on Page 18 for performance of all schemes managed by the fund manager.
8
COMPOSITION BY ASSET (%) COMPOSITION BY RATING (%)@
¢ SOV & Equivalent ¢ Government Bond ¢ Total Money Market Instruments^ ^ Includes Net Current Assets
91.94%
8.06%
100.00%
FUND STYLE
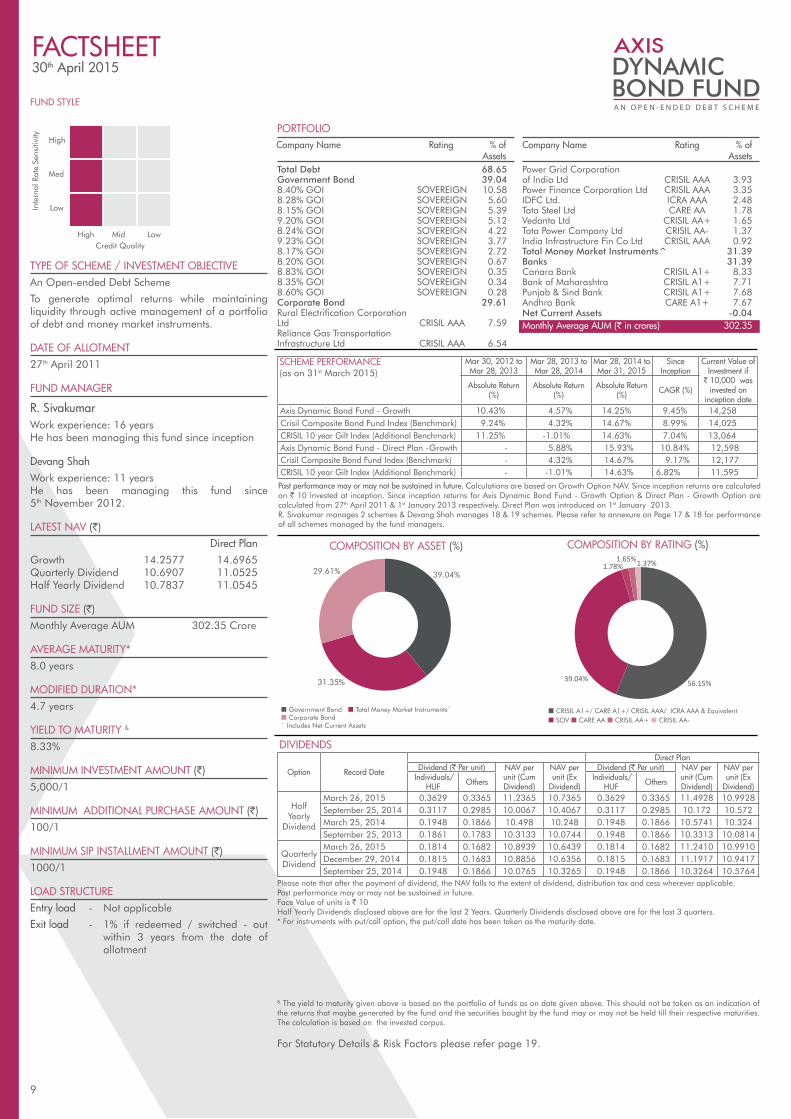
TYPE OF SCHEME / INVESTMENT OBJECTIVEAn Open-ended Debt Scheme
To generate optimal returns while maintaining liquidity through active management of a portfolio of debt and money market instruments.
DATE OF ALLOTMENT27th April 2011
FUND MANAGER
R. SivakumarWork experience: 16 yearsHe has been managing this fund since inception
Devang ShahWork experience: 11 yearsHe has been managing this fund since 5th November 2012.
LATEST NAV (`) Direct PlanGrowth 14.2577 14.6965 Quarterly Dividend 10.6907 11.0525 Half Yearly Dividend 10.7837 11.0545
FUND SIZE (`) Monthly Average AUM 302.35 Crore
AVERAGE MATURITY*8.0 years
MODIFIED DURATION*4.7 years
YIELD TO MATURITY &
8.33%
MINIMUM INVESTMENT AMOUNT (`)5,000/1
MINIMUM ADDITIONAL PURCHASE AMOUNT (`)100/1
MINIMUM SIP INSTALLMENT AMOUNT (`)1000/1
LOAD STRUCTUREEntry load - Not applicable
Exit load - 1% if redeemed / switched - out within 3 years from the date of allotment
PORTFOLIO
FACTSHEET30th April 2015
High
Inte
rnal
Rat
e Se
nsiti
vity
Credit Quality
Med
Low
High Mid Low
SCHEME PERFORMANCE (as on 31st March 2015)
Mar 30, 2012 to Mar 28, 2013
Mar 28, 2013 to Mar 28, 2014
Mar 28, 2014 to Mar 31, 2015
Since Inception
Current Value of Investment if
` 10,000 wasinvested on
inception date
Absolute Return (%)
Absolute Return (%)
Absolute Return (%) CAGR (%)
Axis Dynamic Bond Fund - Growth 10.43% 4.57% 14.25% 9.45% 14,258Crisil Composite Bond Fund Index (Benchmark) 9.24% 4.32% 14.67% 8.99% 14,025CRISIL 10 year Gilt Index (Additional Benchmark) 11.25% -1.01% 14.63% 7.04% 13,064Axis Dynamic Bond Fund - Direct Plan -Growth - 5.88% 15.93% 10.84% 12,598Crisil Composite Bond Fund Index (Benchmark) - 4.32% 14.67% 9.17% 12,177CRISIL 10 year Gilt Index (Additional Benchmark) - -1.01% 14.63% 6.82% 11,595
For Statutory Details & Risk Factors please refer page 19.
Total Debt 68.65Government Bond 39.048.40% GOI SOVEREIGN 10.588.28% GOI SOVEREIGN 5.608.15% GOI SOVEREIGN 5.399.20% GOI SOVEREIGN 5.128.24% GOI SOVEREIGN 4.229.23% GOI SOVEREIGN 3.778.17% GOI SOVEREIGN 2.728.20% GOI SOVEREIGN 0.678.83% GOI SOVEREIGN 0.358.35% GOI SOVEREIGN 0.348.60% GOI SOVEREIGN 0.28Corporate Bond 29.61Rural Electrification Corporation Ltd CRISIL AAA 7.59Reliance Gas Transportation Infrastructure Ltd CRISIL AAA 6.54
Power Grid Corporation of India Ltd CRISIL AAA 3.93Power Finance Corporation Ltd CRISIL AAA 3.35IDFC Ltd. ICRA AAA 2.48Tata Steel Ltd CARE AA 1.78Vedanta Ltd CRISIL AA+ 1.65Tata Power Company Ltd CRISIL AA- 1.37India Infrastructure Fin Co Ltd CRISIL AAA 0.92Total Money Market Instruments^ 31.39Banks 31.39Canara Bank CRISIL A1+ 8.33Bank of Maharashtra CRISIL A1+ 7.71Punjab & Sind Bank CRISIL A1+ 7.68Andhra Bank CARE A1+ 7.67Net Current Assets -0.04Monthly Average AUM (` in crores) 302.35
Company Name Rating % of Assets
Company Name Rating % of Assets
& The yield to maturity given above is based on the portfolio of funds as on date given above. This should not be taken as an indication of the returns that maybe generated by the fund and the securities bought by the fund may or may not be held till their respective maturities. The calculation is based on the invested corpus.
DIVIDENDS
Please note that after the payment of dividend, the NAV falls to the extent of dividend, distribution tax and cess wherever applicable.Past performance may or may not be sustained in future.Face Value of units is ` 10Half Yearly Dividends disclosed above are for the last 2 Years. Quarterly Dividends disclosed above are for the last 3 quarters.* For instruments with put/call option, the put/call date has been taken as the maturity date.
Option Record Date
Direct PlanDividend (` Per unit) NAV per
unit (Cum Dividend)
NAV per unit (Ex
Dividend)
Dividend (` Per unit) NAV per unit (Cum Dividend)
NAV per unit (Ex
Dividend) Individuals/
HUF Others Individuals/HUF Others
Half Yearly
Dividend
March 26, 2015 0.3629 0.3365 11.2365 10.7365 0.3629 0.3365 11.4928 10.9928September 25, 2014 0.3117 0.2985 10.0067 10.4067 0.3117 0.2985 10.172 10.572March 25, 2014 0.1948 0.1866 10.498 10.248 0.1948 0.1866 10.5741 10.324September 25, 2013 0.1861 0.1783 10.3133 10.0744 0.1948 0.1866 10.3313 10.0814
QuarterlyDividend
March 26, 2015 0.1814 0.1682 10.8939 10.6439 0.1814 0.1682 11.2410 10.9910December 29, 2014 0.1815 0.1683 10.8856 10.6356 0.1815 0.1683 11.1917 10.9417September 25, 2014 0.1948 0.1866 10.0765 10.3265 0.1948 0.1866 10.3264 10.5764
Past performance may or may not be sustained in future. Calculations are based on Growth Option NAV. Since inception returns are calculated on ` 10 invested at inception. Since inception returns for Axis Dynamic Bond Fund - Growth Option & Direct Plan - Growth Option are calculated from 27th April 2011 & 1st January 2013 respectively. Direct Plan was introduced on 1st January 2013.R. Sivakumar manages 2 schemes & Devang Shah manages 18 & 19 schemes. Please refer to annexure on Page 17 & 18 for performance of all schemes managed by the fund managers.
9
COMPOSITION BY ASSET (%) COMPOSITION BY RATING (%)
¢ CRISIL A1+/ CARE A1+/ CRISIL AAA/ ICRA AAA & Equivalent ¢ SOV ¢ CARE AA ¢ CRISIL AA+ ¢ CRISIL AA-
¢ Government Bond ¢ Total Money Market Instruments^ ¢ Corporate Bond^ Includes Net Current Assets
39.04%
31.35%
29.61%
56.15%39.04%
1.78%
1.65%1.37%
FUND STYLE
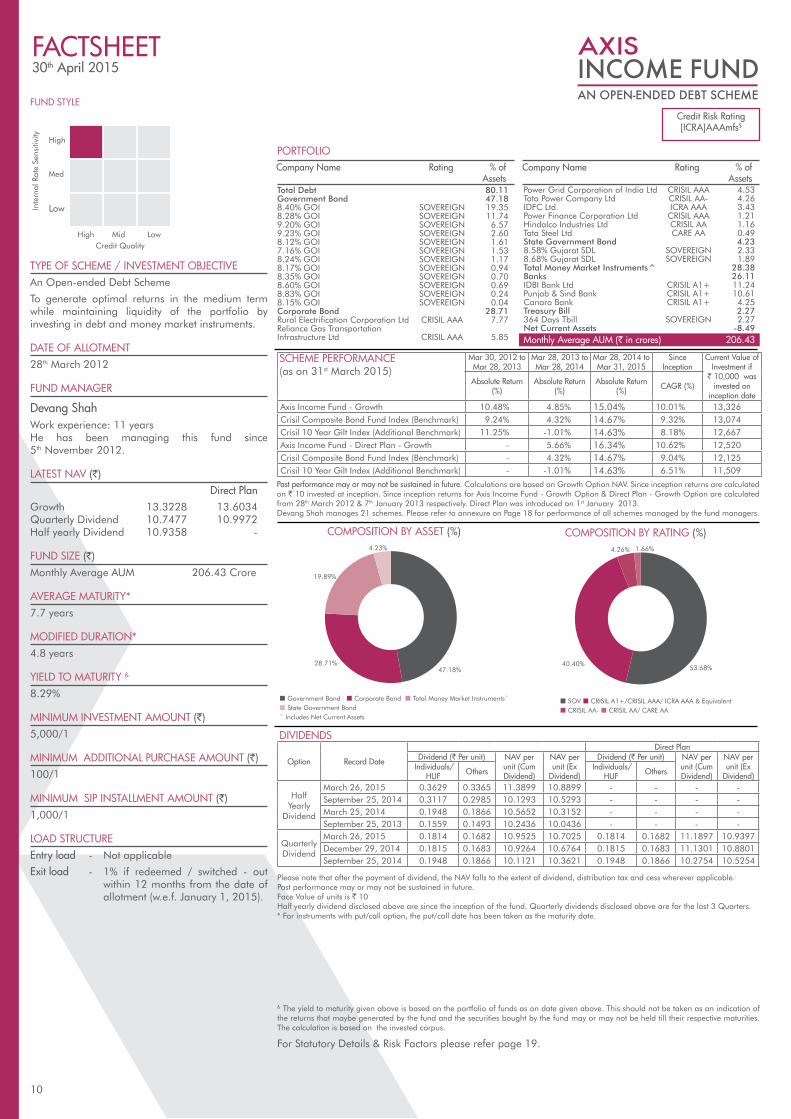
TYPE OF SCHEME / INVESTMENT OBJECTIVEAn Open-ended Debt Scheme
To generate optimal returns in the medium term while maintaining liquidity of the portfolio by investing in debt and money market instruments.
DATE OF ALLOTMENT28th March 2012
FUND MANAGER
Devang ShahWork experience: 11 yearsHe has been managing this fund since 5th November 2012.
LATEST NAV (`) Direct PlanGrowth 13.3228 13.6034 Quarterly Dividend 10.7477 10.9972 Half yearly Dividend 10.9358 -
FUND SIZE (`)Monthly Average AUM 206.43 Crore
AVERAGE MATURITY*7.7 years
MODIFIED DURATION*4.8 years
YIELD TO MATURITY &
8.29%
MINIMUM INVESTMENT AMOUNT (`)5,000/1
MINIMUM ADDITIONAL PURCHASE AMOUNT (`)100/1
MINIMUM SIP INSTALLMENT AMOUNT (`)1,000/1
LOAD STRUCTUREEntry load - Not applicable
Exit load - 1% if redeemed / switched - out within 12 months from the date of allotment (w.e.f. January 1, 2015).
PORTFOLIO
DIVIDENDS
FACTSHEET30th April 2015
High
Inte
rnal
Rat
e Se
nsiti
vity
Credit Quality
Med
Low
High Mid Low
& The yield to maturity given above is based on the portfolio of funds as on date given above. This should not be taken as an indication of the returns that maybe generated by the fund and the securities bought by the fund may or may not be held till their respective maturities. The calculation is based on the invested corpus.
SCHEME PERFORMANCE (as on 31st March 2015)
Mar 30, 2012 to Mar 28, 2013
Mar 28, 2013 to Mar 28, 2014
Mar 28, 2014 to Mar 31, 2015
Since Inception
Current Value of Investment if
` 10,000 wasinvested on
inception date
Absolute Return (%)
Absolute Return (%)
Absolute Return (%) CAGR (%)
Axis Income Fund - Growth 10.48% 4.85% 15.04% 10.01% 13,326Crisil Composite Bond Fund Index (Benchmark) 9.24% 4.32% 14.67% 9.32% 13,074Crisil 10 Year Gilt Index (Additional Benchmark) 11.25% -1.01% 14.63% 8.18% 12,667Axis Income Fund - Direct Plan - Growth - 5.66% 16.34% 10.62% 12,520Crisil Composite Bond Fund Index (Benchmark) - 4.32% 14.67% 9.04% 12,125Crisil 10 Year Gilt Index (Additional Benchmark) - -1.01% 14.63% 6.51% 11,509
For Statutory Details & Risk Factors please refer page 19.
Total Debt 80.11Government Bond 47.188.40% GOI SOVEREIGN 19.358.28% GOI SOVEREIGN 11.749.20% GOI SOVEREIGN 6.579.23% GOI SOVEREIGN 2.608.12% GOI SOVEREIGN 1.617.16% GOI SOVEREIGN 1.538.24% GOI SOVEREIGN 1.178.17% GOI SOVEREIGN 0.948.35% GOI SOVEREIGN 0.708.60% GOI SOVEREIGN 0.698.83% GOI SOVEREIGN 0.248.15% GOI SOVEREIGN 0.04Corporate Bond 28.71Rural Electrification Corporation Ltd CRISIL AAA 7.77Reliance Gas Transportation Infrastructure Ltd CRISIL AAA 5.85
Company Name Rating % of Assets
Company Name Rating % of Assets
Option Record Date
Direct PlanDividend (` Per unit) NAV per
unit (Cum Dividend)
NAV per unit (Ex
Dividend)
Dividend (` Per unit) NAV per unit (Cum Dividend)
NAV per unit (Ex
Dividend) Individuals/
HUF Others Individuals/HUF Others
Half Yearly
Dividend
March 26, 2015 0.3629 0.3365 11.3899 10.8899 - - - -September 25, 2014 0.3117 0.2985 10.1293 10.5293 - - - -March 25, 2014 0.1948 0.1866 10.5652 10.3152 - - - -September 25, 2013 0.1559 0.1493 10.2436 10.0436 - - - -
QuarterlyDividend
March 26, 2015 0.1814 0.1682 10.9525 10.7025 0.1814 0.1682 11.1897 10.9397December 29, 2014 0.1815 0.1683 10.9264 10.6764 0.1815 0.1683 11.1301 10.8801September 25, 2014 0.1948 0.1866 10.1121 10.3621 0.1948 0.1866 10.2754 10.5254
Past performance may or may not be sustained in future. Calculations are based on Growth Option NAV. Since inception returns are calculated on ` 10 invested at inception. Since inception returns for Axis Income Fund - Growth Option & Direct Plan - Growth Option are calculated from 28th March 2012 & 7th January 2013 respectively. Direct Plan was introduced on 1st January 2013.Devang Shah manages 21 schemes. Please refer to annexure on Page 18 for performance of all schemes managed by the fund managers.
Credit Risk Rating[ICRA]AAAmfs$
Please note that after the payment of dividend, the NAV falls to the extent of dividend, distribution tax and cess wherever applicable.Past performance may or may not be sustained in future.Face Value of units is ` 10Half yearly dividend disclosed above are since the inception of the fund. Quarterly dividends disclosed above are for the last 3 Quarters.* For instruments with put/call option, the put/call date has been taken as the maturity date.
10
COMPOSITION BY ASSET (%) COMPOSITION BY RATING (%)
¢ SOV ¢ CRISIL A1+/CRISIL AAA/ ICRA AAA & Equivalent ¢ CRISIL AA- ¢ CRISIL AA/ CARE AA
¢ Government Bond ¢ Corporate Bond ¢ Total Money Market Instruments^ ¢ State Government Bond^ Includes Net Current Assets
Power Grid Corporation of India Ltd CRISIL AAA 4.53Tata Power Company Ltd CRISIL AA- 4.26IDFC Ltd. ICRA AAA 3.43Power Finance Corporation Ltd CRISIL AAA 1.21Hindalco Industries Ltd CRISIL AA 1.16Tata Steel Ltd CARE AA 0.49State Government Bond 4.238.58% Gujarat SDL SOVEREIGN 2.338.68% Gujarat SDL SOVEREIGN 1.89Total Money Market Instruments^ 28.38Banks 26.11IDBI Bank Ltd CRISIL A1+ 11.24Punjab & Sind Bank CRISIL A1+ 10.61Canara Bank CRISIL A1+ 4.25Treasury Bill 2.27364 Days Tbill SOVEREIGN 2.27Net Current Assets -8.49Monthly Average AUM (` in crores) 206.43
28.71%
19.89%
4.23%
47.18% 53.68%40.40%
4.26% 1.66%
TYPE OF SCHEME / INVESTMENT OBJECTIVEAn Open-ended Debt Scheme)
To generate stable returns by investing in debt & money market instruments across the yield curve & credit spectrum. However, there is no assurance or guarantee that the investment objective of the Scheme will be achieved. The Scheme does not assure or guarantee any returns. However, there is no assurance or guarantee that the investment objective of the Scheme will be achieved. The Scheme does not assure or guarantee any returns.
DATE OF ALLOTMENT15th July 2014
FUND MANAGER
Devang ShahWork experience: 11 years
Kedar KarnikWork experience: 9 years
Both have been managing this fund since inception.
LATEST NAV (`) Direct PlanGrowth 10.8724 10.9398Weekly Dividend 10.1381 10.1496Monthly Dividend 10.0548 10.0584
FUND SIZE (`)Monthly Average AUM 111.29 Crore
AVERAGE MATURITY*3.2 years
MODIFIED DURATION*2.5 years
YIELD TO MATURITY&
9.07%
MINIMUM INVESTMENT AMOUNT (`)5,000/1
MINIMUM ADDITIONAL PURCHASE AMOUNT (`)1000/1
MINIMUM SIP INSTALLMENT AMOUNT (`)1000/1
LOAD STRUCTUREEntry load - NA
Exit load - 1% if units are redeemed/ switched out within 1 year from the date of allotment. 0.50% if units are redeemed/ switched out within 1 - 2 years from the date of allotment. (w.e.f. 17th September 2014)
FACTSHEET30th April 2015
& The yield to maturity given above is based on the portfolio of funds as on date given above. This should not be taken as an indication of the returns that maybe generated by the fund and the securities bought by the fund may or may not be held till their respective maturities. The calculation is based on the invested corpus of the debt portfolio.
* For instruments with put/call option, the put/call date has been taken as the maturity date.
For Statutory Details & Risk Factors please refer page 19.
11
AXIS FIXED INCOME
OPPORTUNIT I ES
FUND
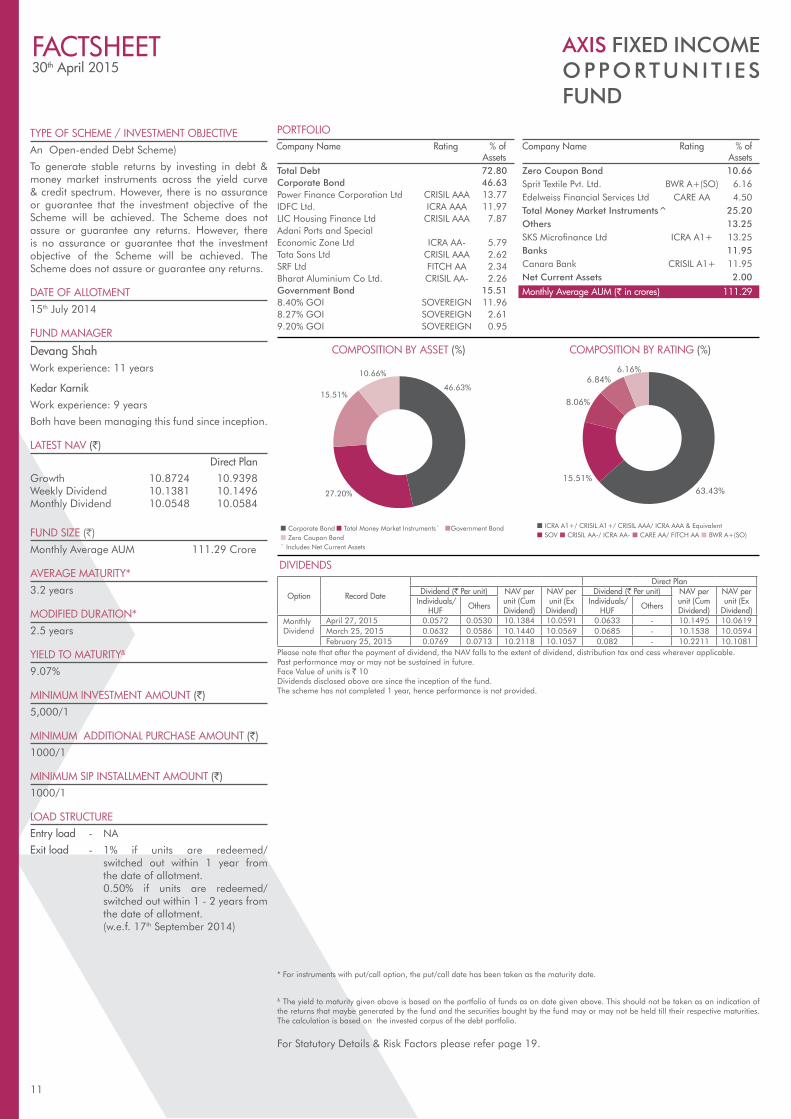
PORTFOLIOCompany Name Rating % of Assets Total Debt 72.80Corporate Bond 46.63Power Finance Corporation Ltd CRISIL AAA 13.77IDFC Ltd. ICRA AAA 11.97LIC Housing Finance Ltd CRISIL AAA 7.87Adani Ports and Special Economic Zone Ltd ICRA AA- 5.79Tata Sons Ltd CRISIL AAA 2.62SRF Ltd FITCH AA 2.34Bharat Aluminium Co Ltd. CRISIL AA- 2.26Government Bond 15.518.40% GOI SOVEREIGN 11.968.27% GOI SOVEREIGN 2.619.20% GOI SOVEREIGN 0.95
DIVIDENDS
Option Record Date
Direct PlanDividend (` Per unit) NAV per
unit (Cum Dividend)
NAV per unit (Ex
Dividend)
Dividend (` Per unit) NAV per unit (Cum Dividend)
NAV per unit (Ex
Dividend) Individuals/
HUF Others Individuals/HUF Others
Monthly Dividend
April 27, 2015 0.0572 0.0530 10.1384 10.0591 0.0633 - 10.1495 10.0619March 25, 2015 0.0632 0.0586 10.1440 10.0569 0.0685 - 10.1538 10.0594February 25, 2015 0.0769 0.0713 10.2118 10.1057 0.082 - 10.2211 10.1081
Company Name Rating % of Assets Zero Coupon Bond 10.66Sprit Textile Pvt. Ltd. BWR A+(SO) 6.16Edelweiss Financial Services Ltd CARE AA 4.50Total Money Market Instruments^ 25.20Others 13.25SKS Microfinance Ltd ICRA A1+ 13.25Banks 11.95Canara Bank CRISIL A1+ 11.95Net Current Assets 2.00
Monthly Average AUM (` in crores) 111.29
Please note that after the payment of dividend, the NAV falls to the extent of dividend, distribution tax and cess wherever applicable.Past performance may or may not be sustained in future. Face Value of units is ` 10Dividends disclosed above are since the inception of the fund. The scheme has not completed 1 year, hence performance is not provided.
COMPOSITION BY ASSET (%) COMPOSITION BY RATING (%)
¢ ICRA A1+/ CRISIL A1+/ CRISIL AAA/ ICRA AAA & Equivalent ¢ SOV ¢ CRISIL AA-/ ICRA AA- ¢ CARE AA/ FITCH AA ¢ BWR A+(SO)
¢ Corporate Bond ¢ Total Money Market Instruments^ ¢Government Bond¢ Zero Coupon Bond ^ Includes Net Current Assets
46.63%
27.20%
15.51%
10.66%
63.43%15.51%
8.06%
6.84%6.16%
FUND STYLE
TYPE OF SCHEME / INVESTMENT OBJECTIVEAn Open-ended Debt Scheme
To generate stable returns with a low risk strategy while maintaining liquidity through a portfolio comprising of debt and money market instruments. However, there can be no assurance that the investment objective of the scheme will be achieved.
DATE OF ALLOTMENT22nd January 2010
FUND MANAGER
Devang ShahWork experience: 11 years
He has been managing this fund since 5th November 2012.
LATEST NAV (`) Direct Plan Retail PlanGrowth 15.1784 15.4772 15.0071Regular Dividend 10.1540 - -Monthly Dividend 10.1677 10.2156 10.0447Bonus 15.1810 - -Weekly Dividend 10.1402 10.2417 10.1468
FUND SIZE (`)Monthly Average AUM 1,424.83 Crore
AVERAGE MATURITY*2.5 years
MODIFIED DURATION*2.0 years
YIELD TO MATURITY &
8.56%
MINIMUM INVESTMENT AMOUNT (`)5,000/1
MINIMUM ADDITIONAL PURCHASE AMOUNT (`)1,000/1
MINIMUM SIP INSTALLMENT AMOUNT (`)1000/1
LOAD STRUCTUREEntry load - Not applicable
Exit load - 0.25% if units are redeemed/ switched out within 1 month from the date of allotment. (w.e.f. 17th September 2014)
PORTFOLIO
DIVIDENDS
FACTSHEET30th April 2015
High
Inte
rnal
Rat
e Se
nsiti
vity
Credit Quality
Med
Low
High Mid Low
& The yield to maturity given above is based on the portfolio of funds as on date given above. This should not be taken as an indication of the returns that maybe generated by the fund and the securities bought by the fund may or may not be held till their respective maturities. The calculation is based on the invested corpus.
SCHEME PERFORMANCE (as on 31st March 2015)
Mar 30, 2012 to Mar 28, 2013
Mar 28, 2013 to Mar 28, 2014
Mar 28, 2014 to Mar 31, 2015
Since Inception
Current Value of Investment if
` 10,000 wasinvested on
inception date
Absolute Return (%)
Absolute Return (%)
Absolute Return (%) CAGR (%)
Axis Short Term Fund - Growth 10.10% 7.61% 9.96% 8.27% 15,103Crisil Short Term Bond Fund Index (Benchmark) 9.05% 8.78% 10.40% 8.17% 15,029Crisil 1 Year T-Bill Index (Additional Benchmark) 8.33% 5.77% 8.82% 6.51% 13,872Axis Short Term Fund - Direct Plan - Growth - 8.51% 10.92% 9.62% 12,289Crisil Short Term Bond Fund Index (Benchmark) - 8.78% 10.40% 9.43% 12,240Crisil 1 Year T-Bill Index (Additional Benchmark) - 5.77% 8.82% 7.42% 11,743Axis Short Term Fund - Retail Plan - Growth 9.70% 7.62% 10.00% 8.21% 14,933Crisil Short Term Bond Fund Index (Benchmark) 9.05% 8.78% 10.40% 8.30% 14,998Crisil 1 Year T-Bill Index (Additional Benchmark) 8.33% 5.77% 8.82% 6.60% 13,838
For Statutory Details & Risk Factors please refer page 19.
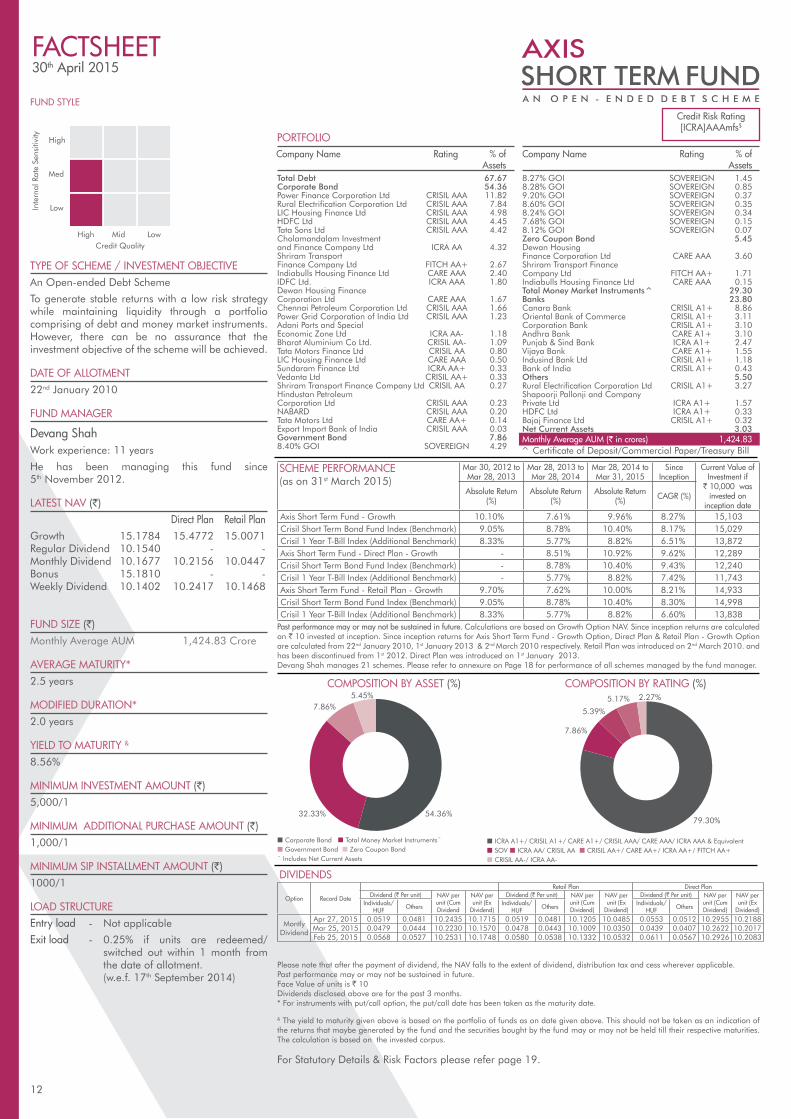
Total Debt 67.67Corporate Bond 54.36Power Finance Corporation Ltd CRISIL AAA 11.82Rural Electrification Corporation Ltd CRISIL AAA 7.84LIC Housing Finance Ltd CRISIL AAA 4.98HDFC Ltd CRISIL AAA 4.45Tata Sons Ltd CRISIL AAA 4.42Cholamandalam Investment and Finance Company Ltd ICRA AA 4.32Shriram Transport Finance Company Ltd FITCH AA+ 2.67Indiabulls Housing Finance Ltd CARE AAA 2.40IDFC Ltd. ICRA AAA 1.80Dewan Housing Finance Corporation Ltd CARE AAA 1.67Chennai Petroleum Corporation Ltd CRISIL AAA 1.66Power Grid Corporation of India Ltd CRISIL AAA 1.23Adani Ports and Special Economic Zone Ltd ICRA AA- 1.18Bharat Aluminium Co Ltd. CRISIL AA- 1.09Tata Motors Finance Ltd CRISIL AA 0.80LIC Housing Finance Ltd CARE AAA 0.50Sundaram Finance Ltd ICRA AA+ 0.33Vedanta Ltd CRISIL AA+ 0.33Shriram Transport Finance Company Ltd CRISIL AA 0.27Hindustan Petroleum Corporation Ltd CRISIL AAA 0.23NABARD CRISIL AAA 0.20Tata Motors Ltd CARE AA+ 0.14Export Import Bank of India CRISIL AAA 0.03Government Bond 7.868.40% GOI SOVEREIGN 4.29
8.27% GOI SOVEREIGN 1.458.28% GOI SOVEREIGN 0.859.20% GOI SOVEREIGN 0.378.60% GOI SOVEREIGN 0.358.24% GOI SOVEREIGN 0.347.68% GOI SOVEREIGN 0.158.12% GOI SOVEREIGN 0.07Zero Coupon Bond 5.45Dewan Housing Finance Corporation Ltd CARE AAA 3.60Shriram Transport Finance Company Ltd FITCH AA+ 1.71Indiabulls Housing Finance Ltd CARE AAA 0.15Total Money Market Instruments^ 29.30Banks 23.80Canara Bank CRISIL A1+ 8.86Oriental Bank of Commerce CRISIL A1+ 3.11Corporation Bank CRISIL A1+ 3.10Andhra Bank CARE A1+ 3.10Punjab & Sind Bank ICRA A1+ 2.47Vijaya Bank CARE A1+ 1.55Indusind Bank Ltd CRISIL A1+ 1.18Bank of India CRISIL A1+ 0.43Others 5.50Rural Electrification Corporation Ltd CRISIL A1+ 3.27Shapoorji Pallonji and Company Private Ltd ICRA A1+ 1.57HDFC Ltd ICRA A1+ 0.33Bajaj Finance Ltd CRISIL A1+ 0.32Net Current Assets 3.03Monthly Average AUM (` in crores) 1,424.83
Company Name Rating % of Assets
Company Name Rating % of Assets
Past performance may or may not be sustained in future. Calculations are based on Growth Option NAV. Since inception returns are calculated on ` 10 invested at inception. Since inception returns for Axis Short Term Fund - Growth Option, Direct Plan & Retail Plan - Growth Option are calculated from 22nd January 2010, 1st January 2013 & 2nd March 2010 respectively. Retail Plan was introduced on 2nd March 2010. and has been discontinued from 1st 2012. Direct Plan was introduced on 1st January 2013.Devang Shah manages 21 schemes. Please refer to annexure on Page 18 for performance of all schemes managed by the fund manager.
Credit Risk Rating[ICRA]AAAmfs$
Option Record Date
Retail Plan Direct PlanDividend (` Per unit) NAV per
unit (Cum Dividend
NAV per unit (Ex
Dividend)
Dividend (` Per unit) NAV per unit (Cum Dividend)
NAV per unit (Ex
Dividend)
Dividend (` Per unit) NAV per unit (Cum Dividend)
NAV per unit (Ex
Dividend)Individuals/
HUF Others Individuals/ HUF Others Individuals/
HUF Others
MontlyDividend
Apr 27, 2015 0.0519 0.0481 10.2435 10.1715 0.0519 0.0481 10.1205 10.0485 0.0553 0.0512 10.2955 10.2188Mar 25, 2015 0.0479 0.0444 10.2230 10.1570 0.0478 0.0443 10.1009 10.0350 0.0439 0.0407 10.2622 10.2017Feb 25, 2015 0.0568 0.0527 10.2531 10.1748 0.0580 0.0538 10.1332 10.0532 0.0611 0.0567 10.2926 10.2083
^ Certificate of Deposit/Commercial Paper/Treasury Bill
Please note that after the payment of dividend, the NAV falls to the extent of dividend, distribution tax and cess wherever applicable.Past performance may or may not be sustained in future.Face Value of units is ` 10Dividends disclosed above are for the past 3 months. * For instruments with put/call option, the put/call date has been taken as the maturity date.
12
COMPOSITION BY ASSET (%) COMPOSITION BY RATING (%)
¢ ICRA A1+/ CRISIL A1+/ CARE A1+/ CRISIL AAA/ CARE AAA/ ICRA AAA & Equivalent¢ SOV ¢ ICRA AA/ CRISIL AA ¢ CRISIL AA+/ CARE AA+/ ICRA AA+/ FITCH AA+¢ CRISIL AA-/ ICRA AA-
¢ Corporate Bond ¢ Total Money Market Instruments^ ¢ Government Bond ¢ Zero Coupon Bond ^ Includes Net Current Assets
54.36%32.33%
7.86%5.45%
79.30%
7.86%
5.39%
5.17% 2.27%
FUND STYLE
TYPE OF SCHEME / INVESTMENT OBJECTIVEAn Open-ended Debt Scheme
To generate stable returns by investing predominantly in debt & money market instruments issued by banks.
DATE OF ALLOTMENT8th June 2012
FUND MANAGER
Kedar KarnikWork experience: 9 years
He has been managing this fund since 5th November 2012.
LATEST NAV (`) Direct PlanGrowth 1284.7615 1290.3256Daily Dividend 1005.1709 1005.1755Weekly Dividend 1004.6668 1004.6807Monthly Dividend 1004.0682 1004.0823 Bonus 1284.5969 1290.6872
FUND SIZE (`)Monthly Average AUM 1,067.47 Crore
AVERAGE MATURITY298 days
MODIFIED DURATION285 days
YIELD TO MATURITY &
8.39%
MINIMUM INVESTMENT AMOUNT (`)5,000/1
MINIMUM ADDITIONAL PURCHASE AMOUNT (`)1,000/1
MINIMUM SIP INSTALLMENT AMOUNT (`)1000/1
LOAD STRUCTUREEntry load - Not applicable
Exit load - Nil (w.e.f. 14th July 2014)
PORTFOLIO
DIVIDENDS
FACTSHEET30th April 2015
High
Inte
rnal
Rat
e Se
nsiti
vity
Credit Quality
Med
Low
High Mid Low
Please note that after the payment of dividend, the NAV falls to the extent of dividend, distribution tax and cess wherever applicable.Past performance may or may not be sustained in future.Face Value of units is ` 1000Dividends disclosed above are for the past 3 months.
SCHEME PERFORMANCE (as on 31st March 2015)
Mar 28, 2013 to Mar 28, 2014
Mar 28, 2014 to Mar 31, 2015
Since Inception
Current Value of Investment if
` 10,000 wasinvested on
inception dateAbsolute Return (%) Absolute Return
(%) CAGR (%)
Axis Banking Debt Fund - Growth 9.37% 9.21% 9.13% 12,785Crisil Short Term Bond Fund Index (Benchmark) 8.78% 10.40% 9.39% 12,868Crisil 1 Year T-Bill Index (Additional Benchmark) 5.77% 8.82% 7.47% 12,246Axis Banking Debt Fund - Direct Plan - Growth 9.57% 9.42% 9.24% 12,194Crisil Short Term Bond Fund Index (Benchmark) 8.78% 10.40% 9.43% 12,240Crisil 1 Year T-Bill Index (Additional Benchmark) 5.77% 8.82% 7.42% 11,743
For Statutory Details & Risk Factors please refer page 19.
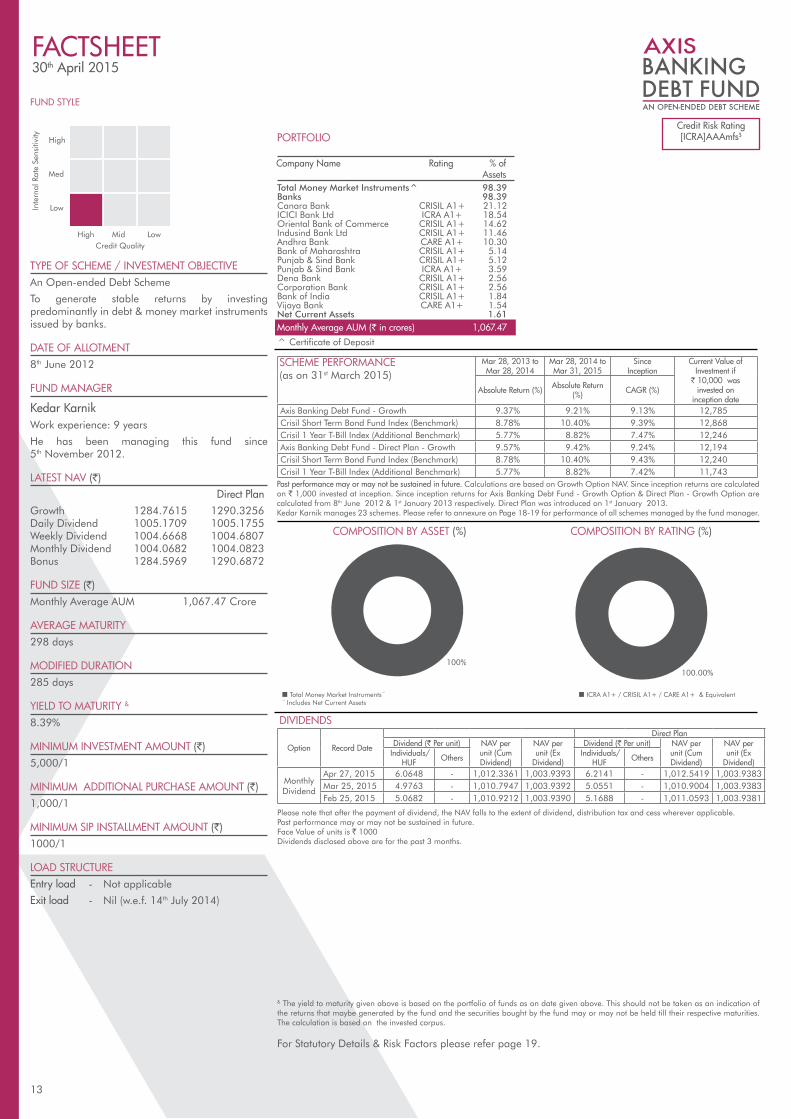
Total Money Market Instruments^ 98.39Banks 98.39Canara Bank CRISIL A1+ 21.12ICICI Bank Ltd ICRA A1+ 18.54Oriental Bank of Commerce CRISIL A1+ 14.62Indusind Bank Ltd CRISIL A1+ 11.46Andhra Bank CARE A1+ 10.30Bank of Maharashtra CRISIL A1+ 5.14Punjab & Sind Bank CRISIL A1+ 5.12Punjab & Sind Bank ICRA A1+ 3.59Dena Bank CRISIL A1+ 2.56Corporation Bank CRISIL A1+ 2.56Bank of India CRISIL A1+ 1.84Vijaya Bank CARE A1+ 1.54Net Current Assets 1.61Monthly Average AUM (` in crores) 1,067.47
Company Name Rating % of Assets
Option Record Date
Direct PlanDividend (` Per unit) NAV per
unit (Cum Dividend)
NAV per unit (Ex
Dividend)
Dividend (` Per unit) NAV per unit (Cum Dividend)
NAV per unit (Ex
Dividend) Individuals/
HUF Others Individuals/HUF Others
MonthlyDividend
Apr 27, 2015 6.0648 - 1,012.3361 1,003.9393 6.2141 - 1,012.5419 1,003.9383Mar 25, 2015 4.9763 - 1,010.7947 1,003.9392 5.0551 - 1,010.9004 1,003.9383Feb 25, 2015 5.0682 - 1,010.9212 1,003.9390 5.1688 - 1,011.0593 1,003.9381
Past performance may or may not be sustained in future. Calculations are based on Growth Option NAV. Since inception returns are calculated on ` 1,000 invested at inception. Since inception returns for Axis Banking Debt Fund - Growth Option & Direct Plan - Growth Option are calculated from 8th June 2012 & 1st January 2013 respectively. Direct Plan was introduced on 1st January 2013.Kedar Karnik manages 23 schemes. Please refer to annexure on Page 18-19 for performance of all schemes managed by the fund manager.
Credit Risk Rating[ICRA]AAAmfs$
^ Certificate of Deposit
& The yield to maturity given above is based on the portfolio of funds as on date given above. This should not be taken as an indication of the returns that maybe generated by the fund and the securities bought by the fund may or may not be held till their respective maturities. The calculation is based on the invested corpus.
13
COMPOSITION BY ASSET (%) COMPOSITION BY RATING (%)
¢ ICRA A1+ / CRISIL A1+ / CARE A1+ & Equivalent¢ Total Money Market Instruments^ ^ Includes Net Current Assets
100%100.00%
FUND STYLE
TYPE OF SCHEME / INVESTMENT OBJECTIVEAn Open-ended Debt Scheme
To provide optimal returns and liquidity to the investors by investing primarily in a mix of money market and short term debt instruments which results in a portfolio having marginally higher maturity as compared to a liquid fund at the same time maintaining a balance between safety and liquidity. However, there can be no assurance that the investment objective of the Scheme will be achieved.
DATE OF ALLOTMENT9th October 2009
FUND MANAGER
Kedar KarnikWork experience: 9 years
He has been managing this fund since 28th September 2012.
LATEST NAV (`) Direct Plan Retail PlanGrowth 1562.0253 1577.2553 1486.8316Daily Dividend 1003.8293 1004.6832 1003.1060Weekly Dividend 1003.4199 1004.6549 1003.1393Monthly Dividend 1002.9207 1002.9376 1002.8675 Bonus - 1575.9393 -
FUND SIZE (`)Monthly Average AUM 1,186.57 Crore
AVERAGE MATURITY*164 days
MODIFIED DURATION*154 days
YIELD TO MATURITY &
8.66%
MINIMUM INVESTMENT AMOUNT (`)5,000/1
MINIMUM ADDITIONAL PURCHASE AMOUNT (`)1,000/1
MINIMUM SIP INSTALLMENT AMOUNT (`)1000/1
LOAD STRUCTUREEntry load - Not applicable
Exit load - Nil
PORTFOLIO
FACTSHEET30th April 2015
High
Inte
rnal
Rat
e Se
nsiti
vity
Credit Quality
Med
Low
High Mid Low
Please note that after the payment of dividend, the NAV falls to the extent of dividend, distribution tax and cess wherever applicable.Past performance may or may not be sustained in future. Face Value of units is ` 1000Dividends disclosed above are for the past 3 months. * For instruments with put/call option, the put/call date has been taken as the maturity date.
SCHEME PERFORMANCE (as on 31st March 2015)
Mar 30, 2012 to Mar 28, 2013
Mar 28, 2013 to Mar 28, 2014
Mar 28, 2014 to Mar 31, 2015
Since Inception
Current Value of Investment if
` 10,000 wasinvested on
inception date
Absolute Return (%)
Absolute Return (%)
Absolute Return (%) CAGR (%)
Axis Treasury Advantage Fund - Growth 9.32% 9.68% 8.56% 8.35% 15,513
Crisil Liquid Fund Index (Benchmark) 8.17% 9.46% 9.06% 7.82% 15,102
Crisil 1 Year T-Bill Index (Additional Benchmark) 8.33% 5.77% 8.82% 6.31% 13,979
Axis Treasury Advantage Fund - Direct Plan - Growth - 10.04% 9.18% 9.49% 12,256
Crisil Liquid Fund Index (Benchmark) - 9.46% 9.06% 9.11% 12,162
Crisil 1 Year T-Bill Index (Additional Benchmark) - 5.77% 8.82% 7.42% 11,743
Axis Treasury Advantage Fund - Retail Plan - Growth 8.43% 8.73% 7.87% 7.98% 14,773
Crisil Liquid Fund Index (Benchmark) 8.17% 9.46% 9.06% 8.20% 14,923
Crisil 1 Year T-Bill Index (Additional Benchmark) 8.33% 5.77% 8.82% 6.60% 13,838
For Statutory Details & Risk Factors please refer page 19.
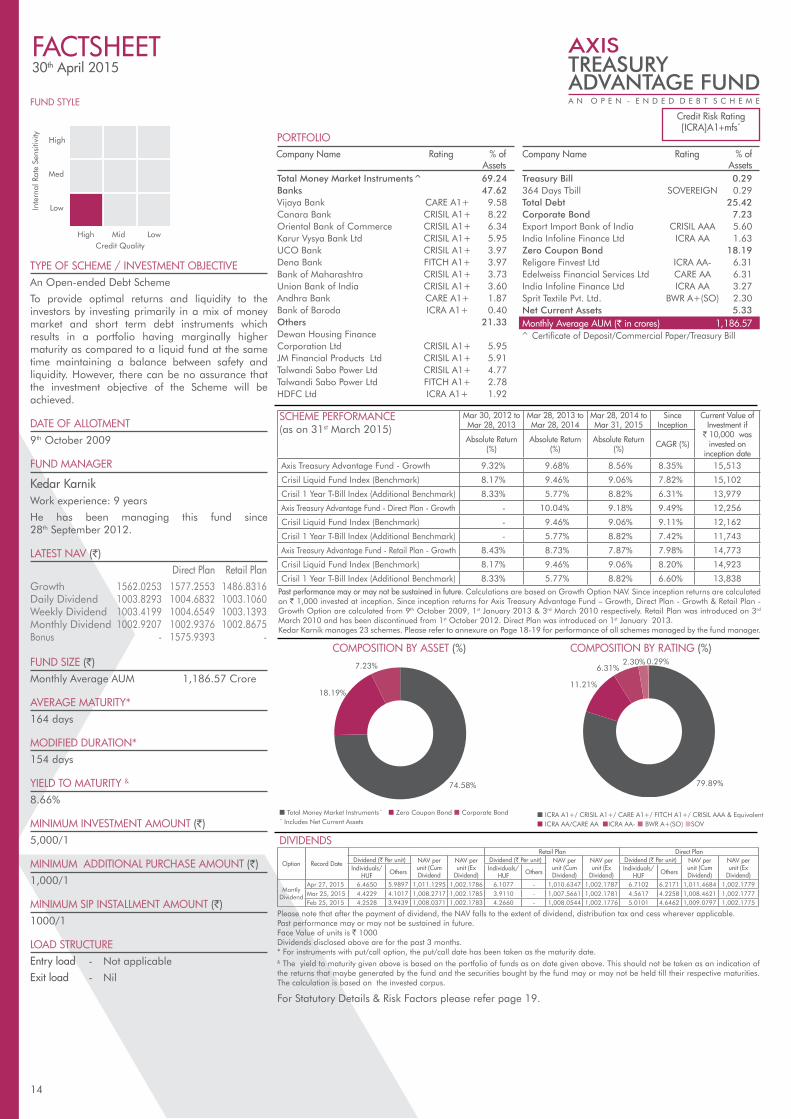
Total Money Market Instruments^ 69.24Banks 47.62Vijaya Bank CARE A1+ 9.58Canara Bank CRISIL A1+ 8.22Oriental Bank of Commerce CRISIL A1+ 6.34Karur Vysya Bank Ltd CRISIL A1+ 5.95UCO Bank CRISIL A1+ 3.97Dena Bank FITCH A1+ 3.97Bank of Maharashtra CRISIL A1+ 3.73Union Bank of India CRISIL A1+ 3.60Andhra Bank CARE A1+ 1.87Bank of Baroda ICRA A1+ 0.40Others 21.33Dewan Housing Finance Corporation Ltd CRISIL A1+ 5.95JM Financial Products Ltd CRISIL A1+ 5.91Talwandi Sabo Power Ltd CRISIL A1+ 4.77Talwandi Sabo Power Ltd FITCH A1+ 2.78HDFC Ltd ICRA A1+ 1.92
Treasury Bill 0.29 364 Days Tbill SOVEREIGN 0.29Total Debt 25.42Corporate Bond 7.23Export Import Bank of India CRISIL AAA 5.60India Infoline Finance Ltd ICRA AA 1.63Zero Coupon Bond 18.19Religare Finvest Ltd ICRA AA- 6.31Edelweiss Financial Services Ltd CARE AA 6.31India Infoline Finance Ltd ICRA AA 3.27Sprit Textile Pvt. Ltd. BWR A+(SO) 2.30Net Current Assets 5.33Monthly Average AUM (` in crores) 1,186.57
Company Name Rating % of Assets
Company Name Rating % of Assets
Credit Risk Rating[ICRA]A1+mfs^
DIVIDENDS
Past performance may or may not be sustained in future. Calculations are based on Growth Option NAV. Since inception returns are calculated on ` 1,000 invested at inception. Since inception returns for Axis Treasury Advantage Fund – Growth, Direct Plan - Growth & Retail Plan - Growth Option are calculated from 9th October 2009, 1st January 2013 & 3rd March 2010 respectively. Retail Plan was introduced on 3rd March 2010 and has been discontinued from 1st October 2012. Direct Plan was introduced on 1st January 2013.Kedar Karnik manages 23 schemes. Please refer to annexure on Page 18-19 for performance of all schemes managed by the fund manager.
Option Record Date
Retail Plan Direct PlanDividend (` Per unit) NAV per
unit (Cum Dividend
NAV per unit (Ex
Dividend)
Dividend (` Per unit) NAV per unit (Cum Dividend)
NAV per unit (Ex
Dividend)
Dividend (` Per unit) NAV per unit (Cum Dividend)
NAV per unit (Ex
Dividend)Individuals/
HUF Others Individuals/ HUF Others Individuals/
HUF Others
MontlyDividend
Apr 27, 2015 6.4650 5.9897 1,011.1295 1,002.1786 6.1077 - 1,010.6347 1,002.1787 6.7102 6.2171 1,011.4684 1,002.1779Mar 25, 2015 4.4229 4.1017 1,008.2717 1,002.1785 3.9110 - 1,007.5661 1,002.1781 4.5617 4.2258 1,008.4621 1,002.1777Feb 25, 2015 4.2528 3.9439 1,008.0371 1,002.1783 4.2660 - 1,008.0544 1,002.1776 5.0101 4.6462 1,009.0797 1,002.1775
^ Certificate of Deposit/Commercial Paper/Treasury Bill
& The yield to maturity given above is based on the portfolio of funds as on date given above. This should not be taken as an indication of the returns that maybe generated by the fund and the securities bought by the fund may or may not be held till their respective maturities. The calculation is based on the invested corpus.
14
74.58%
18.19%
7.23%
COMPOSITION BY ASSET (%) COMPOSITION BY RATING (%)
¢ ICRA A1+/ CRISIL A1+/ CARE A1+/ FITCH A1+/ CRISIL AAA & Equivalent ¢ ICRA AA/CARE AA ¢ICRA AA- ¢ BWR A+(SO) ¢SOV
¢ Total Money Market Instruments^ ¢ Zero Coupon Bond ¢ Corporate Bond^ Includes Net Current Assets
79.89%
11.21%
6.31%2.30% 0.29%

FUND STYLE
TYPE OF SCHEME / INVESTMENT OBJECTIVEAn Open-ended Liquid Scheme
To provide a high level of liquidity with reasonable returns commensurating with low risk through a portfolio of money market and debt securities. However, there can be no assurance that the investment objective of the Scheme will be achieved.
DATE OF ALLOTMENT9th October 2009
FUND MANAGER
Devang ShahWork experience: 11 years
He has been managing this fund since 5th November 2012.
Kedar KarnikWork experience: 9 years
He has been managing this fund since 27th April 2015.
LATEST NAV (`) Direct Plan Retail PlanGrowth 1559.7278 1562.0852 1504.3694Daily Dividend 1000.3608 1000.3232 1000.3232Weekly Dividend 1002.7824 1002.7873 1000.9209Monthly Dividend 1000.9224 1000.8070 1000.7598 Bonus - 1562.0290 -
FUND SIZE (`)Monthly Average AUM 7,906.60 Crore
AVERAGE MATURITY34 days
MODIFIED DURATION32 days
YIELD TO MATURITY &
8.22%
MINIMUM INVESTMENT AMOUNT (`)5,000/1
MINIMUM ADDITIONAL PURCHASE AMOUNT (`)1,000/1
LOAD STRUCTUREEntry load - Not applicable
Exit load - Nil
PORTFOLIO
FACTSHEET30th April 2015
High
Inte
rnal
Rat
e Se
nsiti
vity
Credit Quality
Med
Low
High Mid Low
Please note that after the payment of dividend, the NAV falls to the extent of dividend, distribution tax and cess wherever applicable.Past performance may or may not be sustained in future. Face Value of units is ` 1000Dividends disclosed above are for the past 3 months.
& The yield to maturity given above is based on the portfolio of funds as on date given above. This should not be taken as an indication of the returns that maybe generated by the fund and the securities bought by the fund may or may not be held till their respective maturities. The calculation is based on the invested corpus.
For Statutory Details & Risk Factors please refer page 19.
Total Money Market Instruments^ 92.16Banks 33.84IDBI Bank Ltd CRISIL A1+ 6.09Oriental Bank of Commerce CRISIL A1+ 3.31Vijaya Bank CARE A1+ 3.08Union Bank of India CRISIL A1+ 2.42Vijaya Bank FITCH A1+ 2.41Karur Vysya Bank Ltd CRISIL A1+ 1.75Punjab & Sind Bank ICRA A1+ 1.74Canara Bank CRISIL A1+ 1.51Allahabad Bank ICRA A1+ 1.27RBL Bank Limited 1.21RBL Bank Limited ICRA A1+ 1.21Indusind Bank Ltd CRISIL A1+ 1.20Andhra Bank CARE A1+ 1.20Bank of Baroda ICRA A1+ 0.96UCO Bank CRISIL A1+ 0.90Bank of Maharashtra CRISIL A1+ 0.90Dena Bank FITCH A1+ 0.78Kotak Mahindra Bank Ltd CRISIL A1+ 0.60Syndicate Bank CARE A1+ 0.48Corporation Bank CRISIL A1+ 0.30Bank of India CRISIL A1+ 0.30Andhra Bank FITCH A1+ 0.06Dena Bank ICRA A1+ 0.06Indusind Bank Ltd ICRA A1+ 0.06Others 46.56Export Import Bank of India CRISIL A1+ 11.14Indiabulls Housing Finance Ltd CRISIL A1+ 4.83SREI Equipment Finance Ltd CARE A1+ 4.23NABARD CRISIL A1+ 2.46Edelweiss Commodities Ltd CRISIL A1+ 2.46
India Infoline Finance Ltd CRISIL A1+ 2.36Ranbaxy Laboratories Ltd CARE A1+ 2.30HDFC Ltd ICRA A1+ 2.12Religare Finvest Ltd ICRA A1+ 1.51JM Financial Services Ltd ICRA A1+ 1.50Dewan Housing Finance Corporation Ltd CRISIL A1+ 1.50Edelweiss Financial Services Ltd CARE A1+ 1.33Religare Finvest Ltd FITCH A1+ 1.21EID Parry India Ltd CRISIL A1+ 1.21Steel Authority of India Ltd CARE A1+ 1.20Magma Fincorp Ltd CARE A1+ 1.20Talwandi Sabo Power Ltd FITCH A1+ 1.15India Infoline Finance Ltd ICRA A1+ 0.61Small Industries Dev Bank of India CARE A1+ 0.60Rural Electrification Corporation Ltd CRISIL A1+ 0.60Edelweiss Financial Services Ltd CRISIL A1+ 0.30JM Financial Services Ltd CRISIL A1+ 0.30Small Industries Dev Bank of India CRISIL A1+ 0.30SREI Equipment Finance Ltd ICRA A1+ 0.06Vodafone India Ltd CRISIL A1+ 0.06Treasury Bill 11.77 91 Days Tbill SOVEREIGN 7.72364 Days Tbill SOVEREIGN 2.24182Days Tbill SOVEREIGN 1.81Total Debt 1.60Corporate Bond 1.60HDFC Ltd CRISIL AAA 1.22Cholamandalam Investment and Finance Company Ltd ICRA AA 0.26IDFC Ltd. ICRA AAA 0.12Net Current Assets 6.24Monthly Average AUM (` in crores) 7,906.60
Company Name Rating % of Assets
Company Name Rating % of Assets
Credit Risk Rating[ICRA]A1+mfs^ CARE AAA mfs^
DIVIDENDS
Past performance may or may not be sustained in future. Calculations are based on Growth Option NAV. Since inception returns are calculated on ` 1,000 invested at inception.Since inception returns for Axis Liquid Fund Plan - Growth Option, Retail Plan - Growth Option & Direct Plan - Growth Option are calculated from 9th October 2009, 1st March 2010 & 31st December 2012 respectively. Retail Plan was introduced on 1st March 2010 and has been discontinued from 1st October 2012. Direct Plan was introduced on 31st December 2012.Devang Shah manages 21 schemes. Please refer to annexure on Page 18 for performance of all schemes managed by the fund manager.
Option Record Date
Retail Plan Direct PlanDividend (` Per unit) NAV per
unit (Cum Dividend
NAV per unit (Ex
Dividend)
Dividend (` Per unit) NAV per unit (Cum Dividend)
NAV per unit (Ex
Dividend)
Dividend (` Per unit) NAV per unit (Cum Dividend)
NAV per unit (Ex
Dividend)Individuals/
HUF Others Individuals/ HUF Others Individuals/
HUF Others
MontlyDividend
Apr 27, 2015 5.8146 5.3871 1,008.2831 1,000.2326 5.5247 - 1,007.7619 1,000.1123 5.8989 - 1,008.2793 1,000.1122Mar 25, 2015 4.7371 4.3931 1,006.6667 1,000.1386 4.5200 - 1,006.3086 1,000.0821 4.8444 - 1,006.7546 1,000.0805Feb 25, 2015 4.8101 4.4607 1,006.7653 1,000.1386 5.0542 - 1,006.7810 1,000.0819 5.2105 - 1,007.2586 1,000.0805
^ Certificate of Deposit/Commercial Paper/Treasury Bill
15
COMPOSITION BY ASSET (%) COMPOSITION BY RATING (%)
¢ ICRA A1+/ CRISIL A1+/ CARE A1+/ FITCH A1+/ CRISIL AAA/ ICRA AAA & Equivalent ¢ SOV ¢ ICRA AA
¢ Total Money Market Instruments^ ¢ Corporate Bond^ Includes Net Current Assets
SCHEME PERFORMANCE (as on 31st March 2015) 7 Days 15 Days 30 Days
Mar 30, 2012to
Mar 31, 2013
Mar 31, 2013to
Mar 31, 2014
Mar 31, 2014to
Mar 31, 2015
SinceInception
Current Value of Investment if ` 10,000 was invested on inception
dateAnnualised Return (%) Annualised
Return (%)Annualised Return (%)
Annualised Return (%) CAGR (%)
Axis Liquid Fund - Growth 11.01% 9.89% 9.36% 9.36% 9.32% 8.99% 8.32% 15,488Crisil Liquid Fund Index (Benchmark) 14.59% 10.93% 10.01% 8.17% 9.54% 8.98% 7.82% 15,102Crisil 1 Year T-Bill Index (Additional Benchmark) 18.70% 15.80% 12.06% 8.33% 5.84% 8.74% 6.31% 13,979Axis Liquid Fund - Direct Plan - Growth 11.08% 9.95% 9.43% - 9.39% 9.06% 9.19% 12,185Crisil Liquid Fund Index (Benchmark) 14.59% 10.93% 10.01% - 9.54% 8.98% 9.11% 12,164Crisil 1 Year T-Bill Index (Additional Benchmark) 18.70% 15.80% 12.06% - 5.84% 8.74% 7.43% 11,748Axis Liquid Fund - Retail Plan - Growth 10.46% 9.34% 8.81% 8.91% 8.77% 8.45% 8.22% 14,945Crisil Liquid Fund Index (Benchmark) 14.59% 10.93% 10.01% 8.17% 9.54% 8.98% 8.20% 14,927Crisil 1 Year T-Bill Index (Additional Benchmark) 18.70% 15.80% 12.06% 8.33% 5.84% 8.74% 6.60% 13,840
98.40%
1.60%
87.97%
11.77% 0.26%
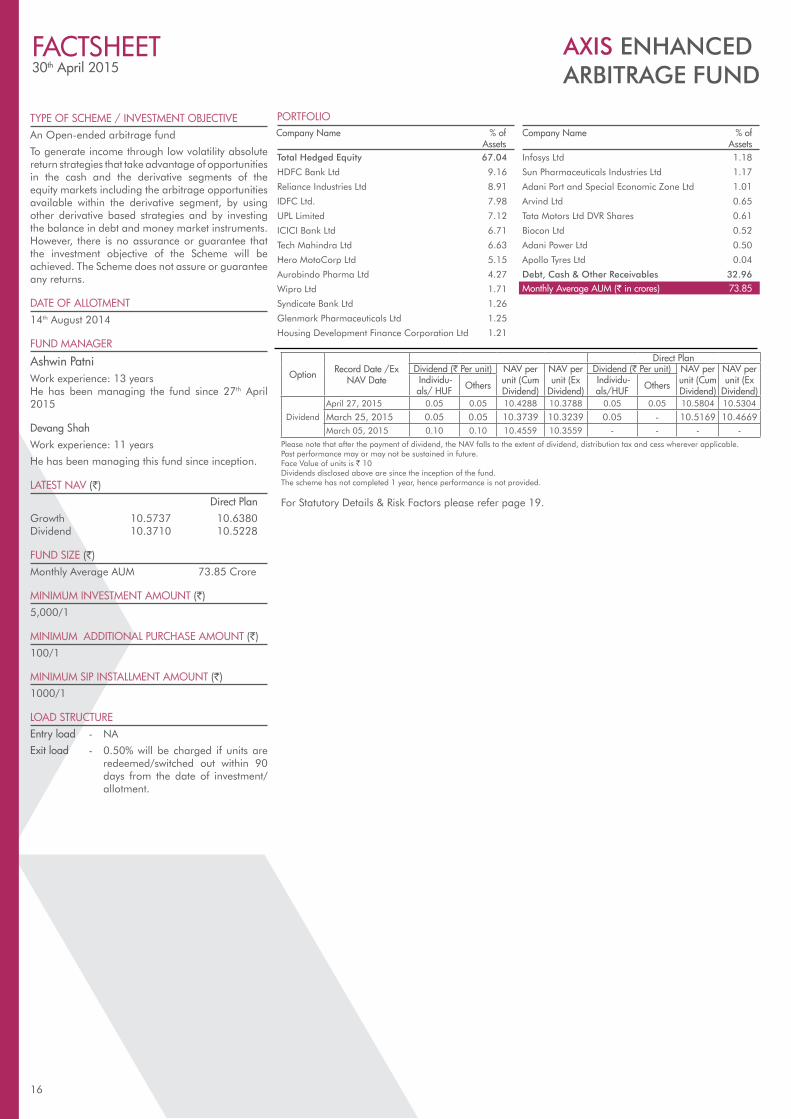
TYPE OF SCHEME / INVESTMENT OBJECTIVEAn Open-ended arbitrage fund
To generate income through low volatility absolute return strategies that take advantage of opportunities in the cash and the derivative segments of the equity markets including the arbitrage opportunities available within the derivative segment, by using other derivative based strategies and by investing the balance in debt and money market instruments. However, there is no assurance or guarantee that the investment objective of the Scheme will be achieved. The Scheme does not assure or guarantee any returns.
DATE OF ALLOTMENT14th August 2014
FUND MANAGER
Ashwin Patni Work experience: 13 years He has been managing the fund since 27th April 2015
Devang ShahWork experience: 11 years
He has been managing this fund since inception.
LATEST NAV (`) Direct PlanGrowth 10.5737 10.6380Dividend 10.3710 10.5228
FUND SIZE (`)Monthly Average AUM 73.85 Crore
MINIMUM INVESTMENT AMOUNT (`)5,000/1
MINIMUM ADDITIONAL PURCHASE AMOUNT (`)100/1
MINIMUM SIP INSTALLMENT AMOUNT (`)1000/1
LOAD STRUCTUREEntry load - NA
Exit load - 0.50% will be charged if units are redeemed/switched out within 90 days from the date of investment/ allotment.
FACTSHEET30th April 2015
16
AXIS ENHANCED
ARBITRAGE FUND
PORTFOLIO
Total Hedged Equity 67.04
HDFC Bank Ltd 9.16
Reliance Industries Ltd 8.91
IDFC Ltd. 7.98
UPL Limited 7.12
ICICI Bank Ltd 6.71
Tech Mahindra Ltd 6.63
Hero MotoCorp Ltd 5.15
Aurobindo Pharma Ltd 4.27
Wipro Ltd 1.71
Syndicate Bank Ltd 1.26
Glenmark Pharmaceuticals Ltd 1.25
Housing Development Finance Corporation Ltd 1.21
Company Name % of Assets
Company Name % of Assets Infosys Ltd 1.18
Sun Pharmaceuticals Industries Ltd 1.17
Adani Port and Special Economic Zone Ltd 1.01
Arvind Ltd 0.65
Tata Motors Ltd DVR Shares 0.61
Biocon Ltd 0.52
Adani Power Ltd 0.50
Apollo Tyres Ltd 0.04
Debt, Cash & Other Receivables 32.96
Monthly Average AUM (` in crores) 73.85
Please note that after the payment of dividend, the NAV falls to the extent of dividend, distribution tax and cess wherever applicable.Past performance may or may not be sustained in future. Face Value of units is ` 10Dividends disclosed above are since the inception of the fund. The scheme has not completed 1 year, hence performance is not provided.
Option Record Date /Ex NAV Date
Direct PlanDividend (` Per unit) NAV per
unit (Cum Dividend)
NAV per unit (Ex
Dividend)
Dividend (` Per unit) NAV per unit (Cum Dividend)
NAV per unit (Ex
Dividend) Individu-als/ HUF Others Individu-
als/HUF Others
Dividend
April 27, 2015 0.05 0.05 10.4288 10.3788 0.05 0.05 10.5804 10.5304
March 25, 2015 0.05 0.05 10.3739 10.3239 0.05 - 10.5169 10.4669March 05, 2015 0.10 0.10 10.4559 10.3559 - - - -
For Statutory Details & Risk Factors please refer page 19.
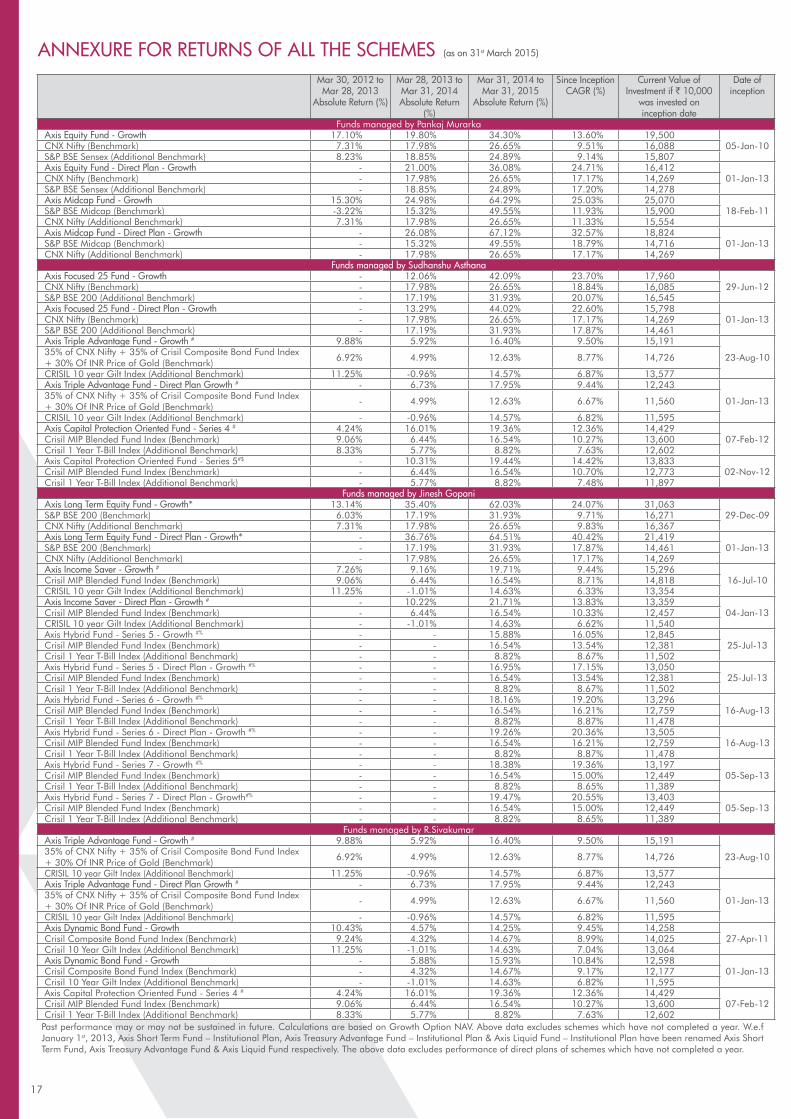
ANNEXURE FOR RETURNS OF ALL THE SCHEMES (as on 31st March 2015)
Mar 30, 2012 to Mar 28, 2013
Absolute Return (%)
Mar 28, 2013 to Mar 31, 2014 Absolute Return
(%)
Mar 31, 2014 to Mar 31, 2015
Absolute Return (%)
Since Inception CAGR (%)
Current Value of Investment if ` 10,000
was invested on inception date
Date of inception
Funds managed by Pankaj MurarkaAxis Equity Fund - Growth 17.10% 19.80% 34.30% 13.60% 19,500
05-Jan-10CNX Nifty (Benchmark) 7.31% 17.98% 26.65% 9.51% 16,088S&P BSE Sensex (Additional Benchmark) 8.23% 18.85% 24.89% 9.14% 15,807Axis Equity Fund - Direct Plan - Growth - 21.00% 36.08% 24.71% 16,412
01-Jan-13CNX Nifty (Benchmark) - 17.98% 26.65% 17.17% 14,269S&P BSE Sensex (Additional Benchmark) - 18.85% 24.89% 17.20% 14,278Axis Midcap Fund - Growth 15.30% 24.98% 64.29% 25.03% 25,070
18-Feb-11S&P BSE Midcap (Benchmark) -3.22% 15.32% 49.55% 11.93% 15,900CNX Nifty (Additional Benchmark) 7.31% 17.98% 26.65% 11.33% 15,554Axis Midcap Fund - Direct Plan - Growth - 26.08% 67.12% 32.57% 18,824
01-Jan-13S&P BSE Midcap (Benchmark) - 15.32% 49.55% 18.79% 14,716CNX Nifty (Additional Benchmark) - 17.98% 26.65% 17.17% 14,269
Funds managed by Sudhanshu AsthanaAxis Focused 25 Fund - Growth - 12.06% 42.09% 23.70% 17,960
29-Jun-12CNX Nifty (Benchmark) - 17.98% 26.65% 18.84% 16,085S&P BSE 200 (Additional Benchmark) - 17.19% 31.93% 20.07% 16,545Axis Focused 25 Fund - Direct Plan - Growth - 13.29% 44.02% 22.60% 15,798
01-Jan-13CNX Nifty (Benchmark) - 17.98% 26.65% 17.17% 14,269S&P BSE 200 (Additional Benchmark) - 17.19% 31.93% 17.87% 14,461Axis Triple Advantage Fund - Growth # 9.88% 5.92% 16.40% 9.50% 15,191
23-Aug-1035% of CNX Nifty + 35% of Crisil Composite Bond Fund Index + 30% Of INR Price of Gold (Benchmark)
6.92% 4.99% 12.63% 8.77% 14,726
CRISIL 10 year Gilt Index (Additional Benchmark) 11.25% -0.96% 14.57% 6.87% 13,577Axis Triple Advantage Fund - Direct Plan Growth # - 6.73% 17.95% 9.44% 12,243
01-Jan-1335% of CNX Nifty + 35% of Crisil Composite Bond Fund Index + 30% Of INR Price of Gold (Benchmark)
- 4.99% 12.63% 6.67% 11,560
CRISIL 10 year Gilt Index (Additional Benchmark) - -0.96% 14.57% 6.82% 11,595Axis Capital Protection Oriented Fund - Series 4 # 4.24% 16.01% 19.36% 12.36% 14,429
07-Feb-12Crisil MIP Blended Fund Index (Benchmark) 9.06% 6.44% 16.54% 10.27% 13,600Crisil 1 Year T-Bill Index (Additional Benchmark) 8.33% 5.77% 8.82% 7.63% 12,602Axis Capital Protection Oriented Fund - Series 5#$ - 10.31% 19.44% 14.42% 13,833
02-Nov-12Crisil MIP Blended Fund Index (Benchmark) - 6.44% 16.54% 10.70% 12,773Crisil 1 Year T-Bill Index (Additional Benchmark) - 5.77% 8.82% 7.48% 11,897
Funds managed by Jinesh GopaniAxis Long Term Equity Fund - Growth* 13.14% 35.40% 62.03% 24.07% 31,063
29-Dec-09S&P BSE 200 (Benchmark) 6.03% 17.19% 31.93% 9.71% 16,271CNX Nifty (Additional Benchmark) 7.31% 17.98% 26.65% 9.83% 16,367Axis Long Term Equity Fund - Direct Plan - Growth* - 36.76% 64.51% 40.42% 21,419
01-Jan-13S&P BSE 200 (Benchmark) - 17.19% 31.93% 17.87% 14,461CNX Nifty (Additional Benchmark) - 17.98% 26.65% 17.17% 14,269Axis Income Saver - Growth # 7.26% 9.16% 19.71% 9.44% 15,296
16-Jul-10Crisil MIP Blended Fund Index (Benchmark) 9.06% 6.44% 16.54% 8.71% 14,818CRISIL 10 year Gilt Index (Additional Benchmark) 11.25% -1.01% 14.63% 6.33% 13,354Axis Income Saver - Direct Plan - Growth # - 10.22% 21.71% 13.83% 13,359
04-Jan-13Crisil MIP Blended Fund Index (Benchmark) - 6.44% 16.54% 10.33% 12,457CRISIL 10 year Gilt Index (Additional Benchmark) - -1.01% 14.63% 6.62% 11,540Axis Hybrid Fund - Series 5 - Growth #% - - 15.88% 16.05% 12,845
25-Jul-13Crisil MIP Blended Fund Index (Benchmark) - - 16.54% 13.54% 12,381Crisil 1 Year T-Bill Index (Additional Benchmark) - - 8.82% 8.67% 11,502Axis Hybrid Fund - Series 5 - Direct Plan - Growth #% - - 16.95% 17.15% 13,050
25-Jul-13Crisil MIP Blended Fund Index (Benchmark) - - 16.54% 13.54% 12,381Crisil 1 Year T-Bill Index (Additional Benchmark) - - 8.82% 8.67% 11,502Axis Hybrid Fund - Series 6 - Growth #% - - 18.16% 19.20% 13,296
16-Aug-13Crisil MIP Blended Fund Index (Benchmark) - - 16.54% 16.21% 12,759Crisil 1 Year T-Bill Index (Additional Benchmark) - - 8.82% 8.87% 11,478Axis Hybrid Fund - Series 6 - Direct Plan - Growth #% - - 19.26% 20.36% 13,505
16-Aug-13Crisil MIP Blended Fund Index (Benchmark) - - 16.54% 16.21% 12,759Crisil 1 Year T-Bill Index (Additional Benchmark) - - 8.82% 8.87% 11,478Axis Hybrid Fund - Series 7 - Growth #% - - 18.38% 19.36% 13,197
05-Sep-13Crisil MIP Blended Fund Index (Benchmark) - - 16.54% 15.00% 12,449Crisil 1 Year T-Bill Index (Additional Benchmark) - - 8.82% 8.65% 11,389Axis Hybrid Fund - Series 7 - Direct Plan - Growth#% - - 19.47% 20.55% 13,403
05-Sep-13Crisil MIP Blended Fund Index (Benchmark) - - 16.54% 15.00% 12,449Crisil 1 Year T-Bill Index (Additional Benchmark) - - 8.82% 8.65% 11,389
Funds managed by R.SivakumarAxis Triple Advantage Fund - Growth # 9.88% 5.92% 16.40% 9.50% 15,191
23-Aug-1035% of CNX Nifty + 35% of Crisil Composite Bond Fund Index + 30% Of INR Price of Gold (Benchmark)
6.92% 4.99% 12.63% 8.77% 14,726
CRISIL 10 year Gilt Index (Additional Benchmark) 11.25% -0.96% 14.57% 6.87% 13,577Axis Triple Advantage Fund - Direct Plan Growth # - 6.73% 17.95% 9.44% 12,243
01-Jan-1335% of CNX Nifty + 35% of Crisil Composite Bond Fund Index + 30% Of INR Price of Gold (Benchmark)
- 4.99% 12.63% 6.67% 11,560
CRISIL 10 year Gilt Index (Additional Benchmark) - -0.96% 14.57% 6.82% 11,595Axis Dynamic Bond Fund - Growth 10.43% 4.57% 14.25% 9.45% 14,258
27-Apr-11Crisil Composite Bond Fund Index (Benchmark) 9.24% 4.32% 14.67% 8.99% 14,025Crisil 10 Year Gilt Index (Additional Benchmark) 11.25% -1.01% 14.63% 7.04% 13,064Axis Dynamic Bond Fund - Growth - 5.88% 15.93% 10.84% 12,598
01-Jan-13Crisil Composite Bond Fund Index (Benchmark) - 4.32% 14.67% 9.17% 12,177 Crisil 10 Year Gilt Index (Additional Benchmark) - -1.01% 14.63% 6.82% 11,595Axis Capital Protection Oriented Fund - Series 4 # 4.24% 16.01% 19.36% 12.36% 14,429
07-Feb-12Crisil MIP Blended Fund Index (Benchmark) 9.06% 6.44% 16.54% 10.27% 13,600Crisil 1 Year T-Bill Index (Additional Benchmark) 8.33% 5.77% 8.82% 7.63% 12,602
Past performance may or may not be sustained in future. Calculations are based on Growth Option NAV. Above data excludes schemes which have not completed a year. W.e.f January 1st, 2013, Axis Short Term Fund – Institutional Plan, Axis Treasury Advantage Fund – Institutional Plan & Axis Liquid Fund – Institutional Plan have been renamed Axis Short Term Fund, Axis Treasury Advantage Fund & Axis Liquid Fund respectively. The above data excludes performance of direct plans of schemes which have not completed a year.
17
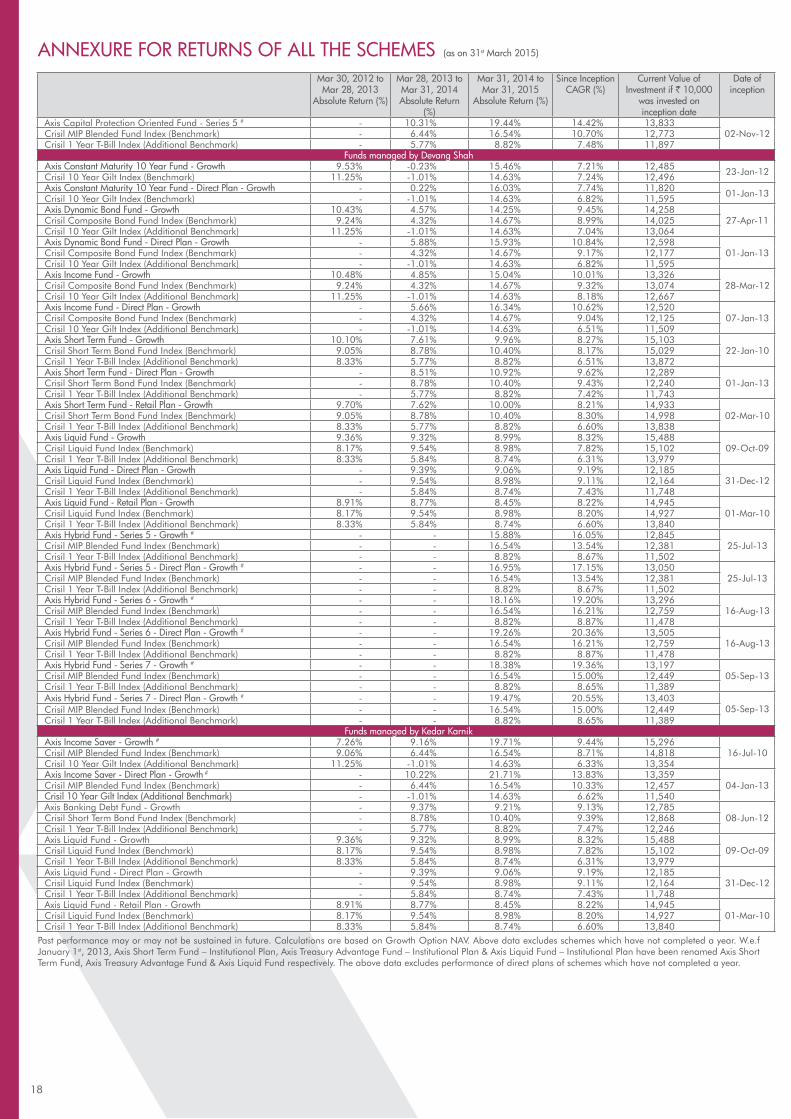
Mar 30, 2012 to Mar 28, 2013
Absolute Return (%)
Mar 28, 2013 to Mar 31, 2014 Absolute Return
(%)
Mar 31, 2014 to Mar 31, 2015
Absolute Return (%)
Since Inception CAGR (%)
Current Value of Investment if ` 10,000
was invested on inception date
Date of inception
Axis Capital Protection Oriented Fund - Series 5 # - 10.31% 19.44% 14.42% 13,83302-Nov-12Crisil MIP Blended Fund Index (Benchmark) - 6.44% 16.54% 10.70% 12,773
Crisil 1 Year T-Bill Index (Additional Benchmark) - 5.77% 8.82% 7.48% 11,897Funds managed by Devang Shah
Axis Constant Maturity 10 Year Fund - Growth 9.53% -0.23% 15.46% 7.21% 12,485 23-Jan-12Crisil 10 Year Gilt Index (Benchmark) 11.25% -1.01% 14.63% 7.24% 12,496Axis Constant Maturity 10 Year Fund - Direct Plan - Growth - 0.22% 16.03% 7.74% 11,820 01-Jan-13Crisil 10 Year Gilt Index (Benchmark) - -1.01% 14.63% 6.82% 11,595Axis Dynamic Bond Fund - Growth 10.43% 4.57% 14.25% 9.45% 14,258
27-Apr-11Crisil Composite Bond Fund Index (Benchmark) 9.24% 4.32% 14.67% 8.99% 14,025Crisil 10 Year Gilt Index (Additional Benchmark) 11.25% -1.01% 14.63% 7.04% 13,064Axis Dynamic Bond Fund - Direct Plan - Growth - 5.88% 15.93% 10.84% 12,598
01-Jan-13Crisil Composite Bond Fund Index (Benchmark) - 4.32% 14.67% 9.17% 12,177Crisil 10 Year Gilt Index (Additional Benchmark) - -1.01% 14.63% 6.82% 11,595Axis Income Fund - Growth 10.48% 4.85% 15.04% 10.01% 13,326
28-Mar-12Crisil Composite Bond Fund Index (Benchmark) 9.24% 4.32% 14.67% 9.32% 13,074Crisil 10 Year Gilt Index (Additional Benchmark) 11.25% -1.01% 14.63% 8.18% 12,667Axis Income Fund - Direct Plan - Growth - 5.66% 16.34% 10.62% 12,520
07-Jan-13Crisil Composite Bond Fund Index (Benchmark) - 4.32% 14.67% 9.04% 12,125Crisil 10 Year Gilt Index (Additional Benchmark) - -1.01% 14.63% 6.51% 11,509Axis Short Term Fund - Growth 10.10% 7.61% 9.96% 8.27% 15,103
22-Jan-10Crisil Short Term Bond Fund Index (Benchmark) 9.05% 8.78% 10.40% 8.17% 15,029Crisil 1 Year T-Bill Index (Additional Benchmark) 8.33% 5.77% 8.82% 6.51% 13,872Axis Short Term Fund - Direct Plan - Growth - 8.51% 10.92% 9.62% 12,289
01-Jan-13Crisil Short Term Bond Fund Index (Benchmark) - 8.78% 10.40% 9.43% 12,240Crisil 1 Year T-Bill Index (Additional Benchmark) - 5.77% 8.82% 7.42% 11,743Axis Short Term Fund - Retail Plan - Growth 9.70% 7.62% 10.00% 8.21% 14,933
02-Mar-10Crisil Short Term Bond Fund Index (Benchmark) 9.05% 8.78% 10.40% 8.30% 14,998Crisil 1 Year T-Bill Index (Additional Benchmark) 8.33% 5.77% 8.82% 6.60% 13,838Axis Liquid Fund - Growth 9.36% 9.32% 8.99% 8.32% 15,488
09-Oct-09Crisil Liquid Fund Index (Benchmark) 8.17% 9.54% 8.98% 7.82% 15,102Crisil 1 Year T-Bill Index (Additional Benchmark) 8.33% 5.84% 8.74% 6.31% 13,979Axis Liquid Fund - Direct Plan - Growth - 9.39% 9.06% 9.19% 12,185
31-Dec-12Crisil Liquid Fund Index (Benchmark) - 9.54% 8.98% 9.11% 12,164Crisil 1 Year T-Bill Index (Additional Benchmark) - 5.84% 8.74% 7.43% 11,748Axis Liquid Fund - Retail Plan - Growth 8.91% 8.77% 8.45% 8.22% 14,945
01-Mar-10Crisil Liquid Fund Index (Benchmark) 8.17% 9.54% 8.98% 8.20% 14,927Crisil 1 Year T-Bill Index (Additional Benchmark) 8.33% 5.84% 8.74% 6.60% 13,840Axis Hybrid Fund - Series 5 - Growth # - - 15.88% 16.05% 12,845
25-Jul-13Crisil MIP Blended Fund Index (Benchmark) - - 16.54% 13.54% 12,381Crisil 1 Year T-Bill Index (Additional Benchmark) - - 8.82% 8.67% 11,502Axis Hybrid Fund - Series 5 - Direct Plan - Growth # - - 16.95% 17.15% 13,050
25-Jul-13Crisil MIP Blended Fund Index (Benchmark) - - 16.54% 13.54% 12,381Crisil 1 Year T-Bill Index (Additional Benchmark) - - 8.82% 8.67% 11,502Axis Hybrid Fund - Series 6 - Growth # - - 18.16% 19.20% 13,296
16-Aug-13Crisil MIP Blended Fund Index (Benchmark) - - 16.54% 16.21% 12,759Crisil 1 Year T-Bill Index (Additional Benchmark) - - 8.82% 8.87% 11,478Axis Hybrid Fund - Series 6 - Direct Plan - Growth # - - 19.26% 20.36% 13,505
16-Aug-13Crisil MIP Blended Fund Index (Benchmark) - - 16.54% 16.21% 12,759Crisil 1 Year T-Bill Index (Additional Benchmark) - - 8.82% 8.87% 11,478Axis Hybrid Fund - Series 7 - Growth # - - 18.38% 19.36% 13,197
05-Sep-13Crisil MIP Blended Fund Index (Benchmark) - - 16.54% 15.00% 12,449Crisil 1 Year T-Bill Index (Additional Benchmark) - - 8.82% 8.65% 11,389Axis Hybrid Fund - Series 7 - Direct Plan - Growth # - - 19.47% 20.55% 13,403
05-Sep-13Crisil MIP Blended Fund Index (Benchmark) - - 16.54% 15.00% 12,449Crisil 1 Year T-Bill Index (Additional Benchmark) - - 8.82% 8.65% 11,389
Funds managed by Kedar KarnikAxis Income Saver - Growth # 7.26% 9.16% 19.71% 9.44% 15,296
16-Jul-10Crisil MIP Blended Fund Index (Benchmark) 9.06% 6.44% 16.54% 8.71% 14,818Crisil 10 Year Gilt Index (Additional Benchmark) 11.25% -1.01% 14.63% 6.33% 13,354Axis Income Saver - Direct Plan - Growth # - 10.22% 21.71% 13.83% 13,359
04-Jan-13Crisil MIP Blended Fund Index (Benchmark) - 6.44% 16.54% 10.33% 12,457Crisil 10 Year Gilt Index (Additional Benchmark) - -1.01% 14.63% 6.62% 11,540Axis Banking Debt Fund - Growth - 9.37% 9.21% 9.13% 12,785
08-Jun-12Crisil Short Term Bond Fund Index (Benchmark) - 8.78% 10.40% 9.39% 12,868Crisil 1 Year T-Bill Index (Additional Benchmark) - 5.77% 8.82% 7.47% 12,246Axis Liquid Fund - Growth 9.36% 9.32% 8.99% 8.32% 15,488
09-Oct-09Crisil Liquid Fund Index (Benchmark) 8.17% 9.54% 8.98% 7.82% 15,102Crisil 1 Year T-Bill Index (Additional Benchmark) 8.33% 5.84% 8.74% 6.31% 13,979Axis Liquid Fund - Direct Plan - Growth - 9.39% 9.06% 9.19% 12,185
31-Dec-12Crisil Liquid Fund Index (Benchmark) - 9.54% 8.98% 9.11% 12,164Crisil 1 Year T-Bill Index (Additional Benchmark) - 5.84% 8.74% 7.43% 11,748Axis Liquid Fund - Retail Plan - Growth 8.91% 8.77% 8.45% 8.22% 14,945
01-Mar-10Crisil Liquid Fund Index (Benchmark) 8.17% 9.54% 8.98% 8.20% 14,927Crisil 1 Year T-Bill Index (Additional Benchmark) 8.33% 5.84% 8.74% 6.60% 13,840
18
ANNEXURE FOR RETURNS OF ALL THE SCHEMES (as on 31st March 2015)
Past performance may or may not be sustained in future. Calculations are based on Growth Option NAV. Above data excludes schemes which have not completed a year. W.e.f January 1st, 2013, Axis Short Term Fund – Institutional Plan, Axis Treasury Advantage Fund – Institutional Plan & Axis Liquid Fund – Institutional Plan have been renamed Axis Short Term Fund, Axis Treasury Advantage Fund & Axis Liquid Fund respectively. The above data excludes performance of direct plans of schemes which have not completed a year.

$ Rating Details (Axis Income Fund, Axis Short Term Fund & Axis Banking Debt Fund)Schemes with this rating are considered to have the highest degree of safety regarding timely receipt of payments from the investments that they have made. This rating should however, not be construed as an indication of the performance of the Mutual Fund scheme or of volatility in its returns. The rating should not be treated as a recommendation to buy, sell or hold units issued by the Mutual Fund.
^ Rating Details (Axis Treasury Advantage Fund and Axis Liquid Fund)Schemes with this rating are considered to have very strong degree of safety regarding timely receipt of payments from the investments that they have made. This rating should however, not be construed as an indication of the performance of the Mutual Fund scheme or of volatility in its returns. The rating should not be treated as a recommendation to buy, sell or hold units issued by the Mutual Fund.
Past performance may or may not be sustained in future. Calculations are based on Growth Option NAV. Above data excludes schemes which have not completed a year. W.e.f January 1st, 2013, Axis Short Term Fund – Institutional Plan, Axis Treasury Advantage Fund – Institutional Plan & Axis Liquid Fund – Institutional Plan have been renamed Axis Short Term Fund, Axis Treasury Advantage Fund & Axis Liquid Fund respectively. The above data excludes performance of direct plans of schemes which have not completed a year.
ANNEXURE FOR RETURNS OF ALL THE SCHEMES (as on 31st March 2015)
19
PRODUCT LABELS
AXIS EQUITY FUND This product is suitable for investors who are seeking*l Capital appreciation over long terml Investment in a diversified portfolio predominantly consisting of equity and equity related instruments l High risk ¢ (BROWN)
AXIS FOCUSED 25 FUND This product is suitable for investors who are seeking*l Capital appreciation over long terml Investment in a concentrated portfolio of equity & equity related instruments of up to 25 companies l High risk ¢ (BROWN)
AXIS LONG TERM EQUITY FUND This product is suitable for investors who are seeking*l Capital appreciation & generating income over long terml Investment in a diversified portfolio predominantly consisting of equity and equity related instrumentsl High risk ¢ (BROWN)
AXIS MIDCAP FUND This product is suitable for investors who are seeking*l Capital appreciation over long terml Investment predominantly in equity and equity related instruments of mid size companies with focus on relatively larger companies within this category l High risk ¢ (BROWN)
AXIS TRIPLE ADVANTAGE FUND This product is suitable for investors who are seeking*l Capital appreciation & generating income over long term l Investment in a diversified portfolio of equity and equity related instruments, fixed income instruments & gold exchange traded fundsl Medium risk ¢ (YELLOW)
AXIS INCOME SAVER This product is suitable for investors who are seeking*l Capital appreciation while generating income over medium to long term l Investment in debt and money market instruments as well as equity and equity related instruments while managing risk through active asset allocationl Medium risk ¢ (YELLOW)
AXIS CONSTANT MATURITY 10 YEAR FUND This product is suitable for investors who are seeking*l Credit risk free returns over medium to long terml Investment mainly in Government securities to generate returns similar to that of 10 year government bonds l Low risk ¢ (BLUE)
AXIS DYNAMIC BOND FUND This product is suitable for investors who are seeking*l Optimal returns over medium to long terml To generate stable returns while maintaining liquidity through active management of a portfolio of debt and money market instrumentsl Low risk ¢ (BLUE)
* Investors should consult their financial advisers if in doubt about whether the product is suitable for them.
Note Risk is represented as:¢ (BLUE) investors understand that their principal will at low risk¢ (YELLOW) investors understand that their principal will at medium risk¢ (BROWN) investors understand that their principal will at high risk
AXIS INCOME FUND This product is suitable for investors who are seeking*l Optimal returns over medium terml Investments in diversified portfolio of high quality debt and money market securities to generate optimal risk adjusted returns while maintaining liquidity l Low risk ¢ (BLUE)
AXIS SHORT TERM FUND This product is suitable for investors who are seeking*l Regular income while maintaining liquidity over short to medium term l Investment in debt and money market instruments l Low risk ¢ (BLUE)
AXIS BANKING DEBT FUND This product is suitable for investors who are seeking*l Regular income over short to medium terml Investment in debt and money market instruments issued by banksl Low risk ¢ (BLUE)
AXIS TREASURY ADVANTAGE FUND This product is suitable for investors who are seeking*l Regular income over short terml Investment in debt and money market instrumentsl Low risk ¢ (BLUE)
AXIS LIQUID FUND This product is suitable for investors who are seeking*l Regular income over short terml Investment in debt and money market instrumentsl Low risk ¢ (BLUE)
AXIS ENHANCED ARBITRAGE FUND This product is suitable for investors who are seeking*l Income over short to medium terml Investment in arbitrage opportunities in the cash & derivatives segment of the equity market l Medium risk ¢ (YELLOW)
AXIS FIXED INCOME OPPORTUNITIES FUND This product is suitable for investors who are seeking*l Stable returns in the short to medium terml Investment in debt and money market instruments across the yield curve and credit spectrum l Low risk ¢ (BLUE)
AXIS GOLD ETF This product is suitable for investors who are seeking*l Capital Appreciation over medium to long terml Invests predominantly in gold in order to generate returns similar to the performance of gold, subject to tracking errorl Medium risk ¢ (YELLOW)
AXIS GOLD FUND This product is suitable for investors who are seeking*l Capital Appreciation over medium to long terml Invests predominantly in Axis Gold ETF in order to generate returns similar to the underlying fund, subject to tracking error l Medium risk ¢ (YELLOW)
Statutory Details & Disclaimers :Axis Mutual Fund has been established as a Trust under the Indian Trusts Act, 1882, sponsored by Axis Bank Ltd. (liability restricted to ` 1 Lakh). Trustee: Axis Mutual Fund Trustee Limited. Investment Manager: Axis Asset Management Company Limited (the AMC). Risk Factors: Axis Bank Limited is not liable or responsible for any loss or shortfall resulting from the operation of any of the mutual fund schemes launched by the AMC. Mutual Fund Investments are subject to market risks, read all scheme related documents carefully.
Mar 30, 2012 to Mar 28, 2013
Absolute Return (%)
Mar 28, 2013 to Mar 31, 2014
Absolute Return (%)
Mar 31, 2014 to Mar 31, 2015
Absolute Return (%)
Since Inception CAGR (%)
Current Value of Investment if ` 10,000
was invested on inception date
Date of inception
Axis Banking Debt Fund - Direct Plan - Growth - 9.57% 9.42% 9.24% 12,19401-Jan-13Crisil Short Term Bond Fund Index (Benchmark) - 8.78% 10.40% 9.43% 12,240
Crisil 1 Year T-Bill Index (Additional Benchmark) - 5.77% 8.82% 7.42% 11,743Axis Treasury Advantage Fund - Growth 9.32% 9.68% 8.56% 8.35% 15,513
09-Oct-09Crisil Liquid Fund Index (Benchmark) 8.17% 9.46% 9.06% 7.82% 15,102Crisil 1 Year T-Bill Index (Additional Benchmark) 8.33% 5.77% 8.82% 6.31% 13,979Axis Treasury Advantage Fund - Direct Plan - Growth - 10.04% 9.18% 9.49% 12,256
01-Jan-13Crisil Liquid Fund Index (Benchmark) - 9.46% 9.06% 9.11% 12,162Crisil 1 Year T-Bill Index (Additional Benchmark) - 5.77% 8.82% 7.42% 11,743Axis Treasury Advantage Fund - Retail Plan - Growth 8.43% 8.73% 7.87% 7.98% 14,773
03-Mar-10Crisil Liquid Fund Index (Benchmark) 8.17% 9.46% 9.06% 8.20% 14,923Crisil 1 Year T-Bill Index (Additional Benchmark) 8.33% 5.77% 8.82% 6.60% 13,838Axis Gold ETF 3.71% -7.90% -6.32% 4.81% 12,291 10-Nov-10Domestic Price of Gold 2.59% -10.77% -5.23% 3.93% 11,842Additional Benchmark Not ApplicableAxis Gold Fund 3.96% -5.19% -13.52% -2.90% 9,035 20-Oct-11Domestic Price of Gold 2.59% -10.77% -5.23% -2.70% 9,101Additional Benchmark Not ApplicableAxis Gold Fund - Direct Plan - -3.97% -12.18% -8.76% 8,140 01-Jan-13Domestic Price of Gold - -10.77% -5.23% -9.03% 8,086Additional Benchmark Not Applicable
* An open ended equity linked savings scheme with a 3 year lock-in. # Scheme Performance may not be strictly comparable with that of its additional benchmark in view of hybrid nature of the scheme.% Please note that w.e.f. 27th April 2015, Axis Hybrid Fund – Series (5-7) will be managed by Aswin Patni along with Devang Shah. Previously, the same was managed by Jinesh Gopani and Devang Shah. $ Please note that w.e.f. 27th April 2015, Axis Capital Protection Oriented Fund - Series 5 will be managed by Aswin Patni along with R Sivakumar. Previously, the same was managed by Sudhanshu Asthana and R Sivakumar.