singapore office and retail market overview
TRANSCRIPT
38Mapletree Commercial Trust
Singapore Office andRetail Market OverviewBy CBRE Pte. Ltd. 8 June 2013
Annual Report 2012/13
1 The Singapore Economy Singapore’s economy avoided recession in 2012 with a
GDP growth of 1.3% y-o-y. The main strain came from the relatively weak manufacturing sector, which is reliant on exports and susceptible to adverse global developments. In addition, headline inflation caused some concern in the first half of 2012, though inflationary pressure eased significantly in the second half of the year, with 2012’s inflation ending at 4.6%.
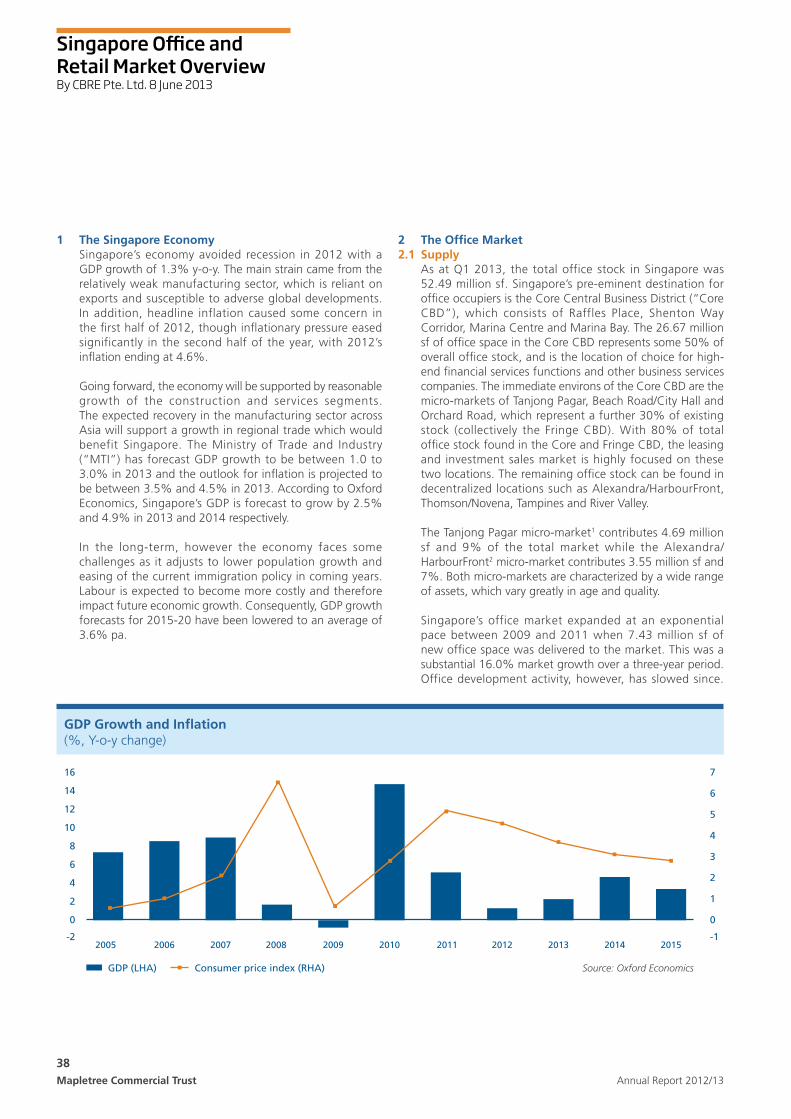
Going forward, the economy will be supported by reasonable growth of the construction and services segments. The expected recovery in the manufacturing sector across Asia will support a growth in regional trade which would benefit Singapore. The Ministry of Trade and Industry (“MTI”) has forecast GDP growth to be between 1.0 to 3.0% in 2013 and the outlook for inflation is projected to be between 3.5% and 4.5% in 2013. According to Oxford Economics, Singapore’s GDP is forecast to grow by 2.5% and 4.9% in 2013 and 2014 respectively.
In the long-term, however the economy faces some challenges as it adjusts to lower population growth and easing of the current immigration policy in coming years. Labour is expected to become more costly and therefore impact future economic growth. Consequently, GDP growth forecasts for 2015-20 have been lowered to an average of 3.6% pa.
2 The Office Market2.1 Supply As at Q1 2013, the total office stock in Singapore was
52.49 million sf. Singapore’s pre-eminent destination for office occupiers is the Core Central Business District (“Core CBD”), which consists of Raffles Place, Shenton Way Corridor, Marina Centre and Marina Bay. The 26.67 million sf of office space in the Core CBD represents some 50% of overall office stock, and is the location of choice for high-end financial services functions and other business services companies. The immediate environs of the Core CBD are the micro-markets of Tanjong Pagar, Beach Road/City Hall and Orchard Road, which represent a further 30% of existing stock (collectively the Fringe CBD). With 80% of total office stock found in the Core and Fringe CBD, the leasing and investment sales market is highly focused on these two locations. The remaining office stock can be found in decentralized locations such as Alexandra/HarbourFront, Thomson/Novena,TampinesandRiverValley.
The Tanjong Pagar micro-market1 contributes 4.69 million sf and 9% of the total market while the Alexandra/HarbourFront2 micro-market contributes 3.55 million sf and 7%. Both micro-markets are characterized by a wide range of assets, which vary greatly in age and quality.
Singapore’s office market expanded at an exponential pace between 2009 and 2011 when 7.43 million sf of new office space was delivered to the market. This was a substantial 16.0% market growth over a three-year period. Office development activity, however, has slowed since.
Source: Oxford Economics
GDP Growth and Inflation (%, Y-o-y change)
16
14
12
10
8
6
4
2
0
-2
7
6
5
4
3
2
1
0
-1
GDP (LHA) Consumer price index (RHA)
2005 2006 2007 2008 2009 2010 2011 2012 2013 2014 2015
39Mapletree Commercial TrustAnnual Report 2012/13
For the confidentiality reasons CBRE cannot provide the full list of buildings in the particular baskets but to name a few key projects. 1 The Tanjong Pagar basket of properties consists of 23 buildings that total 4.7 million sf, none of which is classified as Grade A. The key projects are 79 Anson
Road, Keppel Towers, Axa Tower, Mapletree Anson and Twenty Anson among others.2 The Alexandra/HarbourFront basket of properties consists of 12 buildings that total 3.5 million sf, none of which is classified as Grade A. The key projects
are HarbourFront Tower 1 and 2, Keppel Bay Tower, HarbourFront Centre and PSA Building among others.3 Net new supply is calculated as a sum of new completions, demolitions and conversions.
The market grew by 2.5% in just over a year (Q1 2012 to Q1 2013 inclusive) with a total of 1.34 million sf of new office space completed mainly in two office projects - Marina Bay Financial Centre Tower 3 (totalling 1,300,000 sf) and One Upper Pickering (office component of ParkRoyal on Pickering, totalling 70,000 sf), completed in Q1 2012 and Q3 2012 respectively.
In terms of net new office supply3, the 10-year average was 1.10 million sf while the 5-year average was 1.67 million sf. In comparison, 2012’s net supply of 923,200 sf is below these long term averages, which has provided some support to the office leasing market despite the weak global economy. Q1 2013 net supply was a negative 274,800 sf, due to a number of projects being demolished or vacated for conversion;namely138RobinsonRd(totalling121,674sf)and Marina Bayfront (totalling 153,172 sf).
Both Tanjong Pagar and Alexandra/HarbourFront micro-markets remain tight on new supply with no recent completions. In Tanjong Pagar the last developments were Twenty Anson (completed in Q4 2009) and Mapletree Anson (completed in Q3 2009). The last completion in the Alexandra/HarbourFront micro-market was the office component of Mapletree Business City (completed in Q2 2010).
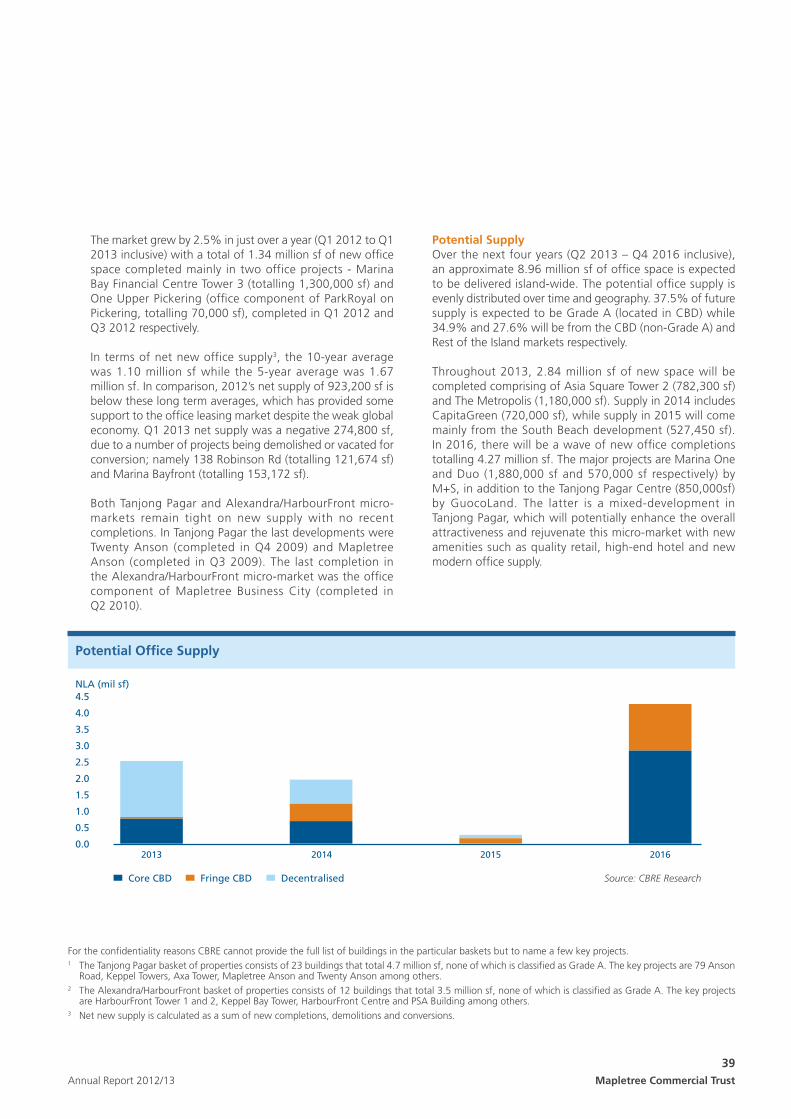
Potential Supply Over the next four years (Q2 2013 – Q4 2016 inclusive),
an approximate 8.96 million sf of office space is expected to be delivered island-wide. The potential office supply is evenly distributed over time and geography. 37.5% of future supply is expected to be Grade A (located in CBD) while 34.9% and 27.6% will be from the CBD (non-Grade A) and Rest of the Island markets respectively.
Throughout 2013, 2.84 million sf of new space will be completed comprising of Asia Square Tower 2 (782,300 sf) and The Metropolis (1,180,000 sf). Supply in 2014 includes CapitaGreen (720,000 sf), while supply in 2015 will come mainly from the South Beach development (527,450 sf). In 2016, there will be a wave of new office completions totalling 4.27 million sf. The major projects are Marina One and Duo (1,880,000 sf and 570,000 sf respectively) by M+S, in addition to the Tanjong Pagar Centre (850,000sf) by GuocoLand. The latter is a mixed-development in Tanjong Pagar, which will potentially enhance the overall attractiveness and rejuvenate this micro-market with new amenities such as quality retail, high-end hotel and new modern office supply.
Source: CBRE Research
Potential Office Supply
4.5
4.0
3.5
3.0
2.5
2.0
1.5
1.0
0.5
0.0
Core CBD Fringe CBD Decentralised
2013 20152014 2016
NLA (mil sf)
40Mapletree Commercial Trust Annual Report 2012/13
Singapore Office andRetail Market OverviewBy CBRE Pte. Ltd. 8 June 2013
There are no office developments scheduled in the Alexandra/HarbourFront micro-market in the next five years. However, approximately 1.0 million sf of business park space will be delivered in Mapletree Business City Phase II in 2016.
As at Q1 2013, the estimated secondary space is calculated to be approximately 282,000 sf. This is a vast improvement from the estimated 840,000 sf of secondary space projected for 2013 in Q4 2012. It has been observed that some older buildings and portfolios have enjoyed considerable success in back-filling such space. In addition, some landlords have also taken the opportunity to undertake asset enhancement works when their anchor / larger tenants relocate. This may cause a delay in the availability of some of the secondary space;forinstance,6ShentonWay(formerlyDBSBuilding). The positive net absorption of the secondary space is likely to ease some of the downward rental pressures on the Grade B market segment.
2.2 Demand In 2012 and early 2013, office demand was diverse with
occupiers from a wide variety of industries relocating or expanding. Office space has been mostly taken up by commodity and energy companies, maritime, insurance, legal and professional services companies. Diversification has also taken place in terms of nationalities. It was reported that there have been more Japanese services firms setting up in Singapore. According to the Singapore Economic Development Board, there were 29 new Japanese companies’ registrations in 2012 as compared to only six in 2008.
Conversely, demand from banks and other financial institutions have stayed subdued along with anchor tenant deals seeking large floor-plate requirements. However, the Singapore office market has retained its cost competitive edge over other regional cities and some corporates took advantage of lower occupancy costs to either consolidate or incrementally expand their operations. This has dramatically helped to stimulate leasing activity. Furthermore, flight to quality has been a pronounced feature of tenant movement in core locations but a strong appetite to move out of CBD to quality decentralised space has also been observed.
Leasing sentiment was boosted by relatively high pre-commitment levels in the upcoming The Metropolis (65% pre-let as of Q1 2013 to a diverse mix of occupiers suchasProctor&Gamble,ShellInternationalB.V.,NeptuneOrient Lines and the Singapore Exchange), JEM (100% pre-let to MND), Westgate Tower (50% pre-let to CapitaLand) as well as Asia Square Tower 2 (20% pre-let to tenants such as Allianz, National Australia Bank, JustOffice and Swiss RE).
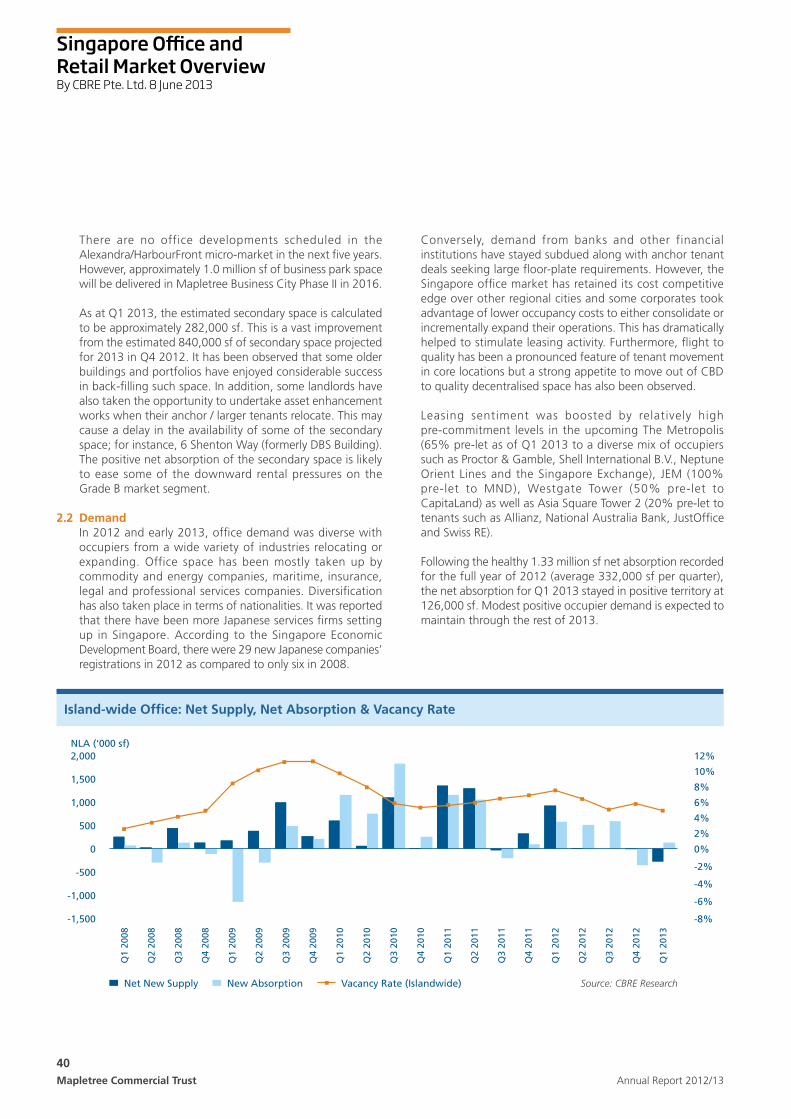
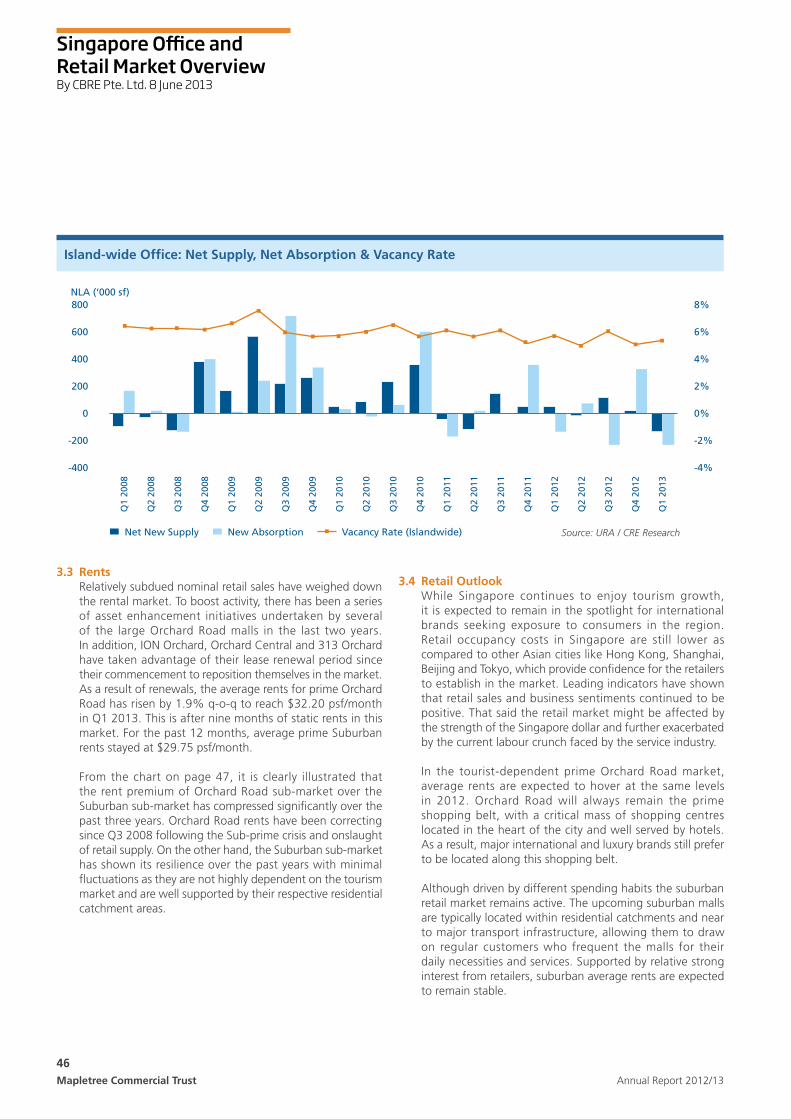
Following the healthy 1.33 million sf net absorption recorded for the full year of 2012 (average 332,000 sf per quarter), the net absorption for Q1 2013 stayed in positive territory at 126,000 sf. Modest positive occupier demand is expected to maintain through the rest of 2013.
Net New Supply New Absorption Source: CBRE Research
Island-wide Office: Net Supply, Net Absorption & Vacancy Rate
2,000NLA (‘000 sf)
1,500
1,000
500
0
-500
-1,000
-1,500
12%
10%
8%
6%
4%
2%
0%
-2%
-4%
-6%
-8%
Vacancy Rate (Islandwide)
Q1
2008
Q2
2008
Q3
2008
Q4
2008
Q1
2009
Q2
2009
Q3
2009
Q4
2009
Q1
2010
Q2
2010
Q3
2010
Q4
2010
Q1
2011
Q2
2011
Q3
2011
Q4
2011
Q1
2012
Q2
2012
Q3
2012
Q4
2012
Q1
2013
41Mapletree Commercial TrustAnnual Report 2012/13
Office demand in Tanjong Pagar has benefited from its proximity to the Core CBD, the planned urban regeneration of the area and the expected relocation of existing occupiers of the nearby GE and Keppel Towers (totalling 430,122 sf). The two developments are due to be demolished and converted for residential use although no time horizon has been announced. On average, the 10-year annual net absorption in this micro-market is 118,300 sf while in Q1 2013 it was a positive 14,800 sf.
Alexandra/HarbourFront is a well located micro-market that has outperformed other micro-markets during periods of downturn when occupiers opted for more affordable quality office space that was close to the CBD as part of their cost rationalization. It remains an attractive solution to occupier who prefer fringe locations with good amenities. On average, the 10-year annual net absorption in this micro-market is 165,900 sf, while Q1 2013 was a negative 17,100 sf. Net absorption in this micro-market is projected to stay close to zero in 2013 and 2014.
2.3 Vacancy Rates Positive net absorption in 2012 and Q1 2013 served to
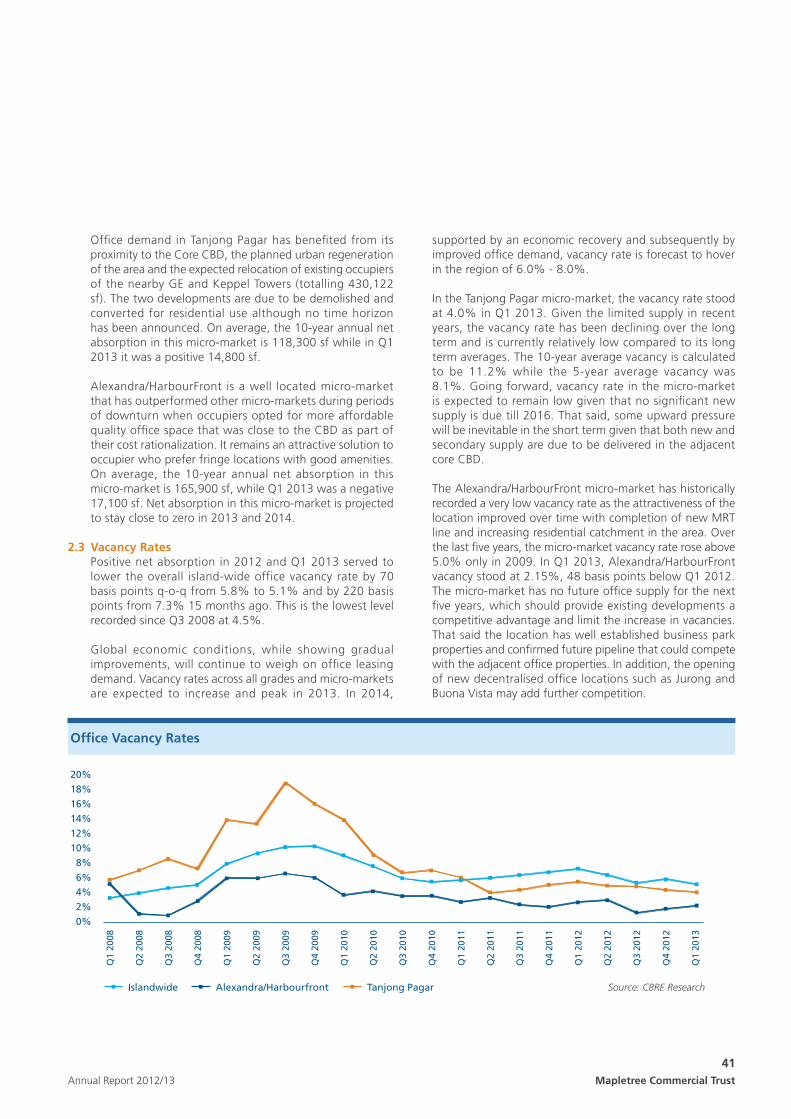
lower the overall island-wide office vacancy rate by 70 basis points q-o-q from 5.8% to 5.1% and by 220 basis points from 7.3% 15 months ago. This is the lowest level recorded since Q3 2008 at 4.5%.
Global economic conditions, while showing gradual improvements, will continue to weigh on office leasing demand.Vacancyratesacrossallgradesandmicro-marketsare expected to increase and peak in 2013. In 2014,
supported by an economic recovery and subsequently by improved office demand, vacancy rate is forecast to hover in the region of 6.0% - 8.0%.
In the Tanjong Pagar micro-market, the vacancy rate stood at 4.0% in Q1 2013. Given the limited supply in recent years, the vacancy rate has been declining over the long term and is currently relatively low compared to its long term averages. The 10-year average vacancy is calculated to be 11.2% while the 5-year average vacancy was 8.1%. Going forward, vacancy rate in the micro-market is expected to remain low given that no significant new supply is due till 2016. That said, some upward pressure will be inevitable in the short term given that both new and secondary supply are due to be delivered in the adjacent core CBD.
The Alexandra/HarbourFront micro-market has historically recorded a very low vacancy rate as the attractiveness of the location improved over time with completion of new MRT line and increasing residential catchment in the area. Over the last five years, the micro-market vacancy rate rose above 5.0% only in 2009. In Q1 2013, Alexandra/HarbourFront vacancy stood at 2.15%, 48 basis points below Q1 2012. The micro-market has no future office supply for the next five years, which should provide existing developments a competitive advantage and limit the increase in vacancies. That said the location has well established business park properties and confirmed future pipeline that could compete with the adjacent office properties. In addition, the opening of new decentralised office locations such as Jurong and BuonaVistamayaddfurthercompetition.
Source: CBRE Research
Office Vacancy Rates
20%
18%
16%
14%
12%
10%
8%
6%
4%
2%
0%
Islandwide Alexandra/Harbourfront Tanjong Pagar
Q1
2008
Q2
2008
Q3
2008
Q4
2008
Q1
2009
Q2
2009
Q3
2009
Q4
2009
Q1
2010
Q2
2010
Q3
2010
Q4
2010
Q1
2011
Q2
2011
Q3
2011
Q4
2011
Q1
2012
Q2
2012
Q3
2012
Q4
2012
Q1
2013
42Mapletree Commercial Trust Annual Report 2012/13
Singapore Office andRetail Market OverviewBy CBRE Pte. Ltd. 8 June 2013
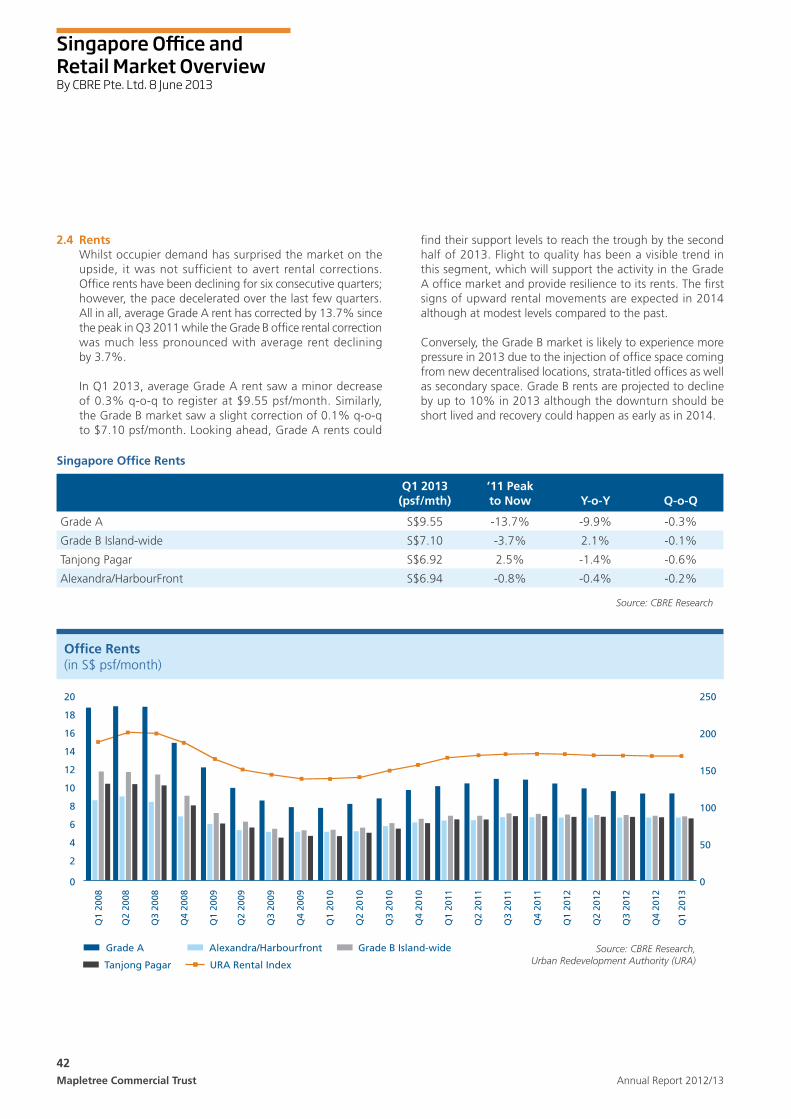
find their support levels to reach the trough by the second half of 2013. Flight to quality has been a visible trend in this segment, which will support the activity in the Grade A office market and provide resilience to its rents. The first signs of upward rental movements are expected in 2014 although at modest levels compared to the past.
Conversely, the Grade B market is likely to experience more pressure in 2013 due to the injection of office space coming from new decentralised locations, strata-titled offices as well as secondary space. Grade B rents are projected to decline by up to 10% in 2013 although the downturn should be short lived and recovery could happen as early as in 2014.
2.4 Rents Whilst occupier demand has surprised the market on the
upside, it was not sufficient to avert rental corrections. Officerentshavebeendecliningforsixconsecutivequarters;however, the pace decelerated over the last few quarters. All in all, average Grade A rent has corrected by 13.7% since the peak in Q3 2011 while the Grade B office rental correction was much less pronounced with average rent declining by 3.7%.
In Q1 2013, average Grade A rent saw a minor decrease of 0.3% q-o-q to register at $9.55 psf/month. Similarly, the Grade B market saw a slight correction of 0.1% q-o-q to $7.10 psf/month. Looking ahead, Grade A rents could
Office Rents (in S$ psf/month)
20
18
16
14
12
10
8
6
4
2
0
250
200
150
100
50
0
Source: CBRE Research, Urban Redevelopment Authority (URA)
Grade A Alexandra/Harbourfront Grade B Island-wide
Tanjong Pagar URA Rental Index
Q1
2008
Q2
2008
Q3
2008
Q4
2008
Q1
2009
Q2
2009
Q3
2009
Q4
2009
Q1
2010
Q2
2010
Q3
2010
Q4
2010
Q1
2011
Q2
2011
Q3
2011
Q4
2011
Q1
2012
Q2
2012
Q3
2012
Q4
2012
Q1
2013
Source: CBRE Research
Singapore Office Rents
Q1 2013 (psf/mth)
’11 Peak to Now Y-o-Y Q-o-Q
Grade A S$9.55 -13.7% -9.9% -0.3%
Grade B Island-wide S$7.10 -3.7% 2.1% -0.1%
Tanjong Pagar S$6.92 2.5% -1.4% -0.6%
Alexandra/HarbourFront S$6.94 -0.8% -0.4% -0.2%
43Mapletree Commercial TrustAnnual Report 2012/13
Despite moving in tandem with the island-wide office rental cycle, Tanjong Pagar rents have displayed less volatility over the past five years. This is primarily due to the tenant mix in the Tanjong Pagar micro-market, which has a higher percentage of non-banking and financial services office tenants compared to Core CBD. Average office rents had grown by 48.3 % since the bottom in 2009 and peaked at S$7.10 psf/month in Q3 2011. They have since declined by a limited 2.5% to $6.92 psf/month in Q1 2013. New developments (built since 2008) in the Tanjong Pagar area, however, have commanded rents of $8.00 psf/mth in Q1 2013. This is a substantially higher rental level compared to the full Tanjong Pagar micro-market rent, indicating a substantial difference between the new and old stock in the area. Looking ahead, a combination of fairly valued office rents in Tanjong Pagar and less new supply alternatives appearing in the immediate neighbourhood will support stable rental performance in the next six to twelve months.
Average office rents in Alexandra/HarbourFront peaked at S$7.00 psf/month in Q3 2011 and it has since declined by a limited 0.8% to $6.94 psf/month in Q1 2013. Going forward, the Alexandra/HarbourFront rents are expected to remain stable throughout 2013 and 2014 considering the low vacancy in the micro-market.
2.5 Office Outlook The risk of a severe global recession has moderated with
well-aimed policy initiatives of the major central banks globally;however,therecoveryislikelytobegradualandlong drawn.
Regardless, Singapore’s office demand in 2012 has surprised on the upside and it is expected to remain in positive territory throughout 2013 as the city has retained its attractiveness to occupiers as a base for their regional operations. “Flight to quality” will remain the key trend in the next six to twelve months where occupiers will take the opportunity to consolidate or expand their operations due to the relatively lower occupancy costs.
Grade A rents are forecast to remain stable in the next six to eight months and recover thereafter. While overall demand is expected to remain positive, Grade B office space of lower technical quality and in less prime locations is likely to see rents declining further mostly due to the weight of supply available.
Any hint of a global economic recovery will translate to a stronger recovery in the office market. That said the strength of upside remains highly dependent on the health of the financial industry, which has driven leasing demand in the past. In order to outperform other global business cities in such market conditions, Singapore will have to use the advantage of being an attractive location and a lower cost base destination to attract new occupiers in the future.
3 The Retail Market3.1 Supply As at Q1 2013, the total island-wide retail stock stood at
36.86 million sf. By market size comparison, the Fringe Area still accounts for the largest share at 27.6%, followed by Outside Central Region (22.4%), Orchard Road (20.3%), Rest of Central Area (18.2%) and the Downtown Core Region (11.6%).
Driven by strong demand and appetite for new retail space, the market expanded exponentially in recent years. In the period from 2009 to 2012, approximately 2.21 million sf of new retail space was added to total private retail supply. 2009 witnessed the largest addition of approximately 1.37 million sf retail space, mostly in the Orchard submarket. Major malls completed along Orchard Road since 2009 include Ion Orchard (660,000 sf), Orchard Central (250,000 sf), 313 Somerset (294,000 sf), Mandarin Gallery (130,000 sf) and TripleOne Somerset (294,000 sf).
After 2009, the bulk of the retail supply has come from outside the prime area of Orchard. This includes Marina Bay Shoppes (800,000 sf) and Resorts World Sentosa (330,000 sf) as well as nex (600,000 sf). Other notable malls completed outside Orchard include Rochester Mall (95,300 sf), Changi City Point (207,400 sf) and the convenience centre Alexandra Retail Centre (89,600 sf). Most recently, several landlords have embarked on asset enhancement initiatives (AEI) on their assets in order to keep up with new trends.
44Mapletree Commercial Trust Annual Report 2012/13
Singapore Office andRetail Market OverviewBy CBRE Pte. Ltd. 8 June 2013
The inclusion of Resorts World Sentosa and Alexandra Retail Centre was the only retail supply in the HarbourFront/ Telok BlangahareasinceVivoCityin2006.Itshouldbenotedthat the retail space in Resorts World Sentosa has been predominantly taken up by food & beverage outlets as well asamastertenant.Assuch,VivoCitystillremainstheonlyfull-fledged shopping mall serving the area.
The only new retail developments in Tanjong Pagar in recent years were a retail podium of ICON (totalling 30,000 sf) completed in 2007, followed by recent asset enhancement of 100AM (totalling 110,000 sf) completed in 2012. Retail in the Tanjong Pagar area predominantly caters to the working population in the area, but also serves the increasing resident population.
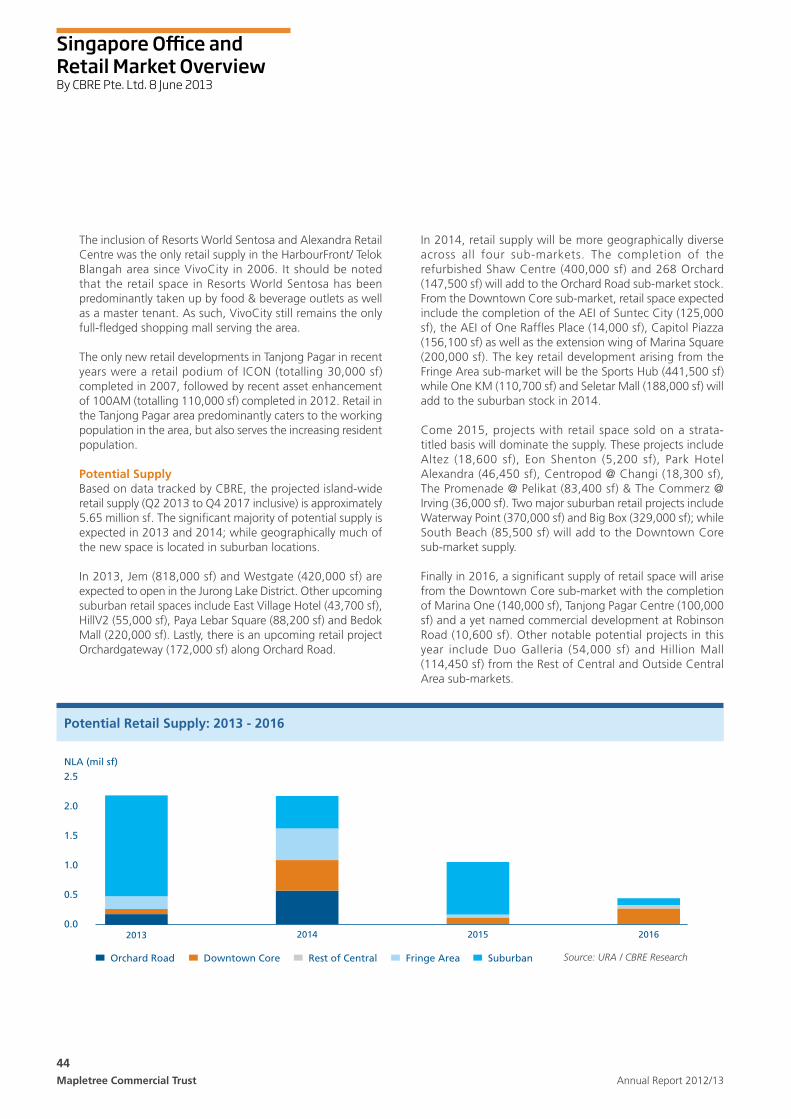
Potential Supply Based on data tracked by CBRE, the projected island-wide
retail supply (Q2 2013 to Q4 2017 inclusive) is approximately 5.65 million sf. The significant majority of potential supply is expectedin2013and2014;whilegeographicallymuchofthe new space is located in suburban locations.
In 2013, Jem (818,000 sf) and Westgate (420,000 sf) are expected to open in the Jurong Lake District. Other upcoming suburbanretailspacesincludeEastVillageHotel(43,700sf),HillV2(55,000sf),PayaLebarSquare(88,200sf)andBedokMall (220,000 sf). Lastly, there is an upcoming retail project Orchardgateway (172,000 sf) along Orchard Road.
In 2014, retail supply will be more geographically diverse across all four sub-markets. The completion of the refurbished Shaw Centre (400,000 sf) and 268 Orchard (147,500 sf) will add to the Orchard Road sub-market stock. From the Downtown Core sub-market, retail space expected include the completion of the AEI of Suntec City (125,000 sf), the AEI of One Raffles Place (14,000 sf), Capitol Piazza (156,100 sf) as well as the extension wing of Marina Square (200,000 sf). The key retail development arising from the Fringe Area sub-market will be the Sports Hub (441,500 sf) while One KM (110,700 sf) and Seletar Mall (188,000 sf) will add to the suburban stock in 2014.
Come 2015, projects with retail space sold on a strata-titled basis will dominate the supply. These projects include Altez (18,600 sf), Eon Shenton (5,200 sf), Park Hotel Alexandra (46,450 sf), Centropod @ Changi (18,300 sf), The Promenade @ Pelikat (83,400 sf) & The Commerz @ Irving (36,000 sf). Two major suburban retail projects include WaterwayPoint(370,000sf)andBigBox(329,000sf);whileSouth Beach (85,500 sf) will add to the Downtown Core sub-market supply.
Finally in 2016, a significant supply of retail space will arise from the Downtown Core sub-market with the completion of Marina One (140,000 sf), Tanjong Pagar Centre (100,000 sf) and a yet named commercial development at Robinson Road (10,600 sf). Other notable potential projects in this year include Duo Galleria (54,000 sf) and Hillion Mall (114,450 sf) from the Rest of Central and Outside Central Area sub-markets.
NLA (mil sf)
Source: URA / CBRE Research
Potential Retail Supply: 2013 - 2016
2.5
2.0
1.5
1.0
0.5
0.0
Orchard Road Downtown Core Rest of Central Fringe Area Suburban
2013 2014 2015 2016
45Mapletree Commercial TrustAnnual Report 2012/13
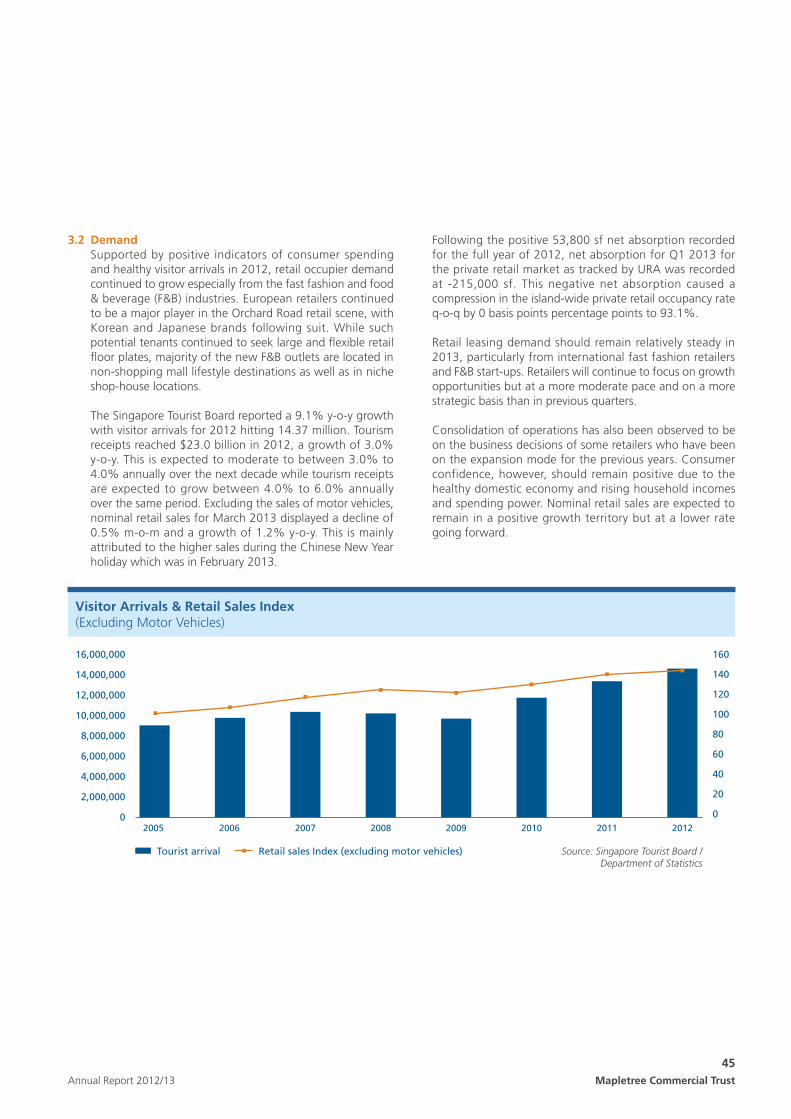
3.2 Demand Supported by positive indicators of consumer spending
and healthy visitor arrivals in 2012, retail occupier demand continued to grow especially from the fast fashion and food & beverage (F&B) industries. European retailers continued to be a major player in the Orchard Road retail scene, with Korean and Japanese brands following suit. While such potential tenants continued to seek large and flexible retail floor plates, majority of the new F&B outlets are located in non-shopping mall lifestyle destinations as well as in niche shop-house locations.
The Singapore Tourist Board reported a 9.1% y-o-y growth with visitor arrivals for 2012 hitting 14.37 million. Tourism receipts reached $23.0 billion in 2012, a growth of 3.0% y-o-y. This is expected to moderate to between 3.0% to 4.0% annually over the next decade while tourism receipts are expected to grow between 4.0% to 6.0% annually over the same period. Excluding the sales of motor vehicles, nominal retail sales for March 2013 displayed a decline of 0.5% m-o-m and a growth of 1.2% y-o-y. This is mainly attributed to the higher sales during the Chinese New Year holiday which was in February 2013.
Source: Singapore Tourist Board / Department of Statistics
Visitor Arrivals & Retail Sales Index (ExcludingMotorVehicles)
16,000,000
14,000,000
12,000,000
10,000,000
8,000,000
6,000,000
4,000,000
2,000,000
0
160
140
120
100
80
60
40
20
0
Tourist arrival Retail sales Index (excluding motor vehicles)
2005 2006 2007 2008 2009 2010 2011 2012
Following the positive 53,800 sf net absorption recorded for the full year of 2012, net absorption for Q1 2013 for the private retail market as tracked by URA was recorded at -215,000 sf. This negative net absorption caused a compression in the island-wide private retail occupancy rate q-o-q by 0 basis points percentage points to 93.1%.
Retail leasing demand should remain relatively steady in 2013, particularly from international fast fashion retailers and F&B start-ups. Retailers will continue to focus on growth opportunities but at a more moderate pace and on a more strategic basis than in previous quarters.
Consolidation of operations has also been observed to be on the business decisions of some retailers who have been on the expansion mode for the previous years. Consumer confidence, however, should remain positive due to the healthy domestic economy and rising household incomes and spending power. Nominal retail sales are expected to remain in a positive growth territory but at a lower rate going forward.
46Mapletree Commercial Trust Annual Report 2012/13
Singapore Office andRetail Market OverviewBy CBRE Pte. Ltd. 8 June 2013
3.4 Retail Outlook While Singapore continues to enjoy tourism growth,
it is expected to remain in the spotlight for international brands seeking exposure to consumers in the region. Retail occupancy costs in Singapore are still lower as compared to other Asian cities like Hong Kong, Shanghai, Beijing and Tokyo, which provide confidence for the retailers to establish in the market. Leading indicators have shown that retail sales and business sentiments continued to be positive. That said the retail market might be affected by the strength of the Singapore dollar and further exacerbated by the current labour crunch faced by the service industry.
In the tourist-dependent prime Orchard Road market, average rents are expected to hover at the same levels in 2012. Orchard Road will always remain the prime shopping belt, with a critical mass of shopping centres located in the heart of the city and well served by hotels. As a result, major international and luxury brands still prefer to be located along this shopping belt.
Although driven by different spending habits the suburban retail market remains active. The upcoming suburban malls are typically located within residential catchments and near to major transport infrastructure, allowing them to draw on regular customers who frequent the malls for their daily necessities and services. Supported by relative strong interest from retailers, suburban average rents are expected to remain stable.
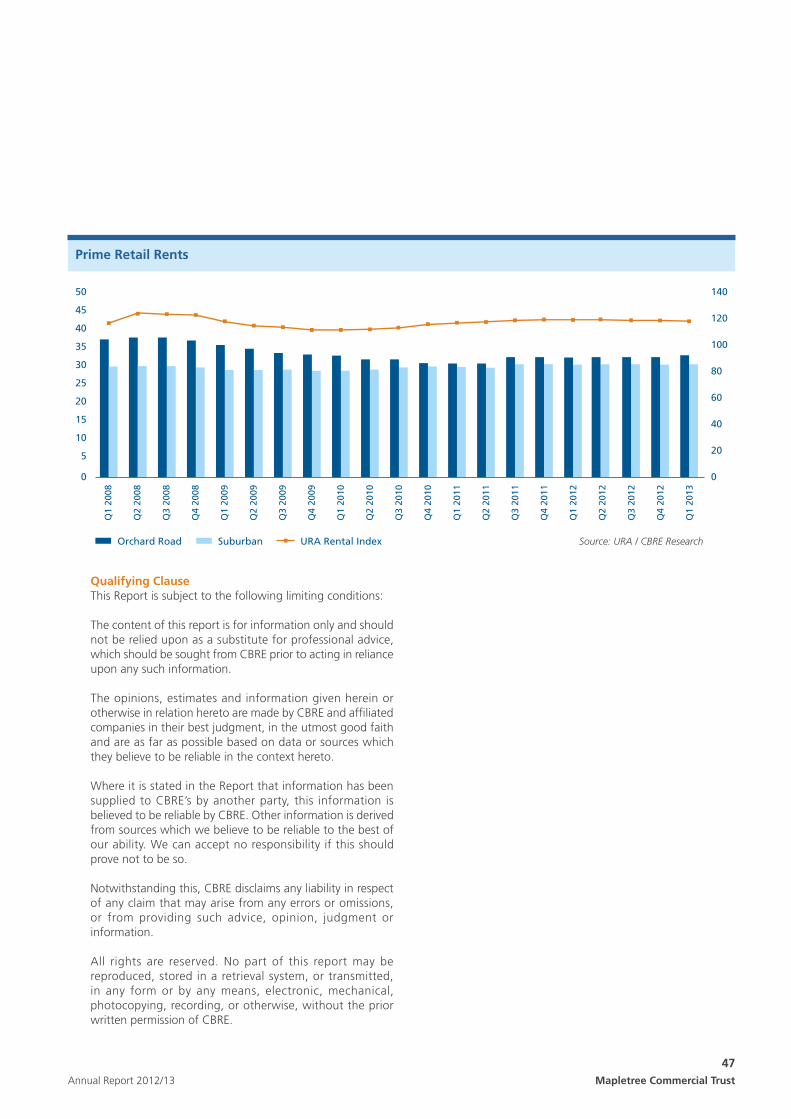
3.3 Rents Relatively subdued nominal retail sales have weighed down
the rental market. To boost activity, there has been a series of asset enhancement initiatives undertaken by several of the large Orchard Road malls in the last two years. In addition, ION Orchard, Orchard Central and 313 Orchard have taken advantage of their lease renewal period since their commencement to reposition themselves in the market. As a result of renewals, the average rents for prime Orchard Road has risen by 1.9% q-o-q to reach $32.20 psf/month in Q1 2013. This is after nine months of static rents in this market. For the past 12 months, average prime Suburban rents stayed at $29.75 psf/month.
From the chart on page 47, it is clearly illustrated that the rent premium of Orchard Road sub-market over the Suburban sub-market has compressed significantly over the past three years. Orchard Road rents have been correcting since Q3 2008 following the Sub-prime crisis and onslaught of retail supply. On the other hand, the Suburban sub-market has shown its resilience over the past years with minimal fluctuations as they are not highly dependent on the tourism market and are well supported by their respective residential catchment areas.
Net New Supply New Absorption Source: URA / CRE Research
Island-wide Office: Net Supply, Net Absorption & Vacancy Rate
800NLA (‘000 sf)
600
400
200
0
-200
-400
8%
6%
4%
2%
0%
-2%
-4%
Vacancy Rate (Islandwide)
Q1
2008
Q2
2008
Q3
2008
Q4
2008
Q1
2009
Q2
2009
Q3
2009
Q4
2009
Q1
2010
Q2
2010
Q3
2010
Q4
2010
Q1
2011
Q2
2011
Q3
2011
Q4
2011
Q1
2012
Q2
2012
Q3
2012
Q4
2012
Q1
2013
47Mapletree Commercial TrustAnnual Report 2012/13
Qualifying Clause This Report is subject to the following limiting conditions: The content of this report is for information only and should
not be relied upon as a substitute for professional advice, which should be sought from CBRE prior to acting in reliance upon any such information.
The opinions, estimates and information given herein or otherwise in relation hereto are made by CBRE and affiliated companies in their best judgment, in the utmost good faith and are as far as possible based on data or sources which they believe to be reliable in the context hereto.
Where it is stated in the Report that information has been supplied to CBRE’s by another party, this information is believed to be reliable by CBRE. Other information is derived from sources which we believe to be reliable to the best of our ability. We can accept no responsibility if this should prove not to be so.
Notwithstanding this, CBRE disclaims any liability in respect of any claim that may arise from any errors or omissions, or from providing such advice, opinion, judgment or information.
All rights are reserved. No part of this report may be reproduced, stored in a retrieval system, or transmitted, in any form or by any means, electronic, mechanical, photocopying, recording, or otherwise, without the prior written permission of CBRE.
Prime Retail Rents
50
45
40
35
30
25
20
15
10
5
0
140
120
100
80
60
40
20
0
Source: URA / CBRE ResearchOrchard Road Suburban URA Rental Index
Q1
2008
Q2
2008
Q3
2008
Q4
2008
Q1
2009
Q2
2009
Q3
2009
Q4
2009
Q1
2010
Q2
2010
Q3
2010
Q4
2010
Q1
2011
Q2
2011
Q3
2011
Q4
2011
Q1
2012
Q2
2012
Q3
2012
Q4
2012
Q1
2013