simultaneous measurement of refractive index and thickness by combining low-coherence interferometry...
TRANSCRIPT

Simultaneous measurement of refractive index and thickness by combining low-coherence
interferometry and confocal optics Seokhan Kim, Jihoon Na, Myoung Jin Kim, and Byeong Ha Lee
Department of Information and Communications, Gwangju Institute of Science and Technology 1 Oryong-dong, Buk-Gu, Gwangju, 500-712, Korea
Abstract: We propose and demonstrate novel methods that enable simultaneous measurements of the phase index, the group index, and the geometrical thickness of an optically transparent object by combining optical low-coherence interferometer and confocal optics. The low-coherence interferometer gives information relating the group index with the thickness, while the confocal optics allows access to the phase index related with the thickness of the sample. To relate these, two novel methods were devised. In the first method, the dispersion-induced broadening of the low-coherence envelop signal was utilized, and in the second method the frequency derivative of the phase index was directly obtained by taking the confocal measurements at several wavelengths. The measurements were made with eight different samples; B270, CaF2, two of BK7, two of fused silica, cover glass, and cigarette cover film. The average measurement errors of the first and the second methods were 0.123 % and 0.061 % in the geometrical thickness, 0.133 % and 0.066 % in the phase index, and 0.106 % and 0.057 % in the group index, respectively.
©2008 Optical Society of America
OCIS codes: (030.1640) Coherence; (120.3180) Interferometry; (120.5710) Refraction; (180.1790) Confocal microscopy; (260.2030) Dispersion.
References and links
1. D. F. Murphy and D. A. Flavin, “Dispersion-insensitive measurement of thickness and group index by low-coherence interferometry,” Appl. Opt. 39, 4607-4615 (2000).
2. W. V. Sorin and D. F. Gray, “Simultaneous thickness and group index measurement using optical low-coherence reflectometry,” IEEE Photon. Technol. Lett. 4, 105-107 (1992).
3. T. Fukano and I. Yamaguchi, “Simultaneous measurement of thickness and refractive indices of multiple layers by a low-coherence confocal interference microscope,” Opt. Lett. 21, 1942-1944 (1996).
4. M. Ohmi, K. Yoden, Y. Ohnishi, and M. Haruna, “Optical tomography along the geometrical thickness by combination of coherence-gate and confocal imagings,” OFS 14, 288-291 (2000).
5. T. Fukano and I. Yamaguchi, “Separation of measurement of the refractive index and the geometrical thickness by use of a wavelength-scanning interferometer with a confocal microscope,” Appl. Opt. 38, 4065-4073 (1999).
6. A. V. Zvyagin, K. K. M. B. Dilusha Silva, S. A. Alexandrov, T. R. Hillman, J. J. Armstrong, T. Tsuzuki, and D. D. Sampson, “Refractive index tomography of turbid media by bifocal optical coherence refractometry,” Opt. Express, 11, 3503-3517 (2003).
7. S. A. Alexandrov, A. V. Zvyagin, K. K. M. B. Dilusha Silva, and D. D. Sampson, “Bifocal optical coherence refractometry of turbid media,” Opt. Lett. 28, 117-119 (2003).
8. M. Ohmi, Y. Ohnishi, K. Yoden, and M. Haruna, “In Vitro Simultaneous Measurement of Refractive Index and Thickness of Biological Tissue by the Low Coherence Interferometry,” IEEE TBME 47, 1266-1270 (2000).
9. X. Wang, C. Zhang, L. Zhang, L. Wue, and J. Tian, “Simultaneous refractive index and thickness measurements of bio tissue by optical coherence tomography,” JBO 7, 628-632 (2002).
10. M. Haruna, M. Ohmi, T. Mitsuyama, H. Tajiri, H. Maruyama, and M. Hashimoto, “Simultaneous measurement of the phase index and group indices and the thickness of transparent plates by low-coherence interferometry,” Opt. Lett. 23, 966-968 (1998).
#92242 - $15.00 USD Received 29 Jan 2008; revised 12 Mar 2008; accepted 28 Mar 2008; published 4 Apr 2008
(C) 2008 OSA 14 April 2008 / Vol. 16, No. 8 / OPTICS EXPRESS 5516

11. H. Maruyama, T. Mitsuyama, M. Ohmi, and M. Haruna, “Simultaneous Measurement of Refractive Index and Thickness by Low Coherence Interferometry Considering Chromatic Dispersion of Index,” Opt. Rev. 7, 468-472 (2000).
12. H. Maruyama, S. Inoue, T. Mitsuyama, M. Ohmi, and M. Haruna, “Low-coherence interferometer system for the simultaneous measurement of refractive index and thickness,” Appl. Opt. 41, 1315-1322 (2002).
13. M. Ohmi, H. Nishi, T. Konishi, Y. Yamada, and M. Haruna, “High-speed simultaneous measurement of refractive index and thickness of transparent plates by low-coherence interferometry and confocal optics,” Meas. Sci. Technol. 15, 1531-1535 (2004).
14. B. R. Masters, Confocal Microscopy and Multiphoton Excitation Microscopy (SPIE Press, 2005) 15. B. E. Bouma and G. J. Tearney, Handbook of Optical Coherence Tomography (Marcel Dekker, Inc., 2002),
Chap. 2. 16. http://www.cvilaser.com/Common/PDFs/Dispersion_Equations.pdf 17. M. Born and E. Wolf, Principles of Optics, 7 ed., (Cambridge university press, 1999) Ch. 10.
1. Introduction
Measurements of the refractive index and the thickness of materials such as thin films, glass plates, and living tissues are important in optical engineering and biomedical applications. Many of the reported methods are based on the low-coherence interferometer [1, 2] or/and the confocal optics [3-9]. Murphy and Flavin [1] measured the geometric thickness and the group refractive index of a highly dispersive material by using so-called dispersive Fourier transform spectroscopy (DFTS). Sorin and Gray [2] did the similar measurements by using a fiber based optical low-coherence reflectometry (OLCR). Fukano and Yamaguchi [3] used a low-coherence confocal interference microscope to measure the thickness and the refractive indices of multiple layers composed of several parallel plates, i.e., of BK7 glass and fused silica or a stack of commercial cover slips with air gaps. Ohmi et al. [4] obtained the tomography structure of a multilayer sample by combining optical coherence tomography and confocal tomography with the assumption that the phase index was the same as the group index. Fukano et al. [5] proposed a system composed of a confocal microscope and a wavelength-scanning heterodyne interferometer. Zvyagin, et al., [6] used the so-called bifocal optical coherence tomography (BOCR) for tomographic imaging of the refractive index of turbid media with a tunable-focal-length liquid-crystal lens. Alexandrov, et al., [7] reported the similar BOCR method suitable for a turbid medium such as milk solution or human skin with the assumption of negligible dispersion. Ohmi, et al., [8] simultaneously measured the refractive index and the thickness of biological tissue sample of a few hundred micron thickness, including chicken tissue and human tooth, with the combination of confocal optics and low-coherence interferometer. Wang, et al., [9] reported two techniques based on optical coherence tomography, the ‘focus tracking method’ and the ‘optical path shifting method’, for measuring the refractive index of the sarcocarp of a fresh cucumber.
However, most the conventional methods [1-9] were unable to accurately measure the three parameters or variables of a sample; phase index (np), group index (ng), and geometrical thickness (t). Some of the methods [1, 2] measured only the group index and the thickness, and others [3-9] simply assumed that the group index was equal to the phase index without dispersion. To get these three parameters accurately, in principle, it is necessary to have at least three independent relationships. Recently, several studies for the simultaneous measurements have been demonstrated using a low-coherence interferometer combined with confocal optics [10-13].
It is well known that with a confocal microscope the ratio t/np can be obtained by scanning the focal point along the depth of a sample, and the multiplication t×ng can be easily obtained by scanning the reference arm of a low-coherence interferometer. However, at least one more relationship is necessary to separate the three parameters completely. In order to get the additional relationship, Haruna, et al., [10, 12] used a specially-designed sample holder which gave the thickness t. However, a very complicated special sample holder was necessary and the measurable sample thickness was limited to within a couple of millimeters. Maruyama, et al., [11, 13] used a highly approximated chromatic dispersion equation that related ng with np.
#92242 - $15.00 USD Received 29 Jan 2008; revised 12 Mar 2008; accepted 28 Mar 2008; published 4 Apr 2008
(C) 2008 OSA 14 April 2008 / Vol. 16, No. 8 / OPTICS EXPRESS 5517

However, the approximation caused inevitable errors in highly accurate measurements and could be applicable for limited materials only.
In this paper, we propose and demonstrate two new methods that enable the simultaneous measurements of the phase refractive index, the group refractive index, and the geometrical thickness of an optically transparent object without assuming any prior information about the object. By using a low-coherence interferometer, the relationship between the group index and the thickness is obtained. Then, with a confocal scanning microscope the relationship between the phase index and the thickness is also obtained. To get additional relationships, two novel methods are devised and presented here. In the first method, the bandwidth of a low-coherence envelop signal, which is broadened due to the dispersion of the sample, is utilized. In the second method, the confocal scannings are performed several times at different wavelengths, and from which the group index is obtained directly. The principle of the proposed method is presented and experimental results are followed. With the second method, we obtained the average measurement error of 0.061 % in the geometrical thickness, 0.066 % in the phase index, and 0.057 % in the group index, respectively.
2. Principles and methods for simultaneous measurements
Fig. 1. Schematic of the experimental set-up based on a low-coherence interferometer and confocal optics. BS: beam splitter, OBJ1: objective lens for the sample arm, OBJ2: objective lens for the reference arm, RM: reference mirror, PH: pin hole, L: focusing lens, SLD: superluminescent diode.
The schematic of the experimental set-up is shown in Fig. 1, in which the sample is assumed as a thin transparent plate having two surfaces. A collimated beam from a superluminescent diode (SLD) source is launched to a beam splitter (BS) and split into the reference and the sample arms. Firstly, the objective lens in the sample arm (OBJ1) is shifted to have its focal point on the front surface of the sample, and then the reference part, including its objective lens (OBJ2) and the reference mirror (RM), is moved to the position where the maximum interference contrast occurs. Secondly, OBJ1 is moved closer to the sample so that its focal point is located on the rear surface of the sample, which gives the confocal distance Δz. Finally, the RM is shifted again to have another maximum interference contrast resulting from the rear surface of the sample, which gives the low-coherence distance Δl in the figure. The two distances obtained from this process are then related to the three sample parameters (np, ng, and t) and the numerical aperture (NA) of OBJ1 [4],
#92242 - $15.00 USD Received 29 Jan 2008; revised 12 Mar 2008; accepted 28 Mar 2008; published 4 Apr 2008
(C) 2008 OSA 14 April 2008 / Vol. 16, No. 8 / OPTICS EXPRESS 5518

ppn
t
NAn
NAtz ≈
−
−×=Δ22
21 (1)
and
gntl ×=Δ (2)
In Eq. (1) the approximation holds when the lens L of Fig. 1 has a low NA. The distance zΔ obtained from the movement of OBJ1 results from the confocal property
of the sample arm. Due to the focusing lens (L) in front of the pinhole (PH), only the beam reflected at a particular depth of the sample can pass through the PH [14]. To get the confocal signal in the experiment, the beam path to the reference arm was temporarily blocked, but this blocking is not critical in practice. Conventional single mode fiber was used as a PH, thus, we can say that the PH size was less than 8 μm. The focal length of the focusing lens L was 4.5 mm. On the other hand, the distance lΔ obtained from the movement of OBJ2 is a result of the low-coherence interference. When both arms of the interferometer have the same optical path length, the RM scanning gives the maximum contrast of the interference in general. Figures 2(a) and 2(b) show the confocal signal and the low-coherence interference signal experimentally obtained with the setup of Fig. 1 with a sample of 142 μm thick cover glass at a wavelength of 814 nm.
50 75 100 125 150 17522
23
24
25
26
27
28
Sig
nal
am
plit
ud
e
[
μW
]
Scanning distance [ μm]
Δz
50 100 150 200 250 300 350
75
90
105
120
135
150
Δl
Sig
nal
am
plit
ude
[
μW
]
Scanning distance [ μm] (a) (b)
Fig. 2. The measured confocal signal (a) and the low-coherence interference signal (b) of a 142 μm thick cover glass. The confocal distance Δz was measured smaller than the low-coherence distance Δl.
However, even with these two measurements represented by Eq. (1) and Eq. (2), it is not
possible to get both the thickness and the refractive index of a sample completely since the phase index np and the group index ng of the sample are different in most cases. Therefore, we devise and propose two methods that can separate both refractive indices effectively without assuming any prior knowledge about the sample.
2-1. Low-coherence interference signal broadening method
The phase difference between the light beams reflected back from the rear surface of the sample and the reference mirror RM can be described by:
{ }( ) 2 ( ) ( ) 2 ( )s s L r rk x k t k xφ ω ω ω ωΔ = + − (3)
where, ks(ω), kL(ω), and kr(ω) are the propagation constants of the beam at the sample arm, within the sample itself, and at the reference arm, respectively; xs and xr are the distances from the beam-splitter to the front surface of the sample and to the RM surface, respectively; ω is the angular frequency of the input beam; and t is the geometrical thickness of the sample.
#92242 - $15.00 USD Received 29 Jan 2008; revised 12 Mar 2008; accepted 28 Mar 2008; published 4 Apr 2008
(C) 2008 OSA 14 April 2008 / Vol. 16, No. 8 / OPTICS EXPRESS 5519

Since the input SLD source has a much narrower spectral bandwidth compared with its center frequency denoted by ω0, Eq. (3) can be Taylor-expanded. When the sample arm and the reference arm are in vacuum, or when the air reflective index is negligible, we have the Taylor expansion as [15]
220
0 0
( )( ) ( )
2p g c
ω ωφ ω ω τ ω ω τ τ−Δ ≈ Δ + − Δ + . (4-1)
Where, the phase delay mismatch pτΔ is given as
0
2 2( )p p
x tn
c cτ ωΔΔ = + , (4-2)
with the path length difference s rx x xΔ ≡ − and the speed of light in vacuum c. Similarly, the
group delay mismatch gτΔ is also given as
0
0 0
2 2( ) p
g p
dnx tn
c c d ω
τ ω ωω
⎧ ⎫Δ ⎪ ⎪Δ = + +⎨ ⎬⎪ ⎪⎩ ⎭
. (4-3)
And the so-called dispersion parameter cτ of the sample material is defined as
0 0
22
0 2
22 p p
c
dn d nt
c d dω ω
τ ωω ω
⎧ ⎫⎪ ⎪= +⎨ ⎬⎪ ⎪⎩ ⎭
. (4-4)
With the group refractive index defined by
( )( ) ( ) p
g p
dnn n
d
ωω ω ω
ω= + , (5)
we can have the simplified expressions of the above two equations as
0 0
2 2( ) ( )g g
x tn
c cτ ω ωΔΔ = + (4-3)
and
0
20
( )2( ) g
c
dnt
c d ω
ωτ ω
ω= . (4-4)
When the input light source has a power spectrum of ( )S ω , the intensity of the obtainable low-coherence interference signal is expressed as
[ ]1Re ( )exp ( )
2I S i dω φ ω ω
π∞
−∞⎡ ⎤∝ Δ⎢ ⎥⎣ ⎦∫ . (6)
Further, when the power spectrum is in a Gaussian shape with a center frequency 0ω and a
standard deviation power spectral bandwidth of 2σω, the equation becomes [15]
( ) ( )2 2 2
2 20 04 4 4 44 4
exp exp2 2
cg p g
c cc
I iτ τ
τ ττ
σ σ ττ ω τ τ θσ τ σ τσ τ
⎡ ⎤⎧ ⎫ ⎧ ⎫−⎪ ⎪ ⎪ ⎪⎢ ⎥∝ Δ Δ − Δ +⎨ ⎬ ⎨ ⎬+ +⎢ ⎥+ ⎪ ⎪ ⎪ ⎪⎩ ⎭ ⎩ ⎭⎣ ⎦
. (7)
#92242 - $15.00 USD Received 29 Jan 2008; revised 12 Mar 2008; accepted 28 Mar 2008; published 4 Apr 2008
(C) 2008 OSA 14 April 2008 / Vol. 16, No. 8 / OPTICS EXPRESS 5520
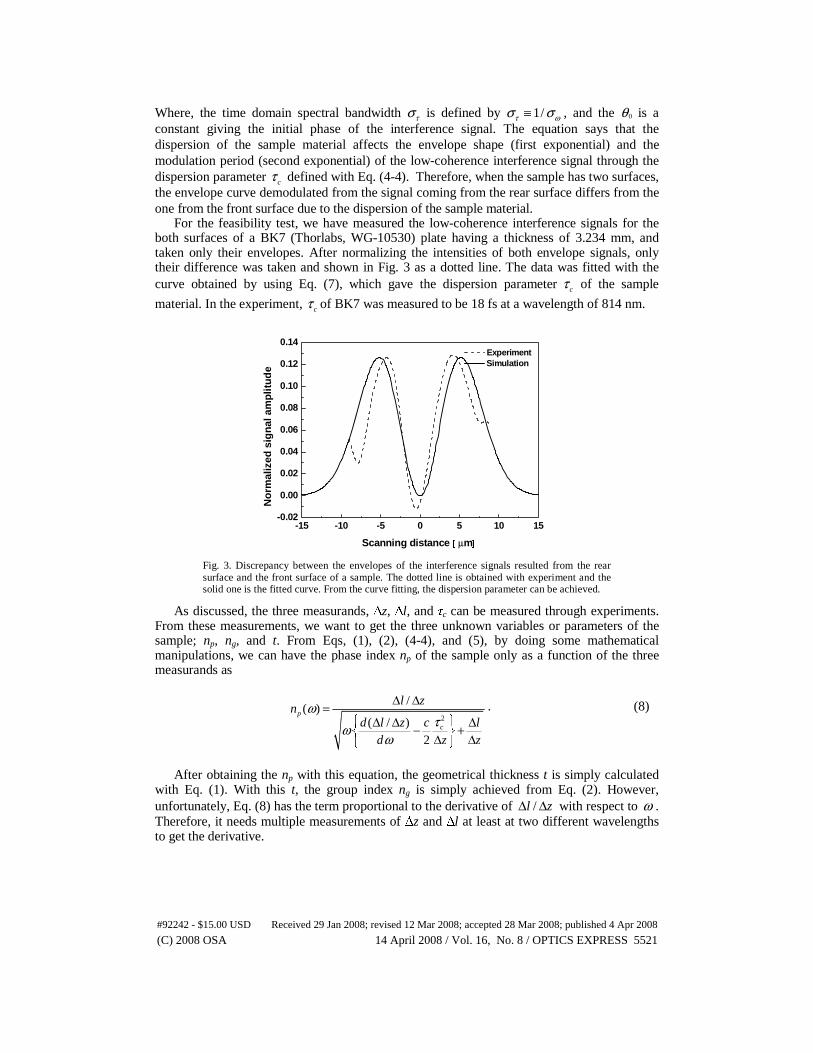
Where, the time domain spectral bandwidth τσ is defined by 1/τ ωσ σ≡ , and the θ 0 is a constant giving the initial phase of the interference signal. The equation says that the dispersion of the sample material affects the envelope shape (first exponential) and the modulation period (second exponential) of the low-coherence interference signal through the dispersion parameter cτ defined with Eq. (4-4). Therefore, when the sample has two surfaces, the envelope curve demodulated from the signal coming from the rear surface differs from the one from the front surface due to the dispersion of the sample material.
For the feasibility test, we have measured the low-coherence interference signals for the both surfaces of a BK7 (Thorlabs, WG-10530) plate having a thickness of 3.234 mm, and taken only their envelopes. After normalizing the intensities of both envelope signals, only their difference was taken and shown in Fig. 3 as a dotted line. The data was fitted with the curve obtained by using Eq. (7), which gave the dispersion parameter cτ of the sample
material. In the experiment, cτ of BK7 was measured to be 18 fs at a wavelength of 814 nm.
-15 -10 -5 0 5 10 15-0.02
0.00
0.02
0.04
0.06
0.08
0.10
0.12
0.14
No
rmal
ized
sig
nal
am
plit
ud
e
Scanning distance [ μm]
Experiment Simulation
Fig. 3. Discrepancy between the envelopes of the interference signals resulted from the rear surface and the front surface of a sample. The dotted line is obtained with experiment and the solid one is the fitted curve. From the curve fitting, the dispersion parameter can be achieved.
As discussed, the three measurands, Δz, Δl, and τc can be measured through experiments. From these measurements, we want to get the three unknown variables or parameters of the sample; np, ng, and t. From Eqs, (1), (2), (4-4), and (5), by doing some mathematical manipulations, we can have the phase index np of the sample only as a function of the three measurands as
2
/( )
( / )2
p
c
l zn
d l z c l
d z z
ωτω
ω
Δ Δ=⎧ ⎫Δ Δ Δ− +⎨ ⎬Δ Δ⎩ ⎭
. (8)
After obtaining the np with this equation, the geometrical thickness t is simply calculated
with Eq. (1). With this t, the group index ng is simply achieved from Eq. (2). However, unfortunately, Eq. (8) has the term proportional to the derivative of /l zΔ Δ with respect to ω . Therefore, it needs multiple measurements of Δz and Δl at least at two different wavelengths to get the derivative.
#92242 - $15.00 USD Received 29 Jan 2008; revised 12 Mar 2008; accepted 28 Mar 2008; published 4 Apr 2008
(C) 2008 OSA 14 April 2008 / Vol. 16, No. 8 / OPTICS EXPRESS 5521

2-2. Direct group index measurement method
The second method for identifying the three variables, np, ng, and t, utilizes the definition of the group index, given by Eq. (5). Substituting np of Eq. (1) and ng of Eq. (2) into Eq. (5), we can have the thickness t as a function of the measurands Δz and Δl;
2
1
l zt
d z
z d
ωω
Δ Δ=Δ−
Δ
(9)
As in the previous method presented by Eq. (8), in this second method the geometrical thickness is a function of a frequency derivative of the confocal distance Δz. Therefore, it also needs at least one more confocal measurement at other optical wavelengths.
In the configuration of Fig. 1, for obtaining the accurate confocal distance Δz, a high NA OBJ1 is necessary. For that case, the low NA approximation used in Eq. (1) induces some appreciable error. Therefore, to maintain a good accuracy, we need to use the original version of Eq. (1) having the NA terms. Including the NA terms, the geometrical thickness t is complicatedly given as a solution of the polynomial equation of
6 4 2 0A t B t C t D+ + + = (10)
where the coefficients A, B, C, and D are defined as,
( ) ( ) ( )2 2 22 2 222
4 6 5
1 1 12
NA NA NAd z d zA
d dz z zω ω
ω ω− − −Δ Δ⎛ ⎞= + −⎜ ⎟Δ Δ Δ⎝ ⎠ (10-1)
( ) ( )2 2
2 22 3
1 12 2
NA NA d zB NA NA
dz zω
ω− − Δ= −Δ Δ (10-2)
( )2
4 22
1l
C NA NAz
Δ= − −Δ (10-3)
2 2D l NA= −Δ (10-4)
After getting the geometrical thickness t as the real and positive solution of Eq. (10), it becomes very simple to obtain the other variables; np from Eq. (1) and ng from Eq. (2) as in the previous case. It is noteworthy that, in this second method, the derivative of the low-coherence distance Δl is not required but only the derivative of the confocal distance Δz is needed, which might simplify the measuring process.
3. Experiment and simulation results
For experiments, we have used three conventional SLEDs (Super Luminescent Emitting Diodes) having the center wavelengths at 814 nm, 1050 nm, and 1310 nm, and the FWHM bandwidths of 38 nm, 55 nm, and 45 nm, respectively. The light sources were connected through appropriate patch cords having adjustable collimators (OFR, CFC-11-VIR, CFC-8-YAG, CFC-11-IR1). Three different lenses were used depending on the thicknesses of samples (New focus 5723, 5724 and OFR LMO-60X). In actual measurement, considering the size of the input beam and the focal length of the lens, the effective NAs of the lenses were obtained as 0.072, 0.078 and 0.184, respectively. The NAs were calibrated with several samples having known thicknesses and phase indices. Two linear translating stages (Newport PM500) were used to separately scan both arms of the system. In the reference arm, the reference mirror RM was moved together with the object OBJ2 to give optical path length scanning. While, in the sample arm, only the object OBJ1 was moved to scan the focal point along the depth of the sample.
#92242 - $15.00 USD Received 29 Jan 2008; revised 12 Mar 2008; accepted 28 Mar 2008; published 4 Apr 2008
(C) 2008 OSA 14 April 2008 / Vol. 16, No. 8 / OPTICS EXPRESS 5522

By scanning OBJ1 in the sample arm, with a light source having a frequency ω1, the confocal signal of the sample was obtained first. The signal was composed of two peaks, as shown with Fig. 2(a). The separation between the peaks was measured as the confocal distance Δz(ω1). Secondly, OBJ1 was moved to the place where the first confocal peak occurred. The reference arm was then scanned to have the low-coherence signal for the front surface of the sample. Then, after moving OBJ1 to the second confocal peak position, one more reference arm scanning was made. By taking the difference of the peak positions obtained with the reference arm scanning, the low-coherence distance Δl(ω1), was achieved as shown with Fig. 2(b). Finally, the same measurements were repeated using light sources having other center wavelengths or frequencies.
Table 1 summarizes the results of the measurements made at three different wavelengths for 8 different samples; B270, CaF2, two of BK7, two of fused silica, cover glass, and cigarette cover film. With each sample, the three measurands, Δz, Δl, and τc were measured at each wavelength. However, when using the 1310 nm light source, unfortunately, the dispersion parameters were too small to be utilized for most samples. The thin samples were also difficult to get the dispersion parameter τc.
Table 1. The three measurands measured for 8 samples at three different center wavelengths.
Sample Wavelength [nm] Δz [mm] Δl [mm] τc
2 [fs2] (ref)a
814 1.30375 3.03395 182 (201) 1050 1.30800 3.02073 151 (123) B270 1310 1.30975 3.01655 - 814 2.13850 4.93580 324 (279)
1050 2.14300 4.91823 225 (154) BK7 a 1310 2.14750 4.91460 - 814 3.44800 7.96385 441 (449) 1050 3.46000 7.93616 289 (246) BK7 b 1310 3.46650 7.92685 - 814 2.13450 4.39900 154 (166) 1050 2.13700 4.38813 132 (110) CaF2 1310 2.13975 4.38375 - 814 1.06800 2.28000 169 (108)
1050 1.07000 2.27401 - Silica a 1310 1.07200 2.27255 - 814 3.50425 7.47460 324 (357) 1050 3.51075 7.45328 204 (185) Silica b 1310 3.51875 7.44942 - 814 0.09165 0.21837 - Cover Glass
1310 0.09285 0.21682 - 814 0.014425 0.034020 - Cigar Cover Film
1310 0.01460 0.033065 - a From calculation
Based on these three measured measurands, the three variables of each sample were calculated using the first method presented by Eq. (8). As can be seen in Table 2, the average measurement errors for the available 5 samples were ~0.123 % in the geometrical thickness, ~0.133 % in the phase index, and ~0.106 % in the group index, respectively.
#92242 - $15.00 USD Received 29 Jan 2008; revised 12 Mar 2008; accepted 28 Mar 2008; published 4 Apr 2008
(C) 2008 OSA 14 April 2008 / Vol. 16, No. 8 / OPTICS EXPRESS 5523

Table 2. The three variables of samples calculated with the three measurands in Table 1 and by using the proposed first method.
Phase index [np] Group index [ng] Thickness [mm]
Sample Wavelength [nm] Ref Meas Err
[%] Ref Meas Err [%] Ref Meas Err
[%] 814 1.5162 1.5149 0.08902 1.5324 1.5334 0.06410
B270 1050 1.5126 1.5093 0.21639 1.5260 1.5267 0.05037
1.9810 1.9786 0.12362
814 1.5105 1.5149 0.29307 1.5261 1.5234 0.17882 BK7 a
1050 1.5068 1.5070 0.01281 1.5208 1.5180 0.18713 3.2340 3.2400 0.18622
814 1.5105 1.5085 0.13320 1.5261 1.5295 0.22323 BK7 b
1050 1.5068 1.5014 0.35791 1.5208 1.5242 0.22321 5.2193 5.2068 0.24020
814 1.4304 1.4305 0.01015 1.4386 1.4390 0.03235 CaF2
1050 1.4286 1.4277 0.05729 1.4350 1.4355 0.03094 3.0580 3.0569 0.03507
814 1.4531 1.4540 0.06163 1.4667 1.4662 0.03667 Silica b
1050 1.4498 1.4484 0.09533 1.4625 1.4620 0.03604 5.0965 5.0980 0.03001
With the three measured measurands in Table 1 and by using the second method
represented by Eq. (10), the three variables of each sample were calculated again and summarized them at Table 3.
Table 3. The three variables of samples calculated with the measurands in Table 1 and by using the proposed second method.
Phase index [np] Group index [ng] Thickness [mm]
Sample Wavelength [nm] Ref Meas Err
[%] Ref Meas Err [%] Ref Meas Err
[%] 814 1.5162 1.5156 0.03942 1.5324 1.5321 0.02122
1050 1.5126 1.5111 0.09581 1.5260 1.5254 0.03494 B270
1310 1.5096 1.5084 0.07799 1.5237 1.5233 0.02218
1.9810 1.9802 0.03839
814 1.5105 1.5113 0.05228 1.5261 1.5250 0.07419
1050 1.5068 1.5081 0.08747 1.5208 1.5196 0.08250 BK7 a
1310 1.5036 1.5051 0.09770 1.5194 1.5184 0.06201
3.2340 3.2366 0.08132
814 1.5105 1.5101 0.02341 1.5261 1.5272 0.07247
1050 1.5068 1.5049 0.12508 1.5208 1.5219 0.07246 BK7 b
1310 1.5036 1.5022 0.09287 1.5194 1.5201 0.04941
5.2193 5.2155 0.08991
814 1.4304 1.4305 0.01097 1.4386 1.4387 0.01167
1050 1.4286 1.4289 0.02246 1.4350 1.4352 0.01027 CaF2
1310 1.4272 1.4271 0.00365 1.4336 1.4337 0.01153
3.0580 3.0576 0.01440
814 1.4531 1.4541 0.06897 1.4667 1.4652 0.10032
1050 1.4498 1.4517 0.13156 1.4625 1.4614 0.07713 Silica a
1310 1.4468 1.4484 0.10842 1.4616 1.4605 0.08129
1.5550 1.5561 0.06813
814 1.4531 1.4535 0.02739 1.4667 1.4655 0.08169
1050 1.4498 1.4508 0.06921 1.4625 1.4613 0.08106 Silica b
1310 1.4468 1.4476 0.05312 1.4616 1.4606 0.07281
5.0965 5.1003 0.07516
814 - 1.5178 - - 1.5548 - Cover Glass 1310 - 1.4980 - - 1.5437 -
0.142 0.1405 1.1014
814 - 1.5032 - - 1.5541 - C.C. Film 1310 - 1.4850 - - 1.5104 -
0.023 0.0219 5.0666
#92242 - $15.00 USD Received 29 Jan 2008; revised 12 Mar 2008; accepted 28 Mar 2008; published 4 Apr 2008
(C) 2008 OSA 14 April 2008 / Vol. 16, No. 8 / OPTICS EXPRESS 5524

The reference values in the tables, the refractive index, group index, and physical thickness of each sample are specified by the suppliers except for the last two samples; the cover glass and the cigarette cover film. With the sample of CaF2, which had a thickness of approximately 3 mm, we achieved the lowest error of 0.01440 % in its thickness measurement. With the last two samples that had no references, we had the worst errors of up to 5 %. For these cases, the reference thicknesses were measured by a digital micrometer gauge (Mitutoyo Corporation, MDC-25MJ) having a 1 μm resolution. However, due to the flatness of the sample and the errors in the gauge, the measurements had rather significant errors. The average measurement errors for the first 6 samples were ~0.061 % in the geometrical thickness, ~0.066 % in the phase index, and ~0.057 % in the group index. By using the dispersion parameters of the samples in this method, we improved the accuracy by almost two times against the proposed first method.
To confirm the feasibility of the proposed methods, the phase index of a fused silica sample was obtained by assuming virtual experiments with the proposed methods and compared with the reference index [16]. For the simulation, we assumed two (814 nm and 1050 nm) or three (814 nm, 1050 nm, and 1310 nm) light sources for each method. Figure 4 shows that in both proposed methods, when we use three sources we can expect much more accurate results than when using only two sources. The simulations made with other samples including BK7, B270, and CaF2 gave the similar results. Since in both methods the dispersion information of the sample, or measurement of it, is necessary, it is not surprising that the use of more light sources gave the better accuracy.
700 800 900 1000 1100 1200 1300 14001.444
1.446
1.448
1.450
1.452
1.454
1.456
1.458
Ph
ase
ind
ex
Wavelength [ nm]
Reference value 2 sources, method1 2 sources, method2 3 sources, method1 3 sources, method2
Fig. 4. The phase index of a fused silica sample obtained with virtual experiments done by the proposed two methods and its reference value (solid curve). We can see that the measurements using three light sources give better accuracy than the ones using only two sources.
4. Discussion
Most of the computing time necessary for measurements was consumed in the curve fitting process for getting the dispersion parameter in the first method; a few seconds was elapsed when a desktop computer was used. It took less than a couple of seconds to make the scanning, the sample arm scanning and the reference arm scanning. However, since the switching of light sources of different wavelengths was made manually, the total process time was in the order of minute. For the second method, since the curve fitting process was not necessary, the computing time was much shorter than the first method. Devising a dedicated apparatus and automating the process are expected to reduce the total process time down to 10 seconds.
#92242 - $15.00 USD Received 29 Jan 2008; revised 12 Mar 2008; accepted 28 Mar 2008; published 4 Apr 2008
(C) 2008 OSA 14 April 2008 / Vol. 16, No. 8 / OPTICS EXPRESS 5525

The confocal distance given by Eq. (1), as well known, is resulted from the refraction of a light beam at a dielectric/dielectric boundary. As shown with Fig. 2(a), the confocal signal of a single surface is given by the NA of the optics and the pinhole size. And the location of the second confocal signal, which is resulted from the rear surface of a sample, is affected by the phase index of the sample material.
The low-coherence signal of Fig. 2 (b) is resulted from the white-light interference. The first signal on the left of the figure is resulted from the front surface of the sample, thus, not affected by the dispersion of the sample. As can see with Eq. (7), the signal is oscillating with the phase delay mismatch of Eq. (4-2) and enveloped by the curve determined by the source spectrum and the group delay mismatch of Eq. (4-3). For the front surface the group delay mismatch is the same as the phase delay mismatch, because the mismatch happens at the free space. However, the second signal of Fig. 2(b) is resulted from the rear surface of the sample. It is modulated and enveloped also, but affected by the dispersion of the sample material. In the proposed method, we have used only the envelope signal, not the oscillating modulation signal. Equation (7) says that the envelope signal is broadened by the dispersion, but the location along the scanning direction is not altered.
Even though, in this experiment, we did not use the oscillating modulation signal of a low-coherence signal, the modulation signal is also affected by the dispersion of the sample. The oscillating frequency becomes chirped, and the initial phase is shifted as denoted by the constant θ0 in Eq. (7) [17]. If we could decrease the noise level of the measurement, we might see these effects directly and could utilize them for improving the measurement accuracy.
5. Conclusions
We have proposed and demonstrated two novel methods that could simultaneously measure the refractive index and the geometrical thickness of a sample without requiring any prior information on the sample. Especially, the phase index and the group index of a sample could be completely separated without assuming any specific relationships. In both methods, a low-coherence interferometer and confocal optics were used at the same time. With the low-coherence interferometer, the product between the geometrical thickness and the group index of a sample was measured, and with the confocal optics the ratio of the geometrical thickness to the phase index was obtained. To separate the phase and the group indices, we devised two novel methods.
In the first method, by investigating the dispersion-affected bandwidth of the demodulated low-coherence signal resulted from the back surface of a sample, we could get the dispersion parameter of the sample material, which allowed having the phase and the group indices separately in addition to the geometrical thickness. The average measurement errors were ~0.123 % in geometrical thickness, ~0.133 % in phase index, and ~0.106 % in group index. In the case of using a 1310 nm light source, unfortunately, the dispersion parameters were too low for most samples to be utilized in practical measurements. In the second method, we obtained the group index by measuring the confocal distance of a sample at several wavelengths. The measurement errors of this method were ~0.061 % in geometrical thickness, ~0.066 % in phase index, and ~0.057 % in group index. We expect that the proposed simultaneous measurement methods would find many applications in optical engineering and material science, and also extend its application to refractive index measurements for biomedical samples.
Acknowledgments
This work was supported in part by the BK-21, and by the Ministry of Commerce, Industry and Energy (MOCIE) of Korea through the Industrial Technology Infrastructure Building Program, and by the GIST Technology Initiative (GTI), and by the Korea Science and Engineering Foundation (KOSEF) grant funded by the Korea government (MOST).
#92242 - $15.00 USD Received 29 Jan 2008; revised 12 Mar 2008; accepted 28 Mar 2008; published 4 Apr 2008
(C) 2008 OSA 14 April 2008 / Vol. 16, No. 8 / OPTICS EXPRESS 5526