simultaneous determination of hydrochlorothiazide and spironolactone in pharmaceutical preparations...
TRANSCRIPT

MICROCHEMICAL JOURNAL 56, 207–215 (1997)ARTICLE NO. MJ961397
Simultaneous Determination of Hydrochlorothiazide andSpironolactone in Pharmaceutical Preparations
Using Batch and Dynamic Systems
E. MARTIN, O. HERNANDEZ, J. J. ARIAS, AND A. I. JIMENEZ1
Departamento de QuıB mica AnalıB tica, Nutricion y BromatologıB a, Facultad de QuıB mica,Universidad de La Laguna, E-38204 La Laguna, Tenerife, Spain
Received January 10, 1996; accepted May 27, 1996
This paper reports on the simultaneous determination of hydrochlorothiazide and spironolac-tone from derivative quotient spectra with a standardized divisor and by use of multiwavelengthregression calibration. Both methods were applied to synthetic mixtures and pharmaceuticalpreparations containing the two analytes using batch and flow injection systems. The resultsobtained with the two types of systems are compared. The resulting errors were nearly alwaysless than 5%. q 1997 Academic Press
INTRODUCTION
Thiazide diuretics, of wide use in the treatment of blood hypertension, increaseurine evacuation and hence diminish the body’s liquid volume and salt levels in blood.While this action is theoretically beneficial inasmuch as it eliminates some sodium,it also removes potassium, excessive loss of which may lead to functional disordersin the human body ranging from mild cramps to severe cardiac arrhythmia. For thisreason, this type of diuretic is usually administered in combination with the so-calledpotassium-sparing diuretics.
Hydrochlorothiazide and spironolactone, members of the thiazide and potassium-sparing families, respectively, are normally administered jointly in the treatment ofedema associated with congestive heart insufficiency. This has created a need for newanalytical methods for their simultaneous determination.
There are a number of reported methods for the determination of the two pharmaceu-ticals. Thus, hydrochlorothiazide has been determined electrochemically (1, 2) andspectrophotometrically (3, 4), and spironolactone by use of electrochemical (5), colori-metric (6), and fluorometric methods (7). Their mixtures have so far been resolvedmostly by chromatographic methods (8–10).
The steadily growing use of flow-injection (FI) systems for sample handling is aresult of their high potential for automating the different steps of the analytical process,as well as the substantial reagent and analysis time savings derived from direct injec-tion of the sample into a carrier solution.
Diode array detectors, which allow the recording of whole spectra in a short time,are widely used in methods involving continuous measurements. Thus, diode array
1 To whom correspondence should be addressed.
2070026-265X/97 $25.00Copyright q 1997 by Academic PressAll rights of reproduction in any form reserved.
ah08$$1397 05-22-97 14:51:34 mica AP: MICROCHEM

208 MARTIN ET AL.
spectrophotometric detection in flow-injection systems allows the whole spectrum tobe recorded throughout the FI peak; the vast amount of information thus obtained canbe processed by computers in a fast and precise way. This facility in the collectionand treatment of the spectra has allowed mixtures of analytes with strongly overlappingspectra to be solved using simple derivative spectroscopy methods, which show higherselectivity than absorption spectroscopy (zeroth derivative), or applying such multivar-iate calibration methods as multiwavelength lineal regression (MLR), partial leastsquares (PLS), etc. Therefore, numeric methods can compete against chromatographictechniques to solve complex mixtures with respect to the quality of the results, butsurpass them in saving time in analysis and reagents.
In this work we addressed the simultaneous spectrophotometric determination ofhydrochlorothiazide and spironolactone by use of a batch and a flow-injection systemfor comparison. Resolving the mixture entails using the method of derivative quotientspectra with a standardized divisor and multiwavelength lineal regression since overlapbetween the UV spectra for the pharmaceuticals precludes their direct quantitation.
The proposed methods were applied to the determination of both analytes in syn-thetic mixtures and pharmaceutical preparations, with satisfactory results in both cases.
EXPERIMENTALApparatus and Software
Spectra were recorded on a Hewlett–Packard HP 8452A diode array spectrophotom-eter interfaced to a Vectra ES PC computer from the same manufacturer. A quartzcell of 10-mm light path length and a Hellma 174.717 QS flow cell of 18-ml innervolume and 10-mm path length were used for measurements. Absorption spectra wereprocessed by using the spectrophotometer’s bundled software.
The flow-injection assembly used was of the single-line type and included a GilsonMinipuls-2 peristaltic pump equipped with a speed control, ethanol-proof siliconerubber tubes, and a Rheodyne 5041 manual injection valve furnished with severalfixed-volume loops. All other tubes, injection loops, and connectors were made fromTeflon tubing of 0.5-mm i.d.
Multiwavelength regression analyses were carried out by use of the programMULTIC (11), which was run on a PC/AT 486 DX-2 66-MHz computer.
pH measurements were made with a Radiometer PHM84 pH-meter equipped witha combined glass-saturated calomel electrode.
Ultrasonic agitation was provided by a P-Selecta ultrasonic bath. The temperaturewas kept at 257C by means of a Lauda MR6 thermostatic bath.
Reagents
Hydrochlorothiazide and spironolactone standards containing 100 mg/ml of eitherwere made by weighing from the respective reagents (Sigma) and dissolution inethanol. A 1 M acetic acid–sodium acetate buffer of pH 5.0 was also used. All reagentsemployed were of analytical grade and solutions were made in Millipore Milli-Qdeionized water.
Procedure
Batch method. Solutions containing hydrochlorothiazide, spironolactone, or a mix-ture of both were prepared in 25-ml flasks that were filled with 5 ml of HAcO/NaAcO
ah08$$1397 05-22-97 14:51:34 mica AP: MICROCHEM

209SIMULTANEOUS HYDROCHLOROTHIAZIDE/SPIRONOLACTONE DETERMINATION
buffer at pH 5.0, an appropriate volume of each analyte standard, the volume ofethanol required to obtain a 20% (v/v) solution, and distilled water to the mark. Thespectra for the solutions thus made were recorded between 220 and 350 nm using asolution prepared in the same way but containing no analyte as blank and an integrationtime of 1 s.
Flow injection method. The sample, diluted in ethanol, was aspirated through theloop of the injection valve with the aid of the peristaltic pump and injected into thecarrier stream [HAcO/NaAcO buffer of pH 5.0 and CT(HAcO / NaAcO) Å 0.1 Min 90% v/v ethanol]. When the sample plug reached the detector, spectra were recordedover the wavelength range 220–350 nm at 1-s intervals using an integration time of0.4 s. Sample spectra were obtained by difference from that for a blank (pure ethanol).
Simultaneous Determination of Hydrochlorothiazide and Spironolactone inPharmaceutical Preparations
Ten tablets of the drug were ground to a fine powder, an accurately weighed portionof which was treated with 10 ml of ethanol in an ultrasonic bath for 10 min. Thesuspension was centrifuged and the supernatant extracted. The residue was subjectedto the same procedure three times and the supernatant collected in a 50-ml flask thatwas made to volume with ethanol. For application of the batch method, an aliquot ofthis solution was transferred to a 25-ml flask that was then supplied with the ethanolvolume required to obtain a 20% (v/v) ethanol/water solution and 5 ml of HAcO/NaAcO buffer at pH 5.0, and the mixture was made to the mark with distilled water.For the FI method, the sample, diluted with ethanol, was directly injected into themanifold. Spectra were then recorded and analyzed as described above.
RESULTS AND DISCUSSION
We initially studied the behavior of hydrochlorothiazide and spironolactone as afunction of pH and ethanol content. The spectra for both drugs were found not to beaffected by pH over the range 2–9. pH 5.0 was thus chosen, which was provided byan HAcO/NaAcO buffer solution. The effect of the proportion of ethanol was studiedbetween 5 and 40%; spectra were only appreciably different at the extreme values,so an ethanol content of 20% (v/v) was adopted.
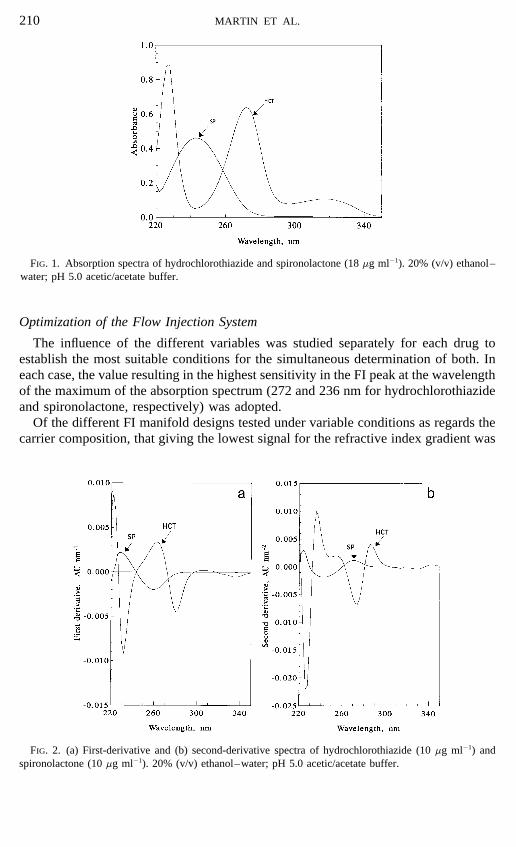
Figure 1 shows the absorption spectra for hydrochlorothiazide (HCT) and spirono-lactone (SP). Although the absorption maximum for spironolactone lies between thetwo maxima for hydrochlorothiazide, both drugs contribute to the total absorbance upto a wavelength of 286 nm, above which only hydrochlorothiazide absorbs—and onlyvery weakly. This hinders the simultaneous determination of the two drugs.
Derivative spectroscopy cannot solve the problem since, as a result of the shape ofthe absorption spectra, the signals for hydrochlorothiazide and spironolactone in thefirst- and second-derivative spectra cancel; also, their zero-crossing values coincideat some points and the signal for hydrochlorothiazide in the region where spironolac-tone does not absorb is extremely weak, as can be seen in Fig. 2.
This entails processing the absorption spectra to accomplish the simultaneous deter-mination of both drugs. To this end, we developed a graphical method and a computa-tional program based on multiwavelength regression for resolution.
ah08$$1397 05-22-97 14:51:34 mica AP: MICROCHEM
210 MARTIN ET AL.
FIG. 1. Absorption spectra of hydrochlorothiazide and spironolactone (18 mg ml01). 20% (v/v) ethanol–water; pH 5.0 acetic/acetate buffer.
Optimization of the Flow Injection System
The influence of the different variables was studied separately for each drug toestablish the most suitable conditions for the simultaneous determination of both. Ineach case, the value resulting in the highest sensitivity in the FI peak at the wavelengthof the maximum of the absorption spectrum (272 and 236 nm for hydrochlorothiazideand spironolactone, respectively) was adopted.
Of the different FI manifold designs tested under variable conditions as regards thecarrier composition, that giving the lowest signal for the refractive index gradient was
FIG. 2. (a) First-derivative and (b) second-derivative spectra of hydrochlorothiazide (10 mg ml01) andspironolactone (10 mg ml01). 20% (v/v) ethanol–water; pH 5.0 acetic/acetate buffer.
ah08$$1397 05-22-97 14:51:34 mica AP: MICROCHEM
211SIMULTANEOUS HYDROCHLOROTHIAZIDE/SPIRONOLACTONE DETERMINATION
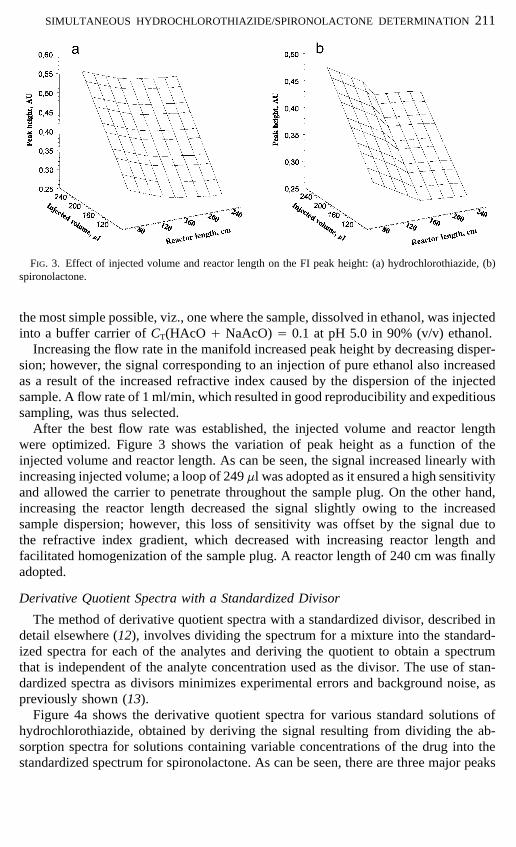
FIG. 3. Effect of injected volume and reactor length on the FI peak height: (a) hydrochlorothiazide, (b)spironolactone.
the most simple possible, viz., one where the sample, dissolved in ethanol, was injectedinto a buffer carrier of CT(HAcO / NaAcO) Å 0.1 at pH 5.0 in 90% (v/v) ethanol.
Increasing the flow rate in the manifold increased peak height by decreasing disper-sion; however, the signal corresponding to an injection of pure ethanol also increasedas a result of the increased refractive index caused by the dispersion of the injectedsample. A flow rate of 1 ml/min, which resulted in good reproducibility and expeditioussampling, was thus selected.
After the best flow rate was established, the injected volume and reactor lengthwere optimized. Figure 3 shows the variation of peak height as a function of theinjected volume and reactor length. As can be seen, the signal increased linearly withincreasing injected volume; a loop of 249 ml was adopted as it ensured a high sensitivityand allowed the carrier to penetrate throughout the sample plug. On the other hand,increasing the reactor length decreased the signal slightly owing to the increasedsample dispersion; however, this loss of sensitivity was offset by the signal due tothe refractive index gradient, which decreased with increasing reactor length andfacilitated homogenization of the sample plug. A reactor length of 240 cm was finallyadopted.
Derivative Quotient Spectra with a Standardized Divisor
The method of derivative quotient spectra with a standardized divisor, described indetail elsewhere (12), involves dividing the spectrum for a mixture into the standard-ized spectra for each of the analytes and deriving the quotient to obtain a spectrumthat is independent of the analyte concentration used as the divisor. The use of stan-dardized spectra as divisors minimizes experimental errors and background noise, aspreviously shown (13).
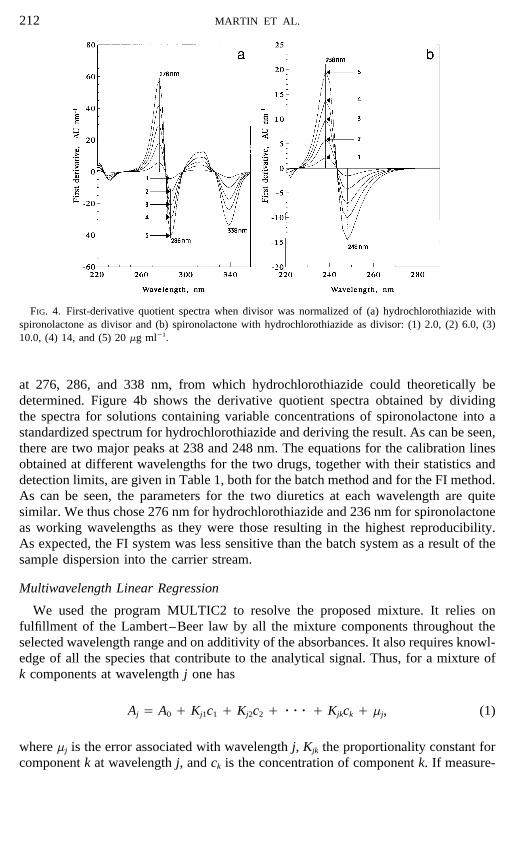
Figure 4a shows the derivative quotient spectra for various standard solutions ofhydrochlorothiazide, obtained by deriving the signal resulting from dividing the ab-sorption spectra for solutions containing variable concentrations of the drug into thestandardized spectrum for spironolactone. As can be seen, there are three major peaks
ah08$$1397 05-22-97 14:51:34 mica AP: MICROCHEM
212 MARTIN ET AL.
FIG. 4. First-derivative quotient spectra when divisor was normalized of (a) hydrochlorothiazide withspironolactone as divisor and (b) spironolactone with hydrochlorothiazide as divisor: (1) 2.0, (2) 6.0, (3)10.0, (4) 14, and (5) 20 mg ml01.
at 276, 286, and 338 nm, from which hydrochlorothiazide could theoretically bedetermined. Figure 4b shows the derivative quotient spectra obtained by dividingthe spectra for solutions containing variable concentrations of spironolactone into astandardized spectrum for hydrochlorothiazide and deriving the result. As can be seen,there are two major peaks at 238 and 248 nm. The equations for the calibration linesobtained at different wavelengths for the two drugs, together with their statistics anddetection limits, are given in Table 1, both for the batch method and for the FI method.As can be seen, the parameters for the two diuretics at each wavelength are quitesimilar. We thus chose 276 nm for hydrochlorothiazide and 236 nm for spironolactoneas working wavelengths as they were those resulting in the highest reproducibility.As expected, the FI system was less sensitive than the batch system as a result of thesample dispersion into the carrier stream.
Multiwavelength Linear Regression
We used the program MULTIC2 to resolve the proposed mixture. It relies onfulfillment of the Lambert–Beer law by all the mixture components throughout theselected wavelength range and on additivity of the absorbances. It also requires knowl-edge of all the species that contribute to the analytical signal. Thus, for a mixture ofk components at wavelength j one has
Aj Å A0 / Kj1c1 / Kj2c2 / rrr / Kjkck / mj, (1)
where mj is the error associated with wavelength j, Kjk the proportionality constant forcomponent k at wavelength j, and ck is the concentration of component k. If measure-
ah08$$1397 05-22-97 14:51:34 mica AP: MICROCHEM

213SIMULTANEOUS HYDROCHLOROTHIAZIDE/SPIRONOLACTONE DETERMINATION
TABLE 1Statistical Analysis of the Determination of Hydrochlorothiazide and Spironolactone
in Mixtures by Derivative Quotient Spectra
Wavelength D.1.(nm) Regression equationa r Sm Sb Sr (mg ml01)
Batch method
276 D Å 0.469 / 2.886CHCT 0.9996 0.029 0.316 0.609 0.461286 D Å 00.183 0 2.055CHCT 00.9997 0.019 0.210 0.405 0.430338 D Å 0.123 0 1.722CHCT 00.9998 0.014 0.159 0.306 0.488238 D Å 0.029 / 0.994CSP 0.9999 0.006 0.076 0.111 0.266248 D Å 0.052 0 0.730CSP 0.9999 0.004 0.054 0.078 0.255
Flow-injection method
276 D Å 0.229 / 0.216CHCT 0.9997 0.009 0.218 0.278 3.283286 D Å 00.279 0 0.197CHCT 00.9993 0.008 0.205 0.261 3.379338 D Å 0.010 0 0.266CHCT 00.9996 0.001 0.010 0.013 3.303238 D Å 0.012 / 0.186CSP 0.9997 0.001 0.003 0.003 1.025248 D Å 0.016 0 0.135CSP 0.9999 0.001 0.003 0.004 0.728
a Number of standard solutions, n Å 10.HCT, hydrochlorothiazide; SP, spironolactone; CHCT, HCT concentration (mg ml01); CSP , SP concentration
(mg ml01); r, correlation coefficient; Sb , standard deviation of intercept; Sm , standard deviation of slope; Sr ,standard error; D.1., detection limit.
ments are made at p wavelengths (p ú k), then a set of equations will be obtainedthat can be expressed in matrix form as
A Å KC / m,
resolution of which by least-squares regression gives the ck concentrations that willminimize the summation of the residuals.
Application of this procedure entails obtaining a standardized pure spectrum foreach analyte, which must be input into MULTIC as a standard, and then testingdifferent wavelength ranges until that providing the best predictions for syntheticmixtures is found. Such a range was 240–288 nm in our case.
Determination of Hydrochlorothiazide and Spironolactone in Synthetic Mixtures
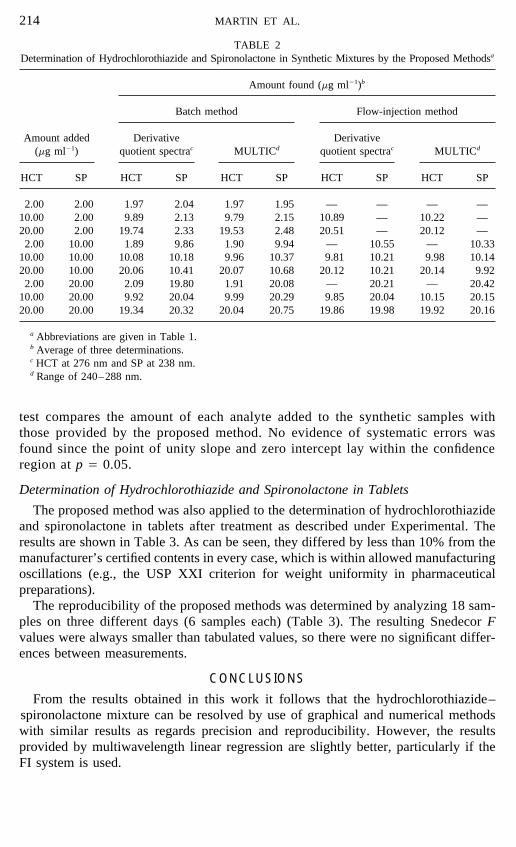
Table 2 shows the results obtained in the simultaneous determination of hydrochlo-rothiazide and spironolactone in various synthetic samples using the proposed methods,viz., derivative quotient spectra and multiwavelength regression. The amounts foundwere quite consistent with those added in every case. Those samples where eithercomponent was present at a concentration below 4 mg/ml could not be analyzed forsuch a component using the FI method as the concentration level was below itsdetection limit.
The accuracy of the proposed methods was assessed by applying the confidenceregion test, developed by Mandel and Lining (14), to slopes and intercepts. The
ah08$$1397 05-22-97 14:51:34 mica AP: MICROCHEM
214 MARTIN ET AL.
TABLE 2Determination of Hydrochlorothiazide and Spironolactone in Synthetic Mixtures by the Proposed Methodsa
Amount found (mg ml01)b
Batch method Flow-injection method
Amount added Derivative Derivative(mg ml01) quotient spectrac MULTICd quotient spectrac MULTICd
HCT SP HCT SP HCT SP HCT SP HCT SP
2.00 2.00 1.97 2.04 1.97 1.95 — — — —10.00 2.00 9.89 2.13 9.79 2.15 10.89 — 10.22 —20.00 2.00 19.74 2.33 19.53 2.48 20.51 — 20.12 —2.00 10.00 1.89 9.86 1.90 9.94 — 10.55 — 10.33
10.00 10.00 10.08 10.18 9.96 10.37 9.81 10.21 9.98 10.1420.00 10.00 20.06 10.41 20.07 10.68 20.12 10.21 20.14 9.922.00 20.00 2.09 19.80 1.91 20.08 — 20.21 — 20.42
10.00 20.00 9.92 20.04 9.99 20.29 9.85 20.04 10.15 20.1520.00 20.00 19.34 20.32 20.04 20.75 19.86 19.98 19.92 20.16
a Abbreviations are given in Table 1.b Average of three determinations.c HCT at 276 nm and SP at 238 nm.d Range of 240–288 nm.
test compares the amount of each analyte added to the synthetic samples withthose provided by the proposed method. No evidence of systematic errors wasfound since the point of unity slope and zero intercept lay within the confidenceregion at p Å 0.05.
Determination of Hydrochlorothiazide and Spironolactone in Tablets
The proposed method was also applied to the determination of hydrochlorothiazideand spironolactone in tablets after treatment as described under Experimental. Theresults are shown in Table 3. As can be seen, they differed by less than 10% from themanufacturer’s certified contents in every case, which is within allowed manufacturingoscillations (e.g., the USP XXI criterion for weight uniformity in pharmaceuticalpreparations).
The reproducibility of the proposed methods was determined by analyzing 18 sam-ples on three different days (6 samples each) (Table 3). The resulting Snedecor Fvalues were always smaller than tabulated values, so there were no significant differ-ences between measurements.
CONCLUSIONS
From the results obtained in this work it follows that the hydrochlorothiazide–spironolactone mixture can be resolved by use of graphical and numerical methodswith similar results as regards precision and reproducibility. However, the resultsprovided by multiwavelength linear regression are slightly better, particularly if theFI system is used.
ah08$$1397 05-22-97 14:51:34 mica AP: MICROCHEM

215SIMULTANEOUS HYDROCHLOROTHIAZIDE/SPIRONOLACTONE DETERMINATION
TABLE 3Intraday Precision for Determination of Hydrochlorothiazide and Spironolactone
in Pharmaceutical Formulationsa (Label Claim: 25 mg for HCT and SP)
Batch method Flow-injection method
Mean (mg) RSD (%)b Fcalc Mean (mg) RSD (%)b Fcalc
Method Day HCT SP HCT SP HCT SP HCT SP HCT SP HCT SP
Derivative I 24.91 24.57 0.67 0.70 1.58 2.39 24.79 24.82 1.40 0.99 2.11 1.32quotient II 24.99 24.14 0.39 0.78 24.94 24.93 1.06 0.92spectrac III 24.93 24.78 0.64 0.25 24.95 24.75 1.20 1.07
MULTICd I 24.86 24.84 0.72 0.84 1.17 1.05 24.78 24.88 1.00 0.87 1.44 1.61II 24.99 24.81 0.80 0.40 24.99 24.83 0.82 0.71III 24.78 24.93 0.56 0.40 24.93 24.86 0.92 1.02
a Abbreviations are given in Table 1.b Relative standard deviation (n Å 6).c HCT at 276 nm and SP at 238 nm.d Range of 240–288 nm.Theoretical F test (P Å 0.05): F(2,15) Å 3.68.
The FI method exhibits somewhat lower precision as a result of sample dispersion.This can be avoided by increasing the injected volume of injecting undiluted samples.However, it also has the major asset that it greatly facilitates automating analyses,thereby reducing sample manipulation; in fact, the sample can be directly injectedinto the carrier with no preliminary operation.
ACKNOWLEDGMENTThis work was financially supported by the Autonomic Government of Canary Island in the framework
of Project 93/042.
REFERENCES1. Kkolos, E.; Walker, J. Anal. Chim. Acta 1975, 80, 17.2. Van Kerchove, C.; Bontemps, R.; Schoenmakers, A. J. Pharm. Pharmacol. 1982, 34, 420.3. Abdine, H.; Elsayed, M.; Elsayed, Y. Analyst 1978, 345, 103.4. British Pharmacopeia, pp. 224, 731, 1980.5. Fathalla, B. Mikrochim. Acta 1992, 107, 11.6. Sutter, J. L.; Lau, E. P. K. In Analytical Profiles of Drug Substances (K. Florey, Ed.), Vol. IV, p. 431.
Academic Press, New York, 1986.7. Sadee, W.; Dagcioglu, M.; Riegelman, S. J. Pharm. Sci. 1972, 61, 1126.8. Medina, M. J.; Bonet, E.; Ramis, G.; GarcıB a, M. C. Anal. Lett. 1993, 26, 1881.9. Pramar, Y.; Das Gupta, V.; Zerai, T. Drug Dev. Ind. Pharm. 1991, 17, 747.
10. Urbanyi, T.; O’Connell, A. Anal. Chem. 1972, 44, 565.11. Sala, G.; Maspoch, S.; Iturriaga, H.; Blanco, M.; Cerda, V. J. Pharm. Biomed. Anal. 1988, 6, 765.12. Salinas, F.; Berzas, J. J.; Espinosa, A. Talanta 1990, 37, 345.13. MartıB n, E.; Hernandez, O.; Jimenez, F.; Arias, J. J. Anal. Lett. 1995, 28, 1449.14. Mandel, J.; Lining, F. J. Anal. Chem. 1957, 29, 743.
ah08$$1397 05-22-97 14:51:34 mica AP: MICROCHEM