simultaneous determination of benazepril hydrochloride and hydrochlorothiazide by micro-bore liquid...
TRANSCRIPT

Journal of Pharmaceutical and Biomedical Analysis21 (1999) 1017–1024
Simultaneous determination of benazepril hydrochloride andhydrochlorothiazide by micro-bore liquid chromatography
I.E. Panderi *, M. Parissi-PoulouDepartment of Pharmacy, Di6ision of Pharmaceutical Chemistry, Uni6ersity of Athens, Panepistimiopolis Zografou, GR-157 71,
Athens, Greece
Received 15 March 1999; received in revised form 23 July 1999; accepted 30 July 1999
Abstract
A micro-bore liquid chromatographic method was developed for the simultaneous determination of benazeprilhydrochloride and hydrochlorothiazide in pharmaceutical dosage forms. The use of a BDS C-18 micro-bore analyticalcolumn, results in substantial reduction in solvent consumption and increased sensitivity. The mobile phase consistedof a mixture of 0.025 M sodium dihydrogen phosphate (pH 4.8) and acetonitrile (55:45, v/v), pumped at a flow rateof 0.40 ml min−1. Detection was set at 250 nm using an ultraviolet detector. Calibration graphs are linear (r betterthan 0.9991, n=5), in concentration range 5.0–20.0 mg ml−1 for benazepril hydrochloride and 6.2–25.0 mg ml−1 forhydrochlorothiazide. The intra- and interday R.S.D. values were B1.25% (n=5), while the relative percentage error(Er) was B0.9% (n=5). The detection limits attained according to IUPAC definition were 0.88 and 0.58 mg ml−1 forbenazepril hydrochloride and hydrochlorothiazide, respectively. The method was applied in the quality control ofcommercial tablets and content uniformity test and proved to be suitable for rapid and reliable quality control.© 1999 Elsevier Science B.V. All rights reserved.
Keywords: Benazepril hydrochloride; Hydrochlorothiazide; Liquid chromatography; Micro-bore columns
www.elsevier.com/locate/jpba
1. Introduction
Benazepril hydrochloride (3-[1-(ethoxycar-bonyl)-3-phenyl-(1S)-propylamino ]-2,3,4,5-tetra-hydro-2-oxo-1H-1-(3S)-benzazepine-1-acetic acidmonohydrochloride) [1], is a new an giotensin-converting enzyme (ACE) inhibitor which isshown to be effective in the treatment of hyper-tension and congestive heart failure. The com-
pound, a dicarboxylic acid monoethylester, is aprodrug which is hydrolysed in vivo to its activecarboxylic acid metabolite, benazeprilat [2]. Hy-drochlorothiazide (6-chloro-3,4-dihydro-2H-1,2,4-benzothiadiazine-7-sulfonamide-1,1-dioxide) [3], isan antihypertensive diuretic agent which is indi-cated in the management of hypertension. Itscombination with benazepril hydrochloride in-creases the antihypertensive effects. Structures ofthe compounds are presented in Scheme 1.
Several reports have been described for thedetermination of benazepril alone, in formula-
* Corresponding author. Tel.: +30-1-7284527; fax: +30-1-7238297.
0731-7085/99/$ - see front matter © 1999 Elsevier Science B.V. All rights reserved.
PII: S0 731 -7085 (99 )00195 -8
I.E. Panderi, M. Parissi-Poulou / J. Pharm. Biomed. Anal. 21 (1999) 1017–10241018
tions or in biological fluids. These methods in-clude the use of high performance liquid chro-matography, [4,5] derivative spectrophotometry,[6] and gas chromatography–mass spectrometry[7]. Hydrochlorothiazide has also been determinedusing near-IR spectroscopy [8], differential spec-trophotometry [9], derivative spectrophotometry[10,11], thin layer chromatography [12], and highperformance liquid chromatography [13–15]. Toour knowledge, only a derivative UV–Vis spec-trophotometric method and an absorbancy ratiomethod have been described for the simultaneous
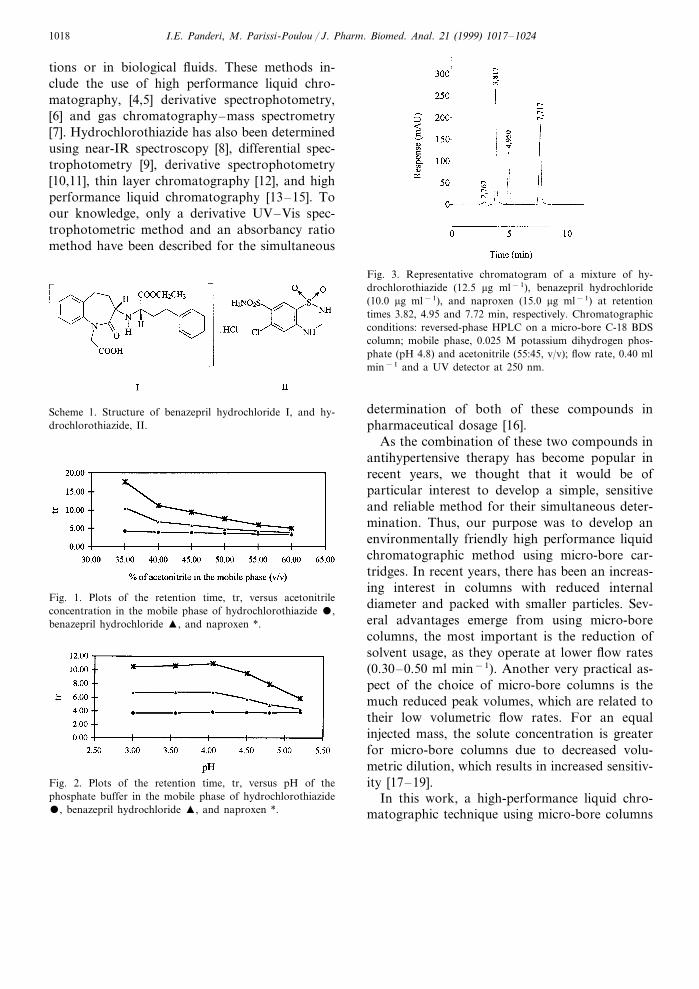
Fig. 3. Representative chromatogram of a mixture of hy-drochlorothiazide (12.5 mg ml−1), benazepril hydrochloride(10.0 mg ml−1), and naproxen (15.0 mg ml−1) at retentiontimes 3.82, 4.95 and 7.72 min, respectively. Chromatographicconditions: reversed-phase HPLC on a micro-bore C-18 BDScolumn; mobile phase, 0.025 M potassium dihydrogen phos-phate (pH 4.8) and acetonitrile (55:45, v/v); flow rate, 0.40 mlmin−1 and a UV detector at 250 nm.
Scheme 1. Structure of benazepril hydrochloride I, and hy-drochlorothiazide, II.
determination of both of these compounds inpharmaceutical dosage [16].
As the combination of these two compounds inantihypertensive therapy has become popular inrecent years, we thought that it would be ofparticular interest to develop a simple, sensitiveand reliable method for their simultaneous deter-mination. Thus, our purpose was to develop anenvironmentally friendly high performance liquidchromatographic method using micro-bore car-tridges. In recent years, there has been an increas-ing interest in columns with reduced internaldiameter and packed with smaller particles. Sev-eral advantages emerge from using micro-borecolumns, the most important is the reduction ofsolvent usage, as they operate at lower flow rates(0.30–0.50 ml min−1). Another very practical as-pect of the choice of micro-bore columns is themuch reduced peak volumes, which are related totheir low volumetric flow rates. For an equalinjected mass, the solute concentration is greaterfor micro-bore columns due to decreased volu-metric dilution, which results in increased sensitiv-ity [17–19].
In this work, a high-performance liquid chro-matographic technique using micro-bore columns
Fig. 1. Plots of the retention time, tr, versus acetonitrileconcentration in the mobile phase of hydrochlorothiazide ,benazepril hydrochloride �, and naproxen *.
Fig. 2. Plots of the retention time, tr, versus pH of thephosphate buffer in the mobile phase of hydrochlorothiazide, benazepril hydrochloride �, and naproxen *.

I.E. Panderi, M. Parissi-Poulou / J. Pharm. Biomed. Anal. 21 (1999) 1017–1024 1019
Table 1Calibration equations for the determination of benazepril hydrochloride and hydrochlorothiazide by high-performance liquidchromatography
S.D.drcRegression equationsb SreSample (mg ml−1)a
InterceptBz SlopeHy
6.9×10⁻⁴ 0.0145.00–20.0 6.25–25.00 RBz=0.048 CBz−0.008 0.9991 0.0090.0200.0235.00–20.0 6.25–25.00 RHy=0.118 CHy−0.050 0.9998 1.0×10⁻³
a Bz, Benazepril hydrochloride; Hy, hydrochlorothiazide.b Ratios of peak area of each compound to that of the internal standard, R, versus the appropriate concentration, C, in mg ml−1;
five standards.c Correlation coefficient.d Standard deviation of slope (mg ml−1) and intercept.e Standard error of the estimate.
Table 2Accuracy and precision of within- and between-run analysis for the determination of benazepril hydrochloride and hydrochloroth-iazide by high-performance liquid chromatography
Assayed concentration (mg ml−1)Nominal concentration (mg ml−1)
Benazepril HydrochlorothiazideBenazepril Hydrochlorothiazide
Er (%)b R.S.D. (%)a Er (%)bMean9S.D.Mean9S.D. R.S.D. (%)a
Intra-day (n=5)3.9790.02 0.053.25 4.00 3.2190.04 1.25 −0.9 −0.7
0.656.1990.04 −0.25.00 0.86.25 5.0490.05 0.99−0.7 12.5590.07 0.5610.00 0.112.50 9.9390.04 0.40
24.9890.16 0.6420.00 25.00 20.0990.13 0.65 0.4 −0.1
Inter-day (n=5)2.0 6.3190.04 0.325.00 6.25 5.1090.03 1.00.59
0.92 0.520.00 25.00 20.2190.20 0.99 1.0 25.1290.23
a Percentage relative standard deviation.b Relative percentage error.
Table 3Determination of benazepril hydrochloride and hydrochlorothiazide in commercial formulations by high-performance liquidchromatography
Benazepril hydrochloride; found (mg/tablet)aCommercial formulation Hydrochlorothiazide; found (mg/tablet)a
Recovery (%)Mean9S.D. (n=10) Mean9S.D. (n=10)Recovery (%)
99.5 12.4590.11Cibadrex (10/12.5) 9.9590.04 99.699.3 25.0290.07Cibadrex (20/25) 19.8690.19 100.1
a The indicated values are the mean of 10 different analyses of the same commercial batch.

I.E. Panderi, M. Parissi-Poulou / J. Pharm. Biomed. Anal. 21 (1999) 1017–10241020
Table 4Recoveries of benazepril hydrochloride and hydrochlorothiazide in spiked commercial samples
Amount added (mg) Amount found (mg)Drug ma Recoveryb (%)
5.0 9.03Benazepril hydrochloride 1.005 100.511.938.0
10.0 14.1012.5 16.59
6.25Hydrochlorothiazide 10.30 0.992 99.214.5710.017.0712.5
15.6 20.75
a m is the slope the linear regression analysis of the amount found versus the amount added.b Recovery (%)=m×100.
has been utilised successfully for the determinationof benazepril hydrochloride andhydrochlorothiazide in pharmaceutical tablets.The methods offers an enhancement in sensitivityand is more selective than the previouslymentioned spectrophotometric methods [16].
2. Experimental
2.1. Materials
Solvents were of HPLC grade and werepurchased from Lab-Scan Science (Ireland).Sodium dihydrogen phosphate monohydrate(pro-analysi) and hydrochloric acid(analytical-reagent grade) were purchased fromMerck (Darmstadt, Germany). Water wasdeionised and further purified by means of aMilli-Q Plus Water Purification System(Millipore). Benazepril hydrochloride andhydrochlorothiazide of pharmaceutical puritygrade were kindly provided by Novartis Pharma(Basle, Switzerland), while naproxen ofpharmaceutical purity grade was purchased fromMinerva Hellas. All substances were used withoutany further purification. Cibadrex (10+12.5) andCibadrex (20+25) tablets are products ofNovartis Pharma; each tablet was labelled tocontain 10.0 and 20.0 mg of benazepril and 12.5and 25.0 mg of hydrochlorothiazide, respectively.The excipients present in tablets are:
Hydroxypropyl methylcellulose (hypromellose),hydrogenated castor oil, lactose,polyvinylpyrrolidone XL, iron oxide red, E172,macrogol 8000, talc and titanium oxide.
2.2. Instrumental and chromatographic conditions
The high-performance liquid chromatographicsystem consisted of a GBC Model LC1126 pumpand a Rheodyne Model 7725i injector with a 5-mlloop, which were coupled to a GBC Model LC1210UV–Vis detector operating at 250 nm. Theanalytical column was a reversed phase BDS C-18micro-bore column (25×0.30 cm i.d.) containing5-mm packing, (Shandon Scientific,Cheshire, UK).The mobile phase consisted of 0.025 M sodiumdihydrogen phosphate (pH 4.8) and acetonitrile(55:45, v/v). The mobile phase was filtered througha 0.20-mm nylon membrane filter (GelmanSciences) and degassed under vacuum prior to use.All chromatographic experiments were carried outat a flow rate 0.40 ml min−1. Data acquisition wereperformed using WinChrom chromatographysoftware package: ChemWin, version 1.2. A pHmeter (Metrohm, model 654 Herisau) was used forall pH measurements.
2.3. Stock standard solutions
Stock standard solutions of benazeprilhydrochloride (Bz), 1.0 mg ml−1,hydrochlorothiazide (Hy), 1.0 mg ml−1, andnaproxen (Np), 1.0 mg ml−1, were prepared by

I.E. Panderi, M. Parissi-Poulou / J. Pharm. Biomed. Anal. 21 (1999) 1017–1024 1021
dissolving appropriate amounts of the compoundsin methanol. These solutions were stored in thedark under refrigeration at 4°C and were found tobe stable for several weeks.
A series of mixed standard solutions were pre-pared by the appropriate dilution of the abovementioned stock standard solutions in mobilephase to reach concentration ranges of 5.0–20.0and 6.25–25.0 mg ml−1 for Bz and Hy, respec-tively. In each sample 15.0 mg ml−1 of the internalstandard Np was added. Standard solutions werefound to be stable during the analysis time.
2.4. Assay of pharmaceutical preparations
Twenty tablets were weighed and finely pul-verised. An appropriate portion of this powder,equivalent to 10.0 mg of Bz and 12.5 mg of Hy,was transferred to a 25-ml volumetric flask with20 ml of methanol. The solution was sonicated for10 min, followed by shaking by mechanical meansfor 20 min and finally diluted to volume withmethanol. A portion of this solution was cen-trifuged at 4000 rev min−1 (2890 g) for 15 min. A5-ml aliquot was transferred to a 25-ml volumetricflask and diluted to volume with mobile phase.Consequently a 2-ml aliquot of this solution and a150-ml aliquot of the stock solution of Np werefurther diluted to 10 ml of mobile phase; 5 mlsample was injected into the HPLC system. Peakarea ratios of each compound to that of theinternal standard were then measured for thedeterminations. The same procedure was followedfor the content uniformity test, using one tabletper sample.
2.5. Calibration procedure
Two calibration curves were constructed byassaying the above mentioned mixed standardsolutions of Bz and Hy in mobile phase. Theconcentration range covered was 5.0–20.0 mgml−1 for Bz and 6.25–25.0 mg ml−1 for Hy.Triplicate 5-ml injections were made of each solu-tion and the peak area ratio of each drug to thatof the internal standard was plotted against thecorresponding concentration to obtain the cali-bration graph.
The overall precision and accuracy of the assaywas evaluated by analysing three series of mixedstandard solutions of Bz and Hy, at concentra-tions of 3.25, 5.0, 10.0 and 20.0 mg ml−1 for Bzand 4.00, 6.25, 12.5 and 25.0 mg ml−1 for Hy. Ineach sample 15.0 mg ml−1 of the internal standardNp was added. The relative standard deviation (%R.S.D.) was determined in order to assess theprecision of the method, while the accuracy wasexpressed by the relative percentage error (Er %).
In order to determine the effect of the excipi-ents used in the formulation of tablets on thedetermination of Bz and Hy, the standard addi-tion method [20] was used. Thus, five equalamounts of powdered tablets equivalent to 4.0 mgof Bz and 5.0 mg of Hy, were spiked with differ-ent amounts of reference standards of Bz and Hy.The samples were analysed as mentioned in theassay procedure, while in each sample, 15.0 mgml−1 of the internal standard Np was added.Peak area ratios of each drug to that of theinternal standard were measured for the determi-nation of both compounds.
3. Results and discussion
3.1. Chromatographic characteristics
Chromatographic separations were carried outon a micro-bore BDS C-18 column. The effect ofcomposition and pH of the mobile phase on theretention time (tr) of Hy, Bz and Np (internalstandard), were investigated. A satisfactory sepa-ration was obtained with a mobile phase consist-ing of 0.025 M sodium dihydrogen phosphate andacetonitrile (55:45, v/v). Increasing acetonitrileconcentration to more than 60% led to inadequateseparation of the compounds (Fig. 1). At loweracetonitrile concentration, separation occurredbut with excessive tailing and increased retentiontime for Np peak. Retention times of the com-pounds show no significant difference at pH val-ues ranging from 3.0 to 4.0 (Fig. 2). A pH valueof 5.0 led to inadequate resolution of Hy and Bz.Thus, a pH value of 4.8 was found to be theoptimum, as at this pH value the analyte peakswere well resolved and almost free from tailing.

I.E. Panderi, M. Parissi-Poulou / J. Pharm. Biomed. Anal. 21 (1999) 1017–10241022
Peak asymmetry or tailing factor, T, wascalculated as: T=W0.05/2f ; where W0.05 is thedistance from the leading edge to the tailing edgeof the peak, measured at a point 5% of the peakheight from the baseline and f is the distance fromthe peak maximum to the leading edge of thepeak. Peak asymmetries were found to be 1.21,1.07 and 1.06 for Hy, Bz, and Np, respectively.The optimum wavelength for detection was at 250nm, at which the best detector responses for allthe substances were obtained.
The specificity of the HPLC method isillustrated in Fig. 3 where complete separation ofthe compounds was observed. Hy was eluted at3.82 min, Bz appeared at 4.95 min, while theinternal standard Np was eluted at 7.72 min.
3.2. Statistical analysis of chromatographic data
Under the experimental conditions describedabove, linear relationships were observed betweenthe peak area ratio of each compound to that ofthe internal standard and the correspondingconcentration, as shown by the equationspresented in Table 1. The correlation coefficient(r) and the standard error of the estimate (S.E.) ofthe calibration lines are also given, along with theS.D. of the slopes and the intercepts.
In order to further evaluate the linearity of theproposed method, five calibration equations, wereconstructed over a period of four weeks. Theaverage regression equation for Bz was:
RBz=0.049(91.3×10⁻³) CBz
−0.008(98.4×10⁻⁴)
and for Hy was:
RHy=0.119(91.3×10⁻⁴) CHy
−0.050(93.1×10⁻³)
where R is the ratio of peak area of eachcompound to that of the internal standard and Cis the appropriate concentration expressed in mgml−1.
The slopes of the calibration equations of Bzand Hy had R.S.D. values of 2.6 and 1.1%,respectively while the R.S.D. values of theintercepts of these calibration equations were
found to be 10.5 and 6.2%, respectively. Thecorrelation coefficient of each standard curveconstructed invariably exceeded 0.9991.
The limits of detection LOD attained, asdefined by IUPAC [21], LOD(k=3)=k×Sa/b(where b is the slope of the calibration graph andSa is the S.D. of the blank signal) were found tobe 0.88 and 0.58 mg ml−1 for Bz and Hy,respectively. The limits of quantitation LOQ werealso attained according to the IUPAC definition,LOQ(k=10)=k×Sb/b, and were found to be 2.92and 1.95 mg ml−1 for Bz and Hy, respectively.
Intra-day data for the precision and accuracy ofthe method given in Table 2, indicate for BzR.S.D.%=0.40–1.25 and Er%= −0.9–0.8 andfor Hy R.S.D.%=0.50–0.64 andEr%= −0.7–0.1. Moreover, the inter-dayR.S.D.% values (Table 2) for the determination ofBz and Hy were ranged from 0.59 to 0.99 and0.32 to 0.92, respectively.
The influence of small deliberate variations ofthe method parameters in the retention times ofthe analytes was examined for the evaluation ofthe robustness of the proposed method [22,23].Thus, replicate injections (n=3) of a mixedstandard solution containing 10.0 mg ml−1 of Bz,12.5 mg ml−1 of Hy and 15.0 mg ml−1 of Np,were performed under small changes of threechromatographic parameters (factors). Thefactors selected to be examined were the pH of thebuffer, the flow rate and the percentage of theacetonitrile in the mobile phase; each factor waschanged at three levels (−1, 0 and 1). One factorat the time was changed to estimate the effect.Results presented in Table 5, indicate thatretention times, capacity factors and tailingfactors of the analytes remained unaffected bysmall variations of these parameters.
The statistical evaluation of the HPLC methodrevealed its good linearity and reproducibility andled us to the conclusion that it could be used forthe simultaneous determination of Bz and Hy intablets, reliably.
3.3. Assay of pharmaceutical formulations
The proposed method was evaluated in theassay of commercially available tablets containing

I.E.
Panderi,
M.
Parissi-P
oulou/
J.P
harm.
Biom
ed.A
nal.21
(1999)1017
–1024
1023
Table 5Robustness evaluation of the high-performance liquid chromatographic method
Chromatographic changes Benazepril hydrochlorideHydrochlorothiazide Naproxen
Level trb k %c Td trb k%c Tdtrb k %cFactora Td
A: pH of the buffer0.79 1.08 7.83 1.824.70 0.80−1 3.77 0.37 1.36 4.960.79 1.07 7.72 1.79 1.064.950.38 1.214.80 0 3.82
4.871 0.76 1.24 7.69 1.78 1.103.88 0.41 1.334.904.9390.05 0.7890.02 1.1390.10 7.7590.07 1.8090.02 0.9990.163.8290.06 0.3990.02 1.3090.08Mean9S.D. (n=3)
B: Flow rate (ml min−1)0.760.37 1.03−1 7.76 1.80 1.033.83 0.41 1.15 4.860.79 1.07 7.72 1.79 1.064.9500.40 1.210.383.82
4.921 0.77 1.06 7.66 1.76 1.093.77 0.39 1.270.43Mean9S.D. (n=3) 0.7790.02 1.0590.02 7.7190.05 1.7890.02 1.0690.033.8190.03 0.3990.02 1.2190.06 4.9190.04
C: % of acetonitrile in themobile phase (6/6)
0.8044 1.11−1 7.78 1.81 0.953.85 0.41 1.25 4.990.79 1.07 7.72 1.79 1.064.950.38 1.2145 0 3.82
4.831 0.74 1.01 7.63 1.78 1.043.80 0.39 1.17461.2190.04 4.9290.08 0.8090.01 1.0690.05 7.7190.08 1.7990.02 1.0190.08Mean9S.D. (n=3) 3.8290.02 0.3990.02
a Three factors (A, B and C) were slightly changed at three levels (1, 0, −1); each time a factor was changed from level (0) the other factors remained at level (0).b Retention time.c Capacity factor.d Tailining factor.

I.E. Panderi, M. Parissi-Poulou / J. Pharm. Biomed. Anal. 21 (1999) 1017–10241024
a mixture of Bz and Hy in the proportion 0.8:1.0.Ten replicate determinations were carried out onan accurately weighted amount of the pulverisedtablets equivalent to 10.0 mg of Bz and 12.5 mg ofHy. The results obtained gave a mean of 9.9890.22 with a % R.S.D. of 2.20 for Bz, and mean of12.5290.17 with a % R.S.D. of 1.36 for Hy.
The method proved to be suitable for the con-tent uniformity test, where a great number ofassays on individual tablets is required. Commer-cially available tablets containing a mixture of Bzand Hy in proportion 0.8:1.0 were analysed usingthe proposed methodology and the results aregiven in Table 3. Recoveries achieved were inaccordance with the actual content of Bz and Hyin tablets.
Recovery studies were also performed, byanalysing spiking sample powders with appropri-ate amounts of the reference standard of bothcompounds. Two calibration curves were thenconstructed by plotting the amount of the drugfound (mg) versus the amount of the drugs added(mg) for each one of the two compounds. Thefollowing linear regression equations were ob-tained through regression analysis of data:
CBzf =1.005(90.0019)×CBz
a +3.94(90.18), r
=0.9996 (1)
CHyf =0.992(90.021)×CHy
a +5.05(90.24), r
=0.9995 (2)
where CBzf and CHy
f are the amounts (mg) foundfor Bz and Hy, respectively, while CBz
a and CHya
are the amounts (mg) added for Bz and Hy,respectively; r is the correlation coefficient of thecalibration equation.
The y-axis intercept of the above mentionedlinear regression equations indicate the amount(mg) of the drug found in the powdered tablets,while the percentage recoveries were calculated as:% recovery=slope×100. The results presented inTable 4 indicate that there is no interference fromthe excipients used in the formulation of thetablets.
In conclusion, high-performance liquid chro-matography proved to be a suitable technique forthe reliable analysis of commercial formulationscontaining combinations of hydrochlorothiazide
and benazepril hydrochloride. The micro-boreHPLC method is a selective, reliable and sensitivemethod, which offers the advantage of lower sol-vent consumption over the conventional chro-matographic methods. Moreover, the proposedmethod offers a short analytical run time of 10.0min and achieved a good resolution between Hy,Bz and Np.
References
[1] J.W.H. Watthey, J.L. Stanton, M. Desai, J.E. Babiarz,B.M. Finn, J. Med. Chem. 28 (1985) 1511–1516.
[2] J.R. Wade, D.M. Hughes, A.W. Kelman, A. Howie, P.A.Meredith, J. Pharm. Sci. 82 (1993) 471–474.
[3] H.P. Deppeler, in: J. Smith (Ed.), Analytical Profile ofDrug Substances, vol. 10, Academic Press, New York,1982, pp. 405–416.
[4] F. Barbato, P. Morrica, F. Quaglia, Farmaco 49 (1994)457–460.
[5] A. Gumieniczek, L. Przyborowski, J. Liq. Chromatogr. 20(1997) 2135–2142.
[6] D. Bonazzi, R. Gotti, V. Andrisano, V. Carvini, J. Pharm.Biomed. Anal. 16 (1997) 431–438.
[7] A. Sioufi, F. Pommier, G. Kaiser, J.P. Dubois, J. Chro-matogr. 434 (1988) 239–246.
[8] D.J. Wargo, J.K. Drennen, J. Pharm. Biomed. Anal. 14(1996) 1415–1423.
[9] M.A. Elsayed, Y.M. Elsayed, H. Abdine, Analyst 105(1980) 222–229.
[10] I. Panderi, M. Parissi-Poulou, Int. J. Pharm. 86 (1992)99–106.
[11] A.F.M. El Walily, S.F. Belal, E.A. Heaba, A. El Kersh, J.Pharm. Biomed. Anal. 13 (1995) 851–858.
[12] S.M. Brown, K.L. Busch, J. Planar Chromatogr. 4 (3)(1991) 189–193.
[13] J. Kirschbaum, S. Perlman, J. Pharm. Sci. 73 (1984)686–689.
[14] J.Y.K. Hsieh, C. Lin, B.K. Matuszewski, M.R. Dobrinska,J. Pharm. Biomed. Anal. 12 (1994) 1555–1562.
[15] D. Farthing, H. Fakhry, E.B.D. Ripley, D. Sica, J. Pharm.Biomed. Anal. 17 (1998) 1455–1459.
[16] N. Erk, F. Onur, Analusis 25 (1997) 161–163.[17] K.J. Wilson, P.M. Yuan, T.D. Schlabach, Recept.
Biochem. Methodol. 14 (1989) 17–19.[18] D.N. Mallet, B.J. Law, J. Pharm. Biomed. Anal. 9 (1991)
53–56.[19] U.D. Neue, HPLC columns. Theory, Technology, and
Practise, Wiley, New York, 1997, pp. 49–53.[20] J.N. Miller, Analyst 116 (1991) 1–14.[21] G.L. Long, G.L. Winefordner, Anal. Chem. 55 (1983)
712A–724A.[22] D.R. Jenke, J. Liq. Chromatogr. 19 (12) (1996) 1873–1891.[23] Y.V. Heyden, K. Luypaert, C. Hartmann, D.L. Massart,
J. De Beer, Anal. Chim. Acta 312 (1995) 245–262.