simulated validation of a brief food frequency questionnaire
TRANSCRIPT
Simulated Validation of a Brief Food Frequency Questionnaire
DIANE FESKANICH, MS, JAMES MARSHALL, PHD, ERIC B. RIMM, ScD, LISA B. LITIN, RD, AND WALTER C. WILLETT, MD, DRPH
Nutrient assessment by the brief 45item food frequency questionnaire used in the New York State Cohort was simulated by reducing the food list and frequency-of-use categories of the extensive 131-food item semiquantitative questionnaire used in the Health Professionals Follow-up Study. As a validation of the brief questionnaire, daily nutrient intakes were calculated following simulation procedures for 127 men who completed the extensive questionnaire, and the values were compared with those from two I-week diet records in the same population. Deattenuated correlation coefficients for 25 energy-adjusted nutrient values ranged from 0.12 f or iron to 0.76 for vitamin C (mean, 0.26). The brief questionnaire appears reasonably effective in assessing relative dietary intakes of total fat, saturated fat, monounsaturated fat, carbohydrate, dietary fiber, carotene, vitamin C, calcium, potas- sium, and magnesium. Modest improuements in the cowelations for most nutrients were seen when the number of frequency-of-use categories was increased. Correlations decreased when nutrient intakes were calculated using regression coefficients instead of a conventional nutrient database. Ann Epidemiol 1994;4:181-187.
KEY WORDS: Diet, epidemiologic methods, evaluation studies, food, questionnaires.
INTRODUCTION
The New York State Cohort was established in 1980 to study risk factors for various cancers among 58,000 men and women over 40 years old. To ensure identification of cancer cases with the New York State Tumor Registry, only New York residents who had been living at the same address for at least 18 years were invited to participate. A brief food frequency questionnaire was designed to collect dietary information in this cohort. The 45 food items on the ques- tionnaire, drawn from 130 items in an extensive 2.5-hour dietary interview, were selected to maximize information on intakes of fat; fiber; vitamins A, C and E; carotene; and total energy (1). The selected food items are listed in Table 1. The questionnaire also asks about frequency of consump- tion of coffee, tea, cola, and alcoholic beverages.
Ideally, the validity of this questionnaire would be as- sessed by comparison with a detailed, open-ended measure- ment of nutrient intake, such as multiple weeks of diet re- cords, obtained from a sample of participants in the New York State Cohort. However, a validation study of this
From the Departments of Nutrition (D.F., L.B.L., W.C.W.) and Epide- miology (E.B.R., W.C.W.), Harvard School of Public Health, Boston; Department of Social and Preventive Medicine, State University of New York at Buffalo. Buffalo. NY (1.M.): and Channine Laboratorv. Deoart- ment of Medicine, Brighim aid Women’s Hospital-and Harvard Mebical School, Boston (W.C.W.), MA.
Address reprint requests to: Diane Feskanich, MS, Department of Nu- trition, Harvard School ofPublic Health, 665 Huntington Avenue, Boston, MA 02115.
Received May 28, 1993; revised September 15, 1993.
sort is costly, and for this reason has not been undertaken. Therefore, as a simple means of assessing the performance of the New York State Cohort food frequency question- naire, data from a validation of the food frequency question- naire used in the Health Professionals Follow-up Study were reanalyzed to simulate the comparison of nutrients calcu- lated from the New York questionnaire with 14 days of diet records.
MATERIALS AND METHODS
Health Professionals Questionnaire
The Health Professionals Follow-up Study is a prospective study of diet in relation to heart disease and cancer among 51,529 men 40 to 75 years old at baseline in 1986. An exten- sive semiquantitative food frequency questionnaire is used in this cohort for assessing dietary intake. An earlier version of this questionnaire was developed in 1980 for use in the Nurses Health Study, a similar longitudinal investigation of diet and disease in women (2, 3).
The Health Professionals questionnaire includes 13 1 food items with specified portion sizes. For each item, sub- jects indicate their frequency of consumption over the previ- ous year in terms of the specified portion size by selecting from among nine frequency categories. Additional ques- tions on vitamin and mineral supplements, type of fat used in home baking and frying, usual brand of margarine and cold breakfast cereal, use of salt in cooking and at the table, and frequency with which fried foods are consumed at home
K?41-1791/94/$01.00
182 Feskanich et al. AEP Vol. 4, No. 3 VALIDATION OF A FOOD FREQUENCY QUESTIONNAIRE May 1994: 181-187
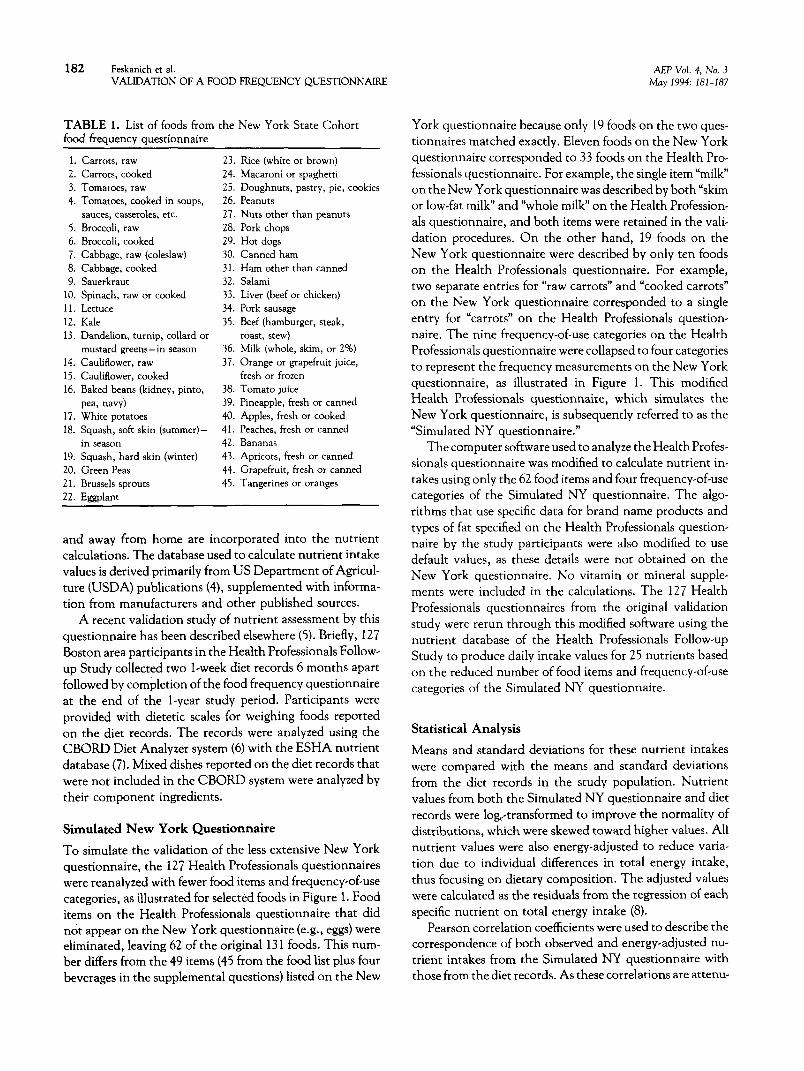
TABLE 1. List of foods from the New York State Cohort food frequency questionnaire
1. 2. 3. 4.
5. 6. 7. a. 9.
10. 11. 12. 13.
14. 15. 16.
17. 18.
19. 20. 21. 22.
carrots, raw
Carrots, cooked Tomatoes. raw Tomatoes, cooked in soups, sauces, casseroles, etc. Broccoli, raw Broccoli, cooked Cabbage, raw (coleslaw) Cabbage, cooked Sauerkraut Spinach, raw or cooked Lettuce Kale Dandelion, turnip, collard or mustard greens-in season Cauliflower, raw Cauliflower, cooked Baked beans (kidney, pinto,
pea, navy) White potatoes Squash, soft skin (summer)- in season Squash, hard skin (winter) Green Peas Brussels sprouts Eggplant
23. 24. 25. 26. 27. 28. 29. 30. 31. 32. 33. 34. 35.
36. 37.
38. 39. 40. 41. 42. 43. 44. 45.
Rice (white or brown) Macaroni or spaghetti Doughnuts, pastry, pie, cookies Peanuts Nuts other than peanuts Pork chops Hot dogs Canned ham Ham other than canned Salami Liver (beef or chicken) Pork sausage Beef (hamburger, steak, roast, stew) Milk (whole, skim, or 2%) Orange or grapefruit juice, fresh or frozen Tomato juice Pineapple, fresh or canned Apples, fresh or cooked Peaches, fresh or canned Bananas Apricots, fresh or canned Grapefruit, fresh or canned Tangerines or oranges
and away from home are incorporated into the nutrient calculations. The database used to calculate nutrient intake values is derived primarily from US Department of Agricul- ture (USDA) publications (4), supplemented with informa- tion from manufacturers and other published sources.
A recent validation study of nutrient assessment by this questionnaire has been described elsewhere (5). Briefly, 127 Boston area participants in the Health Professionals Follow- up Study collected two l-week diet records 6 months apart followed by completion of the food frequency questionnaire at the end of the l-year study period. Participants were provided with dietetic scales for weighing foods reported on the diet records. The records were analyzed using the CBORD Diet Analyzer system (6) with the ESHA nutrient database (7). Mixed dishes reported on the diet records that were not included in the CBORD system were analyzed by their component ingredients.
Simulated New York Questionnaire
To simulate the validation of the less extensive New York questionnaire, the 127 Health Professionals questionnaires were reanalyzed with fewer food items and frequency-of-use categories, as illustrated for selected foods in Figure 1. Food items on the Health Professionals questionnaire that did not appear on the New York questionnaire (e.g., eggs) were eliminated, leaving 62 of the original 13 1 foods. This num- ber differs from the 49 items (45 from the food list plus four beverages in the supplemental questions) listed on the New
York questionnaire because only 19 foods on the two ques- tionnaires matched exactly. Eleven foods on the New York questionnaire corresponded to 33 foods on the Health Pro- fessionals questionnaire. For example, the single item “milk” on the New York questionnaire was described by both “skim or low-fat milk” and “whole milk” on the Health Profession- als questionnaire, and both items were retained in the vali- dation procedures. On the other hand, 19 foods on the New York questionnaire were described by only ten foods on the Health Professionals questionnaire. For example, two separate entries for “raw carrots” and “cooked carrots” on the New York questionnaire corresponded to a single entry for “carrots” on the Health Professionals question- naire. The nine frequency-of-use categories on the Health Professionals questionnaire were collapsed to four categories to represent the frequency measurements on the New York questionnaire, as illustrated in Figure 1. This modified Health Professionals questionnaire, which simulates the New York questionnaire, is subsequently referred to as the “Simulated NY questionnaire.”
The computer software used to analyze the Health Profes- sionals questionnaire was modified to calculate nutrient in- takes using only the 62 food items and four frequency-of-use categories of the Simulated NY questionnaire. The algo- rithms that use specific data for brand name products and types of fat specified on the Health Professionals question- naire by the study participants were also modified to use default values, as these details were not obtained on the New York questionnaire. No vitamin or mineral supple- ments were included in the calculations. The 127 Health Professionals questionnaires from the original validation study were rerun through this modified software using the nutrient database of the Health Professionals Follow-up Study to produce daily intake values for 25 nutrients based on the reduced number of food items and frequency-of-use categories of the Simulated NY questionnaire.
Statistical Analysis
Means and standard deviations for these nutrient intakes were compared with the means and standard deviations from the diet records in the study population. Nutrient values from both the Simulated NY questionnaire and diet records were loge-transformed to improve the normality of distributions, which were skewed toward higher values. All nutrient values were also energy-adjusted to reduce varia- tion due to individual differences in total energy intake, thus focusing on dietary composition. The adjusted values were calculated as the residuals from the regression of each specific nutrient on total energy intake (8).
Pearson correlation coefficients were used to describe the correspondence of both observed and energy-adjusted nu- trient intakes from the Simulated NY questionnaire with those from the diet records. As these correlations are attenu-

AEP Vol. 4, No. 3 Feskanich et al. May 1994: 181-187 VALIDATION OF A FOOD FREQUENCY QUESTIONNAIRE
(a) For each food listed, indicate how often on average you have used the amount specified during the past year.
FIGURE 1. Selected foods from (a) the Health Professionals Follow-up Study food frequency questionnaire, (b) the New York State Cohort food frequency questionnaire, and (c) the Simulated NY questionnaire, a reduced version of the Health Professionals questionnaire that simulates the New York questionnaire in this validation study.
ated by within-person variation in nutrient intake between the two l-week diet records, the coefficients were deattenu- ated using the ratio of the within-person to between-person variances from an analysis-of-variance (ANOVA) analysis of the average weekly diet record nutrient values (9, IO).
To evaluate the extent to which an increased number of frequency-of-use categories could improve the perfor- mance of the New York questionnaire, nutrient intakes were recalculated using the same reduced number of food items but the full range of nine frequency-of-use categories.
As another variation in the validation procedure, nutri- ent intakes from the Simulated NY questionnaire were re- generated using the calculation method usually employed with the New York questionnaire instead of the nutrient
database of the Health Professionals Follow-up Study. These calculations use regression coefficients that reflect the contri- bution of each of the 45 food items toward the total intake of each nutrient (1, 11). The coefficients were produced by stepwise regression analyses for selecting the questionnaire food items that were the most significant predictors of nutri- ent intake. The database used to calculate these nutrient intakes was derived primarily from USDA publications (4) and other published sources similar to those used to generate the nutrient database for the Health Professionals question- naire. Thus, to produce the predicted intake of each nutri- ent in this analysis, the frequency of use for each food on the Simulated NY questionnaire was multiplied by the ap- propriate regression coefficient, and these products were
184 Feskanich et al. AEP Vol. 4, No. 3 VALIDATION OF A FOOD FREQUENCY QUESTIONNAIRE May 1994: 181-187
summed with the intercept term from the stepwise regres- sion procedure. Analysis ‘was limited to those nutrients of interest in the development of the New York questionnaire for which regression coefficients were generated: calories, total fat, saturated fat, dietary fiber, vitamin C, total vitamin A , preformed vitamin A, and carotene.
RESULTS
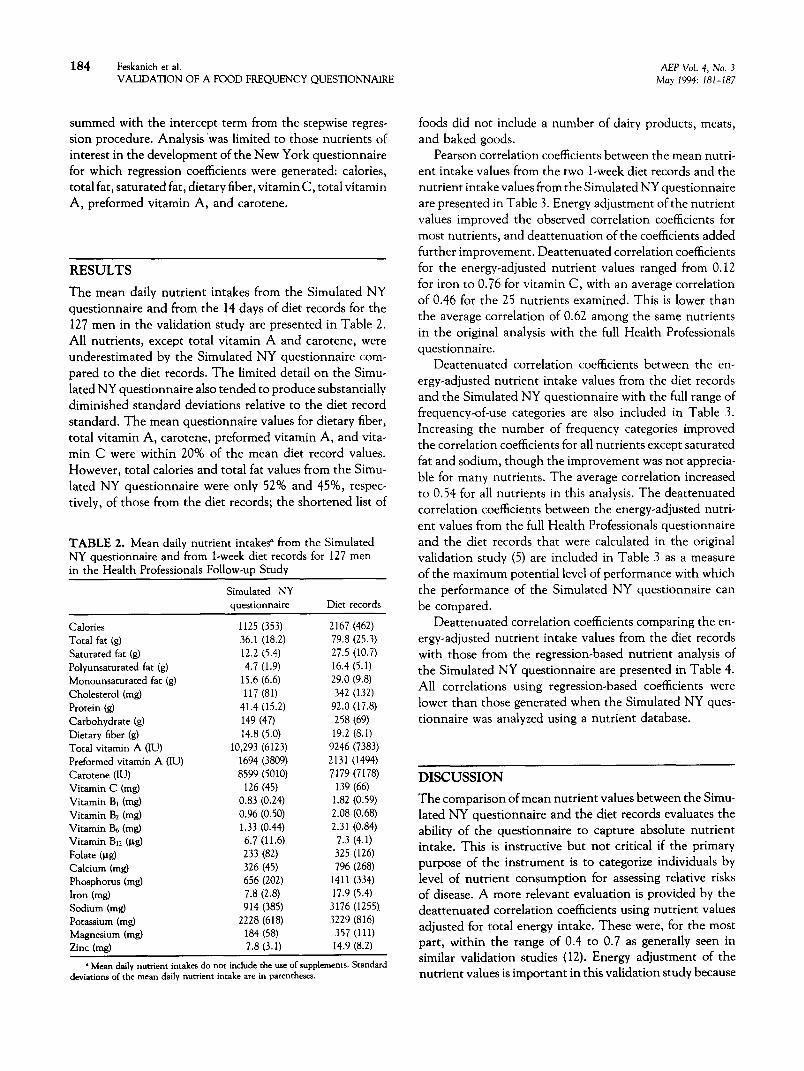
The mean daily nutrient intakes from the Simulated NY questionnaire and from the 14 days of diet records for the 127 men in the validation study are presented in Table 2. All nutrients, except total vitamin A and carotene, were underestimated by the Simulated NY questionnaire com- pared to the diet records. The limited detail on the Simu- lated NY questionnaire also tended to produce substantially diminished standard deviations relative to the diet record standard. The mean questionnaire values for dietary fiber, total vitamin A, carotene, preformed vitamin A, and vita- min C were within 20% of the mean diet record values. However, total calories and total fat values from the Simu- lated NY questionnaire were only 52% and 45%, respec- tively, of those from the diet records; the shortened list of
TABLE 2. Mean daily nutrient intakes” from the Simulated NY questionnaire and from l-week diet records for 127 men in the Health Professionals Follow-up Study
Calories Total fat (g) Saturated fat (g) Polyunsaturated fat (g) Monounsaturated fat (g) Cholesterol (mg) Protein (g) Carbohydrate (g) Dietary fiber (g)
Total vitamin A (IU) Preformed vitamin A (IU) Carotene (IU) Vitamin C (mg) Vitamin BI (mg) Vitamin Br (mg) Vitamin Be (me) Vitamin Bu (pg) Folate (pg) Calcium (mg) Phosphorus (mg) Iron (mg) Sodium (mg) Potassium (mg) Magnesium (mg) Zinc (me)
Simulated NY questionnaire
1125 (353) 36.1 (18.2) 12.2 (5.4) 4.7 (1.9)
15.6 (6.6) 117 (81)
41.4 (15.2) 149 (47) 14.8 (5.0)
10,293 (6123) 1694 (3809) 8599 (5010)
126 (45) 0.83 (0.24) 0.96 (0.50) 1.33 (0.44) 6.7 (11.6) 233 (82) 326 (45) 656 (202) 7.8 (2.8) 914 (385)
2228 (618) 184 (58) 7.8 (3.1)
Diet records
2167 (462) 79.8 (25.3) 27.5 (10.7) 16.4 (5.1) 29.0 (9.8) 342 (132)
92.0 (17.8) 258 (69) 19.2 (8.1)
9246 (7383) 2131 (1494) 7179 (7178)
139 (66) 1.82 (0.59) 2.08 (0.68) 2.31 (0.84)
7.3 (4.1) 325 (126) 796 (268)
1411 (334) 17.9 (5.4)
3176 (1255). 3229 (816)
357 (111) 14.9 (8.2)
’ Mean daily nutrient intakes do not include the use of supplements. Standard deviations of the mean daily nutrient intake are in parentheses.
foods did not include a number of dairy products, meats, and baked goods.
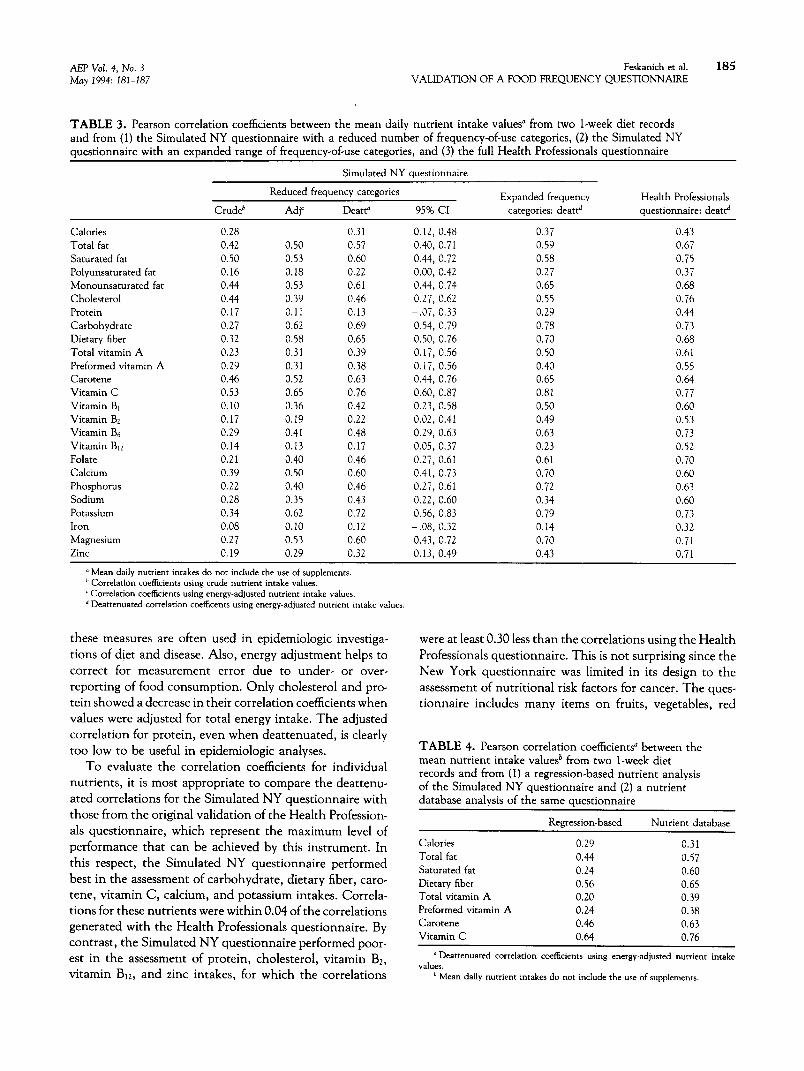
Pearson correlation coefficients between the mean nutri- ent intake values from the two l-week diet records and the nutrient intake values from the Simulated NY questionnaire are presented in Table 3. Energy adjustment of the nutrient values improved the observed correlation coefficients for most nutrients, and deattenuation of the coefficients added further improvement. Deattenuated correlation coefficients for the energy-adjusted nutrient values ranged from 0.12 for iron to 0.76 for vitamin C, with an average correlation of 0.46 for the 25 nutrients examined. This is lower than the average correlation of 0.62 among the same nutrients in the original analysis with the full Health Professionals questionnaire.
Deattenuated correlation coefficients between the en- ergy-adjusted nutrient intake values from the diet records and the Simulated NY questionnaire with the full range of frequency-of-use categories are also included in Table 3. Increasing the number of frequency categories improved the correlation coefficients for all nutrients except saturated fat and sodium, though the improvement was not apprecia- ble for many nutrients. The average correlation increased to 0.54 for all nutrients in this analysis. The deattenuated correlation coefficients between the energy-adjusted nutri- ent values from the full Health Professionals questionnaire and the diet records that were calculated in the original validation study (5) are included in Table 3 as a measure of the maximum potential level of performance with which the performance of the Simulated NY questionnaire can be compared.
Deattenuated correlation coefficients comparing the en- ergy-adjusted nutrient intake values from the diet records with those from the regression-based nutrient analysis of the Simulated NY questionnaire are presented in Table 4. All correlations using regression-based coefficients were lower than those generated when the Simulated NY ques- tionnaire was analyzed using a nutrient database.
DISCUSSION
The comparison of mean nutrient values between the Simu- lated NY questionnaire and the diet records evaluates the ability of the questionnaire to capture absolute nutrient intake. This is instructive but not critical if the primary purpose of the instrument is to categorize individuals by level of nutrient consumption for assessing relative risks of disease. A more relevant evaluation is provided by the deattenuated correlation coefficients using nutrient values adjusted for total energy intake. These were, for the most part, within the range of 0.4 to 0.7 as generally seen in similar validation studies (12). Energy adjustment of the nutrient values is important in this validation study because
AEP Vol. 4, No. 3 Feskanich et al. 185 May 1994: 181-187 VALIDATION OF A FOOD FREQUENCY QUESTIONNAIRE
TABLE 3. Pearson correlation coefficients between the mean daily nutrient intake values” from two l-week diet records and from (1) the Simulated NY questionnaire with a reduced number of frequency-of-use categories, (2) the Simulated NY questionnaire with an expanded range of frequency-of-use categories, and (3) the full Health Professionals questionnaire
Simulated NY questionnaire
Calories Total fat Saturated fat Polyunsaturated fat Monounsaturated fat Cholesterol Protein Carbohydrate Dietary fiber Total vitamin A Preformed vitamin A Carotene Vitamin C Vitamin BI Vitamin Bz Vitamin Bs Vitamin B12 Folate Calcium Phosphorus Sodium Potassium Iron Magnesium Zinc
Crude*
0.28 0.42 0.50 0.16 0.44 0.44 0.17 0.27 0.32 0.23 0.29 0.46 0.53 0.10 0.17 0.29 0.14 0.21 0.39 0.22 0.28 0.34 0.08 0.27 0.19
Reduced frequency categories Expanded frequency Health Professionals Adj Deat@ 95% CI categories: death questionnaire: de&
0.31 0.12, 0.48 0.37 0.43 0.50 0.57 0.40, 0.71 0.59 0.67 0.53 0.60 0.44, 0.72 0.58 0.75 0.18 0.22 0.00, 0.42 0.27 0.37 0.53 0.61 0.44, 0.74 0.65 0.68 0.39 0.46 0.27, 0.62 0.55 0.76 0.11 0.13 -.07, 0.33 0.29 0.44 0.62 0.69 0.54, 0.79 0.78 0.73 0.58 0.65 0.50, 0.76 0.70 0.68 0.31 0.39 0.17, 0.56 0.50 0.61 0.31 0.38 0.17, 0.56 0.40 0.55 0.52 0.63 0.44, 0.76 0.65 0.64 0.65 0.76 0.60, 0.87 0.81 0.77 0.36 0.42 0.23, 0.58 0.50 0.60 0.19 0.22 0.02, 0.41 0.49 0.53 0.41 0.48 0.29, 0.63 0.63 0.73 0.13 0.17 0.05, 0.37 0.23 0.52 0.40 0.46 0.27, 0.61 0.61 0.70 0.50 0.60 0.41, 0.73 0.70 0.60 0.40 0.46 0.27, 0.61 0.72 0.63 0.35 0.43 0.22, 0.60 0.34 0.60 0.62 0.72 0.56, 0.83 0.79 0.73 0.10 0.12 - .08, 0.32 0.14 0.32 0.53 0.60 0.43, 0.72 0.70 0.71 0.29 0.32 0.13, 0.49 0.43 0.71
a Mean daily nutrient intakes do nor include the use of supplements. b Correlation coefficients using crude nutrient intake values. / Correlation coeficients using energy-adjusted nutrient intake values. d Deattenuated correlation co¢s using energy-adjusted nutrient intake values
these measures are often used in epidemiologic investiga- tions of diet and disease. Also, energy adjustment helps to correct for measurement error due to under- or over- reporting of food consumption. Only cholesterol and pro- tein showed a decrease in their correlation coefficients when values were adjusted for total energy intake. The adjusted correlation for protein, even when deattenuated, is clearly too low to be useful in epidemiologic analyses.
To evaluate the correlation coefficients for individual nutrients, it is most appropriate to compare the deattenu- ated correlations for the Simulated NY questionnaire with those from the original validation of the Health Profession- als questionnaire, which represent the maximum level of performance that can be achieved by this instrument. In this respect, the Simulated NY questionnaire performed best in the assessment of carbohydrate, dietary fiber, caro- tene, vitamin C, calcium, and potassium intakes. Correla- tions for these nutrients were within 0.04 of the correlations generated with the Health Professionals questionnaire. By contrast, the Simulated NY questionnaire performed poor- est in the assessment of protein, cholesterol, vitamin Bl, vitamin Blz, and zinc intakes, for which the correlations
were at least 0.30 less than the correlations using the Health Professionals questionnaire. This is not surprising since the New York questionnaire was limited in its design to the assessment of nutritional risk factors for cancer. The ques- tionnaire includes many items on fruits, vegetables, red
TABLE 4. Pearson correlation coefficients” between the mean nutrient intake valuesb from two l-week diet records and from (1) a regression-based nutrient analysis of the Simulated NY questionnaire and (2) a nutrient database analysis of the same questionnaire
Regression-based Nutrient database
Calories 0.29 0.31 Total fat 0.44 0.57 Saturated fat 0.24 0.60 Dietary fiber 0.56 0.65 Total vitamin A 0.20 0.39 Preformed vitamin A 0.24 0.38 Carotene 0.46 0.63 Vitamin C 0.64 0.76
’ Deattenuated correlation coefficients using energy-adjusted nutrient intake values.
b Mean daily nutrient intakes do not include the use of supplements.
186 Feskanich et al. AEP Vol. 4, No. 3 VALIDATION OF A FOOD FREQUENCY QUESTIONNAIRE May 1994: 181-187
meats, and processed meats-foods high in the nutrients that are measured well in this validation study. On the other hand, the New York questionnaire has few items on dairy products, baked goods, eggs, chicken or fish. These foods are important sources of the nutrients that are mea- sured poorly.
We expected the analysis of the Simulated NY question- naire with all nine frequency-of-use categories to result in higher correlation coefficients than the ones generated when the data were limited to the four collapsed categories. The correlations did improve, but for most nutrients the improvement was not large. This may be explained by the fact that the brief New York questionnaire lacked fre- quency-of-use categories to describe intakes of more than once per day, but it also omitted the types of foods that people are likely to consume with this frequency. Only “milk” and “doughnuts, pastry, pie, and cookies” on the New York questionnaire might have benefited from re- sponse categories with higher frequencies of consumption.
consumption of calories, polyunsaturated fat, protein, vita- min Bz, vitamin Blz, iron, and zinc.
The limited variation generated by the Simulated NY questionnaire points to a peculiarity of the limitation im- posed by the use of a brief food frequency questionnaire. Ordinarily, a flawed measure produces excess variance rela- tive to a standard. Variance in the flawed measure is com- posed of true, or standard, variance and error variance. A limited nutrient index, however, has a deficit of variance relative to that which should be observable, contributing to the reduced correlations compared to those observed with a more detailed questionnaire.
Finally, this effort assumes that the correspondence be- tween nutrient intake reflected by 2 weeks of diet records and that represented by a limited set of food items among members of the New York State Cohort is well represented by the correspondence observed among 127 male health professionals living in greater Boston. The New York State residents are not, in general, health professionals. They do, however, tend to be of a higher social class and better edu- cated than the average New York State resident. They also represent the small proportion of those invited to participate in a long-term study who responded to an initial mailed questionnaire. Thus, it appears that generalizing from health professionals in the Boston area to New York State Cohort members is reasonably safe.
Although the stepwise regression procedure was rela- tively effective in identifying food items for the New York questionnaire, the specific regression coefficients estimated by this procedure are not very useful for the calculation of nutrient intakes. This is evident from the lower validity correlations produced with the regression-based nutrient analysis compared to those generated with the nutrient da- tabase analysis of the Simulated NY questionnaire. The results of this validation study suggest that nutrient intakes calculated using nutrient databases are more dependable than those derived from regression coefficients.
This validation study is an indirect evaluation of the ability of the brief New York State Cohort food frequency questionnaire to assess relative nutrient consumption. The validation probably underestimates its assessment capabil- ity for some nutrients, since the questionnaire includes more detailed descriptions of fruits, vegetables, red meat, and processed meats than those available on the Health Profes- sionals questionnaire. On the other hand, the assessment capabilities may be overestimated for nutrients in those foods that were specified more fully on the Health Profes- sionals questionnaire, such as milk, rice, potatoes, and baked goods. Since the data for this validation study were collected using the Health Professionals questionnaire, it remains unknown how the organization and layout of the New York State Cohort questionnaire might affect subject responses and calculated nutrient intakes.
Despite the limitations of this study, the data suggest that for many nutrients, the brief New York State Cohort food frequency questionnaire is able to capture most of the information obtained in a considerably longer and detailed questionnaire.
This work was supported by research grant CA 55075 from the National Cancer Institute.
REFERENCES
It is not surprising that the brief New York questionnaire does not perform as well as the much more extensive Health Professionals questionnaire. However, the 45 food items on the New York questionnaire appear reasonably effective in predicting dietary intakes of total fat, saturated fat, mono- unsaturated fat, carbohydrate, dietary fiber, carotene, vita- min C, calcium, potassium, and magnesium. The question- naire is seriously limited in its ability to describe the
1. Graham S, Zielezny M, Marshall J, et al. Diet in the epidemiology of postmenopausal breast cancer in the New York State Cohort, Am J Epidemiol. 1992;136:1327-37.
2. Willett WC, Sampson LS, Stampfer MJ, et al. Reproducibility and validity of a semiquantitative food frequency questionnaire, Am J Epidemiol. 1985;122:51-65.
3. Salvini S, Hunter DJ, Sampson L, et al. Food based validation of a dietary questionnaire: The-effects of week-to-week variation in food consumption, Int J Epidemiol. 1989;18:858-67.
4. US Department of Agriculture. Composition of Foods: Handbook 8 series. Washington, DC: US Government Printing Office; 1976-89.
5. Rimm EB, Giovannucci EL, Stampfer MJ, Colditz GA, Litin LB, Willett WC. Reproducibility and validity of an expanded seif- administered semiquantitative food frequency questionnaire among male health professionals, Am J Epidemiol. 1992; 135: 1114-26.
6. The CBORD Group. Version 3.0.3. Ithaca, NY: 1988.
7. ESHA Research Database. Salem, OR: 1988.

AEP Vol. 4, No. 3 Feskanich et al. 187 May 1994: 181-187 VALIDATlON OF A FOOD FREQUENCY QUESTlONNAIRE
8. Willett W, Stampfer MJ. Total energy intake: Implication for epidemio- corrected for within-person variation: Implications for study design logic analyses, Am J Epidemiol. 1986;124:17-27. and hypothesis testing, Am J Epidemiol. 1988;127:377-86.
9. Beaton GH, Milner J, Corey P, et al. Sources of variance in 24-hour dietary recall data: Implication for nutrition study design and interpre- tation, Am J Clin Nutr. 1979;32:2546-59.
10. Rosner B, Willett WC. Interval estimates for correlation coefficients
11. Byers T, Marshall J, Fiedler R, Zielezny M, Graham S. Assessing nutrient intake with an abbreviated dietary interview, Am J Epidemiol. 1985;122:41-50.
12. Willett WC. Nutritional Epidemiology. New York: Oxford University Press; 1990.