simulated impacts of afforestation in east china monsoon region as modulated by ocean variability
TRANSCRIPT
Simulated impacts of afforestation in East China monsoon regionas modulated by ocean variability
Di Ma • Michael Notaro • Zhengyu Liu •
Guangshan Chen • Yongqiang Liu
Received: 17 July 2012 / Accepted: 5 November 2012
� Springer-Verlag Berlin Heidelberg 2012
Abstract Using the National Center for Atmospheric
Research Community Climate System Model Version 3.5,
this paper examines the climatic effects of afforestation in
the East China monsoon region with a focus on land–
atmosphere interactions and the modulating influence of
ocean variability. In response to afforestation, the local
surface air temperature significantly decreases in summer
and increases in winter. The summer cooling is attributed to
enhanced evapotranspiration from increased tree cover.
During winter, afforestation induces greater roughness and
weaker winds over the adjacent coastal ocean, leading to
diminished latent heat flux and increased sea-surface tem-
perature (SST). The enhanced SST supports greater atmo-
spheric water vapor, which is accompanied by anomalous
wind, and transported into the East China monsoon region.
The increase in atmospheric water vapor favors more cloud
cover and precipitation, especially in the eastern afforesta-
tion region. Furthermore, the increase in atmospheric water
vapor and cloud cover produce a greenhouse effect, raising
the wintertime surface air temperature. By comparing
simulations in which ocean temperature are either fixed or
variable, we demonstrate that a significant hydrologic
response in East China to afforestation only occurs if ocean
temperatures are allowed to vary and the oceanic source of
moisture to the continent is enhanced.
Keywords Afforestation � CCSM3.5 � CLM-DGVM �East China monsoon region � Ocean variability �WES feedback
1 Introduction
Afforestation has been proposed as a strategy by the Kyoto
Protocol for mitigating anthropogenic global warming
through carbon sequestration. The Global Forest Resources
Assessment (2005) found that China’s afforestation and
reforestation activities have, to an extent, offset the nega-
tive impacts of deforestation in the world (FAO 2005).
China plans to increase its percentage forest cover from
18.2 % at present to 26 % by the year 2050 (Lei 2005). In
an effort to increase its carbon sink (Yang et al. 2010).
Such an extensive land cover change in China is likely
to impact the climate on a variety of spatial scales through
direct and indirect interactions within the earth’s land/
ocean/atmosphere system. Few studies have examined the
climatic effect of extreme land cover change in China (Xue
1996; Liu et al. 2008). Liu et al. (2008) used a regional
climate model (RCM) to simulate the impact of affores-
tation in northern China. They found that afforestation
D. Ma
Key Laboratory for Land Surface Process and Climate Change
in Cold and Arid Regions, Cold and Arid Regions
Environmental and Engineering Research Institute,
Chinese Academy of Science, Lanzhou, China
D. Ma (&) � M. Notaro � G. Chen
Nelson Institute for Environmental Studies,
Center for Climatic Research, University of Wisconsin-Madison,
1225 West Dayton St., Madison, WI 53706, USA
e-mail: [email protected]
D. Ma
Graduate School of Chinese Academy of Sciences,
Chinese Academy of Science, Beijing, China
Z. Liu
Labarotory for Climate, Ocean and Atmosphere Studies,
Perking University, Beijing 100871, China
Y. Liu
Center for Forest Disturbance Science,
USDA Forest Service, Athens, GA, USA
123
Clim Dyn
DOI 10.1007/s00382-012-1592-9
increased precipitation, relative humidity, and soil moisture
and reduced wind speed and air temperature, with the
greatest effects in spring-summer.
Land cover changes at different latitudes can induce
unique climate effects. Tropical deforestation can exacer-
bate local warming through decreased evaporation and
precipitation (Henderson-Sellers et al. 1993; Werth and
Avissar 2002). Expansion of the boreal forests can produce
warming, mainly through vegetation/snow albedo feed-
backs (Bonan et al. 1992; Foley 1994; Betts 2000; Galli-
more et al. 2005; Notaro and Liu 2008). In contrast, the
climatic impact of changes in temperate forests (e.g. China)
is highly uncertain and less understood than that of the
tropical and boreal regions (Bonan 2008; Chen et al. 2012).
It is unclear whether temperate forest regions like China
behaves more like tropical or boreal forests in terms of
their climate feedbacks, with the former supporting a
moisture feedback and the latter supporting a thermal
feedback. Furthermore, its feedback could vary by season.
Numerous studies have isolated mechanisms by which
changes in vegetation can affect regional and global cli-
mate (Bonan et al. 1992, 2008; Meehl 1994; Xue 1996;
Xue et al. 2004; Pielke et al. 1998). Biosphere–atmosphere
interactions are often complex and nonlinear, which poses
challenges for terrestrial ecosystem models within coupled
general circulation models (Bonan 2008). The sign and
strength of vegetation feedbacks to the atmosphere depend
on the geographical region and background climatology
(Notaro et al. 2011a). Changes in vegetation can affect the
surface radiation budget, hydrologic cycle, and atmo-
spheric circulation across a range of temporal and spatial
scales. A number of mechanisms have been proposed to
explain how changes in vegetation cover might affect cli-
mate. The vegetation albedo feedback mechanism (e.g.
grass versus bare ground) suggests that increased vegeta-
tion cover decreases the surface albedo, increases the
absorbed solar radiation at the surface, and increases sur-
face temperature (Charney 1975). The snow/vegetation
albedo feedback, by which the albedo of forested land with
snow is lower than snow-covered soil, can induce a
warming in spring (Gallimore and Kutzbach 1996). The
evapotranspiration mechanism indicates that increased
vegetation cover results in enhanced plant transpiration,
resulting in a decrease in surface temperature, increase in
water vapor availability and greater precipitation through
local moisture recycling (Shukla and Mintz 1982). The
roughness length mechanism suggests that increased veg-
etation height and leaf area index (LAI) (e.g. more trees
relative to grass) produces greater surface roughness and
decreased wind speed, leading to increased mass conver-
gence into surface low-pressure centers. This, in turn, can
induce upward moisture transport and increased convective
cloud cover and precipitation. Roughness length changes
also alter the aerodynamic resistance, which affects tur-
bulent fluxes (e.g. latent heat flux) and precipitation (Sud
et al. 1988; Chen et al. 2012).
The land, atmosphere and ocean are strongly coupled in
the Asian Monsoon system (Yasunari 2007), suggesting
that oceans may play a stronger role in modulating vege-
tation–climate interactions than in regions without a sea-
sonal monsoon. A number of studies have investigated land
cover change effects in global climate models (GCMs)
with fixed sea surface temperatures (SSTs) (Xue 1996;
Kanae et al. 2001; Werth and Avissar 2002; Xue et al.
2004; Sen et al. 2004). For example, Xue et al. (2004)
found that both surface albedo and vegetation perturbations
are important to the East Asian and West African monsoon
evolution and intensity, as well as the spatial distribution of
precipitation and atmosphere circulation. In a desertifica-
tion experiment for the Sahel, Xue and Shukla (1996)
found that a reduction in evaporation dominated the
response of local surface energy budget.
Studies have also applied fully coupled atmosphere–
ocean-land models with dynamic vegetation to examine
vegetation feedbacks on climate (Levis et al. 2004; Galli-
more et al. 2005; Notaro and Gutzler 2011; Notaro et al.
2011a, b). The study by Notaro et al. (2011a) used a fully
coupled atmosphere–ocean-land model to assess vegetation
feedbacks on climate for six monsoon regions, including
the East China monsoon region, and found that the model
captured the major structure of global and regional cli-
matology. In their study, decreased vegetation cover in
East China produced year-around warming, increased
springtime precipitation, and decreased precipitation in the
other seasons. However, these studies did not isolate the
modulating effect of the ocean on land–atmosphere inter-
actions. Dallmeyer et al. (2010) studied the impact of
oceanic and vegetation feedbacks on Holocene climate
change and found that the ocean can modify the atmo-
spheric signal. However, the modulating effect of the ocean
on land–atmosphere interactions may differ significantly
by region.
This study uses a fully coupled climate model to
examine the equilibrium, long-term impacts of afforesta-
tion on climate in the East China monsoon region and to
explore the potential modulating effect of ocean tempera-
ture variability on these afforestation feedbacks to climate.
This study differs from previous studies by focusing on the
climatic effects of afforestation in a previously deforested
temperate region and comparing fixed ocean simulations
with fully coupled experiments, in order to isolate the
influence of ocean–atmosphere interaction on the climatic
response to afforestation in the East China monsoon region.
This study addresses two key questions: (1) what is the
long-term effect of afforestation on climate in the East
China monsoon region? (2) what role does SST variability
D. Ma et al.
123
play in modulating afforestation feedbacks on climate? In
this paper, the model and experimental design are descri-
bed in Sect. 2. ‘‘Results’’ of the modeling experiments are
described in Sect. 3, and the ‘‘Discussion and Conclusions’’
are presented in Sect. 4.
2 Model and experimental design
2.1 Model description
The model used in this study is the National Center for
Atmospheric Research Community Climate System Model
Version 3.5 (NCAR CCSM3.5), which includes dynamic
atmosphere, land, ocean and sea ice components (Gent et al.
2010). We apply a finite volume dynamical core and a
horizontal resolution of 1.9� 9 2.5�. The land component,
the Community Land Model version 3.5 (CLM3.5-DGVM)
includes vegetation dynamics with annual vegetation pro-
cesses based on the Lund-Potsdam-Jena (LPJ) dynamic
global vegetation model (Levis et al. 2004). There are ten
plant functional types (PFTs) in CLM3.5, including three
types of grasses and seven types of trees, and the vegetation
performed in CLM3.5-DGVM is potential vegetation. Also,
there are 10 soil layers in land model. Several improve-
ments were made to the CLM3.5 version. Compared to
previous versions, the partitioning of evapotranspiration
(ET) was improved, which resulted in wetter soils, less plant
water stress, enhanced transpiration and photosynthesis, and
a more reliable annual cycle of total water storage (Oleson
et al. 2008). When scaling of the canopy interception was
included, a resistance term was added to reduce excessive
soil evaporation (Lawrence et al. 2007). The ocean com-
ponent, the Parallel Ocean Program (POP), uses a dipole
grid with a nominal horizontal resolution of 1�. The grid is
1.125� in the zonal direction (320 points) and roughly 0.5�in the meridional direction with higher resolution near the
equator. The sea-ice model is integrated on the same hori-
zontal grid as the ocean model (Collins et al. 2006).
2.2 Experimental design
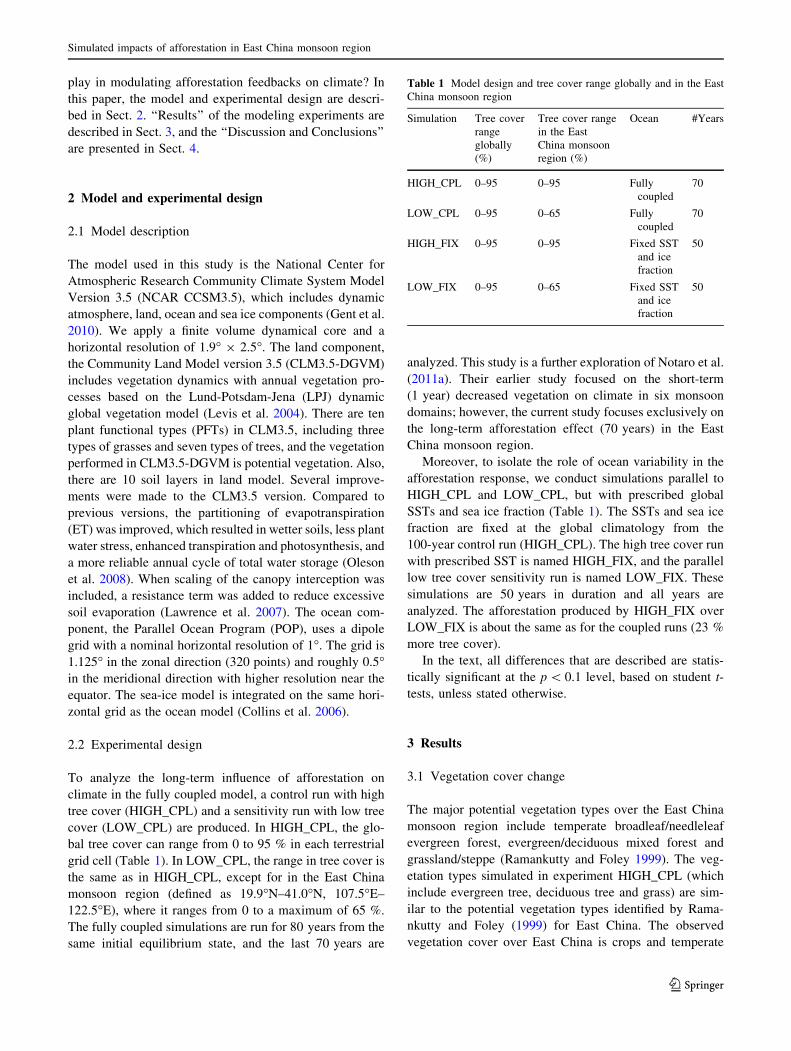
To analyze the long-term influence of afforestation on
climate in the fully coupled model, a control run with high
tree cover (HIGH_CPL) and a sensitivity run with low tree
cover (LOW_CPL) are produced. In HIGH_CPL, the glo-
bal tree cover can range from 0 to 95 % in each terrestrial
grid cell (Table 1). In LOW_CPL, the range in tree cover is
the same as in HIGH_CPL, except for in the East China
monsoon region (defined as 19.9�N–41.0�N, 107.5�E–
122.5�E), where it ranges from 0 to a maximum of 65 %.
The fully coupled simulations are run for 80 years from the
same initial equilibrium state, and the last 70 years are
analyzed. This study is a further exploration of Notaro et al.
(2011a). Their earlier study focused on the short-term
(1 year) decreased vegetation on climate in six monsoon
domains; however, the current study focuses exclusively on
the long-term afforestation effect (70 years) in the East
China monsoon region.
Moreover, to isolate the role of ocean variability in the
afforestation response, we conduct simulations parallel to
HIGH_CPL and LOW_CPL, but with prescribed global
SSTs and sea ice fraction (Table 1). The SSTs and sea ice
fraction are fixed at the global climatology from the
100-year control run (HIGH_CPL). The high tree cover run
with prescribed SST is named HIGH_FIX, and the parallel
low tree cover sensitivity run is named LOW_FIX. These
simulations are 50 years in duration and all years are
analyzed. The afforestation produced by HIGH_FIX over
LOW_FIX is about the same as for the coupled runs (23 %
more tree cover).
In the text, all differences that are described are statis-
tically significant at the p \ 0.1 level, based on student t-
tests, unless stated otherwise.
3 Results
3.1 Vegetation cover change
The major potential vegetation types over the East China
monsoon region include temperate broadleaf/needleleaf
evergreen forest, evergreen/deciduous mixed forest and
grassland/steppe (Ramankutty and Foley 1999). The veg-
etation types simulated in experiment HIGH_CPL (which
include evergreen tree, deciduous tree and grass) are sim-
ilar to the potential vegetation types identified by Rama-
nkutty and Foley (1999) for East China. The observed
vegetation cover over East China is crops and temperate
Table 1 Model design and tree cover range globally and in the East
China monsoon region
Simulation Tree cover
range
globally
(%)
Tree cover range
in the East
China monsoon
region (%)
Ocean #Years
HIGH_CPL 0–95 0–95 Fully
coupled
70
LOW_CPL 0–95 0–65 Fully
coupled
70
HIGH_FIX 0–95 0–95 Fixed SST
and ice
fraction
50
LOW_FIX 0–95 0–65 Fixed SST
and ice
fraction
50
Simulated impacts of afforestation in East China monsoon region
123
forests, which is similar to the potential vegetation type
over East China.
Comparing the two simulations, the area-averaged total
tree (grass) cover in LOW_CPL is 25 % lower (higher) than
in HIGH_CPL across the East China monsoon area. The total
vegetation cover does not change. The difference in climate
between HIGH_CPL and LOW_CPL is attributed to affor-
estation in the East China monsoon region. The total leaf area
index (LAI) increases year round in HIGH_CPL compared to
LOW_CPL (Table 2), on average by 1.43 m2/m2.
3.2 Impact of afforestation in the fully coupled
experiments
3.2.1 Response of temperature and precipitation
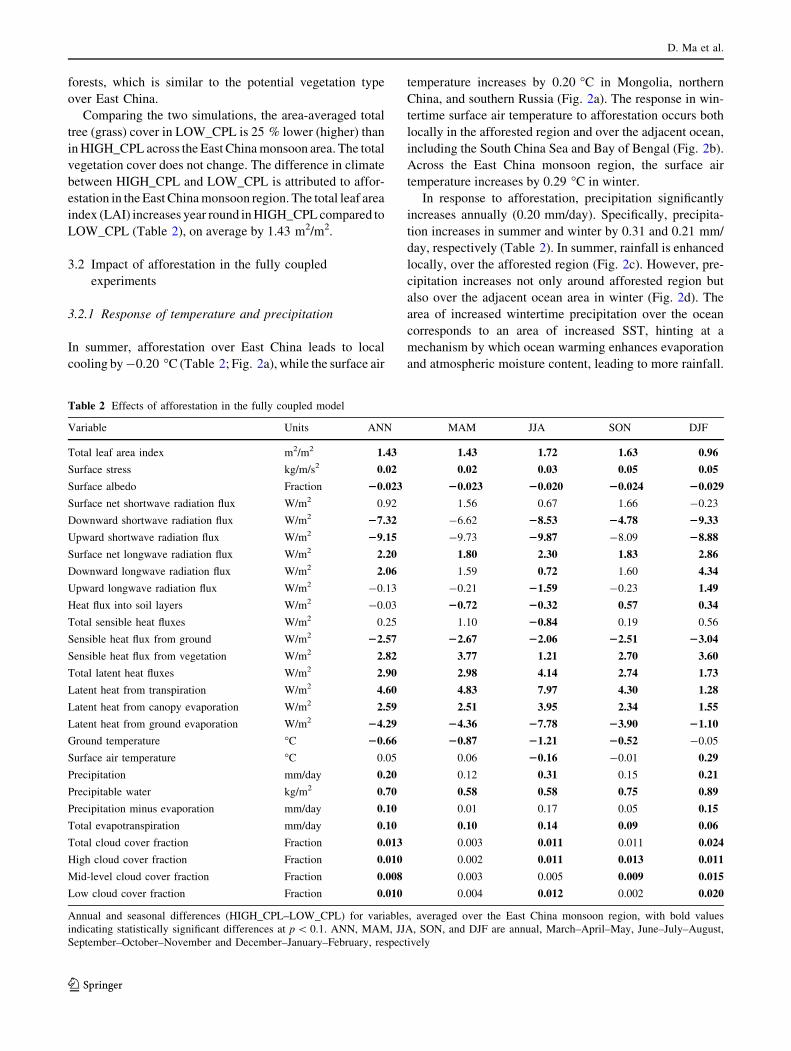
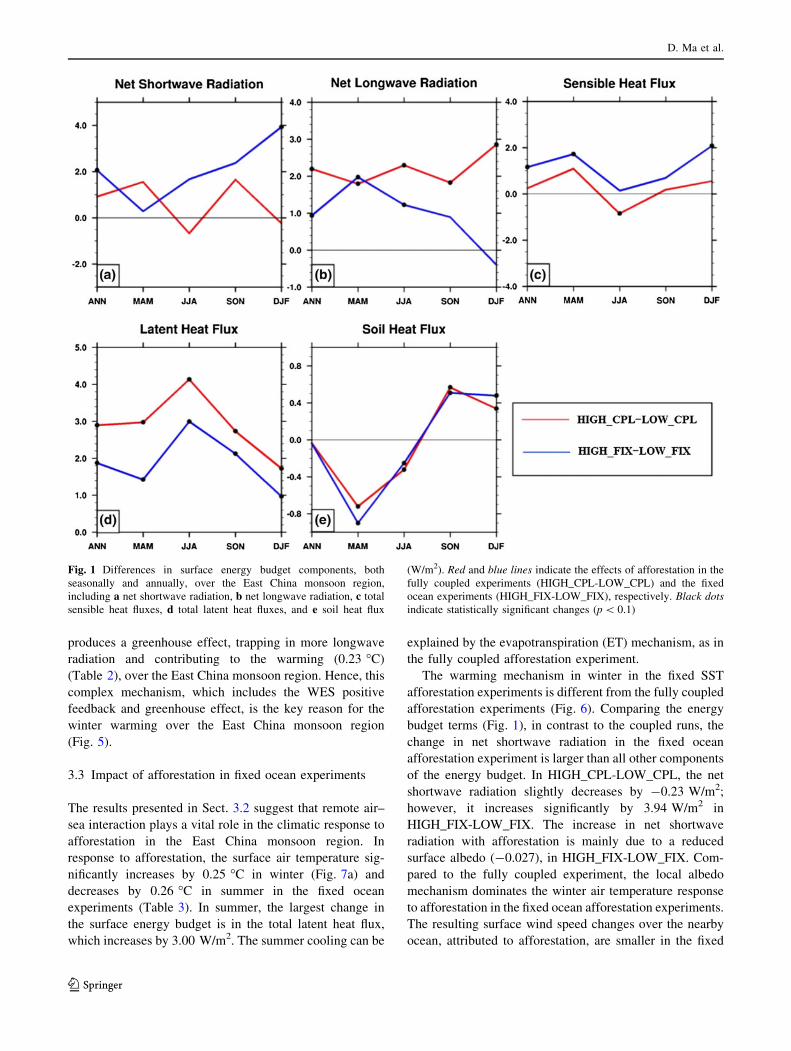
In summer, afforestation over East China leads to local
cooling by -0.20 �C (Table 2; Fig. 2a), while the surface air
temperature increases by 0.20 �C in Mongolia, northern
China, and southern Russia (Fig. 2a). The response in win-
tertime surface air temperature to afforestation occurs both
locally in the afforested region and over the adjacent ocean,
including the South China Sea and Bay of Bengal (Fig. 2b).
Across the East China monsoon region, the surface air
temperature increases by 0.29 �C in winter.
In response to afforestation, precipitation significantly
increases annually (0.20 mm/day). Specifically, precipita-
tion increases in summer and winter by 0.31 and 0.21 mm/
day, respectively (Table 2). In summer, rainfall is enhanced
locally, over the afforested region (Fig. 2c). However, pre-
cipitation increases not only around afforested region but
also over the adjacent ocean area in winter (Fig. 2d). The
area of increased wintertime precipitation over the ocean
corresponds to an area of increased SST, hinting at a
mechanism by which ocean warming enhances evaporation
and atmospheric moisture content, leading to more rainfall.
Table 2 Effects of afforestation in the fully coupled model
Variable Units ANN MAM JJA SON DJF
Total leaf area index m2/m2 1.43 1.43 1.72 1.63 0.96
Surface stress kg/m/s2 0.02 0.02 0.03 0.05 0.05
Surface albedo Fraction 20.023 20.023 20.020 20.024 20.029
Surface net shortwave radiation flux W/m2 0.92 1.56 0.67 1.66 -0.23
Downward shortwave radiation flux W/m2 27.32 -6.62 28.53 24.78 29.33
Upward shortwave radiation flux W/m2 29.15 -9.73 29.87 -8.09 28.88
Surface net longwave radiation flux W/m2 2.20 1.80 2.30 1.83 2.86
Downward longwave radiation flux W/m2 2.06 1.59 0.72 1.60 4.34
Upward longwave radiation flux W/m2 -0.13 -0.21 21.59 -0.23 1.49
Heat flux into soil layers W/m2 -0.03 20.72 20.32 0.57 0.34
Total sensible heat fluxes W/m2 0.25 1.10 20.84 0.19 0.56
Sensible heat flux from ground W/m2 22.57 22.67 22.06 22.51 23.04
Sensible heat flux from vegetation W/m2 2.82 3.77 1.21 2.70 3.60
Total latent heat fluxes W/m2 2.90 2.98 4.14 2.74 1.73
Latent heat from transpiration W/m2 4.60 4.83 7.97 4.30 1.28
Latent heat from canopy evaporation W/m2 2.59 2.51 3.95 2.34 1.55
Latent heat from ground evaporation W/m2 24.29 24.36 27.78 23.90 21.10
Ground temperature �C 20.66 20.87 21.21 20.52 -0.05
Surface air temperature �C 0.05 0.06 20.16 -0.01 0.29
Precipitation mm/day 0.20 0.12 0.31 0.15 0.21
Precipitable water kg/m2 0.70 0.58 0.58 0.75 0.89
Precipitation minus evaporation mm/day 0.10 0.01 0.17 0.05 0.15
Total evapotranspiration mm/day 0.10 0.10 0.14 0.09 0.06
Total cloud cover fraction Fraction 0.013 0.003 0.011 0.011 0.024
High cloud cover fraction Fraction 0.010 0.002 0.011 0.013 0.011
Mid-level cloud cover fraction Fraction 0.008 0.003 0.005 0.009 0.015
Low cloud cover fraction Fraction 0.010 0.004 0.012 0.002 0.020
Annual and seasonal differences (HIGH_CPL–LOW_CPL) for variables, averaged over the East China monsoon region, with bold values
indicating statistically significant differences at p \ 0.1. ANN, MAM, JJA, SON, and DJF are annual, March–April–May, June–July–August,
September–October–November and December–January–February, respectively
D. Ma et al.
123
3.2.2 Mechanisms governing climatic response
to afforestation
In this section, we explore the key processes governing the
climatic response to afforestation in the East China mon-
soon region. First, we examine the components of the
surface energy budget across the afforested region (Fig. 1;
Table 2). Note that all radiation fluxes directed toward
(away from) the surface are defined as positive (negative),
while non-radiation fluxes (such as latent heat flux and
sensible heat flux) directed toward the surface are defined
as negative. The total latent heat flux is comprised of three
terms: transpiration, ground evaporation and canopy
evaporation. The total sensible heat flux is the sum of the
sensible heat fluxes from both the ground and vegetation.
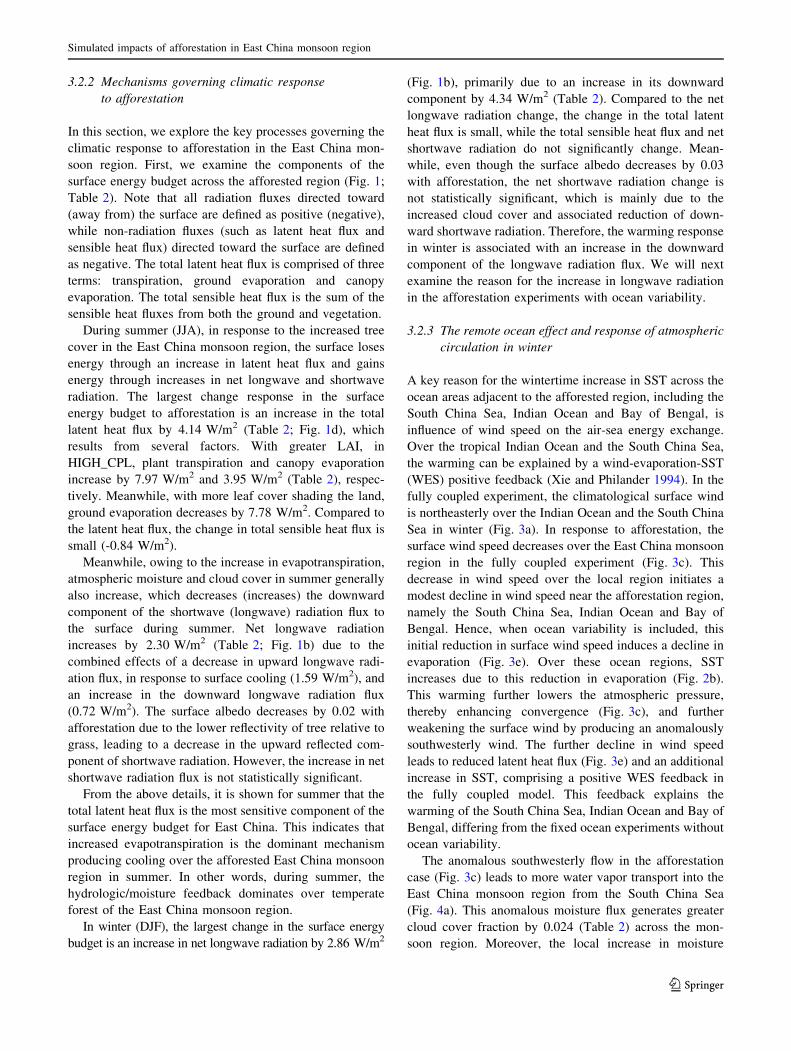
During summer (JJA), in response to the increased tree
cover in the East China monsoon region, the surface loses
energy through an increase in latent heat flux and gains
energy through increases in net longwave and shortwave
radiation. The largest change response in the surface
energy budget to afforestation is an increase in the total
latent heat flux by 4.14 W/m2 (Table 2; Fig. 1d), which
results from several factors. With greater LAI, in
HIGH_CPL, plant transpiration and canopy evaporation
increase by 7.97 W/m2 and 3.95 W/m2 (Table 2), respec-
tively. Meanwhile, with more leaf cover shading the land,
ground evaporation decreases by 7.78 W/m2. Compared to
the latent heat flux, the change in total sensible heat flux is
small (-0.84 W/m2).
Meanwhile, owing to the increase in evapotranspiration,
atmospheric moisture and cloud cover in summer generally
also increase, which decreases (increases) the downward
component of the shortwave (longwave) radiation flux to
the surface during summer. Net longwave radiation
increases by 2.30 W/m2 (Table 2; Fig. 1b) due to the
combined effects of a decrease in upward longwave radi-
ation flux, in response to surface cooling (1.59 W/m2), and
an increase in the downward longwave radiation flux
(0.72 W/m2). The surface albedo decreases by 0.02 with
afforestation due to the lower reflectivity of tree relative to
grass, leading to a decrease in the upward reflected com-
ponent of shortwave radiation. However, the increase in net
shortwave radiation flux is not statistically significant.
From the above details, it is shown for summer that the
total latent heat flux is the most sensitive component of the
surface energy budget for East China. This indicates that
increased evapotranspiration is the dominant mechanism
producing cooling over the afforested East China monsoon
region in summer. In other words, during summer, the
hydrologic/moisture feedback dominates over temperate
forest of the East China monsoon region.
In winter (DJF), the largest change in the surface energy
budget is an increase in net longwave radiation by 2.86 W/m2
(Fig. 1b), primarily due to an increase in its downward
component by 4.34 W/m2 (Table 2). Compared to the net
longwave radiation change, the change in the total latent
heat flux is small, while the total sensible heat flux and net
shortwave radiation do not significantly change. Mean-
while, even though the surface albedo decreases by 0.03
with afforestation, the net shortwave radiation change is
not statistically significant, which is mainly due to the
increased cloud cover and associated reduction of down-
ward shortwave radiation. Therefore, the warming response
in winter is associated with an increase in the downward
component of the longwave radiation flux. We will next
examine the reason for the increase in longwave radiation
in the afforestation experiments with ocean variability.
3.2.3 The remote ocean effect and response of atmospheric
circulation in winter
A key reason for the wintertime increase in SST across the
ocean areas adjacent to the afforested region, including the
South China Sea, Indian Ocean and Bay of Bengal, is
influence of wind speed on the air-sea energy exchange.
Over the tropical Indian Ocean and the South China Sea,
the warming can be explained by a wind-evaporation-SST
(WES) positive feedback (Xie and Philander 1994). In the
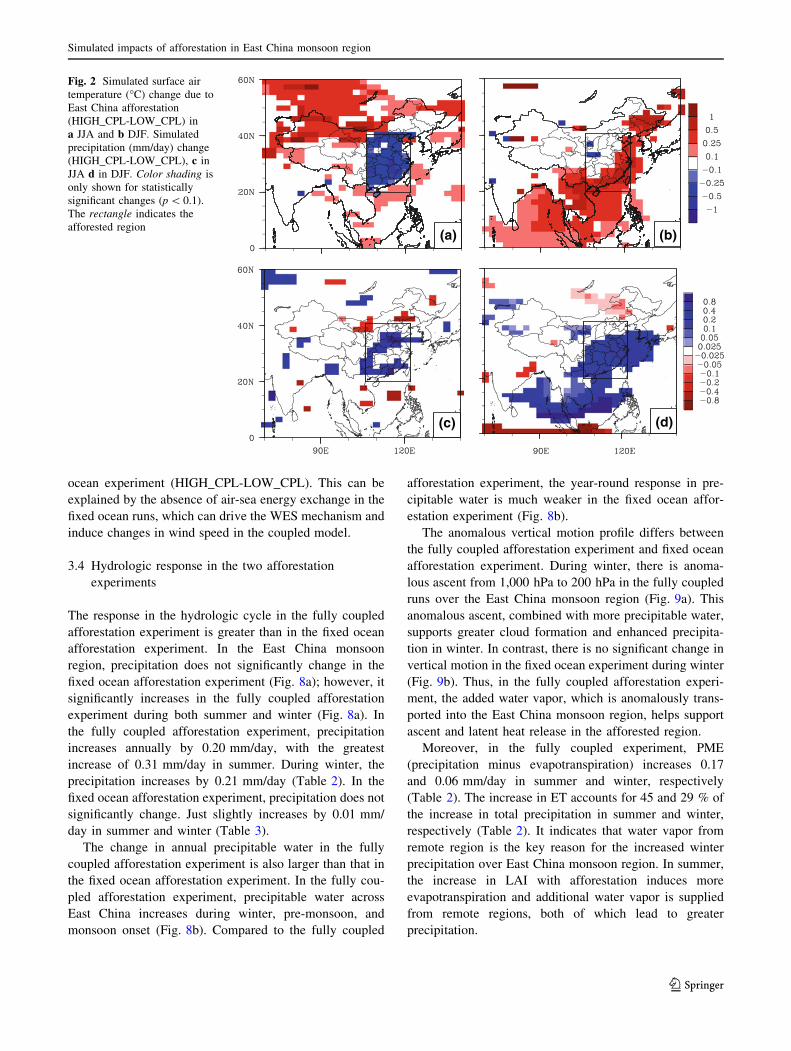
fully coupled experiment, the climatological surface wind
is northeasterly over the Indian Ocean and the South China
Sea in winter (Fig. 3a). In response to afforestation, the
surface wind speed decreases over the East China monsoon
region in the fully coupled experiment (Fig. 3c). This
decrease in wind speed over the local region initiates a
modest decline in wind speed near the afforestation region,
namely the South China Sea, Indian Ocean and Bay of
Bengal. Hence, when ocean variability is included, this
initial reduction in surface wind speed induces a decline in
evaporation (Fig. 3e). Over these ocean regions, SST
increases due to this reduction in evaporation (Fig. 2b).
This warming further lowers the atmospheric pressure,
thereby enhancing convergence (Fig. 3c), and further
weakening the surface wind by producing an anomalously
southwesterly wind. The further decline in wind speed
leads to reduced latent heat flux (Fig. 3e) and an additional
increase in SST, comprising a positive WES feedback in
the fully coupled model. This feedback explains the
warming of the South China Sea, Indian Ocean and Bay of
Bengal, differing from the fixed ocean experiments without
ocean variability.
The anomalous southwesterly flow in the afforestation
case (Fig. 3c) leads to more water vapor transport into the
East China monsoon region from the South China Sea
(Fig. 4a). This anomalous moisture flux generates greater
cloud cover fraction by 0.024 (Table 2) across the mon-
soon region. Moreover, the local increase in moisture
Simulated impacts of afforestation in East China monsoon region
123
produces a greenhouse effect, trapping in more longwave
radiation and contributing to the warming (0.23 �C)
(Table 2), over the East China monsoon region. Hence, this
complex mechanism, which includes the WES positive
feedback and greenhouse effect, is the key reason for the
winter warming over the East China monsoon region
(Fig. 5).
3.3 Impact of afforestation in fixed ocean experiments
The results presented in Sect. 3.2 suggest that remote air–
sea interaction plays a vital role in the climatic response to
afforestation in the East China monsoon region. In
response to afforestation, the surface air temperature sig-
nificantly increases by 0.25 �C in winter (Fig. 7a) and
decreases by 0.26 �C in summer in the fixed ocean
experiments (Table 3). In summer, the largest change in
the surface energy budget is in the total latent heat flux,
which increases by 3.00 W/m2. The summer cooling can be
explained by the evapotranspiration (ET) mechanism, as in
the fully coupled afforestation experiment.
The warming mechanism in winter in the fixed SST
afforestation experiments is different from the fully coupled
afforestation experiments (Fig. 6). Comparing the energy
budget terms (Fig. 1), in contrast to the coupled runs, the
change in net shortwave radiation in the fixed ocean
afforestation experiment is larger than all other components
of the energy budget. In HIGH_CPL-LOW_CPL, the net
shortwave radiation slightly decreases by -0.23 W/m2;
however, it increases significantly by 3.94 W/m2 in
HIGH_FIX-LOW_FIX. The increase in net shortwave
radiation with afforestation is mainly due to a reduced
surface albedo (-0.027), in HIGH_FIX-LOW_FIX. Com-
pared to the fully coupled experiment, the local albedo
mechanism dominates the winter air temperature response
to afforestation in the fixed ocean afforestation experiments.
The resulting surface wind speed changes over the nearby
ocean, attributed to afforestation, are smaller in the fixed
Fig. 1 Differences in surface energy budget components, both
seasonally and annually, over the East China monsoon region,
including a net shortwave radiation, b net longwave radiation, c total
sensible heat fluxes, d total latent heat fluxes, and e soil heat flux
(W/m2). Red and blue lines indicate the effects of afforestation in the
fully coupled experiments (HIGH_CPL-LOW_CPL) and the fixed
ocean experiments (HIGH_FIX-LOW_FIX), respectively. Black dotsindicate statistically significant changes (p \ 0.1)
D. Ma et al.
123
ocean experiment (HIGH_CPL-LOW_CPL). This can be
explained by the absence of air-sea energy exchange in the
fixed ocean runs, which can drive the WES mechanism and
induce changes in wind speed in the coupled model.
3.4 Hydrologic response in the two afforestation
experiments
The response in the hydrologic cycle in the fully coupled
afforestation experiment is greater than in the fixed ocean
afforestation experiment. In the East China monsoon
region, precipitation does not significantly change in the
fixed ocean afforestation experiment (Fig. 8a); however, it
significantly increases in the fully coupled afforestation
experiment during both summer and winter (Fig. 8a). In
the fully coupled afforestation experiment, precipitation
increases annually by 0.20 mm/day, with the greatest
increase of 0.31 mm/day in summer. During winter, the
precipitation increases by 0.21 mm/day (Table 2). In the
fixed ocean afforestation experiment, precipitation does not
significantly change. Just slightly increases by 0.01 mm/
day in summer and winter (Table 3).
The change in annual precipitable water in the fully
coupled afforestation experiment is also larger than that in
the fixed ocean afforestation experiment. In the fully cou-
pled afforestation experiment, precipitable water across
East China increases during winter, pre-monsoon, and
monsoon onset (Fig. 8b). Compared to the fully coupled
afforestation experiment, the year-round response in pre-
cipitable water is much weaker in the fixed ocean affor-
estation experiment (Fig. 8b).
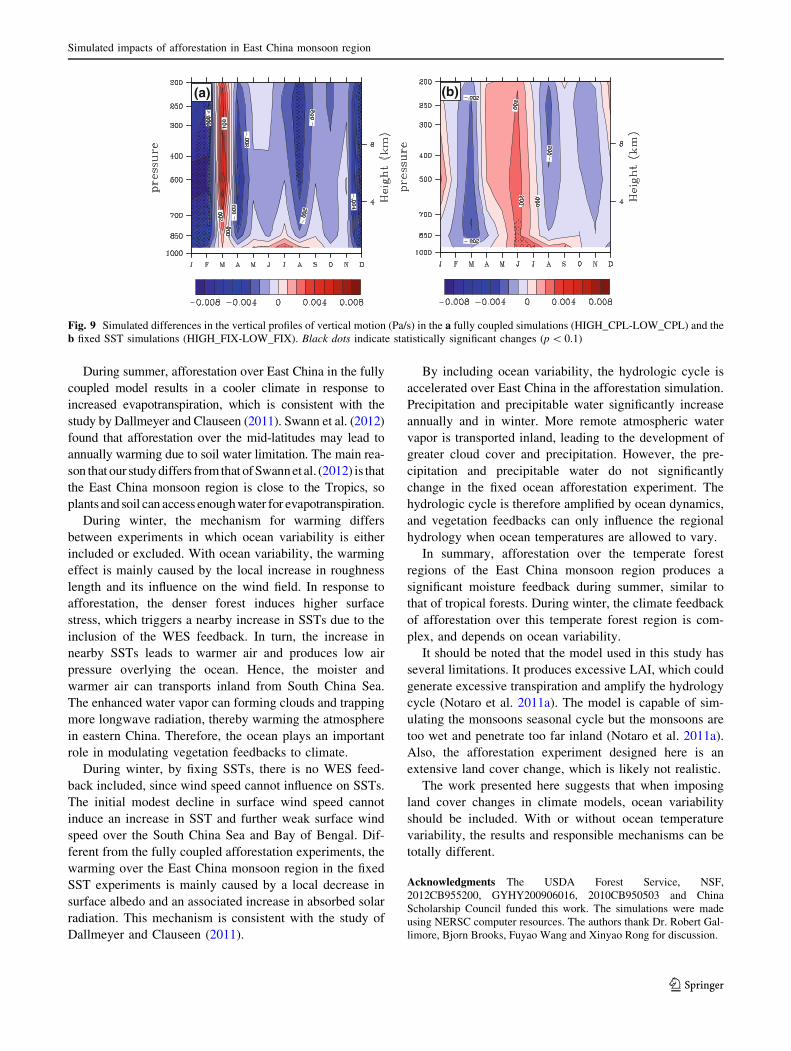
The anomalous vertical motion profile differs between
the fully coupled afforestation experiment and fixed ocean
afforestation experiment. During winter, there is anoma-
lous ascent from 1,000 hPa to 200 hPa in the fully coupled
runs over the East China monsoon region (Fig. 9a). This
anomalous ascent, combined with more precipitable water,
supports greater cloud formation and enhanced precipita-
tion in winter. In contrast, there is no significant change in
vertical motion in the fixed ocean experiment during winter
(Fig. 9b). Thus, in the fully coupled afforestation experi-
ment, the added water vapor, which is anomalously trans-
ported into the East China monsoon region, helps support
ascent and latent heat release in the afforested region.
Moreover, in the fully coupled experiment, PME
(precipitation minus evapotranspiration) increases 0.17
and 0.06 mm/day in summer and winter, respectively
(Table 2). The increase in ET accounts for 45 and 29 % of
the increase in total precipitation in summer and winter,
respectively (Table 2). It indicates that water vapor from
remote region is the key reason for the increased winter
precipitation over East China monsoon region. In summer,
the increase in LAI with afforestation induces more
evapotranspiration and additional water vapor is supplied
from remote regions, both of which lead to greater
precipitation.
(a) (b)
(c) (d)
Fig. 2 Simulated surface air
temperature (�C) change due to
East China afforestation
(HIGH_CPL-LOW_CPL) in
a JJA and b DJF. Simulated
precipitation (mm/day) change
(HIGH_CPL-LOW_CPL), c in
JJA d in DJF. Color shading is
only shown for statistically
significant changes (p \ 0.1).
The rectangle indicates the
afforested region
Simulated impacts of afforestation in East China monsoon region
123
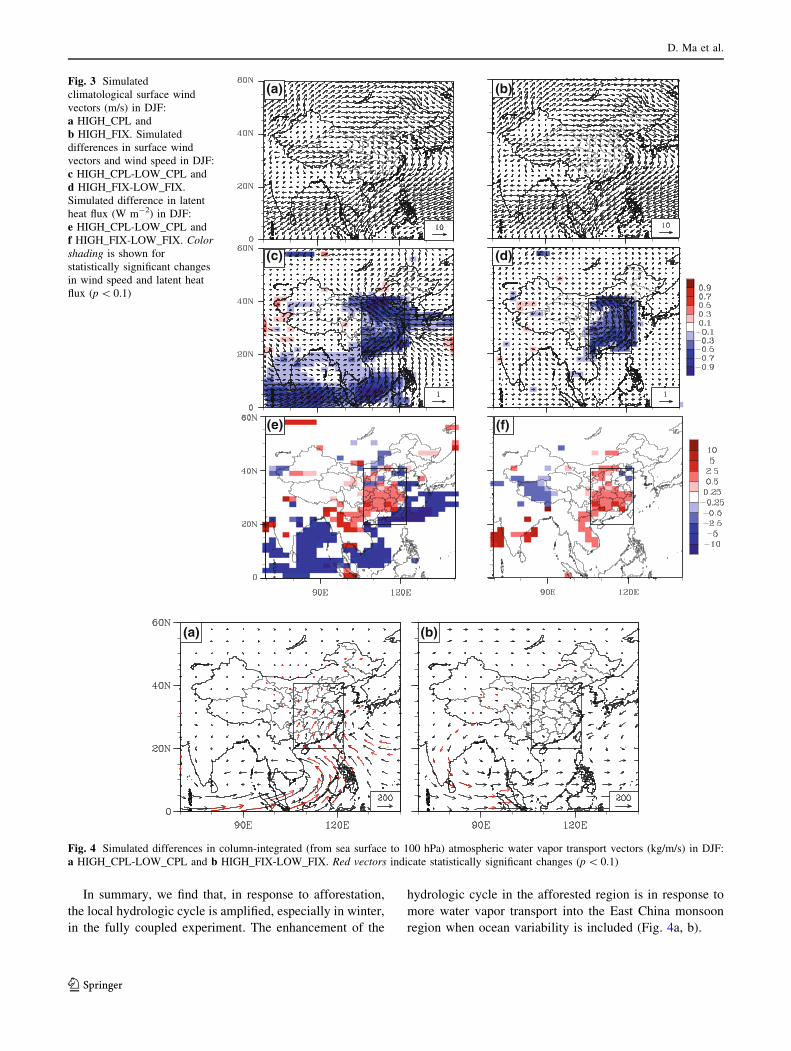
In summary, we find that, in response to afforestation,
the local hydrologic cycle is amplified, especially in winter,
in the fully coupled experiment. The enhancement of the
hydrologic cycle in the afforested region is in response to
more water vapor transport into the East China monsoon
region when ocean variability is included (Fig. 4a, b).
(a) (b)
(c) (d)
(e) (f)
Fig. 3 Simulated
climatological surface wind
vectors (m/s) in DJF:
a HIGH_CPL and
b HIGH_FIX. Simulated
differences in surface wind
vectors and wind speed in DJF:
c HIGH_CPL-LOW_CPL and
d HIGH_FIX-LOW_FIX.
Simulated difference in latent
heat flux (W m-2) in DJF:
e HIGH_CPL-LOW_CPL and
f HIGH_FIX-LOW_FIX. Colorshading is shown for
statistically significant changes
in wind speed and latent heat
flux (p \ 0.1)
(a) (b)
Fig. 4 Simulated differences in column-integrated (from sea surface to 100 hPa) atmospheric water vapor transport vectors (kg/m/s) in DJF:
a HIGH_CPL-LOW_CPL and b HIGH_FIX-LOW_FIX. Red vectors indicate statistically significant changes (p \ 0.1)
D. Ma et al.
123
Afforestation
Roughness
ET
Surface wind speed (locally) Surface wind speed
Atmospheric moisture
Cloud cover
Precipitation Temperature
Latent Heat SST
Sea level pressure
Anomalous wind (opposite to
prevailing wind)
Surface wind speed
further decline
Greenhouse effect
WES positive feedback
Ascending motion
More moisture is Transported into the East China monsoon region
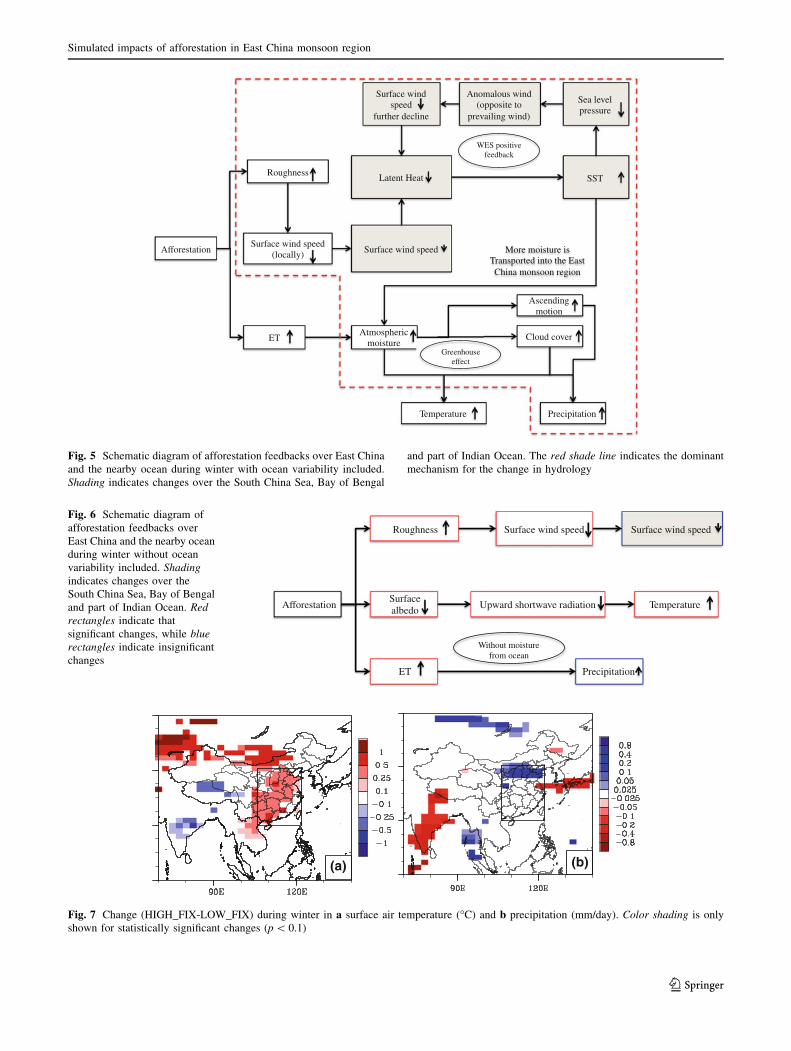
Fig. 5 Schematic diagram of afforestation feedbacks over East China
and the nearby ocean during winter with ocean variability included.
Shading indicates changes over the South China Sea, Bay of Bengal
and part of Indian Ocean. The red shade line indicates the dominant
mechanism for the change in hydrology
Afforestation
Roughness
Surface albedo
Surface wind speed
Upward shortwave radiation Temperature
Surface wind speed
ET Precipitation
Without moisture from ocean
Fig. 6 Schematic diagram of
afforestation feedbacks over
East China and the nearby ocean
during winter without ocean
variability included. Shadingindicates changes over the
South China Sea, Bay of Bengal
and part of Indian Ocean. Redrectangles indicate that
significant changes, while bluerectangles indicate insignificant
changes
(a) (b)
Fig. 7 Change (HIGH_FIX-LOW_FIX) during winter in a surface air temperature (�C) and b precipitation (mm/day). Color shading is only
shown for statistically significant changes (p \ 0.1)
Simulated impacts of afforestation in East China monsoon region
123
4 Discussion and conclusions
In order to study the potential impacts of afforestation on
climate in the East China monsoon region, and to
furthermore investigate the role of ocean variability in
modulating the climatic response to afforestation, two sets
of experiments are conducted: fully coupled afforestation
simulations and fixed ocean afforestation simulations.
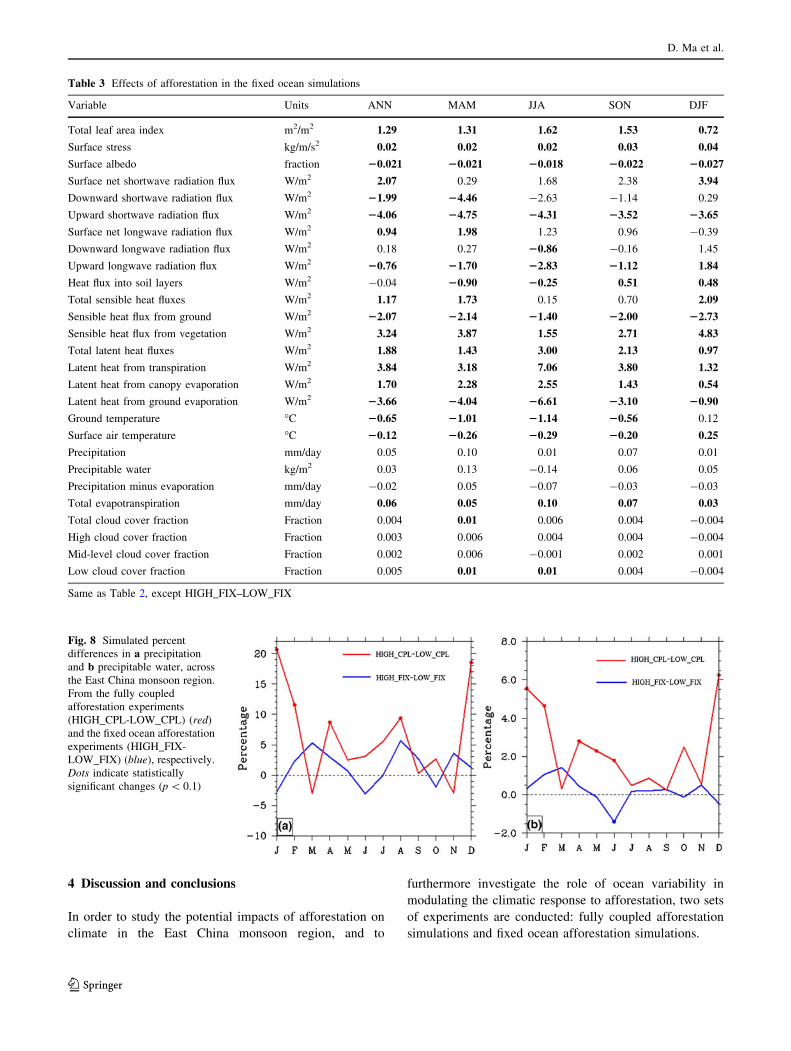
Table 3 Effects of afforestation in the fixed ocean simulations
Variable Units ANN MAM JJA SON DJF
Total leaf area index m2/m2 1.29 1.31 1.62 1.53 0.72
Surface stress kg/m/s2 0.02 0.02 0.02 0.03 0.04
Surface albedo fraction 20.021 20.021 20.018 20.022 20.027
Surface net shortwave radiation flux W/m2 2.07 0.29 1.68 2.38 3.94
Downward shortwave radiation flux W/m2 21.99 24.46 -2.63 -1.14 0.29
Upward shortwave radiation flux W/m2 24.06 24.75 24.31 23.52 23.65
Surface net longwave radiation flux W/m2 0.94 1.98 1.23 0.96 -0.39
Downward longwave radiation flux W/m2 0.18 0.27 20.86 -0.16 1.45
Upward longwave radiation flux W/m2 20.76 21.70 22.83 21.12 1.84
Heat flux into soil layers W/m2 -0.04 20.90 20.25 0.51 0.48
Total sensible heat fluxes W/m2 1.17 1.73 0.15 0.70 2.09
Sensible heat flux from ground W/m2 22.07 22.14 21.40 22.00 22.73
Sensible heat flux from vegetation W/m2 3.24 3.87 1.55 2.71 4.83
Total latent heat fluxes W/m2 1.88 1.43 3.00 2.13 0.97
Latent heat from transpiration W/m2 3.84 3.18 7.06 3.80 1.32
Latent heat from canopy evaporation W/m2 1.70 2.28 2.55 1.43 0.54
Latent heat from ground evaporation W/m2 23.66 24.04 26.61 23.10 20.90
Ground temperature �C 20.65 21.01 21.14 20.56 0.12
Surface air temperature �C 20.12 20.26 20.29 20.20 0.25
Precipitation mm/day 0.05 0.10 0.01 0.07 0.01
Precipitable water kg/m2 0.03 0.13 -0.14 0.06 0.05
Precipitation minus evaporation mm/day -0.02 0.05 -0.07 -0.03 -0.03
Total evapotranspiration mm/day 0.06 0.05 0.10 0.07 0.03
Total cloud cover fraction Fraction 0.004 0.01 0.006 0.004 -0.004
High cloud cover fraction Fraction 0.003 0.006 0.004 0.004 -0.004
Mid-level cloud cover fraction Fraction 0.002 0.006 -0.001 0.002 0.001
Low cloud cover fraction Fraction 0.005 0.01 0.01 0.004 -0.004
Same as Table 2, except HIGH_FIX–LOW_FIX
Fig. 8 Simulated percent
differences in a precipitation
and b precipitable water, across
the East China monsoon region.
From the fully coupled
afforestation experiments
(HIGH_CPL-LOW_CPL) (red)
and the fixed ocean afforestation
experiments (HIGH_FIX-
LOW_FIX) (blue), respectively.
Dots indicate statistically
significant changes (p \ 0.1)
D. Ma et al.
123
During summer, afforestation over East China in the fully
coupled model results in a cooler climate in response to
increased evapotranspiration, which is consistent with the
study by Dallmeyer and Clauseen (2011). Swann et al. (2012)
found that afforestation over the mid-latitudes may lead to
annually warming due to soil water limitation. The main rea-
son that our study differs from that of Swann et al. (2012) is that
the East China monsoon region is close to the Tropics, so
plants and soil can access enough water for evapotranspiration.
During winter, the mechanism for warming differs
between experiments in which ocean variability is either
included or excluded. With ocean variability, the warming
effect is mainly caused by the local increase in roughness
length and its influence on the wind field. In response to
afforestation, the denser forest induces higher surface
stress, which triggers a nearby increase in SSTs due to the
inclusion of the WES feedback. In turn, the increase in
nearby SSTs leads to warmer air and produces low air
pressure overlying the ocean. Hence, the moister and
warmer air can transports inland from South China Sea.
The enhanced water vapor can forming clouds and trapping
more longwave radiation, thereby warming the atmosphere
in eastern China. Therefore, the ocean plays an important
role in modulating vegetation feedbacks to climate.
During winter, by fixing SSTs, there is no WES feed-
back included, since wind speed cannot influence on SSTs.
The initial modest decline in surface wind speed cannot
induce an increase in SST and further weak surface wind
speed over the South China Sea and Bay of Bengal. Dif-
ferent from the fully coupled afforestation experiments, the
warming over the East China monsoon region in the fixed
SST experiments is mainly caused by a local decrease in
surface albedo and an associated increase in absorbed solar
radiation. This mechanism is consistent with the study of
Dallmeyer and Clauseen (2011).
By including ocean variability, the hydrologic cycle is
accelerated over East China in the afforestation simulation.
Precipitation and precipitable water significantly increase
annually and in winter. More remote atmospheric water
vapor is transported inland, leading to the development of
greater cloud cover and precipitation. However, the pre-
cipitation and precipitable water do not significantly
change in the fixed ocean afforestation experiment. The
hydrologic cycle is therefore amplified by ocean dynamics,
and vegetation feedbacks can only influence the regional
hydrology when ocean temperatures are allowed to vary.
In summary, afforestation over the temperate forest
regions of the East China monsoon region produces a
significant moisture feedback during summer, similar to
that of tropical forests. During winter, the climate feedback
of afforestation over this temperate forest region is com-
plex, and depends on ocean variability.
It should be noted that the model used in this study has
several limitations. It produces excessive LAI, which could
generate excessive transpiration and amplify the hydrology
cycle (Notaro et al. 2011a). The model is capable of sim-
ulating the monsoons seasonal cycle but the monsoons are
too wet and penetrate too far inland (Notaro et al. 2011a).
Also, the afforestation experiment designed here is an
extensive land cover change, which is likely not realistic.
The work presented here suggests that when imposing
land cover changes in climate models, ocean variability
should be included. With or without ocean temperature
variability, the results and responsible mechanisms can be
totally different.
Acknowledgments The USDA Forest Service, NSF,
2012CB955200, GYHY200906016, 2010CB950503 and China
Scholarship Council funded this work. The simulations were made
using NERSC computer resources. The authors thank Dr. Robert Gal-
limore, Bjorn Brooks, Fuyao Wang and Xinyao Rong for discussion.
(a) (b)
Fig. 9 Simulated differences in the vertical profiles of vertical motion (Pa/s) in the a fully coupled simulations (HIGH_CPL-LOW_CPL) and the
b fixed SST simulations (HIGH_FIX-LOW_FIX). Black dots indicate statistically significant changes (p \ 0.1)
Simulated impacts of afforestation in East China monsoon region
123
References
Betts RA (2000) Offset of the potential carbon sink from boreal
forestation by decreases in surface albedo. Nature 408:187–190
Bonan GB (2008) Forests and climate change: forcings, feedbacks,
and the climate benefits of forests. Science 320:1444–1449
Bonan GB, Pollard D, Thompson SL (1992) Effects of boreal forest
vegetation on global climate. Nature 359:716–718
Charney JG (1975) Dynamics of deserts and drought in the Sahel. Q J
R Meteor Soc 101:193–202
Chen G, Notaro M, Liu Z, Liu Y (2012) Simulated local and remote
biophysical effects of afforestation over Southeast United States
in boreal summer. J Clim (in press). doi:10.1175/JCLI-D-11-
00317.1
Collins WD et al (2006) The community climate system model version
3 (CCSM3). J Clim 19:2122–2143. doi:10.1175/JCLI3761.1
Dallmeyer A, Clauseen M (2011) The influence of land cover change
in the Asian monsoon region on present-day and mid-Holocene
climate. Biogeosciences 8:1499–1519
Dallmeyer A, Claussen M, Otto J (2010) Contribution of oceanic and
vegetation feedbacks to Holocene climate change in monsoonal
Asia. Clim Past 6:195–218. doi:10.5194/cp-6-195-2010
FAO (2005) Global forest resources assessment 2005. Rome
Foley JA (1994) The sensitivity of the terrestrial biosphere to climate-
change—a simulation of the middle Holocene. Global Biogeo-
chem Cycles 8:505–525
Gallimore RG, Kutzbach JE (1996) Role of orbitally induced changes
in tundra area in the onset of glaciation. Nature 381:503–505
Gallimore R, Jacob R, Kutzbach J (2005) Coupled atmosphere-ocean-
vegetation simulations for modern and mid-Holocene climates:
role of extratropical vegetation cover feedbacks. Clim Dyn
25:755–776
Gent PR, Yeager SG, Neale RB, Levis S, Bailey DA (2010)
Improvements in a half degree atmosphere/land version of the
CCSM. Clim Dyn 34:819–833. doi:10.1007/s00382-009-0614-8
Henderson-Sellers A, Dickinson RE, Durbidge TB, Kennedy PJ,
Mcguffie K, Pitman AJ (1993) Tropical deforestation: modeling
local- to regional-scale climate change. J Geophys Res
98(D4):7289–7315. doi:10.1029/92JD02830
Kanae S, Oki T, Musiake K (2001) Impact of deforestation on
regional precipitation over the Indochina peninsula. J Hydrome-
teor 2:51–70
Lawrence DM, Thornton PE, Oleson KW, Bonan GB (2007) The
partitioning of evapotranspiration into transpiration, soil evap-
oration, and canopy evaporation in a GCM: impacts on land–
atmosphere interaction. J Hydrometeorol 8:862–880
Lei JF (2005) Forest resources of China. China Forestry Publishing
House, Beijing
Levis S, Bonan GB, Bonfils C (2004) Soil feedback drives the mid-
Holocene North African monsoon northward in fully coupled
CCSM2 simulations with a dynamic vegetation model. Clim
Dyn 23:791–802
Liu YQ, Stanturf J, Lu HQ (2008) Modeling the potential of the
northern China forest shelterbelt in improving hydroclimate
conditions. J Am Water Res Assoc 44:1–17. doi:10.1111/j.1752-
1688.2008.20240.x
Meehl GA (1994) Coupled land–ocean–atmosphere processes and
South Asian monsoon variability. Science 266:263–267
Notaro M, Gutzler D (2011) Simulated impact of vegetation on
climate across the North American monsoon region in
CCSM3.5. Clim Dyn. doi:10.1007/s00382-010-0990-0
Notaro M, Liu Z (2008) Statistical and dynamical assessment of
vegetation feedbacks on climate over the boreal forests. Clim
Dyn 31:691–712
Notaro M, Chen GS, Liu Z (2011a) Vegetation feedbacks to climate
in the global monsoon regions. J Clim. doi:10.1175/2011JCLI
4237.1
Notaro M, Wyrwoll KH, Chen GS (2011b) Did aboriginal vegetation
burning impact on the Australian summer monsoon? Geophys
Res Lett 38:L11704. doi:10.1029/2011GL047774
Oleson KW et al (2008) Improvements to the Community Land
Model and their impact on the hydrological cycle. J Geophys Res
113:G01021. doi:10.1029/2007JG000563
Pielke RA, Avissar R, Raupach M, Dolman AJ, Zeng X, Denning AS
(1998) Interactions between the atmosphere and terrestrial
ecosystems: influence on weather and climate. Global Chang
Biol 4:461–475
Ramankutty N, Foley J (1999) Estimating historical changes in global
land cover: croplands from 1700 to 1992. Global Biogeochem
Cycles 13:997–1028
Sen OL, Wang Y, Wang B (2004) Impact of Indochina deforestation
on the East-Asian summer monsoon. J Clim 17:1366–1380
Shukla J, Mintz Y (1982) Influence of land-surface evaporation on
Earth’s climate. Science 215:1498–1501
Sud YC, Shukla J, Mintz Y (1988) Influence of land-surface
roughness on atmospheric circulation and precipitation: a
sensitivity study with a general circulation model. J Appl Meteor
27:1036–1054
Swann ALS, Fung IY, Chiang JCH (2012) Mid-latitude afforestation
shifts general circulation and tropical precipitation. Proc Natl
Acad Sci 109:712–716
Werth D, Avissar R (2002) The local and global effects of Amazonian
deforestation. J Geophys Res 107:8087. doi:10.1029/2001JD
000717
Xie SP, Philander SGH (1994) A coupled ocean-atmosphere model
of relevance to the ITCZ in the eastern Pacific. Tellus A
46:340–350
Xue Y (1996) The impact of desertification in the Mongolian and the
Inner Mongolian grassland on the regional climate. J Clim
9:2173–2189
Xue Y, Shukla J (1996) The influence of land surface properties on
Sahel climate, part II, Afforestation. J Clim 9:3260–3275
Xue Y, Juang HMH, Li WP, Prince S, DeFries R, Jiao Y, Vasic R
(2004) Role of land surface processes in monsoon development:
East Asia and West Africa. J Geophys Res 109:D03105. doi:
10.1029/2003JD003556
Yang XH, Wang XP, Li NY (2010) Combating climate change: what
will China’s industry do? R Swed Acad Sci 39:340–343
Yasunari T (2007) Role of land atmosphere interaction on Asian
monsoon climate. J Meteorol Soc Jpn 85:55–75
D. Ma et al.
123