simulated effect of soil depth and bedrock topography … lanni et... · topography on near-surface...
TRANSCRIPT

EARTH SURFACE PROCESSES AND LANDFORMSEarth Surf. Process. Landforms 38, 146–159 (2013)Copyright © 2012 John Wiley & Sons, Ltd.Published online 28 May 2012 in Wiley Online Library(wileyonlinelibrary.com) DOI: 10.1002/esp.3267
Simulated effect of soil depth and bedrocktopography on near-surface hydrologic responseand slope stabilityCristiano Lanni,1,2* Jeff McDonnell,2 Luisa Hopp2 and Riccardo Rigon11 University of Trento, Environmental and Civil Engineering, Trento, Italy2 Oregon State University, Forestry Engineering, Corvallis, Oregon, USA
Received 14 June 2011; Revised 12 April 2012; Accepted 24 April 2012
*Correspondence to: C. Lanni, University of Trento, Environmental and Civil Engineering, Trento, Italy. E–mail: [email protected]
ABSTRACT: This paper explores the effect of hillslope hydrological behavior on slope stability in the context of transient subsurfacesaturation development and landslide triggering. We perform a series of virtual experiments to address how subsurface topographyaffects the location and spatial pattern of slip surface development and pore pressure dynamics. We use a 3D Darcy–Richardsequation solver (Hydrus 3-D) combined with a cellular automata slope stability model to simulate the spatial propagation of thedestabilized area. Our results showed that the soil–bedrock interface and in particular, bedrock depressions, played a key role inpore pressure dynamics, acting as an impedance for the downslope drainage of perched water. Filling and spilling of depressionsin the bedrock surface microtopography induced localized zones of increased pressure head such that the development of pore-pressure fields—not predictable by surface topography—lead to rapid landslide propagation. Our work suggests that landslidemodels should consider the subsurface topography in order to include a connectivity component in the mathematical descriptionof hydrological processes operating at the hillslope scale. Copyright © 2012 John Wiley & Sons, Ltd.
KEYWORDS: shallow landslide triggering; subsurface hydrological connectivity; bedrock topography; cellular automata models; landslide modelling
Introduction
Shallow landslides and their translation into rapidly movingdebris flows (Iverson et al., 1997) are recognized as one ofthe major natural hazards for human life and activity(Olshansky, 1990; Schuster, 1995; Glade, 1998). Nevertheless,they are exceptionally difficult to predict with current models.The hydrological controls on soil mechanical behavior havebeen known for some time (Terzaghi, 1943). Shallow landslidesare often induced by rainfall infiltration in a soil mantle overly-ing a less permeable bedrock. Rainfall infiltration reduces thesoil shear strength by decreasing the positive effect of negativepore pressure on stability (Bishop, 1959; Campos et al., 1994;Godt et al., 2009) or by increasing the positive pore pressurevalues (Terzaghi, 1943). The failure surfaces may form withinthe weathered material (Lu and Godt, 2008; Hawke andMcConchie, 2009), but often correspond to the point of contactbetween the soil and the less permeable bedrock, where atemporary perched water table may develop (Dietrich et al.,2007; Baum et al., 2010).While hydrological models have been coupled with the
infinite slope stability model (Montgomery and Dietrich,1994; Wu and Sidle, 1995; Pack et al., 1998; Borga et al.,2002; Casadei et al., 2003; Savage et al., 2004; Baum et al.,2008; Simoni et al., 2008; Arnone et al., 2011), almost all suchmodels assume that the soil–bedrock interface is a simpletopographic surface paralleling the soil surface. As a result,
none of the slope stability models have yet included an importantnew conceptual element derived from the hillslope hydrologyliterature: the filling and spilling of water perched at the soil–bedrock interface. Indeed the importance of moisture dynamicsat the soil–bedrock interface has been widely acknowledged inhillslope hydrology (Weiler et al., 2006). Recent hydrologicalanalyses by several groups in several different hydrogeologicalsettings (Spence and Woo, 2003; Buttle et al., 2004; Tromp-vanMeerveld and McDonnell, 2006b, Graham et al., 2010; Spence,2010) have shown that filling and spilling of microtopographicdepressions in the bedrock topographic surface control the devel-opment and connectivity of patches of positive pore pressure. Forthe hillslope hydrologist, these patches and their downslopeconnectivity, form the precondition for resultant subsurfacestormflow (Tromp-van Meerveld and McDonnell, 2006a). Thisbehavior is now viewed as the dominant subsurface stormflowdelivery mechanism whereby the existence of a thresholdrelationship between rainfall amount and hillslope outflowappears to be a common property of hillslope drainage(see review inWeiler et al., 2006). For the slope stability modeler,these patches appear to be a key, unstudied part of the landslideinitiation process with potential first-order hydrologic control onwhere a slip surface might be found.
Certainly, other sources of heterogeneity – related to soilcohesion, soil friction angle, soil permeability, root cohesion,and rainfall – may affect the location of shallow landslideevents (Duan and Grant, 2000; Schmidt et al., 2001; Minder

147THE ROLE OF BEDROCK TOPOGRAPHY ON SLOPE STABILITY
et al., 2009 ). However, in this paper we focus solely on the roleplayed by soil depth and bedrock topography, an aspect thathas so far received very little attention in the context ofhillslope stability, although it has been shown that failure locationand size are largely controlled by the spatial structure of soildepth (Dietrich et al., 2007).Sowhat dowe know about fill and spill behavior? Recentmodel
analysis by Hopp andMcDonnell (2009) showed that the balanceof filling and spilling on a given hillslope was primarily slope angledependent. For shallow slopes, filling dominated spilling, wherebysubsurface depressions acted to retain water ponded at the soil–bedrock interface. For steeper slopes, this ratio of upslope to down-slope control shifted such that steep slopes were dominated byspilling, with much less filling. In terms of topographic representa-tion of these processes, upslope accumulated area was thebest proxy for filling, whereas downslope drainage efficiency(as defined by the downslope index of Hjerdt et al., 2004) wasthe best proxy for spilling. In the slope stability context, the keyfeature of the fill and spill concept is not whole-slope subsurfacestormflow activation, but rapidly connecting patches of isolatedsubsurface saturation (i.e. sub-meter scale pockets of positive porepressure in microtopographic depressions at the soil bedrockinterface) that grow to produce patches of saturation at scalesrelevant to rapid shear strength reduction (on the order of meterssquared to several meters squared).Here we explore for the first time, the effect of fill and spill
development on slope stability in the context of subsurfacepatch saturation development and landslide triggering. Ouroverarching goal is to answer the question: how does bedrocktopography influence the dynamics of pore pressure develop-ment and resulting triggering of shallow landslides?We follow the approach of Weiler and McDonnell (2004) and
present a number of virtual experiments where we explore theinfluence of the bedrock topography on the overlying porepressure profile. We use the well known Panola hillslope hydro-logical research site (Freer et al., 2002) as a virtual laboratory toexplore how soil depth, slope inclination and other factorsconspire to trigger shallow landslides. We then address a numberof sub-questions using our virtual experiment approach:
(1) How does the subsurface topography affect the locationand spatial pattern of slip surface development?
(2) How does local and slope-averaged slope angle influencemaximum pore pressure and temporal and spatial exten-sion of transient saturation at the soil bedrock interface?
(3) How does rainfall amount and intensity affect developmentof positive pore pressure at the soil–bedrock interface ofsteep hillslopes?
(4) How does bedrock topography influence the size andshape of the triggered area?
We build upon the work of Hopp andMcDonnell (2009) wherewe use the 3D Richards equation solver, Hydrus 3-D (Simuneket al., 2006), to quantify patterns of pore pressure developmentand 3D flow in porous media. We link this to a slope stabilitymodel that builds upon amodified version of the cellular automatamodel (CA) presented in Piegari et al. (2009). Our CA modelsimulates the spatial propagation of the destabilized area providingan estimation of the hillslope area on the verge of collapse.
The Panola trench hillslope
We use the Panola hillslope as a shell for our virtual experiments.The Panola experimental hillslope has a slope angle of 13�, is28m wide and 48m long and lies within the Panola MountainResearch Watershed (PMRW), located about 25 km southeast of
Copyright © 2012 John Wiley & Sons, Ltd.
Atlanta, Georgia, USA, in the southern Piedmont. The site isdescribed in detail by Tromp-van Meerveld and McDonnell(2006a, 2006b) andwe refer the reader to those papers for furtherdetails. The downslope boundary of the Panola hillslope isformed by a 20m wide trench. The upper boundary of the studyhillslope is formed by a small bedrock outcrop. Soil depths on thestudy hillslope have been measured on a regular 2x2 m grid andlinearly interpolated to a 1x1 m digital elevation model. Thesurface topography of the study hillslope is largely planar whilethe bedrock topography is very irregular, resulting in highlyvariable soil depth across the study hillslope ranging from 0 to1.86mwith an average value of 0.63m (Figure 2, upper left map).
The soil on the study hillslope is a sandy loam without clearstructuring or layering, except for a 0.15m deep organic-richsoil horizon. The soil is classified as the coarse, loamy, mixedthermic Typic Dystrochrepts from the Ashlar series. There areno observable differences in soil type across the study hillslope.The climate is humid and subtropical with a mean annual airtemperature of 16.3 �C and mean annual precipitation of1240mm, spread uniformly over the year (NOAA, 1991).Rainfall tends to be of long duration and low intensity in winter,when it is associated with the passage of fronts, and of shortduration but high intensity in summer, when it is associatedwith thunderstorms (Tromp-van Meerveld and McDonnell,2006a). Overland flow is uncommon at PMRWand is observedonly during very intense thunderstorms after extended dryperiods. Even during these storms, overland flow was restrictedto small areas and re-infiltrated within several meters.
Methods
The hydrological response model and the hillslopestability model
We used the Hydrus-3D hydrological model (Simunek et al.,2006) to compute water movement in unsaturated/saturated soiland to provide the three-dimensional pore-pressure field inputto our slope stability model. Hydrus 3-D can accommodate flowdomains with irregular geometries like that of the Panolahillslope. It solves the Richards Equation (Richards, 1931):
C cð Þ @c@t
¼ r� K cð Þr!
zþ cð Þ� �
(1)
whereC cð Þ ¼ @θ@c is the hydraulic capacity [L
-1],c [L] is thematric
suction head, t [T] is the time, K [LT-1] is the hydraulic conductivity,z [L] is the elevation above a vertical datum, r is the divergent
operator, and r! is the gradient operator.For mechanical behavior of the Panola soils, we assumed a
rigid and perfectly-plastic soil behavior. According to themodified Bishop’s criterium (1959) proposed by Lu and Likos(2006), we define the soil-shear strength t [FL-2] as:
t ¼ c’þ s� pað Þ � ss½ �� tanf’ (2)
where c ’ [FL-2] is the effective soil cohesion, s [FL-2] is the totalstress, pa [FL
-2] is the pore-air pressure, f ’ is the effective soilfrictional angle, ss is defined as the suction stress characteristiccurve of the soil with a general functional form of:
ss ¼ � pa � pwð Þ if pa � pwð Þ≤0ss ¼ f pa � pwð Þ if pa � pwð Þ > 0
(3)
where pw [FL-2] is the pore-water pressure. This criterionallowed the contribution of negative pore-water pressure(suction) on soil shear strength to be taken into account.
Earth Surf. Process. Landforms, Vol. 38, 146–159 (2013)

igure 1. Flow chart of the cellular automata model. The stress isropagated until no new unstable locations are generated. The finalS configuration gives an estimation of the most likely hillslope portionbe affected by landslide activation.
148 C. LANNI ET AL.
The suction stress characteristic curve, ss, can also beexpressed in terms of effective saturation degree or normalizedvolumetric water content following Vanapalli et al. (1996):
ss ¼ � θ cð Þ � θrθsat � θr
pa � pwð Þ ¼ �Se pa � pwð Þ (4)
where Se [�] is the relative saturation degree, θ(c) [�] is the ac-tual water content, θsat [�] is the saturated water content, and θr[�] is the residual water content.We based our slope stability estimates on the calculation of
the factor of safety FS. For hillslopes it is common to definethe safety factor as the ratio between maximum retainingforces, Fr, and driving forces, Fd:
FS ¼ FrFd
(5)
Simply put, the slope is stable for FS> 1, while slope failureoccurs when the critical state FS =1 (such that Fr= Fd) isachieved. The infinite slope stability hypothesis has beenwidely applied in many investigations of natural slope stability(Montgomery and Dietrich, 1994; Wu and Sidle, 1995; Borgaet al., 2002; Van Beek, 2002; Casadei et al., 2003; D’Odoricoet al., 2005; Lu and Godt, 2008) because of its relative simplicity,where the thickness of the soil mantle is much smaller than thelength of the slope.Assuming pa=0 in Equations (2), (3) and (4), the factor of
safety of an infinite slope model that accounts for saturated/unsaturated zones can be written as:
FS ¼ 2c’g�z sin 2bið Þ þ
tanf’tanbi
þ gwcg�z
tanbi þ cotbið Þ tanf’for c≤0
FS ¼ 2c’g�z sin 2bið Þ þ
tanf’tanbi
þ Se cð Þ gwcg�z
tanbi þ cotbið Þ tanf’for c > 0
(6)
where bi [�] is the local slope angle, �z [L] is the vertical soil-depth, and gw and g [FL-3] are the volumetric unit weight ofwater and soil, respectively.Using the unstable locations provided by the infinite slope
stability model as a starting point, we used a cellular automata(CA) model (see Bak et al., 1987; Rodriguez-Iturbe and Rinaldo,1997; Jensen, 1998 for a review) to propagate instability on ourstudy hillslope.CA is conceptually related to raster GIS because it models
the space by tessellating it into regular, discrete locations andassigning attributes to each location. An individual cell canbe viewed as a unique location within the grid. Raster GIS datacan be associated with the states of the automaton andrepresent the spatial information on which the model works.A cell’s state will change according to transition rules thatapply simultaneously to every cell in the space. These rules arebased on both the current state of the cell under study and alsothe state of its neighbors. CA models have been largely used tomodel landslide propagation for regional landslide characteriza-tions that exhibit self-organized critical states (Avolio et al., 2000;Clerici and Perego, 2000; Turcotte et al., 2002; D’Ambrosio et al.,2003; Iovine et al., 2003; Guthrie et al., 2007).We modified the slope stability CA model of Piegari et al.
(2009) for this study. Piegari et al. (2009) accounted for theeffect of the triggering factor (i.e. rainfall) on the value of factorof safety (FS) by introducing an empirical parameter n thatcontrolled the rate at which all sites were driven towardsinstability. In our modified version of their CA model, we
Copyright © 2012 John Wiley & Sons, Ltd.
accounted for rainfall effects on landslide triggering using porepressure dynamics simulated by Hydrus 3-D. We adopt ascheme in which the solid and fluid sub-problems areuncoupled and the patterns of FS are re-initialized at each timestep on the base of the FS configuration provided by the infiniteslope stability model. More specifically, when a raster-cell ibecomes unstable (i.e. FSi≤1 according to the infinite slopestability model), it affects, via a chain reaction, the stability of the
eight neighboring cells inn, by reducing their driving forces, Finnd ,
by a fraction l of the driving forces of the destabilized cell i, Fid :
FSinn ¼Finnr
F innd þ 1
8 lFid
with nn ¼ 1; . . . ; 8 (7)
where FSinn and Finnr with nn=1,. . .,8 are the safety factors and the
retaining forces of the eight neighboring cells, respectively.In Equation (7) the fraction 1
8 indicates that the destabilizing
forces Fidof the unstable cell i are redistributed equally among
the neighboring cells inn. The parameter l is a parameter thatdetermines the degree of conservation of the system. l=0 meansthat the system is completely dissipative (i.e., the destabilizedlocations do not affect the stability of the neighboring cells), whilel=1 means that the system is completely conservative (i.e., thedestabilizing forces of destabilized locations are completelytransferred to neighboring cells). We assume 0< l< 1 byconsidering a non-conservative case, since many complexdissipative phenomena can contribute to stress transfer processes(Fredlund and Rahardjo, 1993). The chain reaction continuesuntil no unstable locations are generated, according to the flowchart of Figure 1.
This simplified model was used to propagate instability andto provide an estimation of the most likely landslide initiationzones on the hillslope.
Hydrological and mechanical characterization
Hopp and McDonnell (2009) evaluated Hydrus 3-D’s abilityto represent measurements of pore-pressure recorded bytensiometers at several points in the Panola hillslope (detailedinformation on the field data can be found in Freer et al.,2002). We used the same soil water retention and hydraulicconductivity functions as Hopp and McDonnell (2009). These
FpFto
Earth Surf. Process. Landforms, Vol. 38, 146–159 (2013)

149THE ROLE OF BEDROCK TOPOGRAPHY ON SLOPE STABILITY
are described using the van-Genuchten-Mualem model(van Genuchten, 1980):
Se ¼ θ cð Þ � θrθsat � θr
¼ 1
1þ acð Þn� �1�1
n
(8)
K cð Þ ¼ Ksat S0:5e 1� 1� Se
n=n�1� �1�1
n
� �2(9)
where a [L-1] is a parameter that depends approximately on theair-entry (or air-occlusion) suction, n [�] is a parameter thatdepends on the soil pore-size distribution, Ksat [LT
-1] is thesaturated hydraulic conductivity.The soil mantle was divided into three layers to account for
the observed reduction of saturated hydraulic conductivity Ksat
in the profile. Saturated hydraulic conductivity of the bedrocksaprolite was approximated based on measured valuesreported in Tromp-van Meerveld et al. (2007). Table I showsthe hydrological parameters used in this study to characterizeboth soil and the bedrock material of the Panola hillslope. Forour virtual experiments, we set the saturated hydraulic conduc-tivity at the contact between soil and bedrock to be three ordersof magnitude less than the soil Ksat.Both the water retention function and the hydraulic conduc-
tivity function of the soil material and bedrock saprolite exhibita steep slope near zero pressure head. In particular, the soilhydraulic conductivity K(c) increases drastically near zeropressure head in a short range of suction head c (about 0.5m).We used empirical relationships (by Terzaghi et al., 1996) to
estimate the effective frictional angle (f ’=34�) and theeffective cohesion (c’=0 kPa) of the sandy loam soil of Panolahillslope. The bedrock layer was considered stable in ourexperiments because of the good mechanical characteristic ofthe saprolite rock.
Virtual experiment design
The geometrical domain of Panola hillslope was implementedin Hydrus 3-D where a finite element mesh of triangular prismswith 35600 nodes and 64638 3D-elements was generated. Onthis geometry, we conducted eight experiments that includedthree different slope angles b (13�, i.e. the original Panolahillslope inclination, 20�, and 30�) and four different rainfallevents. Each rainfall event was spatially and temporallyuniform. These events were characterized by the same cumula-tive rainfall, but different distribution in time (i.e. differentvalues of rainfall intensity and duration). Two rainfall scenarios(long-rainfall and short-rainfall in Table 2) were selected for thevirtual experiments with the lower slope angles (b=13� andb=20�). Two events (very long-rainfall, and very short-rainfall inTable 2) were also analyzed in the steepest hillslope case (b=30�).Our three hillslope inclinations (b=13�, b=20�, and b=30�)
allowed us to investigate how the overall slope angle influencesthe maximum pore-pressure values, the spatial extension and
Table I. Average soil thickness Δz�
and hydrological parameters of the sMcDonnell, 2009).
Material Δz�
(cm) θr (�) θsat (�
Soil 15 0.28 0.47510 0.28 0.4638 0.325 0.45
Bedrock - 0.30 0.45
Copyright © 2012 John Wiley & Sons, Ltd.
level of connectivity of patterns of transient saturation at thesoil–bedrock interface, and the temporal persistence of these.Despite these overall slope angle comparisons, the local slopevalues, tanbi, of the bedrock topography (i.e. at the soil–bedrockinterface) in any given pixel was highly variable and often largerthan the overall slope angle tanb. For example, bi ranged from 6�
to 57� at the steepest (b=30�) hillslope configuration. Hence,because of the soil mechanical properties of the sandy loamsoil (f ’=34� and c’=0 kPa) and according to Equation (6), somepoints would achieve instability under positive pore pressure(i.e. where tanbi< tanf’) and some others would achieve instabil-ity under negative pore pressure (i.e. where tanbi> tanf’).
Initial conditions for our virtual experiments were set toa relatively dry state (with low unsaturated hydraulic con-ductivity values) which reproduces the antecedent soil-moisture condition generally observed at the Panola hillslope(Tromp-van Meerveld et al., 2007) before a rainfall event.The initial mean soil-water content was θ=0.32 cm3cm-3, withinitial pressure head cranging from �1.0 to �0.7m linearly dis-tributed with depth. This relatively dry state ensured that: (i) nu-merical results were not affected by the unbalanced initialconditions, such that modification in pore-pressure regime wasonly due to the effect of rain infiltration; (ii) the factor of safety,FS, of the steepest hillslope configuration (b=30�) was greaterthan 1 in each point of the hillslope before of the beginning ofrainfall. For boundary conditions, we assumed an atmosphericboundary (i.e. rainfall rate) at the soil surface (i.e. upper boundaryof the numerical domain), a potential seepage face boundary atthe downslope end of the hillslope (the face was treated as aprescribed pressure head boundary with c=0, while the unsatu-rated part was treated as a no-flux boundary), a free drainageboundary at the bottom boundary of the numerical domain(by imposing a unit gradient of the total head so that the fluxwas equal to the hydraulic conductivity for any particularpressure head at given time), and a no-flux boundary at theupslope and side boundaries.
Results
The role of bedrock topography on pore pressuredevelopment and integrated hydrological response
Figure 2 shows the temporal evolution of pressure head at thesoil–bedrock interface for the base case 13�-Panola hillslopeduring the long-rainfall event (I=6.25mmh-1, D=9h inTable II). Well-connected patches of saturation developed after9 h from the onset of rainfall. The mid-slope zone was charac-terized by the main bedrock depression (the soil-depth map isshown in the upper left corner of Figure 2), and exhibited thehighest pore-pressure values (with a maximum value of0.69m). The hillslope hydrograph from the slope base is alsoshown in Figure 2 (right-hand side), where the shaded portionscorrespond to the time periods of pore pressure development.The hillslope hydrograph shows a double peak: the first at theend of the long-rainfall event (9th hour), the second 13h afterthe end of this rainfall (22nd hour). The minimum value of
oil and saprolite bedrock layers of Panola Hillslope (from Hopp and
) a (cm-1) n (�) Ksat (m s-1)
0.04 2 10-3
0.04 2 4∙10-4
0.04 2 1.8∙10-4
0.0325 2 1.7∙10-7
Earth Surf. Process. Landforms, Vol. 38, 146–159 (2013)

Figure 2. Patterns of transient saturation at the soil–bedrock interface of theoriginal 13� Panola hillslope for distinct timesteps in thehillslopehydrograph (shadedrighthand side of the figure) for several hours during the long-rainfall event. The blue zones represent the patches of transient saturation (perched water table),the yellow, grey and brown colors identify variably unsaturated soil conditions. Flow is concentrated in themid-slope, which exhibits the highest pore pressurevalues. The soil depth map is inserted in the upper lefthand corner for reference. This figure is available in colour online at wileyonlinelibrary.com/journal/espl
150 C. LANNI ET AL.
discharge between these two peaks is localized around the 18thhour (9h after the end of the event). The second peak is due tothe spilling of water from the main-bedrock depression that wasfilled during the drainage following the initial rainfall burst.
Relation between hillslope gradient and spatio-temporal extent of transient saturation at the soil–bedrock interface
Figure 3 describes the relation between hillslope gradient andspatio-temporal extent of transient saturation at the soil–bedrock interface for the long-rainfall event (I=6.25mmh-1
Table II. Hillslope angles and rainfall event features used in the virtual exp
Very short
I=20mmh-1
D=3 hOverall slope angle b 13�
20�
30� •
Copyright © 2012 John Wiley & Sons, Ltd.
and D=9h). An increase in overall slope angle b lead to ageneral decrease in the extension and connectivity of saturatedareas and their temporal persistence at the soil–bedrockinterface. This finding is consistent with Hopp and McDonnell(2009). Despite the slope angle influence, the maximum valueof pressure head (0.69m) was not affected by the slope inclina-tion. During the first stage of rainfall (at approximately 4–5 h),pore pressure maps at the soil bedrock interface of 13�, 20�
and 30� slope angles showed similar patterns (first and secondcolumns in Figure 3). The maps of pore pressure resemble themap of soil depth (shown in the upper left corner of Figure 2)with areas characterized by the thinnest soils responding firstto the precipitation input.
eriments. I= rainfall intensity; D= rainfall duration.
Rainfall event
Short Long Very long
I=12mmh-1 I=6.25mmh-1 I=5mmh-1
D=5h D=9h D=12h• •
• •
• • •
Earth Surf. Process. Landforms, Vol. 38, 146–159 (2013)
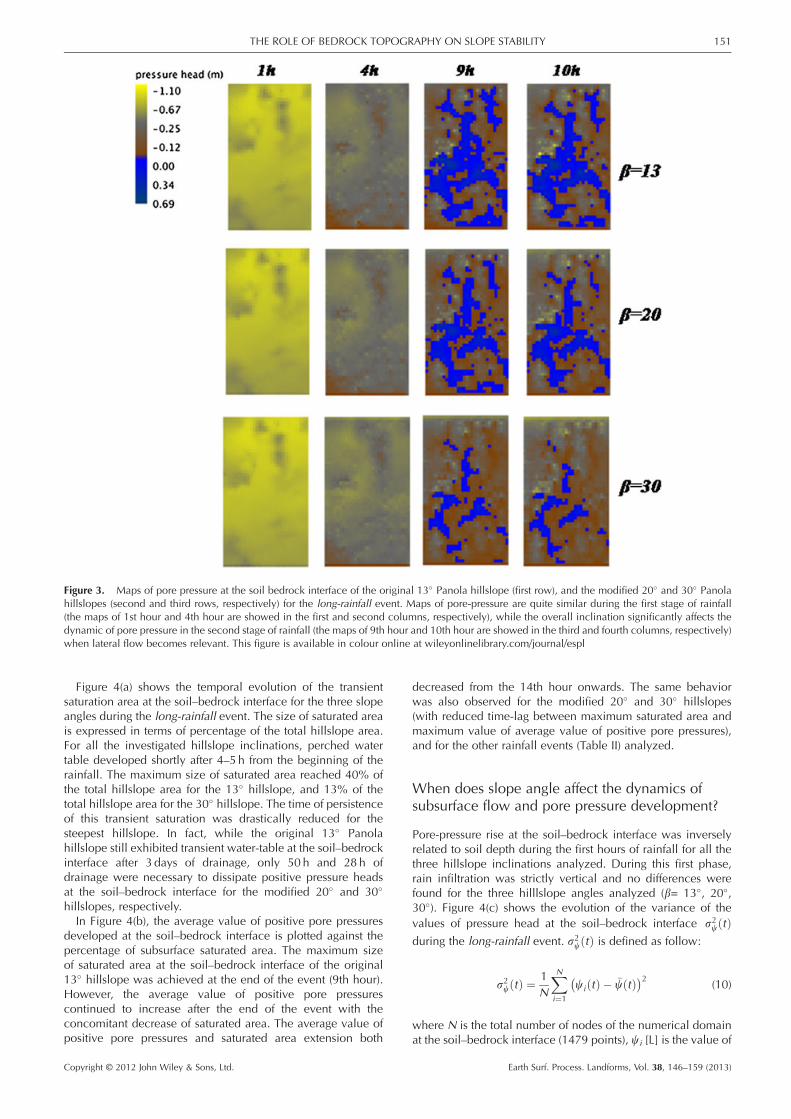
Figure 3. Maps of pore pressure at the soil bedrock interface of the original 13� Panola hillslope (first row), and the modified 20� and 30� Panolahillslopes (second and third rows, respectively) for the long-rainfall event. Maps of pore-pressure are quite similar during the first stage of rainfall(the maps of 1st hour and 4th hour are showed in the first and second columns, respectively), while the overall inclination significantly affects thedynamic of pore pressure in the second stage of rainfall (the maps of 9th hour and 10th hour are showed in the third and fourth columns, respectively)when lateral flow becomes relevant. This figure is available in colour online at wileyonlinelibrary.com/journal/espl
151THE ROLE OF BEDROCK TOPOGRAPHY ON SLOPE STABILITY
Figure 4(a) shows the temporal evolution of the transientsaturation area at the soil–bedrock interface for the three slopeangles during the long-rainfall event. The size of saturated areais expressed in terms of percentage of the total hillslope area.For all the investigated hillslope inclinations, perched watertable developed shortly after 4–5 h from the beginning of therainfall. The maximum size of saturated area reached 40% ofthe total hillslope area for the 13� hillslope, and 13% of thetotal hillslope area for the 30� hillslope. The time of persistenceof this transient saturation was drastically reduced for thesteepest hillslope. In fact, while the original 13� Panolahillslope still exhibited transient water-table at the soil–bedrockinterface after 3 days of drainage, only 50 h and 28 h ofdrainage were necessary to dissipate positive pressure headsat the soil–bedrock interface for the modified 20� and 30�
hillslopes, respectively.In Figure 4(b), the average value of positive pore pressures
developed at the soil–bedrock interface is plotted against thepercentage of subsurface saturated area. The maximum sizeof saturated area at the soil–bedrock interface of the original13� hillslope was achieved at the end of the event (9th hour).However, the average value of positive pore pressurescontinued to increase after the end of the event with theconcomitant decrease of saturated area. The average value ofpositive pore pressures and saturated area extension both
Copyright © 2012 John Wiley & Sons, Ltd.
decreased from the 14th hour onwards. The same behaviorwas also observed for the modified 20� and 30� hillslopes(with reduced time-lag between maximum saturated area andmaximum value of average value of positive pore pressures),and for the other rainfall events (Table II) analyzed.
When does slope angle affect the dynamics ofsubsurface flow and pore pressure development?
Pore-pressure rise at the soil–bedrock interface was inverselyrelated to soil depth during the first hours of rainfall for all thethree hillslope inclinations analyzed. During this first phase,rain infiltration was strictly vertical and no differences werefound for the three hilllslope angles analyzed (b= 13�, 20�,30�). Figure 4(c) shows the evolution of the variance of thevalues of pressure head at the soil–bedrock interface s2c tð Þduring the long-rainfall event. s2c tð Þ is defined as follow:
s2c tð Þ ¼ 1N
XNi¼1
ci tð Þ � �c tð Þ� 2(10)
where N is the total number of nodes of the numerical domainat the soil–bedrock interface (1479 points), ci [L] is the value of
Earth Surf. Process. Landforms, Vol. 38, 146–159 (2013)

Figure 4. Saturated area and pressure head response for the long-rainfall event. (a) Temporal evolution of saturated area at the soil–bedrock interfaceof the original 13� and modified 20� and 30� Panola hillslopes during the long-rainfall event. (b) Dynamics of the mean value of positive pressurehead versus percentage of saturated area at the soil–bedrock interface for the three Panola hillslope angles analyzed. (c) Temporal evolution of thevariance s2c of the values of pressure head recorded at the soil–bedrock interface for the three slope angles investigated.
152 C. LANNI ET AL.
pressure head at node i, �c ¼ 1N ci is the average value of
pressure head at the soil–bedrock interface, and t [T] is ageneric time.Equation (10) describes how much localized pore pressure
values deviate from the average value of pressure head at thesoil–bedrock interface. Therefore, it provides a measure of thespatial variability of pore pressure during and after the rainfallevent. The initial value of the variance of pressure head at thesoil–bedrock interface,s2c t ¼ 0ð Þ, was zero because all the nodes
were characterized by the same pore-pressure value before thebeginning of the long-rainfall event. s2c tð Þ increased after the
beginning of the event, indicating a different response of thebedrock-points to the rainfall input. The s2c tð Þ of the three
hillslope angles investigated (13�, 20�, and 30�) were very similaruntil the 5th rainfall-hour. s2c tð Þ then diverged in the successive
phases of the rainfall event. Hence, the hillslope gradient affectedthe pore pressure dynamics in the second phase of rainfall (4–5hafter rainfall commencement). In particular, the lower the overallhillslope angle b, the higher the variance of pressure headrecorded at the soil–bedrock interface. This was basically relatedto the different (lateral) subsurface flow velocities in dissipatingthe positive pore pressure during the second phase of rainfalland after the end of the rainfall event.All the investigated slope angles showed a double peak in the
shape of s2c tð Þ (Figure 4(c)). The second peak occurred always
after the end of the event (15th hour, 13th hour, and 12th hourfor the 13�-, 20�-, and 30�-Panola hillslope, respectively).Figure 5 shows the maps of pressure head at the soil–bedrock
interface for the modified 30� Panola hillslope during the short-rainfall (I=12mmh-1, D=5h) and the long-rainfall (I=6.25
Copyright © 2012 John Wiley & Sons, Ltd.
mmh-1, D=9h) events. The maps are arranged in order ofincreasing amounts of cumulative rainfall. For both the short-and long-rainfall events a threshold of about 35mm of rainfallwas necessary to generate measurable spots of transient satura-tion at the soil–bedrock interface. Once this threshold wasexceeded, a rapid propagation of transient saturation extentwas then observed. The rainfall intensity I affected the temporaldynamics of this process but, irrespective of rainfall intensity,similar patterns of pore pressure were observed for the sametotal rainfall amount.
Linking subsurface hydrology and landslide triggering
The pore pressure values provided by Hydrus 3-D were used tocompute the factor of safety FS in each soil-pixel by applyingthe infinite slope stability model developed in Equation (6). Thisallowed calculation of the safety factor at each depth of thediscretized domain. Only the steepest hillslope scenario(b=30�) was affected by conditions of instability (i.e. raster cellswhere the factor of safety FS dropped below 1). In particular,the slip surface (i.e. the depth of failure) was always localizedat the soil–bedrock interface where FS first dropped below 1.
The CA model (Figure 3 and Equation (7)) was used toredistribute the driving forces of the unstable pixels to theneighboring regions within the hillslope domain and thusoutline the hillslope zones on the verge of collapse. Figure 6shows the patterns of unstable points for the 30�-hillslopeat several times during the long-rainfall event. Red pointsrepresent unstable locations provided by the infinite slopestability model (Equation (6)). The black points are ones that
Earth Surf. Process. Landforms, Vol. 38, 146–159 (2013)

Figure 5. Maps of pore-pressure at the soil–bedrock interface of the modified 30�-Panola hillslope during the short-rainfall (top) and long-rainfall(bottom) events. Patterns of pore pressure are similar when the same value of cumulative rainfall has been achieved. This figure is available in colouronline at wileyonlinelibrary.com/journal/espl
153THE ROLE OF BEDROCK TOPOGRAPHY ON SLOPE STABILITY
become unstable when the driving forces of the destabilizedlocations are redistributed to the neighboring cells (Equation(7)). The patterns of instability were evaluated by using fourdifferent values of the failure propagation rate l (i.e. thepercentage of driving forces redistributed to the neighbors):0.2, 0.4, 0.6 and 0.8.Maps of instability in Figure 6 show two large clusters of
instability with centers localized approximately 25 and 45mdownslope from the crest of the hillslope. Patterns of instabilitydid not exhibit significant differences during the first rainfallhours and l had only a small effect on where failure occurred(i.e. the maps in the 1st, 2nd, and 3rd columns in Figure 6 arevery similar). On the other hand, instability spread very quicklyin the second phase of rainfall (approximately 6–7 h after theonset of rainfall) especially when the higher values of l(l=0.6 and l=0.8) were used to run the CA model. This thresh-old-like expansion behavior was also observed for the otherrainfall events analyzed (very short-, short-, and very long-rainfall events in Table II), where the time at which the thresholdexpansion behavior was observed decreased with increasingrainfall intensity.Figure 7 shows that instability spread very quickly when a
cumulative rainfall of 30–35mm was achieved, irrespective ofrainfall intensity. Once this rain amount was exceeded a rapidpropagation of instability was then observed. This precipitationthreshold was similar for all the values of l considered.
Discussion
Many of today’s popular landslide initiation models used tomap landslide triggering assume that the ground surface topog-raphy is a good proxy to describe subsurface pore pressuresand flow path dynamics or to characterize the initial conditions
Copyright © 2012 John Wiley & Sons, Ltd.
for soil-water storage prior to rainfall events (Baum et al., 2008).These models generally use the DEM of the ground surface tocompute a steady-state (Montgomery and Dietrich, 1994; Wuand Sidle, 1995; Pack et al., 1998) or a ‘quasi-dynamic’wetness index (Borga et al., 2002; Casadei et al., 2003) whereit is assumed that the specific (steady-state or time-variable)upslope area derived from the surface topography is a surrogatemeasure of subsurface flow in response to a rainfall of specifiedduration. The subsurface flow paths (i.e. the drainage directions)are then derived from DEM analysis and the land surfaceslope is used as a substitute for the slope of the subsurfacehydraulic gradients.
Our results showed that subsurface topography, not surfacetopography, controls the development of perched water tableduring rainfall events and that bedrock depressions are thezones primarily responsible for localized pore pressureincreases. These findings are consistent with the preponder-ance of evidence from many hydrological study hillslopesaround the world (as reviewed in Weiler et al., 2006). Thefilling and spilling of water in this zone has a first order effecton the generation of shallow landslide triggering.
On the relation between bedrock topography andthe development of positive pore pressure
The bedrock topography induced the development of positivepore pressure at the soil–bedrock interface. Filling and spillingof water in this zone determined the temporal evolution andthe connectivity of zones of transient saturation at the soil–bedrock interface at the Panola hillslope. Rain water infiltratedvertically through the soil profile during the first stage of rainfalldue to the high infiltration soil capacity of the Panola-soil. The
Earth Surf. Process. Landforms, Vol. 38, 146–159 (2013)

Figure 6. Temporal patterns of unstable locations generated by the cellular automaton (CA) model for four different values of l (0.2, 0.4, 0.6, and 0.8 onthe first, second, third and fourth row, respectively). The long-rainfall event case (I=6.25mmh-1, D=9h) is shown here. In red are the points classifiedunstable by the infinite slope stability model (Equation (6)). The black points are the ones that become unstable when the driving forces of the destabilizedlocations are redistributed to the neighboring cells (Equation (7)). Rapid failure propagation is observed for high values of l (l=0.6 and l=0.8) during thesecond stage of rainfall event (i.e. after 5h from rainfall beginning). This figure is available in colour online at wileyonlinelibrary.com/journal/espl
154 C. LANNI ET AL.
first bedrock points to respond to the precipitation input werethose with the thinnest soil above the bedrock level, where atemporary perched water table developed and water began to
Copyright © 2012 John Wiley & Sons, Ltd.
move laterally. The initially fragmented patches of transientsaturation became more connected as the water table rose highenough so that water spilled then over the ridges of isolated
Earth Surf. Process. Landforms, Vol. 38, 146–159 (2013)
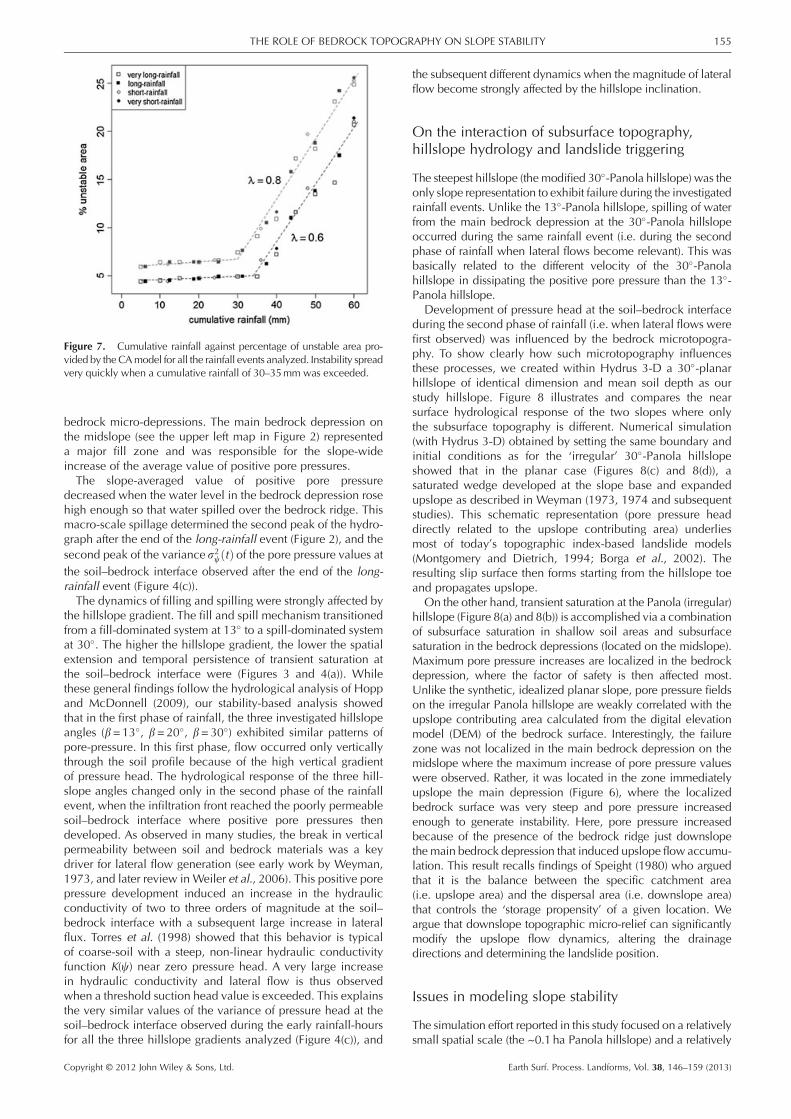
Figure 7. Cumulative rainfall against percentage of unstable area pro-vided by the CAmodel for all the rainfall events analyzed. Instability spreadvery quickly when a cumulative rainfall of 30–35mm was exceeded.
155THE ROLE OF BEDROCK TOPOGRAPHY ON SLOPE STABILITY
bedrock micro-depressions. The main bedrock depression onthe midslope (see the upper left map in Figure 2) representeda major fill zone and was responsible for the slope-wideincrease of the average value of positive pore pressures.The slope-averaged value of positive pore pressure
decreased when the water level in the bedrock depression rosehigh enough so that water spilled over the bedrock ridge. Thismacro-scale spillage determined the second peak of the hydro-graph after the end of the long-rainfall event (Figure 2), and thesecond peak of the variance s2c tð Þ of the pore pressure values atthe soil–bedrock interface observed after the end of the long-rainfall event (Figure 4(c)).The dynamics of filling and spilling were strongly affected by
the hillslope gradient. The fill and spill mechanism transitionedfrom a fill-dominated system at 13� to a spill-dominated systemat 30�. The higher the hillslope gradient, the lower the spatialextension and temporal persistence of transient saturation atthe soil–bedrock interface were (Figures 3 and 4(a)). Whilethese general findings follow the hydrological analysis of Hoppand McDonnell (2009), our stability-based analysis showedthat in the first phase of rainfall, the three investigated hillslopeangles (b=13�, b=20�, b=30�) exhibited similar patterns ofpore-pressure. In this first phase, flow occurred only verticallythrough the soil profile because of the high vertical gradientof pressure head. The hydrological response of the three hill-slope angles changed only in the second phase of the rainfallevent, when the infiltration front reached the poorly permeablesoil–bedrock interface where positive pore pressures thendeveloped. As observed in many studies, the break in verticalpermeability between soil and bedrock materials was a keydriver for lateral flow generation (see early work by Weyman,1973, and later review in Weiler et al., 2006). This positive porepressure development induced an increase in the hydraulicconductivity of two to three orders of magnitude at the soil–bedrock interface with a subsequent large increase in lateralflux. Torres et al. (1998) showed that this behavior is typicalof coarse-soil with a steep, non-linear hydraulic conductivityfunction K(c) near zero pressure head. A very large increasein hydraulic conductivity and lateral flow is thus observedwhen a threshold suction head value is exceeded. This explainsthe very similar values of the variance of pressure head at thesoil–bedrock interface observed during the early rainfall-hoursfor all the three hillslope gradients analyzed (Figure 4(c)), and
Copyright © 2012 John Wiley & Sons, Ltd.
the subsequent different dynamics when the magnitude of lateralflow become strongly affected by the hillslope inclination.
On the interaction of subsurface topography,hillslope hydrology and landslide triggering
The steepest hillslope (themodified 30�-Panola hillslope) was theonly slope representation to exhibit failure during the investigatedrainfall events. Unlike the 13�-Panola hillslope, spilling of waterfrom the main bedrock depression at the 30�-Panola hillslopeoccurred during the same rainfall event (i.e. during the secondphase of rainfall when lateral flows become relevant). This wasbasically related to the different velocity of the 30�-Panolahillslope in dissipating the positive pore pressure than the 13�-Panola hillslope.
Development of pressure head at the soil–bedrock interfaceduring the second phase of rainfall (i.e. when lateral flows werefirst observed) was influenced by the bedrock microtopogra-phy. To show clearly how such microtopography influencesthese processes, we created within Hydrus 3-D a 30�-planarhillslope of identical dimension and mean soil depth as ourstudy hillslope. Figure 8 illustrates and compares the nearsurface hydrological response of the two slopes where onlythe subsurface topography is different. Numerical simulation(with Hydrus 3-D) obtained by setting the same boundary andinitial conditions as for the ‘irregular’ 30�-Panola hillslopeshowed that in the planar case (Figures 8(c) and 8(d)), asaturated wedge developed at the slope base and expandedupslope as described in Weyman (1973, 1974 and subsequentstudies). This schematic representation (pore pressure headdirectly related to the upslope contributing area) underliesmost of today’s topographic index-based landslide models(Montgomery and Dietrich, 1994; Borga et al., 2002). Theresulting slip surface then forms starting from the hillslope toeand propagates upslope.
On the other hand, transient saturation at the Panola (irregular)hillslope (Figure 8(a) and 8(b)) is accomplished via a combinationof subsurface saturation in shallow soil areas and subsurfacesaturation in the bedrock depressions (located on the midslope).Maximum pore pressure increases are localized in the bedrockdepression, where the factor of safety is then affected most.Unlike the synthetic, idealized planar slope, pore pressure fieldson the irregular Panola hillslope are weakly correlated with theupslope contributing area calculated from the digital elevationmodel (DEM) of the bedrock surface. Interestingly, the failurezone was not localized in the main bedrock depression on themidslope where the maximum increase of pore pressure valueswere observed. Rather, it was located in the zone immediatelyupslope the main depression (Figure 6), where the localizedbedrock surface was very steep and pore pressure increasedenough to generate instability. Here, pore pressure increasedbecause of the presence of the bedrock ridge just downslopethe main bedrock depression that induced upslope flow accumu-lation. This result recalls findings of Speight (1980) who arguedthat it is the balance between the specific catchment area(i.e. upslope area) and the dispersal area (i.e. downslope area)that controls the ‘storage propensity’ of a given location. Weargue that downslope topographic micro-relief can significantlymodify the upslope flow dynamics, altering the drainagedirections and determining the landslide position.
Issues in modeling slope stability
The simulation effort reported in this study focused on a relativelysmall spatial scale (the ~0.1ha Panola hillslope) and a relatively
Earth Surf. Process. Landforms, Vol. 38, 146–159 (2013)

Figure 8. Comparison between the hydrological behavior of the ‘irregular’ Panola hillslope and a ‘regular’ planar hillslope. Both slopes received aninput of 6.25mmh-1 over 9 h. Panels (a) and (c) show the pressure head lines (at the 9th rainfall hour) at the soil–bedrock interface of the irregular andregular slopes, respectively. A saturated wedge expands upslope from the hillslope toe in the planar case (d). Roughness at the bedrock topography ofthe Panola hillslope (b) induce localized increase in pressure head (by preventing the free downslope drainage) resulting in complex patterns ofinstability. The vertical dimensions in panels (b) and (d) are exaggerated differently.
156 C. LANNI ET AL.
short temporal scale. To show the potential effect of subsurfacetopography in determining timing and position of shallowlandslide initiation, we used a methodology which is similar tothat of Dutton et al. (2005) andMirus et al. (2007), with a ‘sophis-ticated’ three-dimensional hydrological analysis and separate FSestimates. Admittedly, this approach does not address the fullycoupled processes of hydrologic response and slope deforma-tion, which would be desirable to describe the complex mecha-nism of collapse induced by our irregular bedrock topography.A coupled model has been developed by Borja and White(2010). They developed a physics-based continuum model thatcaptures the coupled solid deformation–fluid flow processes invariably saturated slopes. Their model accommodates relevantconstitutive properties of the soil, in order to realistically quantifystresses and pore pressures responsible for triggering slope failure.In future studies, thiswill be the best approach to assess the role ofbedrock depressions on soil displacements and subsequent slopefailure. What makes this next step challenging is that this type ofmodel requires a long list of further details on soil properties(in addition to those required by our uncoupled model), including:elastic bulk modulus, Poisson’s ratio (needed to introduce stres-ses in the model), dilatancy angle (that affects the volume changeof the soil during yielding) and possibly other parametersdepending on the constitutive law used to model the soilmaterial. Furthermore, characterization of the initial in situ stress
Copyright © 2012 John Wiley & Sons, Ltd.
conditions within the slope would be needed for implementationof such an approach.
Here, although not as rigorous as the hydrologic-response(Hydrus 3-D) model used in our study, our simplified slopestability model provided a first-order understanding of theimportance of irregular bedrock topography in the context ofhillslope stability. We used the infinite slope stability model toestablish the triggered zones (or local instability), and thendescribed the mechanical interactions among pixels by usingthe CA model. The rationale behind this is that landslide initia-tion requires that the equilibrium threshold is exceeded in acertain number of locations close to the triggered (and oftenisolated) points, in order to form a pattern of weakness for thesoil mantled slope. The triggered points increase the shearstress in adjacent points in the hillslope causing failure of aconnected domain with shear stress larger than the thresholdvalue (Pelletier et al., 1997). It should be noted that we didnot provide a definitive value of the factor of safety for theconnected domain (i.e. failure area). Indeed, our efforts aimedto understand the impact of the irregular subsurface topographyin determining the spatial spreading and temporal developmentof this connected failure area (i.e. the threshold-like expansionbehavior that emerged during the second phase of the rainfall).
We also tested a CA model with a different rule to propagatesoil-stresses of destabilized cells; in this modified version, the
Earth Surf. Process. Landforms, Vol. 38, 146–159 (2013)

157THE ROLE OF BEDROCK TOPOGRAPHY ON SLOPE STABILITY
destabilizing force Fid of the unstable cell i is only redistributedto the neighbouring cells with lower elevation. Results by thismodified CA model confirmed that instability spread overlarge area once about 35mm threshold on cumulativerainfall was exceeded, and suggested that the fast spreadingof instability is not dependent on the redistribution mecha-nism of soil stresses. However, we also found that the redistribu-tion mechanism has a considerable effect on the final percentageof unstable area (8% of the hillslope area with the modified CAmodel, against ~25% provided by Equation (7) – see Figure 7),indicating that the redistribution rules in our CA model needsfurther investigation.
Implications for catchment-scale shallowlandslide models
Many recent catchment-scale landslide modeling efforts havefocused on new and more effective ways to describe flowsfrom upslope by using the topographic index or dynamictopographic index approaches (i.e. Montgomery and Dietrich,1994; Tarolli and Tarboton, 2006). Our work suggests thatnew focus on soil depth mapping (to then back-calculate thetopography of the bedrock surface) may be useful to improveour ability to predict timing and location of shallow landslideinitiation and that subsurface topography has a strong impactin controlling the connectivity of saturated patches at thesoil–bedrock interface. However, despite this evidence, mostcatchment-scale shallow landslide models fail to include aconnectivity component for subsurface hydrological connec-tivity. Thus, we invoke at least a simplified treatment of theproblem. This has been done for overland flow processes(Lane et al., 2004) and fine sediment and soil erosion processes(Reid et al., 2007; Lane et al., 2009) by extending the traditionaltopographic index approach to include a simplified representa-tion of surface hydrological connectivity. A similar approachcan be adopted for subsurface flow processes and shallowlandslide processes. Research to pursue this objective iscurrently underway (Lanni et al., 2012).
Conclusions
This paper has sought to link an important new finding from thehillslope hydrological literature – the filling and spilling oftransient saturation at the soil–bedrock interface – with land-slide related processes at the hillslope scale. We found thatbedrock depressions play a key role in pore pressure dynamicsand shallow failure initiation. Topographic depressions at thebedrock layer induce localized zones of increased pressurehead such that the development of pore-pressure fields—notpredictable by ground surface topography—leads to rapidlandslide propagation. Isolated transient groundwater pocketsat the soil–bedrock interface produced during rainfall eventsspill over small bedrock ridges to form sudden and connectedsaturated areas that instantaneously reduce the factor of safetythrough the hillslope. This emergent behavior occurs after aprecipitation threshold has been exceeded and may be respon-sible for the rapid transition from stable to unstable conditionsgenerally observed for shallow (and for this unpredictable)landslide phenomena.Modeling pore pressure spatial distribution using the topog-
raphy of the bedrock may significantly improve the ability oflandslide models to detect shape and location of the slipsurface. While such data are largely unavailable, except forwell studied hillslopes and watersheds, promising new work(Pelletier and Rasmussen, 2009) suggests that soil depth
Copyright © 2012 John Wiley & Sons, Ltd.
modeling may be a way to then derive bedrock topographicrelief and lead to the coupling of physically-based landslidemodels with quantitative soil–landscape methods to ultimatelyimprove our ability to predict shallow landslide potential.
Acknowledgements—We thank the many Panola field staff for theircollection of the original Panola data, including Jim Freer, Doug Burns,Al Zumbuhl, Ilja Tromp-van Meerveld. Jake Peters and the USGS Panolastaff are thanked for their ongoing support of the site and our work. TimBurt, GregHancock,Mark Reid, and JonathanGodt are thanked for usefulearly discussions. We are grateful to the two anonymous reviewers forcomments that improved the quality of this manuscript.
ReferencesArnone E, Noto LV, Lepore C, Bras RL. 2011. Physically-based anddistributed approach to analyze rainfall-triggered landslides at water-shed scale. Geomorphology 133: 121–131.
Avolio MV, Di Gregorio S, Mantovani F, Pasuto A, Rongo R, Silvano S,Spataro W. 2000. Simulation of the 1992 Tessina landslide by acellular automata model and future hazard scenarios. JAG 2: 41–50.
Bak P, Tang C, Wiesenfeld K. 1987. Self-organized criticality: an expla-nation of 1/f noise. Physical Review Letters 147: 297–300.
Baum RL, Savage WZ, Godt JW. 2008. TRIGRS – A FORTRAN programfor transient rainfall infiltration and grid based regional slope stabilityanalysis, version 2.0. US Geological Survey Open File Report 20081159, 74.
Baum RL, Godt JW, Savage, WZ. 2010. Estimating the timing andlocation of shallow rainfall-induced landslides using a model fortransient, unsaturated infiltration. Journal of Geophysical Research115. DOI: 10.1029/2009JF001321.
Bishop AW. 1959. The principle of effective stress. Tek Ukebl 106(39):859–863.
Borga M, Dalla Fontana G, Cazorzi F. 2002. Analysis of topographicand climatologic control on rainfall-triggered shallow landslidingusing a quasi-dynamic wetness index. Journal of Hydrology 268:56–71.
Borja RI,White JA. 2010. Continuumdeformation and stability analyses ofa steep hillside slope under rainfall infiltration. Acta Geotechnica5: 1–14. DOI: 10.1007/s11440-009-0108-1.
Buttle JM, Dillon PJ, Eerkes GR. 2004. Hydrologic coupling of slopes,riparian zones and streams: an example from the Canadian Shield.Journal of Hydrology 287(1–4): 161–177. DOI: 10.1016/j.jhydrol.2003.09.022.
Campos TMP, Andrade MHN, Gerscovich DMS, Vargas Jr. EA. 1994.Analysis of the failure of an unsaturated gneissic residual soil slopein Rio de Janeiro, Brazil. 1st Panamerican Symposium On Landslides,pp. 201–213.
Casadei M, Dietrich WE, Miller NL. 2003. Testing a model for predictingthe timing and location of shallow landslide initiation in soil-mantledlandscapes. Earth Surface Processes and Landforms 28: 925–950.DOI: 10.1002/esp.470.
Clerici A, Perego S. 2000. Simulation of the Parma River blockage bythe Corniglio landslide (Northern Italy). Geomorphology 33: 1–23.
D’Ambrosio D, Di Gregorio S, Iovine G, Lupiano V, Rongo R, SpataroW. 2003. First simulations of the Sarno debris flows through cellularautomata modeling. Geomorphology 54: 91–117.
Dietrich WE, McKean J, Bellugi D, Perron T. 2007. The prediction ofshallow landslide location and size using a multidimensional land-slide analysis in a digital terrain model. Proceedings of the Fourth In-ternational Conference on Debris-Flow Hazards Mitigation:Mechanics, Prediction, and Assessment (DFHM-4); Chengdu, China.
D’Odorico P, Fagherazzi S, Rigon R. 2005. Potential for landsliding:dependence on hyetograph characteristics. Journal of GeophysicalResearch 110. DOI: 10.1029/2004JF000127.
Duan J, Grant GE. 2000. Shallow landslide delineation for steep forestwatersheds based on topographic attributes and probability analysis.Terrain Analysis: Principles and Applications, Wilson JP, Gallant JC(eds). New York. 311–329.
Dutton A, Loague K, Wemple BC. 2005. Simulated effect of a forestroad on near-surface hydrologic response and slope stability. EarthSurface Processes and Landforms 30: 325–338.
Earth Surf. Process. Landforms, Vol. 38, 146–159 (2013)
158 C. LANNI ET AL.
Fredlund DG, Rahardjo H. 1993. Soil Mechanics for Unsatured Soils.Wiley-Interscience: New York.
Freer J, McDonnell JJ, Beven KJ, Peters NE, Burns DA, Hooper RP,Aulenbach B, Kendall C. 2002. The role of bedrock topography onsubsurface storm flow. Water Resources Research 38: 1269.
van Genuchten MT. 1980. A closed-form equation for predicting thehydraulic conductivity of unsaturated soils. Soil Science Society ofAmerica Journal 44: 892–898.
Glade T. 1998. Establishing the frequency and magnitude of landslide-triggering rainstorm events in New Zealand. Environmental Geology35: 2–3.
Godt JW, Baum RL, Lu N. 2009. Using soil suction and moisturecontent measurements for landslide prediction. GeophysicalResearch Letters 36: L02403. DOI: 10.1029/2008GL035996.
Graham CB, Woods RA, McDonnell JJ. 2010. Hillslope thresholdresponse to rainfall: (1) a field based forensic approach. Journal ofHydrology 393(1–2): 65–76. DOI: 10.1016/j.jhydrol.2009.12.015.
Guthrie RH, Deadman PJ, Cabrera AR, Evans SG. 2007. Exploring themagnitude–frequency distribution: a cellular automata model forlandslides. Landslides 5: 151–159. DOI: 10.1007/s10346-007-0104-1.
Hawke R, McConchie J. 2009. In situ measurement of soil moisture andpore-water pressures in an ’incipient’ landslide: Lake Tutira, NewZealand. Journal of Environmental Management 92(2).
Hjerdt KN, McDonnell JJ, Seibert J, Rodhe A. 2004. A new topographicindex to quantify downslope controls on local drainage. WaterResource Research 40: W05602. DOI: 10.1029/2004WR003130.
Hopp L, McDonnell JJ. 2009. Connectivity at the hillslope scale:identifying interactions between storm size, bedrock permeability,slope angle and soil depth. Journal of Hydrology 376(3–4): 378–391. DOI: 10.1016/j.jhydrol.2009.07.047.
Iovine G, Di Gregorio S, Lupiano V. 2003. Debris-flow susceptibilityassessment through cellular automata modeling: an example from15–16 December 1999 disaster at Cervinara and San Martino ValleCaudina (Campania, southern Italy). Natural Hazards Earth SystemsScience 3: 457–468.
Iverson RM, Reid ME, LaHusen RG. 1997. Debris-flow mobilizationfrom landslides. Annual Review of Earth Planet Science 25: 85–138.
Jensen JH. 1998. Self-Organized Criticality. Cambridge UniversityPress: Cambridge.
Lane SN, Brookes CJ, Kirkby MJ, Holden J. 2004. A network index basedversion of TOPMODEL for use with high-resolution digital topographicdata. Hydrological Processes 18: 191–201. DOI:10.1002/hyp.5208.
Lane SN, Reaney SM, Heathwaite AL. 2009. Representation of landscapehydrological connectivity using a topographically driven surface flowindex. Water Resource Research 45. W08423. DOI: 10.1029/2008WR007336.
Lanni C, Borga M, Rigon R, Tarolli P. 2012. Modelling catchment-scaleshallow landslide occurrence by means of a subsurface flow pathconnectivity index. Hydrological Earth Systems Science Discussion9: 4101–4134. www.hydrol-earth-syst-sci-discuss.net/9/4101/2012/doi:10.5194/hessd-9-4101-2012
Lu N, Godt JW. 2008. Infinite-slope stability under steady unsaturatedconditions. Water Resource Research 44. W11404. DOI: 10.1029/2008WR006976.
Lu N, Likos WJ. 2006. Suction stress characteristic curve for unsaturatedsoil. Journal of Geotechnical and Geoenvironmental Engineering 123:131–142.
Minder JR, Roe GH, Montgomery DR. 2009. Spatial patterns of rainfalland shallow landslide susceptibility. Water Resource Research 45:W04419. DOI: 10.1029/2008WR007027.
Mirus BB, Ebel BA, Loague K, Wemple BC. 2007. Simulated effect of aforest road on near surface hydrologic response. Earth SurfaceProcesses and Landforms 32: 126–142. DOI: 10.1002/esp.1387.
Montgomery DR, Dietrich WE. 1994. A physically based model for thetopographic control on shallow landsliding. Water ResourcesResearch 30(4): 1153–1171.
NOAA. 1991. Local climatological data, annual summary with compara-tive data, 1990, Atlanta, Georgia, Asheville, N.C., 6.
Olshansky R. 1990. Landslide hazard in the United States.Case Studies inPlanning and Policy Development. Garland Publishing: New York 178.
Pack RT, Tarboton DG, Goodwin CN. 1998. The SINMAP approach toterrain stability mapping. In Proceedings – International Congress ofthe International Association for Engineering Geology and the
Copyright © 2012 John Wiley & Sons, Ltd.
Environment 8, Vol.. 2, Moore DP, Hungr O (eds). A.A. Balkema:Rotterdam, Netherlands; 1157–1165.
Pelletier JD, Rasmussen C. 2009. Geomorphically-based predictivemapping of soil thickness in upland watersheds. Water ResourcesResearch 45. DOI: 10.1029/2008WR007319.
Pelletier JD, Malamud BD, Blodgett T, Turcotte DL. 1997. Scale-invariance of soil moisture variability and its implications forthe frequency-size distribution of landslides. Engineering Geology48(3–4): 255–268.
Piegari E, Di Maio R, Milano, L. 2009. Characteristic scales in landslidemodeling. Nonlinear Processes in Geophysics 16: 515–523. DOI:10.5194/npg-16-515-2009.
Reid, SC, Lane SN, Montgomery DR, Brookes CJ. 2007. Does hydrologicalconnectivity improve identification of coarse sediment delivery in uplandenvironments? Geomorphology 90: 263–282.
Richards LA. 1931. Capillary conduction of liquids in porous mediums.Physics 1: 318–333.
Rodriguez-Iturbe I, Rinaldo A. 1997. Fractal River Networks: Chanceand Self-Organization. Cambridge University Press: New York.
Savage WZ, Godt JW, Baum RL. 2004. Modeling time-dependent arealslope stability. In Landslides: Evaluation and Stabilization, LacerdaWA, Ehrlich M, Fontoura SAB, Sayao ASF (eds). Taylor and FrancisGroup: London; 23–36.
Schmidt KM, Roering JJ, Stock JD, Dietrich WE, Montgomery DR,Schaub T. 2001. The variability of root cohesion as an influence onshallow landslide susceptibility in the Oregon Coast Range.Canadian Geotechnical Journal 38(5): 995–1024.
Schuster RL. 1995. Keynote paper: recent advances in slope stabilization.In Landslides –Glissements de terrain, Bell H (ed). Balkema: Rotterdam,1715–1745.
Simoni S, Zanotti F, Bertoldi G, Rigon R. 2008. Modelling the probabilityof occurrence of shallow landslides and channelized debris flows usingGEOtop-FS. Hydrological Processes 22(4): 532–545.
Simunek J, van Genuchten MT, Sejna M. 2006. The HYDRUS SoftwarePackage for Simulating Two- and Three-dimensional Movement ofWater, Heat, andMultiple Solutes in Variably-Saturated Media: Techni-cal Manual. Version 1.0. PC-Progress, Prague, Czech Republic.
Speight JG. 1980. The role of topography in controlling throughflowgeneration: a discussion. Earth Surface and Processes 5: 187–191.
Spence C. 2010. A paradigm shift in hydrology: storage thresholdsacross scales influence catchment runoff generation. GeographyCompass 4: 819–833. DOI: 10.1111/j.1749-8198.2010.00341.x.
Spence C, Woo Ming-ko. 2003. Hydrology of subarctic Canadianshield: soil-filled valleys. Journal of Hydrology 279(1–4): 151–166.DOI: 10.1016/S0022-1694(03)00175-6.
Tarolli P, Tarboton DG. 2006. A new method for determination of mostlikely landslide initiation points and the evaluation of digital terrainmodel scale in terrain stability mapping. Hydrological Earth SystemsScience 10: 663–677. DOI: 10.5194/hess-10-663-2006.
Terzaghi K. 1943. Theoretical Soil Mechanics. John Wiley and Sons:New York.
Terzaghi K, Peck RB, Mesri G. 1996. Soil Mechanics in EngineeringPractice. Wiley: New York.
Torres R, DietrichWE, Montgomery DR, Anderson SP, Loague KM. 1998.Unsaturated zone processes and the hydrologic response of a steep,unchanneled catchment.Water Resources Research 34(8): 1865–1879.
Tromp-van Meerveld HJ, McDonnell JJ, 2006a. Threshold relations insubsurface stormflow: 1. A 147-storm analysis of the Panola hillslope.Water Resource Research42,W02410.DOI: 10.1029/2004WR003778.
Tromp-van Meerveld HJ, McDonnell JJ. 2006b. Threshold relations insubsurface stormflow: 2. The fill and spill hypothesis. WaterResources Research 42, W02411. DOI: 10.1029/2004WR003800.
Tromp-van Meerveld HJ, Peters NE, McDonnell JJ. 2007. Effect ofbedrock permeability on subsurface stormflow and the water balanceof a trenched hillslope at the Panola Mountain Research Watershed,Georgia, USA. Hydrological Processes 21: 750–769.
Turcotte DL, Malamud BD, Guzzetti F, Reichenbach P. 2002. Self-organization, the cascade model, and natural hazards. Proceedingsof the National Academy of Science USA 19: 2530–2537.
Van Beek R. 2002. Assessment of the influence of changes in climateand land use on landslide activity in a Mediterranean environment.Netherlands Geographical Studies no. 294, KNAG, Faculty ofGeosciences, Utrecht University, 366.
Earth Surf. Process. Landforms, Vol. 38, 146–159 (2013)

159THE ROLE OF BEDROCK TOPOGRAPHY ON SLOPE STABILITY
Vanapalli SK, Fredlund DG, Pufahl DE, Clifton AW. 1996. Model for theprediction of shear strength with respect to soil suction. CanadianGeotechnical Journal 33(3): 379–392. DOI: 10.1139/t96-060.
Weiler M, McDonnell JJ. 2004. Virtual experiments: a new approach forimproving process conceptualization in hillslope hydrology. Journalof Hydrology 285: 3–18.
Weiler M, McDonnell JJ, Tromp-van Meerveld I, Uchida T. 2006. Subsur-face stormflow. Encyclopedia of Hydrological Sciences. DOI: 10.1002/0470848944.hsa119.
Copyright © 2012 John Wiley & Sons, Ltd.
Weyman DR. 1973. Measurements of the downslope flow of water in asoil. Journal of Hydrology 20(3): 267–288. DOI: 10.1016/0022-1694(73)90065-6.
Weyman DR. 1974. Runoff processes, contributing area and streamflowin a small upland catchment. In Fluvial Processes in InstrumentedWatersheds, Gregory KJ, Walling DE (eds). Institute of British Geogra-phers: London; 33–43.
Wu W, Sidle R. 1995. A distributed slope stability model for steepforested basins. Water Resources Research 31: 2097–2110.
Earth Surf. Process. Landforms, Vol. 38, 146–159 (2013)