simplified equations for estimating the period of ...simplified equations for estimating the period...
TRANSCRIPT
Journal of Multidisciplinary Engineering Science and Technology (JMEST)
ISSN: 2458-9403
Vol. 3 Issue 3, March - 2016
www.jmest.org
JMESTN42351469 4335
Simplified Equations For Estimating The Period Of Vibration Of
Ksa Existing Building Using Ambient vibration testing
Tarek M. Alguhane Doctor of structural engineering
King Abdullah WAQF, KSA Madinah, KSA
Ayman Hussin Professor of Structural Engineering
Ain Shams University Cairo, Egypt
M. N. Fayed. Professor of Structural Engineering
Ain Shams University Cairo, Egypt
mnourf @yahoo.com
Ayman M. Ismail Professor of Structural Engineering
HBRC Cairo, Egypt
Abstract—The elastic period has a primary role in the seismic assessment of buildings. Reliable calculations and/or estimates of the fundamental frequency of a building and its site are essential during analysis and design process. Various code formulas based on empirical data are generally used to estimate the fundamental frequency of a structure. For existing structures, in addition to code formulas and available analytical tools such as modal analyses, various methods of testing including ambient and forced vibration testing procedures may be used to determine dynamic characteristics. In this study, the dynamic properties of the 32 buildings located in the Madinah of Saudi Arabia were identified using ambient motions recorded at several, spatially-distributed locations within each building. Ambient vibration measurements of buildings have been analyzed and the fundamental longitudinal and transverse periods for all tested buildings are presented. The fundamental mode of vibration has been compared in plots with codes formulae (Saudi Building Code, EC8, and UBC1997). A simplified formulas for estimating the fundamental period of vibration (T) of existing concrete buildings using regression analysis are developed and compared with other empirical code's formulas.
Keywords—Ambient vibration , Fundamental period , RC buildings
I. INTRODUCTION
The Building codes generally consider the natural period as a necessary parameter to estimate the structure response coefficient. Therefore, empirical formula should be based on general properties of the buildings, which could be known before a preliminary
analysis, such as building height H or dimensions DL and DT.
TaHbD
c (1)
Where a, b and c are the parameters that different seismic codes proposed values based on the buildings characteristics related to the corresponding country.
The simplified typical form of the general form of an empirical formula, (1) is as follows:
a=Ct, b=x, c=0
T = Ct Hx (2)
Where C and x are coefficients theoretically or experimentally derived, and H represented the height of the building. This expression, or slight variations of it, was been subsequently adopted by different codes for moment resisting frames and other structures.
Another type of simplified typical form of the general form of an empirical formula, (2) is as follows:
a=Ct, b=1, c=-0.5
T =Ct H/D0.5
(3)
Where, D is the dimension of the building at its base in the direction under consideration with the height H. The above equation is used in some codes for buildings with frames and shear walls, as well as reinforced concrete MRF with masonry infill panels or with reinforced concrete shear walls. This formula is used in many design codes around the world, but the type of structure to which it is applied varies from code to code.
Further, some codes used simplified typical empirical formula, considering only the number of floors in building. Table 1 summarizes approximate fundamental period formulas for buildings by some
Journal of Multidisciplinary Engineering Science and Technology (JMEST)
ISSN: 2458-9403
Vol. 3 Issue 3, March - 2016
www.jmest.org
JMESTN42351469 4336
different seismic codes in the world (ATC3-6(1978), the Uniform Building Code (UBC, 1997), Euro-code (2006), Saudi Building code (2007)).
TABLE 1: APPROXIMATE FUNDAMENTAL PERIOD FORMULAS FOR
BUILDINGS BY DIFFERENT SEISMIC CODES IN THE WORLD
RC
MRF Steel
MRF
EBF
eccentrically
braced frames
RC/ Masonry
shear wall Other
ATC3-
6(1978)
T =Ct h3/4
T =0.09hn / √D Ct
=0.075 Ct
=0.085
UBC
97(1997)
,Euro-
code 8
(2006),
T =Ct h3/4
Ct
=0.075 Ct
=0.085 Ct =0.075
Ct =0.05
or, Ct =0.075 /
√AC
*
Ct
=0.05
ASCE 7-10
T =Cr hxn
Cr
=0.047 x =0.9
Cr
=0.072 x =0.8
Cr =0.073 x =0.75
Cr =0.049 x =0.75
Cr
=0.049 x
=0.75
or, T =0.10N —
or,
T
=0.0062hn
/ √Cw**
—
Saudi
Building
code
(2007)
T =Cr hxn
Cr
=0.044 x =0.9
Cr
=0.068 x =0.8
Cr =0.07 x =0.75
T
=0.0062hn
/ √Cw**
Cr
=0.055 x
=0.75
or, T =0.10N — — —
Notes for table 1: * Ac Σ Ai (0.2+ [Iwi / H)]2)
Where, Ac is the total effective area of the shear walls in the first storey of the building, in m
2; Ai is the effective cross-sectional area
of the shear wall i in the first storey of the building, in m2; and Iwi is
the length of the shear wall i in the first storey in the direction parallel to the applied forces, in m. ** Cw= 100/AB Σ ( hn /hi )
2 .[ Ai/ (1 + 0.83 (hi / di)
2) ]
.Where, AB = the base area of the structure m2, Ai = the area of shear wall "i" in m2, Di = the length of shear wall "i" in m, n = the number of shear walls in the building effective in resisting lateral, forces in the direction under consideration
In the last years many experimental and numerical studies as well as many research projects have been carried out in order to define in a simplified way the fundamental period of Reinforced Concrete buildings, Gallipoli et al. (2009), Crowley and Pinho (2010), Al-Nimry et al (2014). Particularly, empirical relationships between the height of a building type and its fundamental period of vibration have been sought, as they can be very useful in many applications. Simplified expressions are mandatory in large scale applications, where the period of a building (or of a class of buildings) needs to be estimated in assessing the seismic vulnerability at urban scale. Modern technology allows performing a detailed assessment of the dynamic properties of a building in a very short time, thus an empirical relationship between a
building’s main characteristics (structural typology, shape, dimensions, age, etc.) and its dynamic behavior can be obtained. On the basis of a classification scheme, the relationship can be applied to similar buildings over a large spatial extent, where building characteristics are obtained from quick field survey or from remote sensing.
Modal identification of existing buildings through the analysis of in-situ vibration measurements became a classic procedure for providing modal characteristics of a building, for studying the seismic response of buildings and even for damage detection. Modal characteristics are often identified from ambient vibration measurements and from seismic records. Ambient vibration testing is generally preferred to non-destructive forced vibration measurement techniques for obtaining the modal parameters of large structures for many reasons. A structure can be adequately excited by wind, traffic, and human activities and the resulting motions can be readily measured with highly sensitive instruments. Expensive and cumbersome devices to excite the structure are therefore not needed. Consequently, the overall cost of the measurements conducted on a large structure is reduced.
Ambient vibration measurements of many buildings have been recorded across the world in the past to determine their dynamic properties, in particular, to ascertain the properties of the fundamental modes of vibration, Midorikawa, (1990), Negulescu et al., (2004), Michel et al., (2008), and , Demetriu et al. (2012) etc. It is also recognized that the experimental data from one region may not be used in another owing to the differences in the construction methods and materials. Crawford and Ward (1964) and Trifunac (1972) showed that ambient vibration-based techniques were as accurate as active methods for determining vibration modes and much easier to implement for a large set of buildings
II. DYNAMIC MEASUREMENT SYSTEMS
Direct in situ measurements systems are the technique used to evaluate the dynamic properties of exciting structures. Also they used in the process of damage detection which relies entirely on non-intrusive methods; as compared to the previous force vibration tests which can be considered more intrusive.
The system used for structural measurements include three components:
1- Measurement sensors: Low cost and high sensitivity make accelerometers the most common equipment for measuring dynamic characteristics. It should be mentioned that these sensors are also used in combination with other transducers such as velocity meters or displacement meters.
Journal of Multidisciplinary Engineering Science and Technology (JMEST)
ISSN: 2458-9403
Vol. 3 Issue 3, March - 2016
www.jmest.org
JMESTN42351469 4337
2- Data acquisition equipment: A Data Acquisition (DAQ) system is an electronic device designed to collect and store the information that is acquired by the measurement sensors.
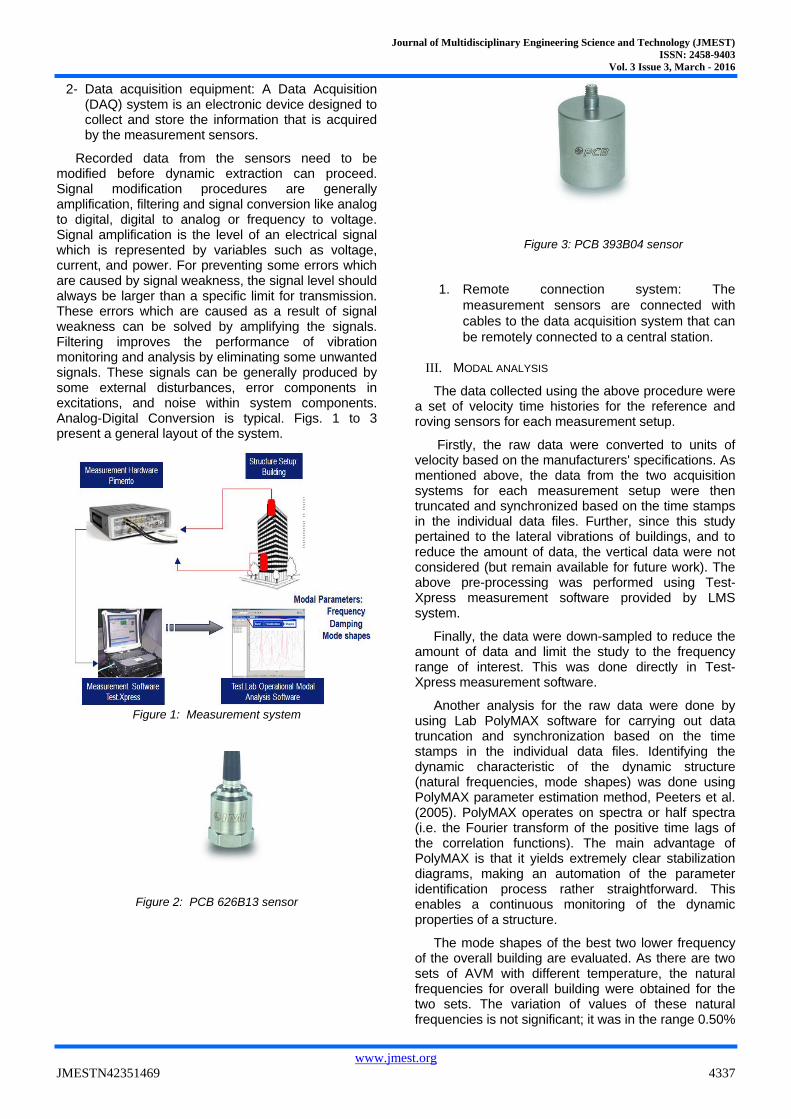
Recorded data from the sensors need to be modified before dynamic extraction can proceed. Signal modification procedures are generally amplification, filtering and signal conversion like analog to digital, digital to analog or frequency to voltage. Signal amplification is the level of an electrical signal which is represented by variables such as voltage, current, and power. For preventing some errors which are caused by signal weakness, the signal level should always be larger than a specific limit for transmission. These errors which are caused as a result of signal weakness can be solved by amplifying the signals. Filtering improves the performance of vibration monitoring and analysis by eliminating some unwanted signals. These signals can be generally produced by some external disturbances, error components in excitations, and noise within system components. Analog-Digital Conversion is typical. Figs. 1 to 3 present a general layout of the system.
Figure 1: Measurement system
Figure 2: PCB 626B13 sensor
Figure 3: PCB 393B04 sensor
1. Remote connection system: The
measurement sensors are connected with
cables to the data acquisition system that can
be remotely connected to a central station.
III. MODAL ANALYSIS
The data collected using the above procedure were a set of velocity time histories for the reference and roving sensors for each measurement setup.
Firstly, the raw data were converted to units of velocity based on the manufacturers' specifications. As mentioned above, the data from the two acquisition systems for each measurement setup were then truncated and synchronized based on the time stamps in the individual data files. Further, since this study pertained to the lateral vibrations of buildings, and to reduce the amount of data, the vertical data were not considered (but remain available for future work). The above pre-processing was performed using Test-Xpress measurement software provided by LMS system.
Finally, the data were down-sampled to reduce the amount of data and limit the study to the frequency range of interest. This was done directly in Test-Xpress measurement software.
Another analysis for the raw data were done by using Lab PolyMAX software for carrying out data truncation and synchronization based on the time stamps in the individual data files. Identifying the dynamic characteristic of the dynamic structure (natural frequencies, mode shapes) was done using PolyMAX parameter estimation method, Peeters et al. (2005). PolyMAX operates on spectra or half spectra (i.e. the Fourier transform of the positive time lags of the correlation functions). The main advantage of PolyMAX is that it yields extremely clear stabilization diagrams, making an automation of the parameter identification process rather straightforward. This enables a continuous monitoring of the dynamic properties of a structure.
The mode shapes of the best two lower frequency of the overall building are evaluated. As there are two sets of AVM with different temperature, the natural frequencies for overall building were obtained for the two sets. The variation of values of these natural frequencies is not significant; it was in the range 0.50%
Journal of Multidisciplinary Engineering Science and Technology (JMEST)
ISSN: 2458-9403
Vol. 3 Issue 3, March - 2016
www.jmest.org
JMESTN42351469 4338
to 1 %. In practice, temperature difference was limited due to generally performing the experimental work in early morning.
It should be noted that these data correspond to low-amplitude motions, and care should be exercised before using such data to model the response of buildings to more severe events, such as earthquake ground motions or design-level winds, since the dynamic properties of the building can be altered by localized damage to the structure itself or to its architectural elements.
IV. TEST PLANING
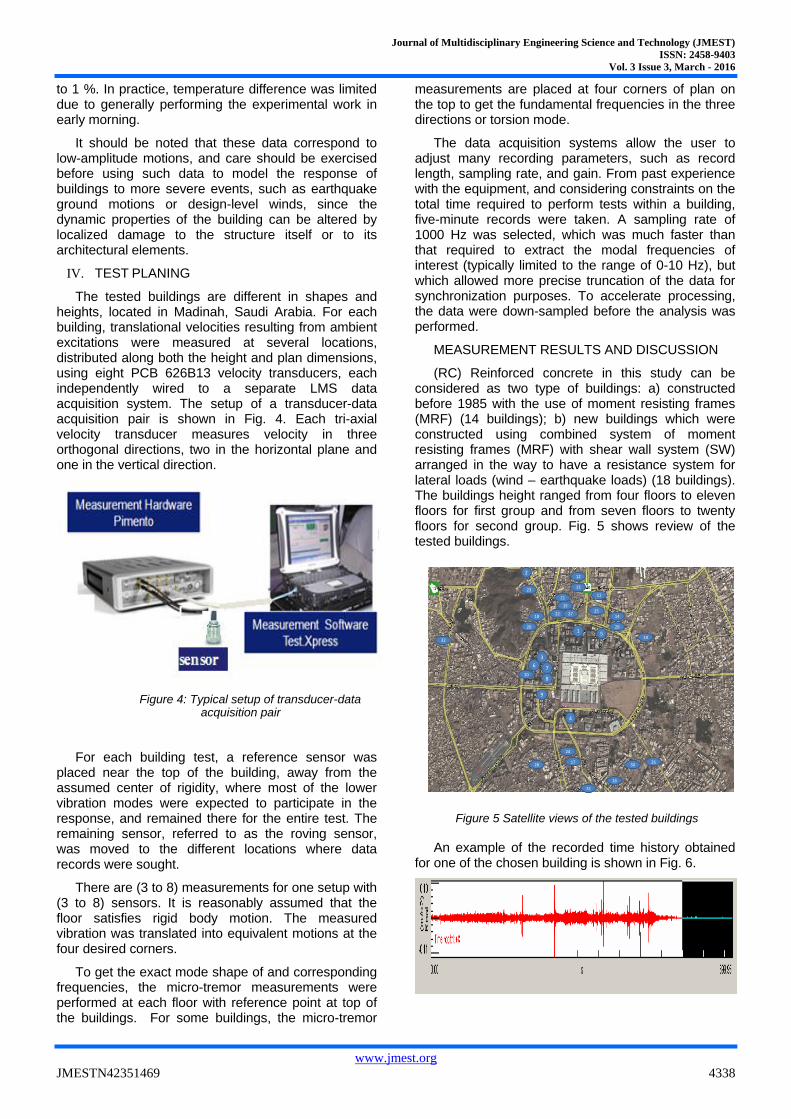
The tested buildings are different in shapes and heights, located in Madinah, Saudi Arabia. For each building, translational velocities resulting from ambient excitations were measured at several locations, distributed along both the height and plan dimensions, using eight PCB 626B13 velocity transducers, each independently wired to a separate LMS data acquisition system. The setup of a transducer-data acquisition pair is shown in Fig. 4. Each tri-axial velocity transducer measures velocity in three orthogonal directions, two in the horizontal plane and one in the vertical direction.
Figure 4: Typical setup of transducer-data acquisition pair
For each building test, a reference sensor was placed near the top of the building, away from the assumed center of rigidity, where most of the lower vibration modes were expected to participate in the response, and remained there for the entire test. The remaining sensor, referred to as the roving sensor, was moved to the different locations where data records were sought.
There are (3 to 8) measurements for one setup with (3 to 8) sensors. It is reasonably assumed that the floor satisfies rigid body motion. The measured vibration was translated into equivalent motions at the four desired corners.
To get the exact mode shape of and corresponding frequencies, the micro-tremor measurements were performed at each floor with reference point at top of the buildings. For some buildings, the micro-tremor
measurements are placed at four corners of plan on the top to get the fundamental frequencies in the three directions or torsion mode.
The data acquisition systems allow the user to adjust many recording parameters, such as record length, sampling rate, and gain. From past experience with the equipment, and considering constraints on the total time required to perform tests within a building, five-minute records were taken. A sampling rate of 1000 Hz was selected, which was much faster than that required to extract the modal frequencies of interest (typically limited to the range of 0-10 Hz), but which allowed more precise truncation of the data for synchronization purposes. To accelerate processing, the data were down-sampled before the analysis was performed.
MEASUREMENT RESULTS AND DISCUSSION
(RC) Reinforced concrete in this study can be considered as two type of buildings: a) constructed before 1985 with the use of moment resisting frames (MRF) (14 buildings); b) new buildings which were constructed using combined system of moment resisting frames (MRF) with shear wall system (SW) arranged in the way to have a resistance system for lateral loads (wind – earthquake loads) (18 buildings). The buildings height ranged from four floors to eleven floors for first group and from seven floors to twenty floors for second group. Fig. 5 shows review of the tested buildings.
Figure 5 Satellite views of the tested buildings
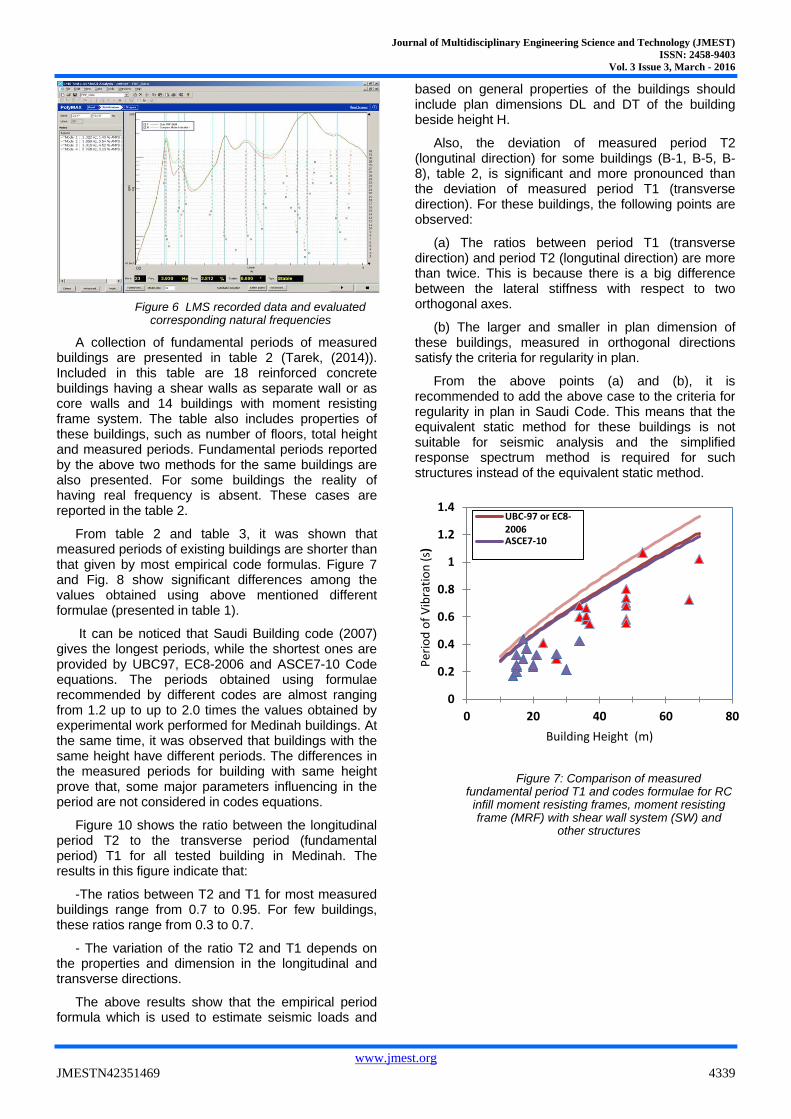
An example of the recorded time history obtained for one of the chosen building is shown in Fig. 6.
2
3
4
6 710
9
8
51
12
11
13
14
15
16
17
18
19
20
32
24
23
22
21
28
27
26
25
31
30
29
Journal of Multidisciplinary Engineering Science and Technology (JMEST)
ISSN: 2458-9403
Vol. 3 Issue 3, March - 2016
www.jmest.org
JMESTN42351469 4339
Figure 6 LMS recorded data and evaluated corresponding natural frequencies
A collection of fundamental periods of measured buildings are presented in table 2 (Tarek, (2014)). Included in this table are 18 reinforced concrete buildings having a shear walls as separate wall or as core walls and 14 buildings with moment resisting frame system. The table also includes properties of these buildings, such as number of floors, total height and measured periods. Fundamental periods reported by the above two methods for the same buildings are also presented. For some buildings the reality of having real frequency is absent. These cases are reported in the table 2.
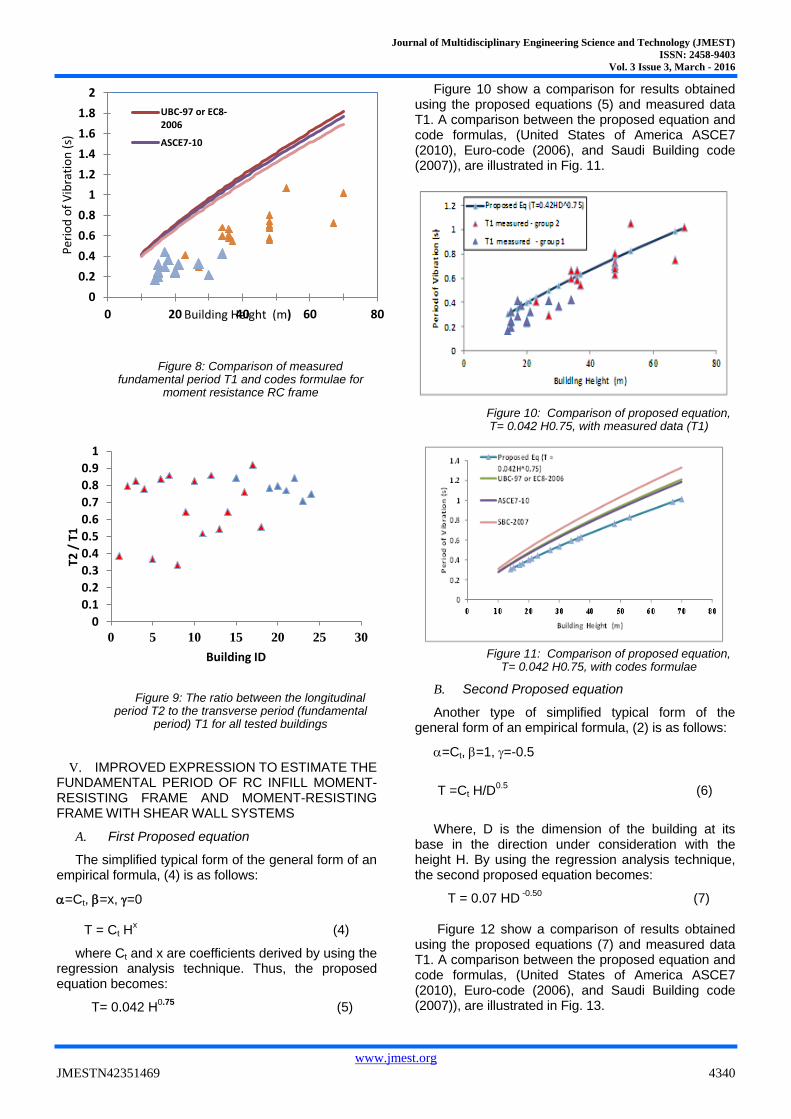
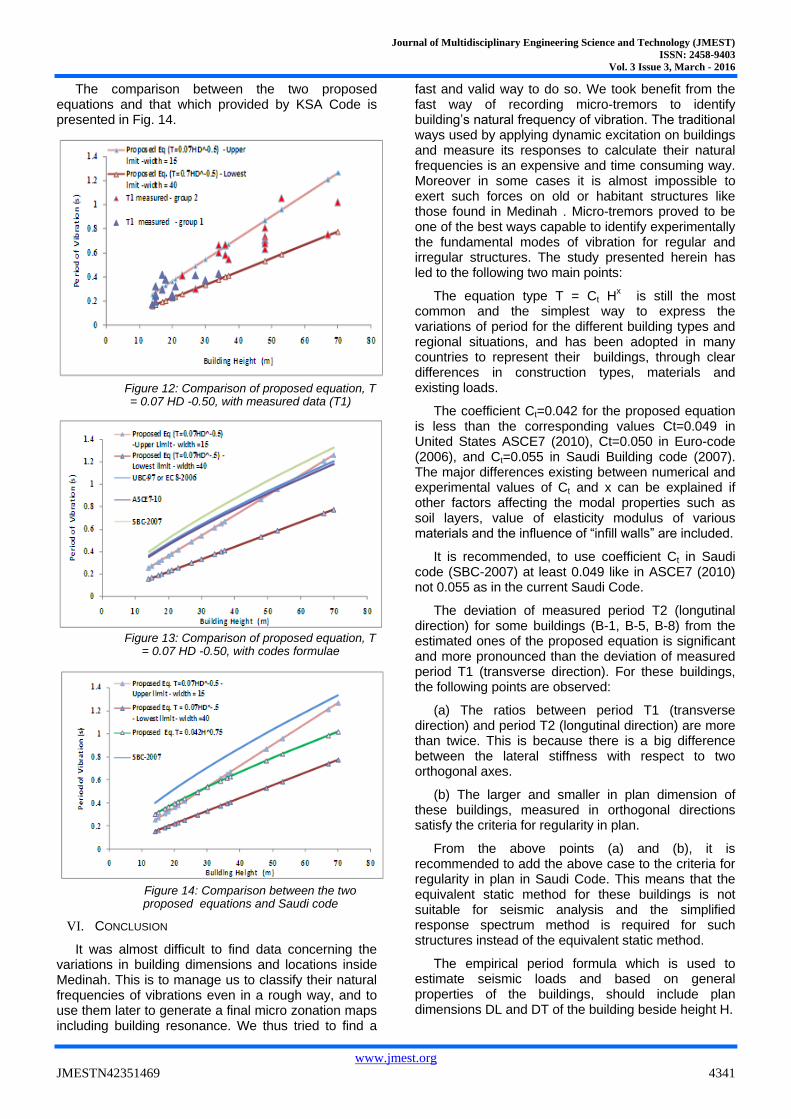
From table 2 and table 3, it was shown that measured periods of existing buildings are shorter than that given by most empirical code formulas. Figure 7 and Fig. 8 show significant differences among the values obtained using above mentioned different formulae (presented in table 1).
It can be noticed that Saudi Building code (2007) gives the longest periods, while the shortest ones are provided by UBC97, EC8-2006 and ASCE7-10 Code equations. The periods obtained using formulae recommended by different codes are almost ranging from 1.2 up to up to 2.0 times the values obtained by experimental work performed for Medinah buildings. At the same time, it was observed that buildings with the same height have different periods. The differences in the measured periods for building with same height prove that, some major parameters influencing in the period are not considered in codes equations.
Figure 10 shows the ratio between the longitudinal period T2 to the transverse period (fundamental period) T1 for all tested building in Medinah. The results in this figure indicate that:
-The ratios between T2 and T1 for most measured buildings range from 0.7 to 0.95. For few buildings, these ratios range from 0.3 to 0.7.
- The variation of the ratio T2 and T1 depends on the properties and dimension in the longitudinal and transverse directions.
The above results show that the empirical period formula which is used to estimate seismic loads and
based on general properties of the buildings should include plan dimensions DL and DT of the building beside height H.
Also, the deviation of measured period T2 (longutinal direction) for some buildings (B-1, B-5, B-8), table 2, is significant and more pronounced than the deviation of measured period T1 (transverse direction). For these buildings, the following points are observed:
(a) The ratios between period T1 (transverse direction) and period T2 (longutinal direction) are more than twice. This is because there is a big difference between the lateral stiffness with respect to two orthogonal axes.
(b) The larger and smaller in plan dimension of these buildings, measured in orthogonal directions satisfy the criteria for regularity in plan.
From the above points (a) and (b), it is recommended to add the above case to the criteria for regularity in plan in Saudi Code. This means that the equivalent static method for these buildings is not suitable for seismic analysis and the simplified response spectrum method is required for such structures instead of the equivalent static method.
Figure 7: Comparison of measured fundamental period T1 and codes formulae for RC
infill moment resisting frames, moment resisting frame (MRF) with shear wall system (SW) and
other structures
0
0.2
0.4
0.6
0.8
1
1.2
1.4
0 20 40 60 80
Per
iod
of
Vib
rati
on
(s)
Building Height (m)
UBC-97 or EC8-2006ASCE7-10
Journal of Multidisciplinary Engineering Science and Technology (JMEST)
ISSN: 2458-9403
Vol. 3 Issue 3, March - 2016
www.jmest.org
JMESTN42351469 4340
Figure 8: Comparison of measured fundamental period T1 and codes formulae for
moment resistance RC frame
Figure 9: The ratio between the longitudinal period T2 to the transverse period (fundamental
period) T1 for all tested buildings
V. IMPROVED EXPRESSION TO ESTIMATE THE
FUNDAMENTAL PERIOD OF RC INFILL MOMENT-RESISTING FRAME AND MOMENT-RESISTING
FRAME WITH SHEAR WALL SYSTEMS
A. First Proposed equation
The simplified typical form of the general form of an empirical formula, (4) is as follows:
=Ct, =x, =0
T = Ct Hx (4)
where Ct and x are coefficients derived by using the regression analysis technique. Thus, the proposed equation becomes:
T= 0.042 H0.75
(5)
Figure 10 show a comparison for results obtained using the proposed equations (5) and measured data T1. A comparison between the proposed equation and code formulas, (United States of America ASCE7 (2010), Euro-code (2006), and Saudi Building code (2007)), are illustrated in Fig. 11.
Figure 10: Comparison of proposed equation, T= 0.042 H0.75, with measured data (T1)
Figure 11: Comparison of proposed equation,
T= 0.042 H0.75, with codes formulae
B. Second Proposed equation
Another type of simplified typical form of the general form of an empirical formula, (2) is as follows:
=Ct, =1, =-0.5
T =Ct H/D
0.5 (6)
Where, D is the dimension of the building at its base in the direction under consideration with the height H. By using the regression analysis technique, the second proposed equation becomes:
T = 0.07 HD -0.50
(7)
Figure 12 show a comparison of results obtained using the proposed equations (7) and measured data T1. A comparison between the proposed equation and code formulas, (United States of America ASCE7 (2010), Euro-code (2006), and Saudi Building code (2007)), are illustrated in Fig. 13.
0
0.2
0.4
0.6
0.8
1
1.2
1.4
1.6
1.8
2
0 20 40 60 80
Per
iod
of
Vib
rati
on
(s)
Building Height (m)
UBC-97 or EC8-2006
ASCE7-10
0
0.1
0.2
0.3
0.4
0.5
0.6
0.7
0.8
0.9
1
0 5 10 15 20 25 30
T2 /
T1
Building ID
Journal of Multidisciplinary Engineering Science and Technology (JMEST)
ISSN: 2458-9403
Vol. 3 Issue 3, March - 2016
www.jmest.org
JMESTN42351469 4341
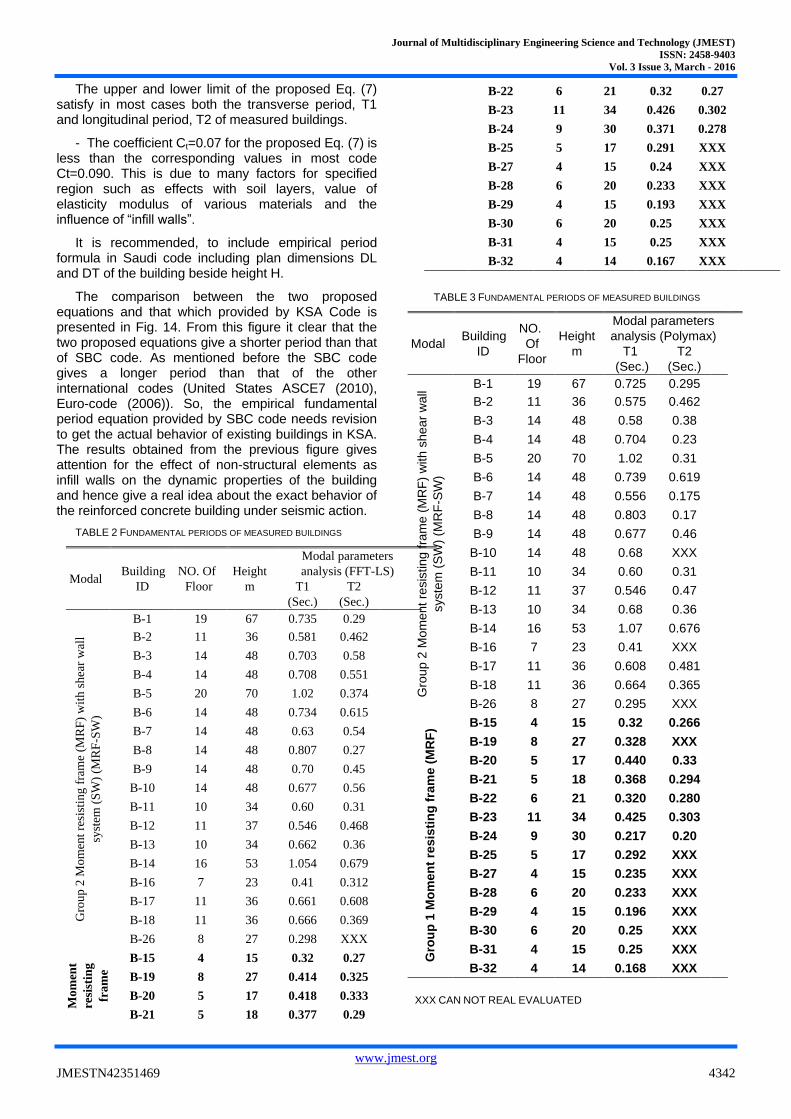
The comparison between the two proposed equations and that which provided by KSA Code is presented in Fig. 14.
Figure 12: Comparison of proposed equation, T = 0.07 HD -0.50, with measured data (T1)
Figure 13: Comparison of proposed equation, T
= 0.07 HD -0.50, with codes formulae
Figure 14: Comparison between the two proposed equations and Saudi code
VI. CONCLUSION
It was almost difficult to find data concerning the variations in building dimensions and locations inside Medinah. This is to manage us to classify their natural frequencies of vibrations even in a rough way, and to use them later to generate a final micro zonation maps including building resonance. We thus tried to find a
fast and valid way to do so. We took benefit from the fast way of recording micro-tremors to identify building’s natural frequency of vibration. The traditional ways used by applying dynamic excitation on buildings and measure its responses to calculate their natural frequencies is an expensive and time consuming way. Moreover in some cases it is almost impossible to exert such forces on old or habitant structures like those found in Medinah . Micro-tremors proved to be one of the best ways capable to identify experimentally the fundamental modes of vibration for regular and irregular structures. The study presented herein has led to the following two main points:
The equation type T = Ct Hx is still the most
common and the simplest way to express the variations of period for the different building types and regional situations, and has been adopted in many countries to represent their buildings, through clear differences in construction types, materials and existing loads.
The coefficient Ct=0.042 for the proposed equation is less than the corresponding values Ct=0.049 in United States ASCE7 (2010), Ct=0.050 in Euro-code (2006), and Ct=0.055 in Saudi Building code (2007). The major differences existing between numerical and experimental values of Ct and x can be explained if other factors affecting the modal properties such as soil layers, value of elasticity modulus of various materials and the influence of “infill walls” are included.
It is recommended, to use coefficient Ct in Saudi code (SBC-2007) at least 0.049 like in ASCE7 (2010) not 0.055 as in the current Saudi Code.
The deviation of measured period T2 (longutinal direction) for some buildings (B-1, B-5, B-8) from the estimated ones of the proposed equation is significant and more pronounced than the deviation of measured period T1 (transverse direction). For these buildings, the following points are observed:
(a) The ratios between period T1 (transverse direction) and period T2 (longutinal direction) are more than twice. This is because there is a big difference between the lateral stiffness with respect to two orthogonal axes.
(b) The larger and smaller in plan dimension of these buildings, measured in orthogonal directions satisfy the criteria for regularity in plan.
From the above points (a) and (b), it is recommended to add the above case to the criteria for regularity in plan in Saudi Code. This means that the equivalent static method for these buildings is not suitable for seismic analysis and the simplified response spectrum method is required for such structures instead of the equivalent static method.
The empirical period formula which is used to estimate seismic loads and based on general properties of the buildings, should include plan dimensions DL and DT of the building beside height H.
Journal of Multidisciplinary Engineering Science and Technology (JMEST)
ISSN: 2458-9403
Vol. 3 Issue 3, March - 2016
www.jmest.org
JMESTN42351469 4342
The upper and lower limit of the proposed Eq. (7) satisfy in most cases both the transverse period, T1 and longitudinal period, T2 of measured buildings.
- The coefficient Ct=0.07 for the proposed Eq. (7) is less than the corresponding values in most code Ct=0.090. This is due to many factors for specified region such as effects with soil layers, value of elasticity modulus of various materials and the influence of “infill walls”.
It is recommended, to include empirical period formula in Saudi code including plan dimensions DL and DT of the building beside height H.
The comparison between the two proposed equations and that which provided by KSA Code is presented in Fig. 14. From this figure it clear that the two proposed equations give a shorter period than that of SBC code. As mentioned before the SBC code gives a longer period than that of the other international codes (United States ASCE7 (2010), Euro-code (2006)). So, the empirical fundamental period equation provided by SBC code needs revision to get the actual behavior of existing buildings in KSA. The results obtained from the previous figure gives attention for the effect of non-structural elements as infill walls on the dynamic properties of the building and hence give a real idea about the exact behavior of the reinforced concrete building under seismic action.
TABLE 2 FUNDAMENTAL PERIODS OF MEASURED BUILDINGS
Modal Building
ID
NO. Of
Floor
Height
m
Modal parameters
analysis (FFT-LS)
T1
(Sec.)
T2
(Sec.)
Gro
up
2 M
om
ent
resi
stin
g f
ram
e (M
RF
) w
ith s
hea
r w
all
syst
em (
SW
) (M
RF
-SW
)
B-1 19 67 0.735 0.29
B-2 11 36 0.581 0.462
B-3 14 48 0.703 0.58
B-4 14 48 0.708 0.551
B-5 20 70 1.02 0.374
B-6 14 48 0.734 0.615
B-7 14 48 0.63 0.54
B-8 14 48 0.807 0.27
B-9 14 48 0.70 0.45
B-10 14 48 0.677 0.56
B-11 10 34 0.60 0.31
B-12 11 37 0.546 0.468
B-13 10 34 0.662 0.36
B-14 16 53 1.054 0.679
B-16 7 23 0.41 0.312
B-17 11 36 0.661 0.608
B-18 11 36 0.666 0.369
B-26 8 27 0.298 XXX
Gro
up
1
Mom
ent
resi
stin
g
fram
e
(MR
F)
B-15 4 15 0.32 0.27
B-19 8 27 0.414 0.325
B-20 5 17 0.418 0.333
B-21 5 18 0.377 0.29
B-22 6 21 0.32 0.27
B-23 11 34 0.426 0.302
B-24 9 30 0.371 0.278
B-25 5 17 0.291 XXX
B-27 4 15 0.24 XXX
B-28 6 20 0.233 XXX
B-29 4 15 0.193 XXX
B-30 6 20 0.25 XXX
B-31 4 15 0.25 XXX
B-32 4 14 0.167 XXX
TABLE 3 FUNDAMENTAL PERIODS OF MEASURED BUILDINGS
Modal Building
ID
NO.
Of
Floor
Height
m
Modal parameters
analysis (Polymax)
T1
(Sec.)
T2
(Sec.)
Gro
up 2
Mo
me
nt re
sis
ting f
ram
e (
MR
F)
with s
he
ar
wall
syste
m (
SW
) (M
RF
-SW
)
B-1 19 67 0.725 0.295
B-2 11 36 0.575 0.462
B-3 14 48 0.58 0.38
B-4 14 48 0.704 0.23
B-5 20 70 1.02 0.31
B-6 14 48 0.739 0.619
B-7 14 48 0.556 0.175
B-8 14 48 0.803 0.17
B-9 14 48 0.677 0.46
B-10 14 48 0.68 XXX
B-11 10 34 0.60 0.31
B-12 11 37 0.546 0.47
B-13 10 34 0.68 0.36
B-14 16 53 1.07 0.676
B-16 7 23 0.41 XXX
B-17 11 36 0.608 0.481
B-18 11 36 0.664 0.365
B-26 8 27 0.295 XXX
Gro
up
1 M
om
en
t re
sis
tin
g f
ram
e (
MR
F) B-15 4 15 0.32 0.266
B-19 8 27 0.328 XXX
B-20 5 17 0.440 0.33
B-21 5 18 0.368 0.294
B-22 6 21 0.320 0.280
B-23 11 34 0.425 0.303
B-24 9 30 0.217 0.20
B-25 5 17 0.292 XXX
B-27 4 15 0.235 XXX
B-28 6 20 0.233 XXX
B-29 4 15 0.196 XXX
B-30 6 20 0.25 XXX
B-31 4 15 0.25 XXX
B-32 4 14 0.168 XXX
XXX CAN NOT REAL EVALUATED
Journal of Multidisciplinary Engineering Science and Technology (JMEST)
ISSN: 2458-9403
Vol. 3 Issue 3, March - 2016
www.jmest.org
JMESTN42351469 4343
REFERENCES
[1] Al-Nimry, N., Resheidat, M. and Al-Jamal, M. (2014) "Ambient vibration testing of low and medium rise in-filled RC frame buildings in Jordan" Soil Dynamics and Earthquake Engineering Vol. 59, pp. 21–29, DOI: 10.1016/j.soildyn.2014.01.002.
[2] Applied Technology Council (1978), “Tentative provisions for the development of seismic regulations for buildings”, Report No. ATC3-06, Applied Technology Council, Palo Alto, California.
[3] CEN, (2006) Eurocode 8: "Design of structures for earthquake resistance", Part 1: General rules, seismic actions and rules for buildings, Committee European de Normalization, Brussels.
[4] Crawford, R., and Ward, H. S., (1964) “Determination of the Natural Period of Buildings,” Bulletin of the Seismological Society of America, Vol. 54, No. 6, pp. 1743-1756.
[5] Crowley H, and Pinho R. (2010) "Revisiting Eurocode 8 formulae for periods of vibration and their employment in linear seismic Analysis" Earthquake Engineering and Structural Dynamics; Vol. 39 No. 2, pp. 223–235, DOI: 10.1002/eqe.949.
[6] Demetriu, S. and Aldea, A. (2012)"Modal parameters of RC frame structure identified from ambient vibration measurements" 15 WCEE, Lisbon.
[7] Gallipoli MR, Mucciarelli M, Vona M (2009) Empirical estimate of fundamental frequencies and damping for Italian buildings. Earthquake Engineering and Structure Dynamic Vol. 38, pp. 973–988, DOI: 10.1002/eqe.878.
[8] Michel C., Guéguen P., Bard P.Y.,(2008)"Dynamic parameters of structures extracted from ambient vibration measurements", an aid for the seismic vulnerability assessment of existing buildings in moderate seismic hazard regions, Soil Dynamics and Earthquake Engineering; Vol. 28 , No.8, pp. 593-604.
[9] Midorikawa, S.,(1990) “Ambient vibration test of buildings in Santiago and Viña del Mar”, A report on the Chile-Japan joint study project on seismic design of structures, The Japan international cooperation agency.
[10] Negulescu C., Radoi, R., Aldea, A. (2004) "Microtremor measurement for evaluation of building vibration characteristics", Report, National Center for Seismic Risk Reduction, Bucharest, Part 1 - 23p. and Part 2, 20p.
[11] Peeters, B., Vanhollebeke, F., and Van der Auweraer, H., “Operational Polymax for Estimating the Dynamic Properties of a Stadium Structure during a Football Game,” Proc. 23rd Int. Modal Analysis Conference, Orlando, FL, 2005.
[12] Saudi Building Code - Structural requirements for Loads and Forces - SBC 301 (2007).
[13] Trifunac, M. D., (1972) “Comparison between Ambient and Forced Vibration Experiments,” Earthquake Engineering and Structural Dynamics, Vol. 1, pp. 133-150.
[14] Tarek, M. Alguhane (2014) "Monitoring of Buildings Structures in Madinah", Ph.D, Ain Shams University Faculty of Engineering 2014.
[15] UBC (1997) "Uniform building Code" International Conference of Building Officials, USA.