simplification, assistance, and incentives: a randomized ... · simplification, assistance, and...
TRANSCRIPT
Simplification, Assistance, and Incentives: A Randomized Experiment to Increase College Savings
Bridget Terry Long Harvard Graduate School of Education and NBER
Eric Bettinger
Stanford School of Education and NBER
Draft: April 2017
ABSTRACT Research has shown that complex forms and processes can be major barriers to students and families making educational investment decisions. The costs of obtaining, sorting, understanding, and prioritizing complicated information to make a decision and complete a task can be quite high. Interventions and policy reforms have the potential to better support such activities, but while providing simplified information or assistance have been found to encourage some behaviors, they are at times ineffective. This paper extends the literature by focusing on the topic of college savings. Many families do not understand the importance of saving for college, are confused by misperceptions about the effects of saving on financial aid eligibility, and are unaware and unsure how to take advantage of financial options that tax advantages. We investigate the effects of a set of interventions designed to help families understand and prepare for the expense of higher education. Working with the Boston Public Schools, we implemented a series of school and community workshops focused on the parents of 7th to 10th graders that provided information about 529 college savings plans, a tax-advantaged way to save for postsecondary education. Using a RCT design, we offered some families assistance opening a college savings account; another group received this assistance as well as the required opening deposit of $50. In this paper, we evaluate the effectiveness of these different types of supports. Additionally, using survey data from the initial workshop and a follow-up survey completed a couple of years later, we explore families’ perceptions of the importance of saving and how they make savings decisions. The results suggest helping families to start saving for college by providing the initial deposit can have positive long-term effects on savings behavior and postsecondary outcomes. However, information about the importance of savings and savings options is not enough to spur action suggesting complexity and other barriers to getting started are significant.
Contact information: [email protected] and [email protected]. We are grateful for the help provided by Lena Eisen, Melisssa Bert, and Mandy Savitz-Romer; Alex Chewning, Erin Cox, and staff members of uAspire; Julie Shields-Rutyna, Anna Scimemi, and Angelina Mancini of MEFA. The research reported here was supported by the Institute of Education Sciences, U.S. Department of Education, through Grant R305A090204 to the National Bureau of Economic Research (NBER). The opinions expressed are those of the authors and do not represent views of the Institute or the U.S. Department of Education.
Long and Bettinger - A Randomized Experiment to Increase College Savings (April 2017)
1
I. INTRODUCTION
Higher education plays an increasingly important role in helping individuals attain social and
economic success, but financial aid, the primary state and federal policy aimed at improving student
access and affordability, often covers only a small fraction of tuition and other college expenses.
According to figures from the College Board, the average net price at a public, four-year college was
$14,210 in 2016-17. This is defined as tuition, required fees, and room and board minus the average grant
aid and tax benefits received by full-time students. The net price of a private, four-year college was
$26,080 (College Board, 2016). Therefore, even after financial aid, the annual cost of a four-year college
or university is a significant proportion of median family income.
Increasingly, families are encouraged to recognize the potential gap between financial aid and
college costs—and to save for themselves. A range of savings vehicles have been promoted to help
families save with the most prominent being 529 Savings Plans, which allow families to save money for
college and accrue investment benefits that are mostly tax-free. All states have some type of 529 college
savings plan, and at least 30 states offer 529 plans that provide tax deductions (CFED, 2016). However,
while politically popular, few families actually take-up these plans to save for college, especially among
middle- and lower-income families. According to the Survey of Consumer Finances, less than three
percent of families used either a 529 plan or a Coverdell Education Saving Account, another college
savings vehicle, and families with accounts had 25 times the median financial assets of those without
(GAO, 2012). While college savings plans have the potential to provide substantial benefits, the families
that need the most help meeting the gap between the cost of college and financial aid available are not
taking advantage of these financial products and programs.
Little is known about the best way to design these types of policies, why low and moderate-
income families do not respond to these opportunities, or whether the plans are beneficial to families in
the long run. Some suggest non-participation may be due to factors similar to those identified with social
programs, including a general lack of awareness of the benefit or program (Bhargava and Manoli, 2015),
complexity of programs and applications (Beshears, et al., 2006 and 2013; Huang, et al., 2013; Shipman,
2016), and general procrastination (O’Donoghue and Rabin, 1999). Additional research specific to
college affordability suggests that families often lack information about the true costs of college (Grodsky
Long and Bettinger - A Randomized Experiment to Increase College Savings (April 2017)
2
and Jones, 2007; Hoxby and Turner, 2013; Oreopoulus & Dunn, 2012), have misperceptions about the
effect of savings on financial aid (Dynarski, 2004; Black and Huelsman, 2012), and simply lack the
disposable income necessary to save for many needs, including post-secondary education (Kim, et al.,
2014; Sallie Mae, 2015).
Our project aims to fill this gap by testing a series of interventions designed to determine the best
way to help families prepare for the expense of their children’s college educations. Given that
information, complexity, and procrastination are three of the key obstacles in establishing accounts, the
Early College Planning Initiative (ECPI) introduced different levels of support according to these
obstacles. ECPI provided three different interventions in a randomized experimental design to the
families of Boston-area students in grades 7 to 10. The first intervention provided information and
increased awareness of college savings options; the second simplified the enrollment process; and the
third provided additional incentives to encourage savings behavior (and hence reduce procrastination in
future deposits).
Using data from ECPI and the subsequent tracking of savings behavior and postsecondary
enrollment, we examine three related research questions. First, how does information about college
savings options and simplifying the enrollment process affect the likelihood that families enroll in such
plans and put away money for their children or themselves? Second, do starter incentives affect the
likelihood and amount contributed by families to college savings accounts? Finally, does enrollment in a
college savings plan alter families’ long-run college savings behavior and enrollment? Our results
suggest that parents have substantial interest in college savings; however, information and assistance are
not enough to help them engage in savings. When we combined information, assistance, and incentives,
we found lasting changes—the likelihood of having an account increased from 8 percent to nearly 32
percent – a 400 percent relative increase. Moreover, families that opened accounts were more likely to
start making monthly contributions to college savings accounts. Longer term, the children of families
randomly placed in the assistance and incentive group were more likely to attend a four-year college and
to attend college full-time, suggesting college savings is an important factor in future educational
outcomes.
Long and Bettinger - A Randomized Experiment to Increase College Savings (April 2017)
3
II. BACKGROUND AND LITERATURE REVIEW
Review of the Literature
Our research intersects with multiple literatures from economics and education. Given that the
purpose of 529 plans is to improve college affordability, our research is primarily related to the extant
literature demonstrating the importance of college price and financial aid in college decisions. Much of
this literature attempts to identify the impact of price and financial aid on eventual attendance and finds
that reducing price with financial aid increases college enrollment (Deming and Dynarski, 2010; Dynarski
and Scott-Clayton, 2013). One feature in this literature is that the aid programs that are most successful
are those that are well-publicized and relatively easy to understand and to apply for (Dynarski, 2000;
Cornwell, Mustard, and Sridhar, 2006; Long, 2007). This has also been found in the examinations of
other social programs, such as welfare and food stamps. For example, Currie (2004) finds that the take up
rates on social programs are increased when eligible participants are automatically enrolled and
administrative barriers are reduced. In terms of savings plans, universal and automatic enrollment (Zager,
et al., 2010; Clancy and Sherraden, 2014), “seeded” accounts from state, federal or private funding
sources (Beverly, et al., 2015), and providing periodic matches to family contributions (Mason, et al.,
2010) seem to improve program participation.
Our research is also related to the economic behavioral literature, which emphasizes how
reframing and other “nudges” might alter individuals’ participation in programs that would benefit them.
Interventions focused on simplification and altering defaults have been shown to have important effects
outside of education (Beshears, et al., 2009 and 2013). These findings also extend to education decisions.
For example, Bettinger, et al. (2012) shows that providing information and personal assistance with
complex processes can improve the likelihood that students successfully apply for college. Providing
informational reminders and offering assistance can also help students complete forms to renew financial
aid awards (Castleman and Page, 2016). Hoxby and Turner (2015) demonstrate that simple informational
outreach and fee reductions can lead to substantial differences in college application and enrollment
patterns.
Despite the interest in improving the accessibility of college savings programs (e.g. Clancy, et al.,
2016), there have been few rigorous research initiatives examining the effect of information, assistance
Long and Bettinger - A Randomized Experiment to Increase College Savings (April 2017)
4
and incentives on college savings behavior and subsequent enrollment and degree attainment outcomes.
The majority of studies that do exist rely heavily on small samples and secondary data analysis.
Moreover, there is limited causal evidence to demonstrate the impact of savings programs or their
individual features on the subsequent savings and enrollment outcomes. However, descriptive and
correlational analyses suggest that dedicated college savings may be linked to stronger academic
performance (Destin and Oyserman, 2009), enhanced college-going aspirations (Elliott, 2013; Elliott, et
al., 2011), higher college enrollment (Elliott and Beverly, 2011), greater persistence to postsecondary
graduation (Nam and Ansong, 2015), and reduced amount of student loan debt (Elliott, et al., 2014),
particularly among low-and moderate income families. Studies also suggest positive outcomes such as
enhanced social and emotional development in children (Huang, et al., 2014: Cowan, 2011), mitigation of
the potential harmful effects of material hardship (Wikoff, et al., 2015; Huang, et al., 2016), and
increased financial awareness and capacity (Friedline, 2014; Nam, et al., 2013; Kim, et al., 2014). This
project attempts to contribute to this literature by providing causal evidence on the effects of supports on
college savings and postsecondary outcomes.
Background on 529 College Saving Plans
For college savings, 529 Plans are the most common, flexible, and potentially beneficial option
(Dynarski 2004). Other options are subject to more requirements and offer less in potential returns.1 The
529 Savings Plans are instruments that allow families to invest their after-tax college savings in the
market while enjoying tax benefits. The minimum amount needed to open an account is often much lower
than that required by most mutual funds meaning that this is an option that is more affordable and
accessible to low-income families.
States administer and manage 529 Savings plans. All states offer some sort of 529 Savings Plan
and, while each state determines the specifics of its plan, families are free to enroll in a 529 plan in any
1 While the federal Coverdell Education Savings Accounts have much lower contribution limits, unlike 529 Savings Plans, there are income requirements for participation. Prepaid tuition plans, which are also governed under the 529 legislation, guarantee that a family's savings investment will increase at the same rate as in-state college tuition, which may be less than the returns available in the market. Prepaid Tuition Plans also have more limitations, such as requiring the account owner or beneficiary to be a state resident when opening the account. Coverdell Education Savings Accounts and Prepaid Tuition Plans are also treated differently in financial aid need analysis.
Long and Bettinger - A Randomized Experiment to Increase College Savings (April 2017)
5
state. Most states also treat 529 Savings Plans favorably in terms of taxes.2 Currently, 30 states and the
District of Columbia offer a state income tax deduction for 529 contributions and three states offer a tax
credit to families. However, low to moderate-income families are less likely to benefit from the tax-
related provisions in 529 plans and may be less likely to participate without meaningful incentives. To
address this need, multiple states have enacted plan provisions to offer incentives or remove barriers for
low- and moderate-income families to participate in college savings initiatives. As of January 2016, 17
states offer a no-fee option, eight states have plans with no minimum deposit requirements, and 14 states
provide a seed deposit or match for low- and moderate-income families (CFED, 2016).
Among other features determined at the state level is the set of investment options available to the
family for investment. Although these investments involve some market risk, they offer the potential of
larger returns compared to other savings options such as Prepaid Tuition Plans. By limiting the number of
investment choices, 529 Plans may simplify the process for parents who do not have the expertise or time
to manage their investments. Most plans offer options that adjust the allocation of assets according to the
age of the child – the money is put into less risky instruments as the child gets older and approaches
college.
There are several advantages of 529 Savings Plans over other savings options, including the ease
of transferring a 529 Savings Plan to a related beneficiary, freedom from restrictions on the college at
which the money is used (as long as the institution is accredited), and the opportunity for friends,
relatives, and colleagues to contribute to an account. Another important difference between the 529
Saving Plans and a Coverdell or Prepaid Tuition Plan is that 529 Savings Plan holdings are treated as an
asset of the account holder (usually the parent) rather than the child. As parental assets, contributions to
529 plans are assessed at a much lower rate than student-held assets, which are assessed at a flat rate of 35
percent during the financial aid needs analysis process. The assets of the parents may be further subject to
an asset protection allowance based on the age of the parents. While 529 Savings Plans do not greatly
impact financial aid eligibility, disbursements from the 529 Prepaid Tuition Plans reduce eligibility for
financial aid 100 percent for each dollar of benefit. In addition, distributions from a parent-owned 529
2 Like the federal government, most states let the earnings accumulate on a tax-deferred basis and exempt the use of the funds from state and local income tax if used for qualified higher education expenses. This treatment may be limited to the use of a state's own 529 plan.
Long and Bettinger - A Randomized Experiment to Increase College Savings (April 2017)
6
Savings Plans are not treated as untaxed income and thus do not impact federal aid eligibility. Work by
Dynarski (2004) documents the result of this difference on the benefits received by families. She shows
that the benefits of 529 Savings Plans can be larger than what many families would receive from a
Coverdell Educational Savings Account due to differences in the treatment of the two saving plans by the
income tax code and financial aid system.3
Some suggest that certain families, particularly low-income ones, may be better off not saving at
all as it is perceived that asset accumulation reduces college financial aid eligibility. In practice, a
significant amount of assets is exempt from need-based aid formulas, and lLow-income families are
extremely unlikely to have enough assets to influence aid eligibility. However, asset accumulation can
adversely impact eligibility for a number of public assistance programs that enforce asset limits. To
address this barrier, some states have eliminated asset tests for major assistance programs and many
others states have exempted educational savings accounts from asset tests.
The Early College Planning Initiative
ECPI arose as a result of collaboration between uAspire, a major college access program in
Boston, the research team, and the Massachusetts Educational Financing Authority (MEFA), the non-
profit state agency responsible for Massachusetts 529 Program, and the research team. With funding
from the U.S. Department of Education, we collaborated in designing a program which could provide new
information about college savings. In 2012 and 2013, ECPI implemented three different interventions in
a randomized experimental design. We invited the parents of 7th to 10th graders to attend an informational
workshop focused on how families can prepare for college both academically and financially. We
explained to parents who attended that this is an initiative focusing on helping families learn more about
postsecondary options and how to prepare for higher education. We informed the parents that we were
also interested in learning more about whether and how parents decide to save for college. ECPI then
3 Using simulations, Dynarski (2004) finds that pretax income invested in a Coverdell could face income and aid taxes that would consume the entire principal, all of the earnings and an additional several hundred dollars.
Long and Bettinger - A Randomized Experiment to Increase College Savings (April 2017)
7
collected consent from the parent(s) to participate in the research project and asked them to complete a
background survey.4
Families were randomly assigned into one of three groups. Approximately one-third of families
were placed into the control group, which participated in the informational workshop about the
importance of higher education and how to prepare academically and financially. While this is not a
completely untouched control group, based on past research, we (correctly) forecasted that information
alone, without additional assistance, would not affect the likelihood of participating in a college savings
program. The two treatment groups were designed to address hypotheses about the challenges of
participating in a 529 savings plan—awareness and complexity—as well as providing some families with
a financial incentive as a catalyst toward starting a program of college saving. The two treatment groups
were:
(1) Simplifying the Enrollment Process for the Massachusetts College Savings Plan (U.FUND)
For these individuals, ECPI provided the same general information as the control group. In
addition, they offered a simplified and streamlined way of enrolling in the Massachusetts 529
Plan (U.FUND) on-site. This first treatment focuses solely on information and complexity
barriers and allows us to test the effects of simplification and assistance in this context.
(2) Simplifying the Enrollment Process and Providing the Initial Enrollment Funds
The second treatment group was identical to the first except that we also contributed the initial
balance necessary to open a Massachusetts 529 Plan ($50). This treatment is similar to initiatives
in many states to provide monetary incentives in the hope of encouraging participation in college
savings plans. This small startup incentive may have made opening an account more attractive,
and for families that decide to participate, we investigate whether having a college savings
account encourages additional investments in the future.
4 Parents that did not speak English well were not included in the project due to concerns about their ability to give informed consent and understand the 529 financial forms. However, when informed by the host school ahead of time about the possibility of such a group attending the event, we planned ahead by creating a fourth room that could give the workshop information in the first language (usually Spanish). Opening a 529 account is also limited to citizens, so for undocumented families, we focused on disseminating information about how to prepare for college academically but did not include them in the project.
Long and Bettinger - A Randomized Experiment to Increase College Savings (April 2017)
8
All families electing to open a 529 account with us had their funds invested in the Massachusetts
529 College Savings plan, the U.Fund, and their deposit was put into the FDIC-insured option so there
was no investment risk to losing the money. Because we did not want to exert undue pressure on
families, they had up until a month after the event to submit their paperwork using a self-addressed
stamped envelope, and those in the second treatment group would still receive the $50 opening deposit.
After opening an account, participants started to receive the usual quarterly statements from Fidelity
Investments about their accounts, and parents were free to make future changes to their account, including
changing the investment account or closing the account altogether.
Since the ECPI workshops, we have been tracking family savings behavior in the U.Fund by
conducting data matches with Massachusetts Educational Financing Authority (MEFA), the state
authority that manages the 529 program, and Fidelity Investments, the company that manages and invests
the funds. Also, most of the students would have finished high school on time by spring 2016, and so we
use college enrollment data from the National Student Clearinghouse to determine postsecondary
outcomes as of fall 2016. Finally, ECPI gathered survey data from families both pre-intervention (at the
workshops) and post-intervention (via email and mail) to better understand participant perceptions about
college cost, preparation, and financial aid. We also collected information on parent and student
demographics, use of savings products other than 529 accounts, family income, and parental education
level. This survey data helps us to interpret the empirical results and learn more about family perceptions
and understanding of savings and their savings behavior outside of the Massachusetts 529 program.
III. DATA AND EMPIRICAL STRATEGY
The Data: Sample Characteristics and Randomization
Table 1 displays the characteristics of the sample and tests for differences in the control and
treatment groups as a result of randomization. The first column gives the means for the control group.
As reflected by the fact that the project primarily recruited families with children in the Boston Public
Schools, a substantial proportion of the sample is Black (46.7 percent), Hispanic (12.0 percent), or Asian
(17.7 percent). Reflecting the high level of education in the Boston area, a majority parents have at least
some postsecondary education, though family incomes vary considerably in the sample from being very
Long and Bettinger - A Randomized Experiment to Increase College Savings (April 2017)
9
low (15.8 percent of families had incomes under $20,000 at the time of the workshop) to being well above
median family income in the United States (9.2 percent had incomes above $100,000 at the time of the
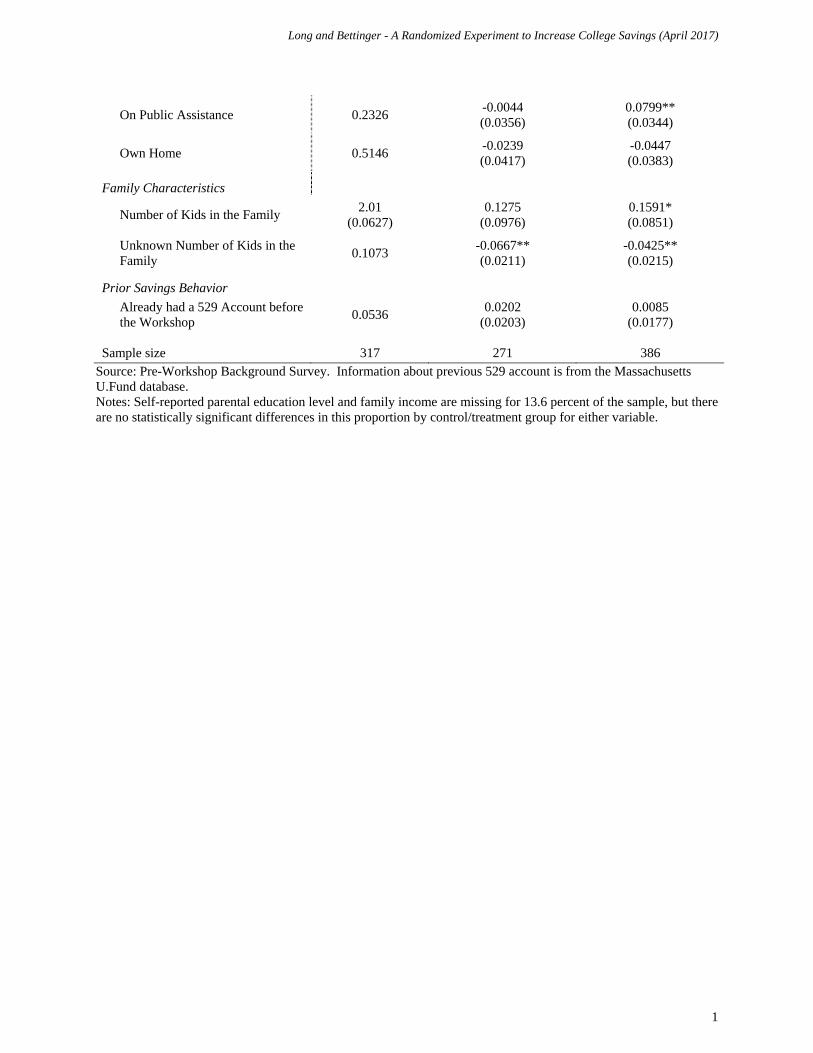
workshop). The proportion of families on public assistance (23.3 percent) versus owning their own
homes (51.5 percent) also reflects the fact that the workshop participants represent a broad range of
families in terms of socioeconomic status. This is likely due to the fact that participation in the project
involved parents attending an option workshop, so that while many families in the Boston Public Schools
are low- or moderate-income, the propensity to attend a workshop was likely higher among more affluent
families thus resulting in a broad sample.
The project targeted families with children in grades 7 to 10, and this is mainly who we served as
reflected by the average grade at the time of the workshop (8.5). However, because the information was
given to the parent for the benefit of all their children, we also attempted to capture information about
siblings who might have also impacted by the intervention materials.5 Based on the pre-workshop survey,
families had on average 2 children, and the children tracked over time ranged from being in grade 5 to
grade11 at the time of the intervention. In our analysis below, we sometimes distinguish between the
results for the full sample (including these older and younger siblings) and the target sample (limiting the
analysis to those who were in grade 7-10 at the time of the workshop). Finally, on the pre-workshop
survey, we asked parents if they had a 529 college savings account from any state. Confirming the
findings of previous research, very few families with children in high school had used such an instrument
(5.4 percent). Our results here explore the reasons why this percentage is so low.
The last two columns of Table 1 test whether there are differences in the observable
characteristics of the control group versus the two treatment groups. T-tests were conducted for each
variable, and statistical significance is denoted by the asterisks. As demonstrated by the lack of statistical
differences, the randomization process was largely successful in creating similar groups. The control
group contains slightly more Asian students. Meanwhile, Treatment Group 2 (which received assistance
and the opening deposit) has students who were on average in a slightly higher grade level at the time of
the workshop, a larger proportion of families on public assistance, and more kids per family. While we
5 For families in Treatment Group 2, we gave the parents access to the $50 deposit for any child in the target grades (7-10). Children outside the eligible grades did not receive the deposit amount, but their parents we still helped with the 529 account forms regardless of child age.
Long and Bettinger - A Randomized Experiment to Increase College Savings (April 2017)
10
keep these differences in mind, there is little reason ex-ante to suspect variation across groups would
favor us incorrectly concluding that the interventions have been effective. It is important to note that as
the project progressed, we altered the relative size of each group so that while randomization was
maintained at each event, the relative proportion put in the control group versus treatment group 1 or 2
changed, with slightly more families being put in treatment group 2 at later events to help insure our
ability to explore the effects of the incentive longer term ad to use project funds as expansively as
possible.
Empirical Strategy
Our empirical design relies on the randomized assignment of families to the control or one of two
treatment groups. Because ECPI used randomization to assign families to treatments, simple comparisons
of students in the various treatments can identify the causal effects of the interventions. Our control group
(i.e., those receiving a general information package about saving for college with information already
publicly available) are compared to our treatment groups (those receiving assistance to open a 529 plan
and those receiving an additional financial incentive for startup).
We investigate three types of outcomes. The first focuses on the take-up of a college savings plan
at or shortly after an ECPI workshop. Second, we investigate subsequent savings behavior by tracking
saving balances and the use of automatic monthly contributions, an option offered by U.Fund to help
families maximize their savings. Finally, over the long term, we examine college enrollment and choice
patterns, including the level of postsecondary institution (two- or four-year) and the intensity of
attendance (full- or part-time).
To estimate the effects of our intervention on 529 plan take-up, we use the following regression:
(1) 1 2
where y is an outcome for individual i. T1 and T2 represents an indicator for being randomly assigned to
either the first treatment (information and assistance) or the second treatment (information, assistance,
and incentives). We include additional controls, X, for student and parent characteristics.
Long and Bettinger - A Randomized Experiment to Increase College Savings (April 2017)
11
In our analysis, we are sensitive to the potential for correlation within observations. For example,
within a school, families get similar resources and interact with the same counselors. Moreover, families
attending the same event, which often happened at their school, might share information across control
and treatment groups. We control for correlation among observations first by accounting for the specific
event that an individual attended by clustering at that level. For a robustness check, we can alternatively
cluster at the school of attendance level given some of the ECPI events occurred at community-based
sites, such as local libraries.6
The “treatment-on-the-treated” effect of college enrollment from 529 plan take-up can be
estimated using an instrumental variables approach; treatment group assignment would be used as an
instrument for using a 529 plan. Under the assumption that the program effect for families that do not take
up a 529 plan is zero, the average effect of the program on college enrollment among those that do take
up a plan can be estimated with the following regression:
(2)
Where 529_TAKEUP indicates whether individual i has a 529 plan by the time a child is college age, and
is instrumented by the variables T1 and T2.
IV. RESULTS
Descriptive Results
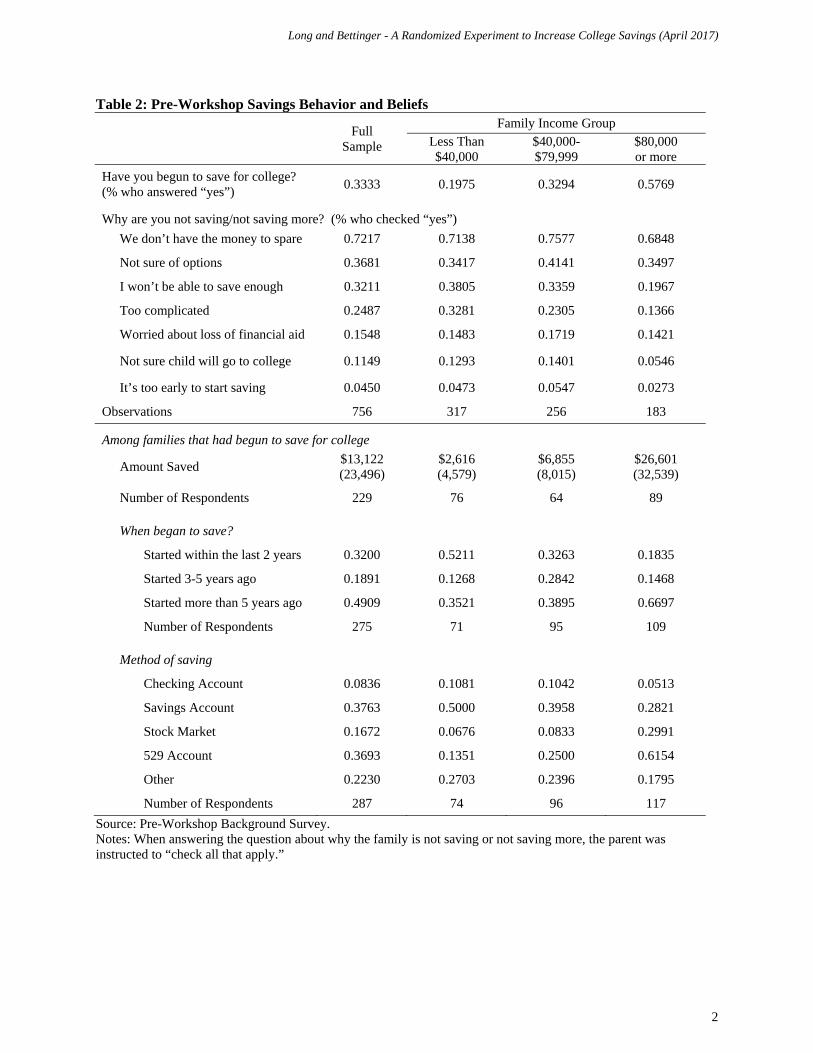
Table 2 summarizes some of the responses by parents before the workshops and interventions
took place.7 The survey aimed to not only collect background information but also to explore prior
savings behavior and beliefs. According to the self-reported information, only one-third of parents had
already begun to save for college by the time their kids were in 7th to 10th grade. As broken down in the
table, there were large differences by family income, with higher-income families being much more likely
6 Additionally, we can observe the zip codes in which all of the students in our study reside. Therefore, we can control for correlation between households in the same geographic area as an alternative approach. 7 Due to the fact that some parents have multiple children it the project, the number of survey respondents is less than the total sample of students. Moreover, some parents elected not to answer all of the questions or were not asked certain questions due to skip logic built into the survey. For example, if the parent did not denote having started to save, then he/she was not asked about the method of saving.
iiii ebXTAKEUPy 210 _529*
Long and Bettinger - A Randomized Experiment to Increase College Savings (April 2017)
12
(nearly three times) to have started saving than lower-income families (57.7 percent versus 19.8 percent,
respectively). When asked why they were not saving at all or saving more, most parents responded that
they did not the money to spare (72.2 percent). Other important explanations included not being sure of
saving options (36.8 percent) and the process being too complicated (24.9 percent). Others noted that
they thought it was too late to start saving (32.1 percent).8 Very few parents admitted that they were not
saving because they did not believe their child would go to college (11.5 percent).
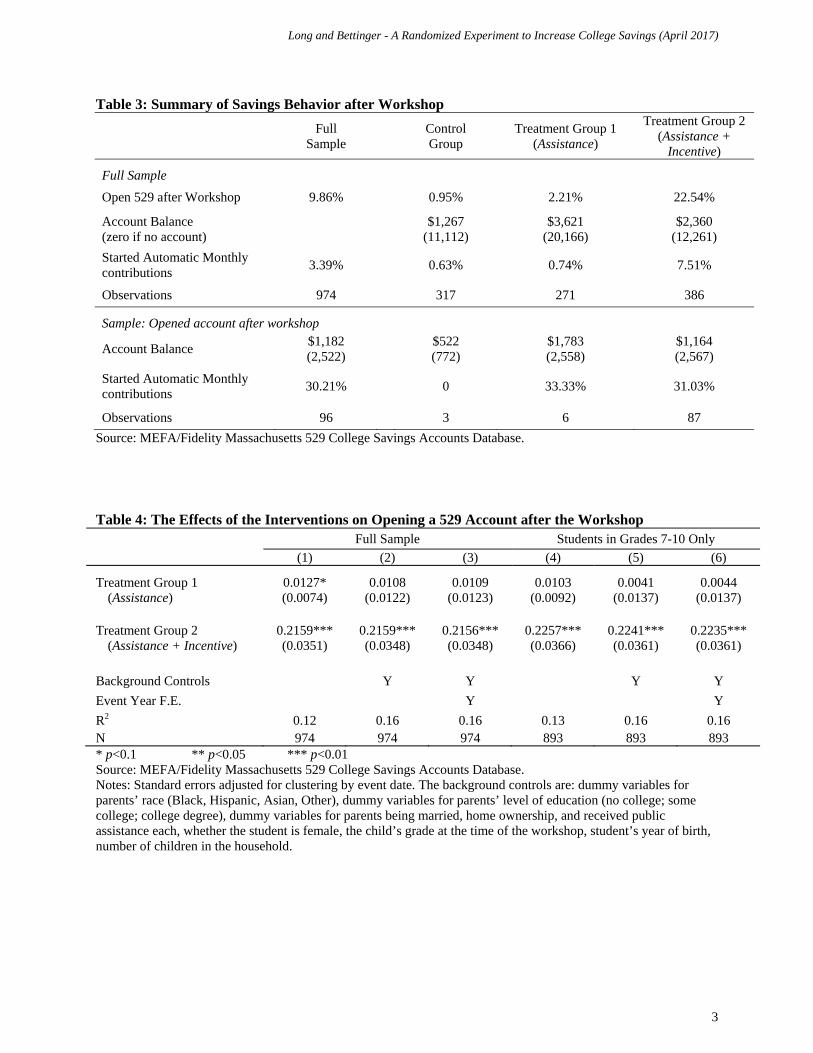
Table 3 shows descriptive statistics of the outcomes from the intervention workshops. The top
half of the table focuses on the full sample. The first row shows the take-rate—whether the parent opened
a 529 account as a result of our visit. Overall, around 10 percent of the sample opened a Massachusetts
529 account after the workshop. However, this is almost exclusively focused within Treatment Group 2,
which received both assistance with the form and the $50 initial deposit. With this group, 22.5 percent of
families accepted our offer to open a U.Fund account. Only 1 percent of the control group and 2.2
percent of Treatment Group 1 did so, suggesting that information and even assistance with the form is not
enough to get families to start saving for college with a 529 account. This given an early indication of the
effectiveness of providing families with the initial deposit.
Since the initial workshop, we have continued to track activity with the Massachusetts 529
program (i.e., the U.Fund). As of July 2016 (three to four years after the initial workshop), we find that
the treatment groups had much higher college saving balances. The mean is higher for Treatment Group
1, which is due to the fact that one family has a balance over $100,000, but Treatment Group 2 had saved
almost double that of the Control Group.9 Interestingly, about a third of families in Treatment Group 2
who opened a 529 account also elected to sign up for automatic monthly contributions to that account.
Setting up such routine deposits is thought to be an important way to accumulate savings, and it is
8 The original grant proposal for the project aimed to target families with students entering kindergarten, but we received feedback that it would be important to get college outcome data, and starting at such a young age would make this prohibitive. In our informal discussions with project participants, we did often hear that they would have liked to have had the college savings information earlier, and we suspect this is an important practice. However, among our many goals, our project is testing whether starting to save when children is older is still impactful. 9 This outcomes is calculated for all families with a Massachusetts 529 account, whether they opened the account after a workshop or not. The reason is that our workshop might have had a positive effect on the rate of savings for families who already had an account by reminding them of the benefits of doing so. In the case of Treatment Group 1, the family with the account over $100,000 had started saving before coming to a workshop. The amount of savings is at the extreme and masks interpretation of the results so future results on savings balances focuses on families with accounts below $100,000.
Long and Bettinger - A Randomized Experiment to Increase College Savings (April 2017)
13
interesting to see families do this without receiving any special information from us. This project some
early suggestive evidence that once entering the 529 system, it becomes easier for families to engage
without additional assistance or incentives.
The bottom panel of Table 3 focuses on the behavior of families that opened 529 accounts after
the workshops. Among this group, the treatment groups have saved substantially more and are much
more likely to start saving automatically each year. However, the number of observations for each group
make clear that the action is primarily focused among families in Treatment Group 2.
The Effects of the Interventions on College Savings Outcomes
Tables 4 through 6 examine the effectiveness of the interventions using regression analysis. Due
to the randomized design of assigning treatment, a simple comparison of the outcomes by group gives a
good sense of the effects of the interventions (as shown in specification 1). However, to improve
precision of the estimates and to account for small differences in observable characteristics, additional
models include controls for parent and student background. We also include event-year fixed effects, and
the standard errors are adjusted by clustering at the event-date level.
Table 4 confirms the earlier descriptive results: families in Treatment Group 2, which received
assistance with the 529 account form and the $50 initial deposit, were much more likely to open a U.Fund
account. For the full sample, they were 21.6 percent more likely to open an account, and this result does
not change whether using the background controls or not. When limiting the analysis to the target group,
i.e., students in grade 7 to 10, the results become a little larger magnitude (22.4 percent) and remain large
and statistically significant. Given almost no one in the information-only group (i.e., the Control Group)
and those who received just assistance (i.e., Treatment Group 1) did not open a 529 account, all else
equal, this yet again confirms the importance of making it as easy as possible to open an account by
providing the initial deposit. It is not clear whether the $50 acted as an incentive that spurred action or
whether the fact families did not initially have to do anything to get an account is the reason for the higher
take-up rates among Treatment Group 2, but regardless, it was a far more effective strategy, and to
preview the results below, for many families, the initial $50 helped get them started on further action. Of
those who previously had 529 accounts before participating in our project, most chose to invested in the
Long and Bettinger - A Randomized Experiment to Increase College Savings (April 2017)
14
“time horizon” funds, which assume the family will begin to withdrawal funds in 2015 according to the
age of the child beneficiary.
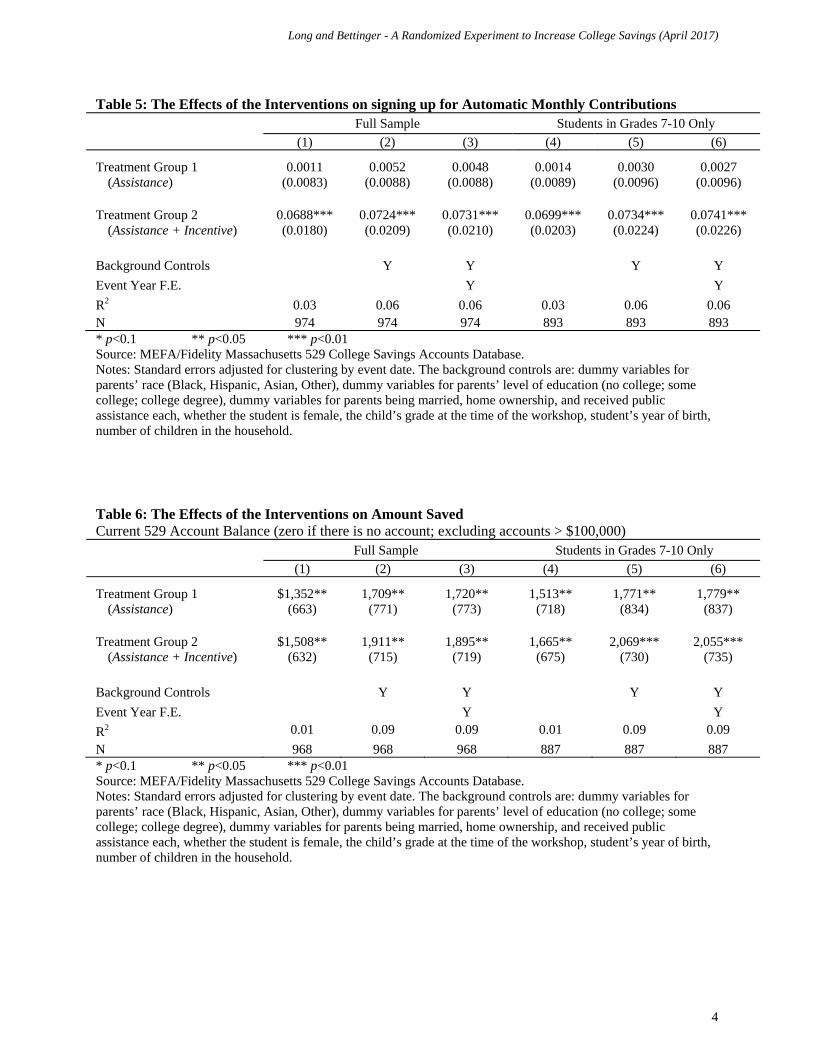
Table 5 uses regression analysis to examine the effects on signing up for automatic monthly
contributions, which could be as low at $15/month for the U.Fund. As shown for all the specifications,
whether using the full sample or just focused on students in grades 7 to 10 at the time of the workshop,
families in Treatment Group 2 were much more likely to engage in the practice (approximately 7 percent
more likely). Doing so would have taken initiative by one of the parents, suggesting that the barrier to
signing up for an account is large, but once having an account, engaging in additional savings behavior is
much easier. This may be due to the fact that families receive quarterly statements from Fidelity
Investments and the offer to contact plan representatives with questions or changes. It also becomes
much easier to make future deposits, as reflected by the results in Table 6. Focusing on accounts less than
$100,000, the treatments groups were much more likely to save than the Control Group. For those in
Treatment Group 2, the account balance by July 2016 was over $2,000 more.
Early Postsecondary Outcomes
Ultimately, the most important outcome of participating in college savings projects is actual
postsecondary enrollment. Given the initial workshops took place in 2012 and 2013 for students in 7th to
10th grade, about half of the group has now had the chance to graduate from high school on time by spring
2016.10 The college outcome data we have is from a match to the National Student Clearinghouse (NSC)
for enrollments up until Fall 2016, and these early results are shown in Table 7 and 8. The tables examine
enrollment in any postsecondary institution that is part of the NSC; attending a two-year versus four-year
institution, and enrollment intensity (i.e., attending full-time as opposed to part- or less-than-part-time).
In defining the outcome, we focus on the first enrollment, i.e., whether the student initially entered a two-
or four-year college. Given differences in the costs of colleges by level and enrollment intensity, we
interpret a greater propensity to enroll in a four-year institution or at full-time status to suggest more
10 The college-eligible students are: (a) those who participated in the workshop during the 2011-12 school year and were in grades 8 to 10; (b) those who participated in a workshop during the 2012-13 school year and were in grades 9 and 10; and (c) those who participated in a workshop during 2013-14 and were in grade 10.
Long and Bettinger - A Randomized Experiment to Increase College Savings (April 2017)
15
expensive investments, which also tend to be associated with a higher likelihood of postsecondary
success.
In Table 7, we do not see many statistically significant results among the 406 students who were
eligible to attend college. This is likely due to insufficient sample size, which should improve as more of
the sample is given time to make their way through high school. In terms of general patterns, we do not
see a difference in the likelihood that Treatment Group 2 (i.e., the group most affected by the
interventions) went to college relative to other groups, but they are less likely to attend a two-year
college—presumably four-year college attendance increased, which is suggested by the positive
coefficients in specifications 5 and 6 (though these results are not statistically significant). The sign of the
coefficients also suggests a higher likelihood of full-time enrollment.
Table 8 estimates the results conditional on college enrollment. In other words, it examines
college choice among those who decided to enter college. Here, we do see statistically significant
differences in postsecondary enrollment patterns for Treatment Group 2 relative to the other groups.
They are 11 percent less likely to attend a two-year college and 8 percent more likely to choose a four-
year college—this suggests more expensive investments, perhaps enabled by the family having more in
financial resources through savings. There is also suggestive evidence of students in Treatment Group 2
being more likely to attend full-time, but the result is not statistically significant. With time and a larger
sample size, these differences may become significant.
V. ADDITIONAL EVIDENCE: RESULTS FROM THE FOLLOW-UP SURVEY
We also administered a follow-up survey to gain additional insights into the behavior and
thoughts of our participants. The primary goal of the follow-up survey was to capture information on
college savings in vehicles other than the Massachusetts 529 account, but our secondary goal was to
gather additional data regarding factors influencing 529 account take-up, financial resources of
participants, and post-secondary financial aid awareness/knowledge. The follow-up surveys were
distributed to the participants who had indicated consent to be contacted again and could only be sent if
the participant had a valid email or current mailing address in our data. We offered an incentive of a $20
Long and Bettinger - A Randomized Experiment to Increase College Savings (April 2017)
16
electronic gift card upon completion and submission of the survey. Overall, 336 follow up surveys were
completed from the 723 of the eligible participants. This is a response rate of 46.5 percent.11
As expected, students in our households were older and some had already enrolled in college
(32percent) or completed a degree program (12 percent). Representation of students in grades 10-12 was
consistent with our students aging up from our initial Parent Background Survey with a fairly even
distribution. Female members of the household overwhelmingly were the respondents to the follow up-
survey (83 percent). Home ownership rose to 54 percent, yet 46 percent of our respondents indicated an
annual family income of less or equal to $50,000.
As only about a third of the original ECPI workshop participants completed a post-survey (nearly
47 percent of those for whom we had good contact information and permission to re-contact). It is
therefore important to note that while we still were able to collect a great deal of valuable information, the
pre- and post-survey samples are not exact comparisons. Some of the differences we see between the two
surveys has to do with the fact that the underlying characteristics of each sample are different—i.e., while
everyone completed the pre-survey, only a subset of parents completed the follow-up survey. It is also
important to mention that changes over time are not necessarily attributable to our interventions. For
example, awareness of different financial aid programs appears to have increased over time. That may be
due to the fact that the children of the participants have gotten older, and as they have approached the
college enrollment decision, parents have learned more about specific programs. There is also evidence
to suggest that families have continued to participate in various college access workshops, which may
also influence their knowledge, perceptions, and savings behavior.
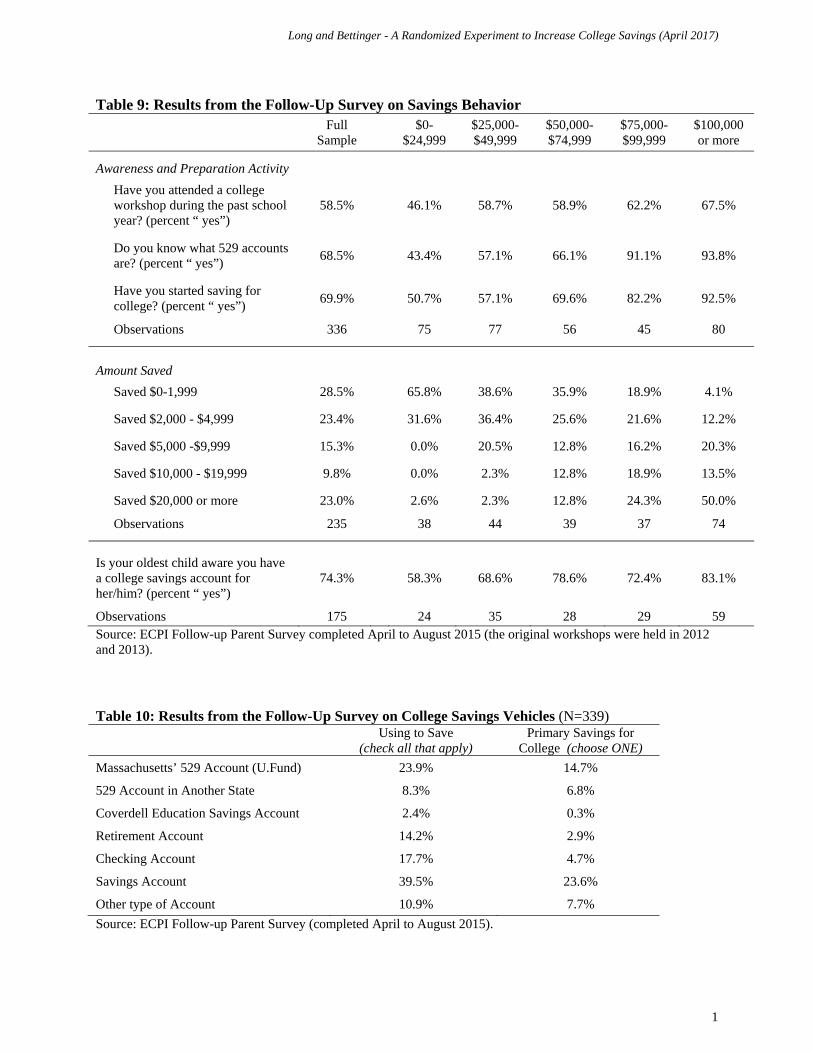
Table 9 summarizes some of the post-survey results. Overall, post-survey families reported
greater awareness of financial aid (e.g., the FAFSA and the Pell Grant) and there was a substantial
increase in the percentage of families who reported that they had started saving for college, from only
35.3 percent at the time of the original workshop to 68.5 percent by the time of the follow-up survey.
However, family income remains an important factor. While 50.7 percent of our lowest income bracket
had started saving, two-thirds of those families reported having saved $2,000 or less. Conversely, half of
those in the highest income bracket reported saving mover then $20,000.
11 Of this sample, 236 participants responded via Qualtrics, utilizing either an online computer or a smartphone internet connection, and 91 responses were received via mail as paper surveys.
Long and Bettinger - A Randomized Experiment to Increase College Savings (April 2017)
17
Table 10 documents that fact that the Massachusetts 529 program, and 529 accounts in general,
are not the only way families save for college. While this project has focused on the 529 College Savings
program given the intent of the policy to provide incentives to family, our survey results suggest that
many parents still choose other instruments for their college savings. Many families use regular savings
account (39.5 percent) and nearly a quarter using regular savings accounts as the primary vehicle to save
for college. This suggests that bank savings accounts continue to be favored by the majority of families
not only for general savings, but also for dedicated college savings. The highest income bracket
($100,000 or more) in our survey was the only group to favor 529 plans, followed closely by bank
savings accounts. Also, given families can participate in the 529 account of any state, 8.3 percent have a
529 account in another state. Less popular are Coverdell Education Savings Accounts, though some
choose retirement or checking accounts.
While one would naturally expect lower-income families to save less and higher-income families
to save more, our observations and experiences suggest that obstacles for saving go beyond income and
financial vulnerability. Many lower income families may lack the cultural capital or college financial
awareness necessary to open an account and save. In other words, families who may be navigating the
college pipeline for the first time may also be navigating financial products and concepts for the first time.
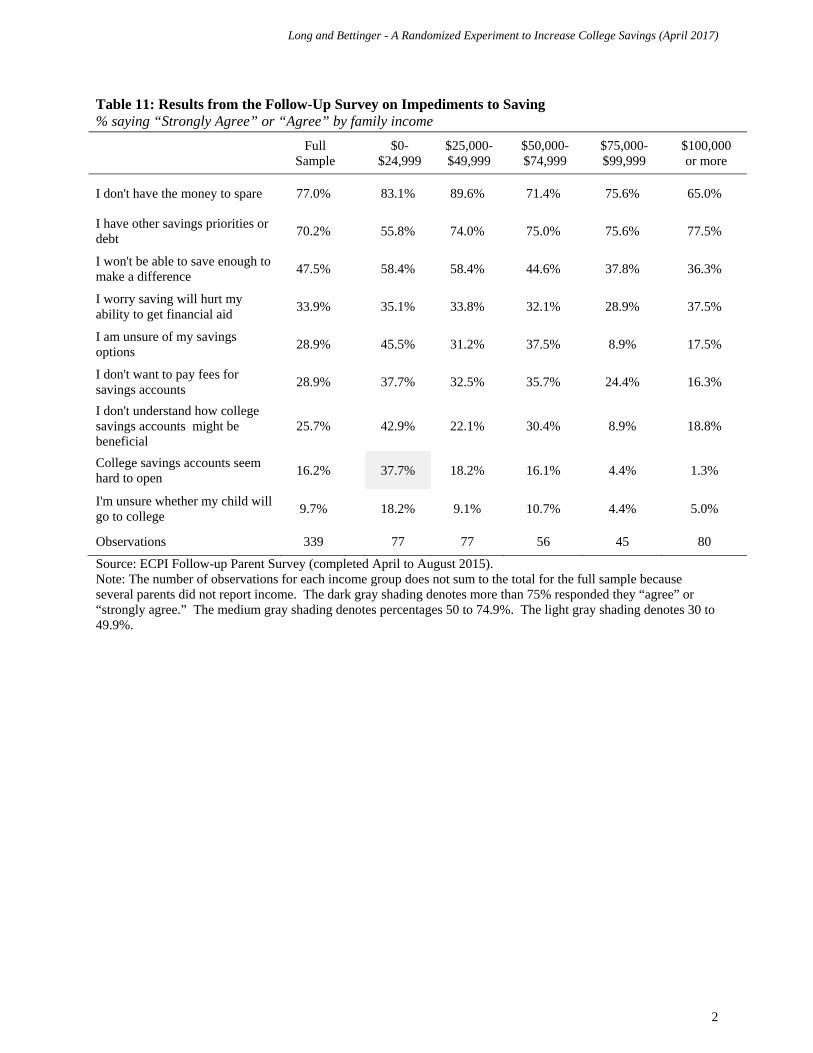
This is reflected in the post-survey results summarized in Table 11. The most frequently cited obstacles
to saving among all income groups are lack of money to spare for savings, having other savings priorities
or debt, and worrying about not being able to save enough to make a difference. While not having enough
money was the most popular answer, lower-income families were much more like to select that option
than higher-income families. Meanwhile, having other savings priorities was a concern expressed more
highly for groups that made more than $25,000. Interestingly, the group in the $25,000 to $49,999
income range expressed these top to concerns more frequently than other groups.
Supporting our hypothesis that lack of information might explain some of the underutilization of
college savings options, we find nearly one-third of families expressed that they were unsure of their
savings options. Nearly half of low-income families said this, though the higher-income families selected
this option rarely. Finally, our project focused on families within the last five years of K-12, and many
parents expressed concern about not being able to save enough to make a different. However, this
Long and Bettinger - A Randomized Experiment to Increase College Savings (April 2017)
18
concern was concentrated among low-income families. Surprisingly, families across the income
distribution were nearly equal in the proportion concerns about how savings might affect their financial
aid eligibility. The literature underscores this as a concern for low-income families, but we also see
evidence of higher-income families thinking about this.
VI. CONCLUSIONS
In summary, our project examines the effects of a program that attempts to increase awareness
about college savings options, simplify the process of opening an account, and encourage take-up saving
by contributing to the initial balance. Nearly no one in the control group has opened a college savings
account as a result of the general information we provide about the importance of saving for college. The
vast majority of accounts opened are by parents who were in Treatment Group 2 and received the opening
deposit from us. About one-third of parents who opened accounts also set up automatic monthly
contributions. This is an important pathway to accumulating meaningful savings amounts.
Our research provides evidence about the barriers impeding college savings, the efficacy of
current savings devices, policies that may improve college savings, and the effects of college savings on
college outcomes. Our early analysis of college outcomes also suggests that college savings lead to more
expensive, and perhaps better, investments in postsecondary education. Therefore, we provide promising
results about the long-term benefits of engaging families in college savings.
Long and Bettinger - A Randomized Experiment to Increase College Savings (April 2017)
19
REFERENCES
Bailey, Martha J., and Susan M. Dynarski. (2011) “Gains and Gaps: Changing Inequality in US College Entry and Completion.” NBER Working Paper Series, No.17633.
Beshears, John, James J. Choi, David Laibson, and Brigitte C. Madrian. (2009) “The Importance of Default Options for Retirement Savings Outcomes: Evidence from the United States.” Social Security Policy in a Changing Environment. Jeffrey R. Brown, Jeffrey B. Liebman and David A. Wise, Eds. Chicago: University of Chicago Press: 167-195.
Beshears, John, James J. Choi, David Laibson, and Brigitte C. Madrian. (2013) Simplification and saving. Journal of Economic Behavior & Organization 95: 130-145.
Bettinger, Eric P, Bridget Terry Long, Philip Oreopoulos, and Lisa Sanbonmatsu. (2012) “The role of application assistance and information in college decisions: Results from the H&R Block FAFSA experiment.” The Quarterly Journal of Economics 127 ( 3): 1205-1242.
Bhargava, Saurabh, and Dayanand Manoli. (2015) “Psychological frictions and the incomplete take-up of social benefits: Evidence from an IRS field experiment.” The American Economic Review 105 (11): 3489-3529.
Beverly, S., M. Clancy, Jin Huang, and Michael Sherraden. (2015) “The SEED for Oklahoma Kids Child Development Account Experiment: Accounts, Assets, Earnings, and Savings.” CSD Research Brief: 15-29.
Black, Rachel, and Mark Huelsman. (2012) “Overcoming Obstacles to College Attendance and Degree Completion: Toward a Pro-College Savings Agenda.” Asset Building Program. New America Foundation.
Castleman, B. and L. Page. (2016) “Freshman Year Financial Aid Nudges: An Experiment To Increase FAFSA Renewal and College Persistence.” Journal of Human Resources 31(51): 389-415.
Clancy, Margaret, and Michael Sherraden. (2014) “Automatic deposits for all at birth: Maine’s Harold Alfond College Challenge.” Center for Social Development Policy Report 14-05. St. Louis, MO: Washington University.
Clancy, Margaret M, Sondra G Beverly, Michael Sherraden, and Jin Huang. (2016) “Testing Universal Child Development Accounts.” Center for Social Development Working Paper No. 16-08. St. Louis, MO: Washington University.
College Board. (2016) Trends in College Pricing. New York, NY: The College Board.
Cornwell, Christopher, David B. Mustard, and Deepa J. Sridhar. (2006) “The enrollment effects of merit‐based financial aid: Evidence from Georgia’s HOPE program.” Journal of Labor Economics 24 (4): 761-786.
Cowan, Benjamin W. (2011) “Forward-thinking teens: The effects of college costs on adolescent risky behavior.” Economics of Education Review 30 (5): 813-825.
Currie, Janet. (2004) “The take up of social benefits.” National Bureau of Economic Research Working Paper No. 10488.
Deming, David and Susan Dynarski. (2010) “College Aid.” Targeting Investments in Children: Fighting Poverty When Resources are Limited. Phillip B. Levine and David J. Zimmerman, Eds. Chicago: University of Chicago Press: 283-302.
Long and Bettinger - A Randomized Experiment to Increase College Savings (April 2017)
20
Destin, Mesmin, and Daphna Oyserman. (2009) “From Assets to School Outcomes How Finances Shape Children's Perceived Possibilities and Intentions.” Psychological Science 20 (4): 414-418.
Dynarski, Susan. (2000) “Hope for whom? Financial aid for the middle class and its impact on college attendance.” National Tax Journal, 53: 629–661.
Dynarski, Susan. (2002) “The behavioral and distributional implications of aid for college.” American Economic Review, 92(2): 279–285.
Dynarski, Susan. (2004). “Tax Policy and Education Policy: Collision or Coordination? A Case Study of the 529 and Coverdell Saving Incentives.” Tax Policy and the Economy.
Elliott, William. (2013) “Small-dollar children’s savings accounts and children’s college outcomes.” Children and Youth Services Review 35: 572-585.
Elliott, William, Eun Hee Choi, Mesmin Destin, and Kevin H Kim. (2011) “The age old question, which comes first? A simultaneous test of children's savings and children's college-bound identity.” Children and Youth Services Review 33(7): 1101-1111.
Elliott, William, Melinda Lewis, Michal Grinstein-Weiss, and IlSung Nam. (2014) “Student Loan Debt: Can Parental College Savings Help?” Federal Reserve Bank of St. Louis Review 96 (4): 331-357.
Elliott III, William and Sondra G Beverly. (2011) “The role of savings and wealth in reducing ‘wilt’ between expectations and college attendance.” Journal of Children and Poverty 17 (2): 165-185.
Friedline, Terri. (2014) “The independent effects of savings accounts in children's names on their savings outcomes in young adulthood.” Journal of Financial Counseling and Planning 25 (1).
Government Accountability Office. (2012) A Small Percentage of families save in 529 Plans. Washington, DC: GAO Publication No. 13-64.
Grodsky, Eric, and Melanie T Jones. (2007) “Real and imagined barriers to college entry: Perceptions of cost.” Social Science Research 36(2): 745-766.
Horn, Laura J, Xianglei Chen, and Chris Chapman. (2003) Getting Ready To Pay for College: What Students and Their Parents Know about the Cost of College Tuition and What They Are Doing To Find Out. Washington, DC: National Center of Education Statistics Report No. 2003030.
Hoxby, Caroline M. and Sarah Turner. (2015) “What High-Achieving Low-Income Students Know about College.” American Economic Review 105(5): 514-17.
Hoxby, Caroline, and Sarah Turner. (2013) “Expanding college opportunities for high-achieving, low income students.” Stanford Institute for Economic Policy Research Discussion Paper 12-014.
Huang, Jin, Michael Sherraden, Youngmi Kim, and Margaret Clancy. (2014) “Effects of child development accounts on early social-emotional development: an experimental test.” JAMA pediatrics 168(3): 265-271.
Huang, Jin, Sondra Beverly, Margaret Clancy, Terry Lassar, and Michael Sherraden. (2013) “Early program enrollment in a statewide Child Development Account Program.” Journal of Policy Practice 12(1): 62-81.
Huang, Jin., Youngmi Kim, and Michael Sherraden. (2016) “Material hardship and children's social‐emotional development: Testing mitigating effects of Child Development Accounts in a randomized experiment.” Child: Care, Health and Development.
Long and Bettinger - A Randomized Experiment to Increase College Savings (April 2017)
21
Ikenberry, Stanley O., and Terry W. Hartle. (1998) Too Little Knowledge Is a Dangerous Thing: What the Public Thinks and Knows about Paying for College. Washington, DC: American Council on Education.
Kim, Youngmi, Jin Huang, and Michael Sherraden. (2014) “What shapes assessment of ability to pay for children's college education?” Journal of Consumer Affairs 48 (3): 486-514.
Long, B. T. 2007. The Contributions of Economics to the Study of College Access and Success. Teachers College Record 109(10).
Ma, Jennifer. (2004) “Education Savings Incentives and Household Saving. Evidence from the 2000 TIAA-CREF Survey of Participant Finances.” In College choices: The economics of where to go, when to go, and how to pay for it, pp. 169-206. University of Chicago Press.
Mason, Lisa Reyes, Yunju Nam, Margaret Clancy, Youngmi Kim, and Vernon Loke. (2010) “Child Development Accounts and saving for children's future: Do financial incentives matter?” Children and Youth Services Review 32 (11): 1570-1576.
Nam, Jaehyun, and David Ansong. (2015) “The effects of a dedicated education savings account on children's college graduation.” Economics of Education Review 48: 198-207.
Nam, Yunju, Youngmi Kim, Margaret Clancy, Robert Zager, and Michael Sherraden. (2013) “Do Child Development Accounts promote account holding, saving, and asset accumulation for children's future? Evidence from a statewide randomized experiment.” Journal of Policy Analysis and Management 32 (1): 6-33.
O'Donoghue, Ted, and Matthew Rabin. (1998) “Procrastination in preparing for retirement.” University of California-Berkeley Working Paper.
Oreopoulos, Philip, and Ryan Dunn. (2013) “Information and college access: Evidence from a randomized field experiment.” The Scandinavian Journal of Economics 115 (1): 3-26.
Sallie Mae. (2015) How America Saves For College. Newark, DE: Sallie Mae Bank.
Scott-Clayton, Judith and Susan M. Dynarski. (2013) "Financial Aid Policy: Lessons from Research." Future of Children 23 (1): 67-91.
Shipman, Jade. (2016) “Great Expectations: Findings from 13 years of Children’s Education Savings Accounts.” EARN Research Institute.
Wikoff, Nora, Jin Huang, Youngmi Kim, and Michael Sherraden. (2015) “Material hardship and 529 college savings plan participation: The mitigating effects of Child Development Accounts.” Social science research 50: 189-202.
Zager, Robert, Youngmi Kim, Yunju Nam, Margaret Clancy, and Michael Sherraden. (2010) “The SEED for Oklahoma kids experiment: Initial account opening and savings.” CSD Research Brief: 10-41.
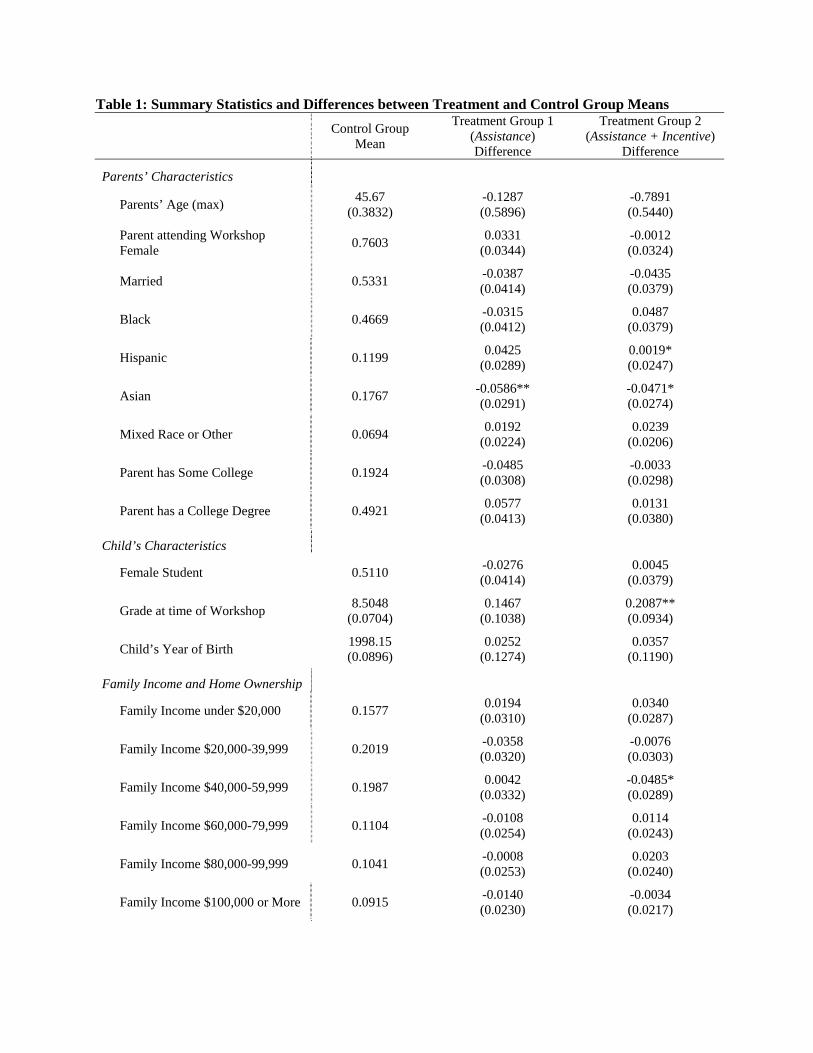
Table 1: Summary Statistics and Differences between Treatment and Control Group Means
Control Group
Mean
Treatment Group 1 (Assistance) Difference
Treatment Group 2 (Assistance + Incentive)
Difference
Parents’ Characteristics
Parents’ Age (max) 45.67
(0.3832) -0.1287 (0.5896)
-0.7891 (0.5440)
Parent attending Workshop Female
0.7603 0.0331
(0.0344) -0.0012 (0.0324)
Married 0.5331 -0.0387 (0.0414)
-0.0435 (0.0379)
Black 0.4669 -0.0315 (0.0412)
0.0487 (0.0379)
Hispanic 0.1199 0.0425
(0.0289) 0.0019* (0.0247)
Asian 0.1767 -0.0586** (0.0291)
-0.0471* (0.0274)
Mixed Race or Other 0.0694 0.0192
(0.0224) 0.0239
(0.0206)
Parent has Some College 0.1924 -0.0485 (0.0308)
-0.0033 (0.0298)
Parent has a College Degree 0.4921 0.0577
(0.0413) 0.0131
(0.0380)
Child’s Characteristics
Female Student 0.5110 -0.0276 (0.0414)
0.0045 (0.0379)
Grade at time of Workshop 8.5048
(0.0704) 0.1467
(0.1038) 0.2087** (0.0934)
Child’s Year of Birth 1998.15 (0.0896)
0.0252 (0.1274)
0.0357 (0.1190)
Family Income and Home Ownership
Family Income under $20,000 0.1577 0.0194
(0.0310) 0.0340
(0.0287)
Family Income $20,000-39,999 0.2019 -0.0358 (0.0320)
-0.0076 (0.0303)
Family Income $40,000-59,999 0.1987 0.0042
(0.0332) -0.0485* (0.0289)
Family Income $60,000-79,999 0.1104 -0.0108 (0.0254)
0.0114 (0.0243)
Family Income $80,000-99,999 0.1041 -0.0008 (0.0253)
0.0203 (0.0240)
Family Income $100,000 or More 0.0915 -0.0140 (0.0230)
-0.0034 (0.0217)
Long and Bettinger - A Randomized Experiment to Increase College Savings (April 2017)
1
On Public Assistance 0.2326 -0.0044 (0.0356)
0.0799** (0.0344)
Own Home 0.5146 -0.0239 (0.0417)
-0.0447 (0.0383)
Family Characteristics
Number of Kids in the Family 2.01
(0.0627) 0.1275
(0.0976) 0.1591* (0.0851)
Unknown Number of Kids in the Family
0.1073 -0.0667** (0.0211)
-0.0425** (0.0215)
Prior Savings Behavior
Already had a 529 Account before the Workshop
0.0536 0.0202
(0.0203) 0.0085
(0.0177)
Sample size 317 271 386 Source: Pre-Workshop Background Survey. Information about previous 529 account is from the Massachusetts U.Fund database. Notes: Self-reported parental education level and family income are missing for 13.6 percent of the sample, but there are no statistically significant differences in this proportion by control/treatment group for either variable.
Long and Bettinger - A Randomized Experiment to Increase College Savings (April 2017)
2
Table 2: Pre-Workshop Savings Behavior and Beliefs
Full
Sample
Family Income Group Less Than $40,000
$40,000- $79,999
$80,000 or more
Have you begun to save for college? (% who answered “yes”)
0.3333 0.1975 0.3294 0.5769
Why are you not saving/not saving more? (% who checked “yes”)
We don’t have the money to spare 0.7217 0.7138 0.7577 0.6848
Not sure of options 0.3681 0.3417 0.4141 0.3497
I won’t be able to save enough 0.3211 0.3805 0.3359 0.1967
Too complicated 0.2487 0.3281 0.2305 0.1366
Worried about loss of financial aid 0.1548 0.1483 0.1719 0.1421
Not sure child will go to college 0.1149 0.1293 0.1401 0.0546
It’s too early to start saving 0.0450 0.0473 0.0547 0.0273
Observations 756 317 256 183
Among families that had begun to save for college
Amount Saved $13,122 (23,496)
$2,616 (4,579)
$6,855 (8,015)
$26,601 (32,539)
Number of Respondents 229 76 64 89
When began to save?
Started within the last 2 years 0.3200 0.5211 0.3263 0.1835
Started 3-5 years ago 0.1891 0.1268 0.2842 0.1468
Started more than 5 years ago 0.4909 0.3521 0.3895 0.6697
Number of Respondents 275 71 95 109
Method of saving
Checking Account 0.0836 0.1081 0.1042 0.0513
Savings Account 0.3763 0.5000 0.3958 0.2821
Stock Market 0.1672 0.0676 0.0833 0.2991
529 Account 0.3693 0.1351 0.2500 0.6154
Other 0.2230 0.2703 0.2396 0.1795
Number of Respondents 287 74 96 117
Source: Pre-Workshop Background Survey. Notes: When answering the question about why the family is not saving or not saving more, the parent was instructed to “check all that apply.”
Long and Bettinger - A Randomized Experiment to Increase College Savings (April 2017)
3
Table 3: Summary of Savings Behavior after Workshop
Full
Sample
Control Group
Treatment Group 1 (Assistance)
Treatment Group 2 (Assistance +
Incentive)
Full Sample
Open 529 after Workshop 9.86% 0.95% 2.21% 22.54%
Account Balance (zero if no account)
$1,267
(11,112) $3,621
(20,166) $2,360
(12,261)
Started Automatic Monthly contributions
3.39% 0.63% 0.74% 7.51%
Observations 974 317 271 386
Sample: Opened account after workshop
Account Balance $1,182 (2,522)
$522 (772)
$1,783 (2,558)
$1,164 (2,567)
Started Automatic Monthly contributions
30.21% 0 33.33% 31.03%
Observations 96 3 6 87
Source: MEFA/Fidelity Massachusetts 529 College Savings Accounts Database. Table 4: The Effects of the Interventions on Opening a 529 Account after the Workshop Full Sample Students in Grades 7-10 Only
(1) (2) (3) (4) (5) (6)
Treatment Group 1 (Assistance)
0.0127* (0.0074)
0.0108 (0.0122)
0.0109 (0.0123)
0.0103 (0.0092)
0.0041 (0.0137)
0.0044 (0.0137)
Treatment Group 2 (Assistance + Incentive)
0.2159*** (0.0351)
0.2159*** (0.0348)
0.2156*** (0.0348)
0.2257*** (0.0366)
0.2241*** (0.0361)
0.2235*** (0.0361)
Background Controls Y Y Y Y
Event Year F.E. Y Y
R2 0.12 0.16 0.16 0.13 0.16 0.16 N 974 974 974 893 893 893 * p<0.1 ** p<0.05 *** p<0.01 Source: MEFA/Fidelity Massachusetts 529 College Savings Accounts Database. Notes: Standard errors adjusted for clustering by event date. The background controls are: dummy variables for parents’ race (Black, Hispanic, Asian, Other), dummy variables for parents’ level of education (no college; some college; college degree), dummy variables for parents being married, home ownership, and received public assistance each, whether the student is female, the child’s grade at the time of the workshop, student’s year of birth, number of children in the household.
Long and Bettinger - A Randomized Experiment to Increase College Savings (April 2017)
4
Table 5: The Effects of the Interventions on signing up for Automatic Monthly Contributions Full Sample Students in Grades 7-10 Only
(1) (2) (3) (4) (5) (6)
Treatment Group 1 (Assistance)
0.0011 (0.0083)
0.0052 (0.0088)
0.0048 (0.0088)
0.0014 (0.0089)
0.0030 (0.0096)
0.0027 (0.0096)
Treatment Group 2 (Assistance + Incentive)
0.0688*** (0.0180)
0.0724*** (0.0209)
0.0731*** (0.0210)
0.0699*** (0.0203)
0.0734*** (0.0224)
0.0741*** (0.0226)
Background Controls Y Y Y Y
Event Year F.E. Y Y
R2 0.03 0.06 0.06 0.03 0.06 0.06 N 974 974 974 893 893 893 * p<0.1 ** p<0.05 *** p<0.01 Source: MEFA/Fidelity Massachusetts 529 College Savings Accounts Database. Notes: Standard errors adjusted for clustering by event date. The background controls are: dummy variables for parents’ race (Black, Hispanic, Asian, Other), dummy variables for parents’ level of education (no college; some college; college degree), dummy variables for parents being married, home ownership, and received public assistance each, whether the student is female, the child’s grade at the time of the workshop, student’s year of birth, number of children in the household. Table 6: The Effects of the Interventions on Amount Saved Current 529 Account Balance (zero if there is no account; excluding accounts > $100,000) Full Sample Students in Grades 7-10 Only
(1) (2) (3) (4) (5) (6)
Treatment Group 1 (Assistance)
$1,352** (663)
1,709** (771)
1,720** (773)
1,513** (718)
1,771** (834)
1,779** (837)
Treatment Group 2 (Assistance + Incentive)
$1,508** (632)
1,911** (715)
1,895** (719)
1,665** (675)
2,069*** (730)
2,055*** (735)
Background Controls Y Y Y Y
Event Year F.E. Y Y
R2 0.01 0.09 0.09 0.01 0.09 0.09
N 968 968 968 887 887 887 * p<0.1 ** p<0.05 *** p<0.01 Source: MEFA/Fidelity Massachusetts 529 College Savings Accounts Database. Notes: Standard errors adjusted for clustering by event date. The background controls are: dummy variables for parents’ race (Black, Hispanic, Asian, Other), dummy variables for parents’ level of education (no college; some college; college degree), dummy variables for parents being married, home ownership, and received public assistance each, whether the student is female, the child’s grade at the time of the workshop, student’s year of birth, number of children in the household.
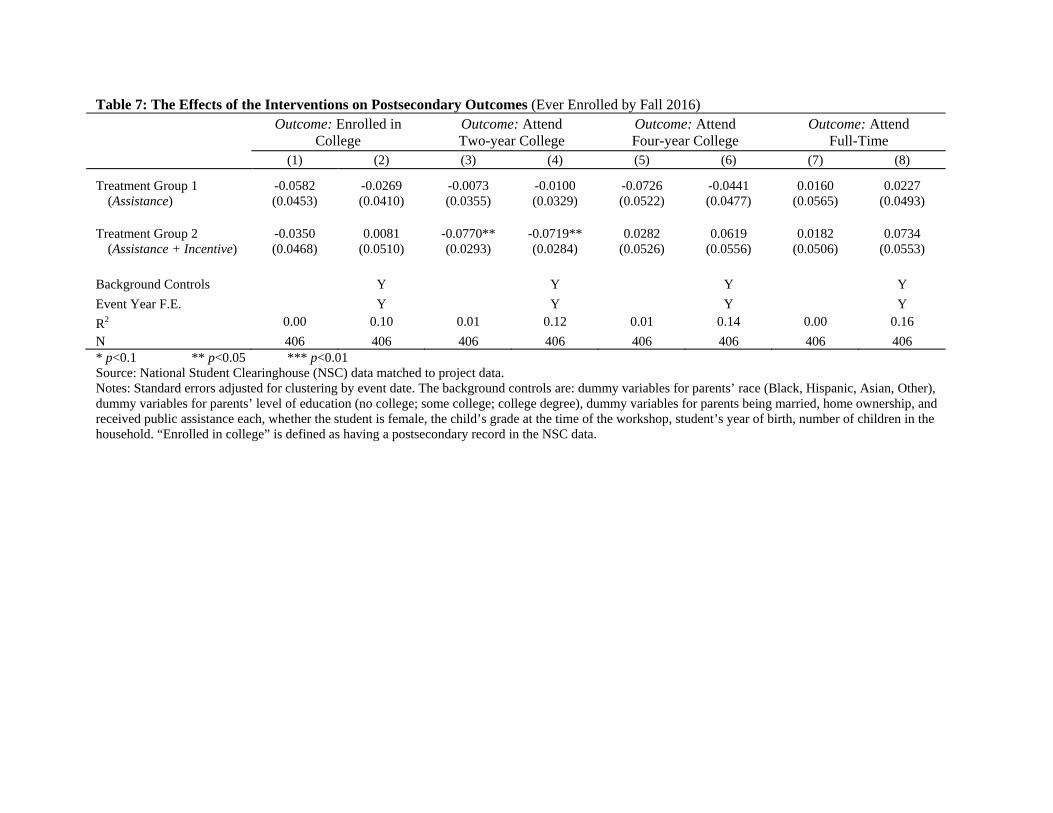
Table 7: The Effects of the Interventions on Postsecondary Outcomes (Ever Enrolled by Fall 2016)
Outcome: Enrolled in
College Outcome: Attend Two-year College
Outcome: Attend Four-year College
Outcome: Attend Full-Time
(1) (2) (3) (4) (5) (6) (7) (8)
Treatment Group 1 (Assistance)
-0.0582 (0.0453)
-0.0269 (0.0410)
-0.0073 (0.0355)
-0.0100 (0.0329)
-0.0726 (0.0522)
-0.0441 (0.0477)
0.0160 (0.0565)
0.0227 (0.0493)
Treatment Group 2 (Assistance + Incentive)
-0.0350 (0.0468)
0.0081 (0.0510)
-0.0770** (0.0293)
-0.0719** (0.0284)
0.0282 (0.0526)
0.0619 (0.0556)
0.0182 (0.0506)
0.0734 (0.0553)
Background Controls Y Y Y Y
Event Year F.E. Y Y Y Y
R2 0.00 0.10 0.01 0.12 0.01 0.14 0.00 0.16
N 406 406 406 406 406 406 406 406 * p<0.1 ** p<0.05 *** p<0.01 Source: National Student Clearinghouse (NSC) data matched to project data. Notes: Standard errors adjusted for clustering by event date. The background controls are: dummy variables for parents’ race (Black, Hispanic, Asian, Other), dummy variables for parents’ level of education (no college; some college; college degree), dummy variables for parents being married, home ownership, and received public assistance each, whether the student is female, the child’s grade at the time of the workshop, student’s year of birth, number of children in the household. “Enrolled in college” is defined as having a postsecondary record in the NSC data.
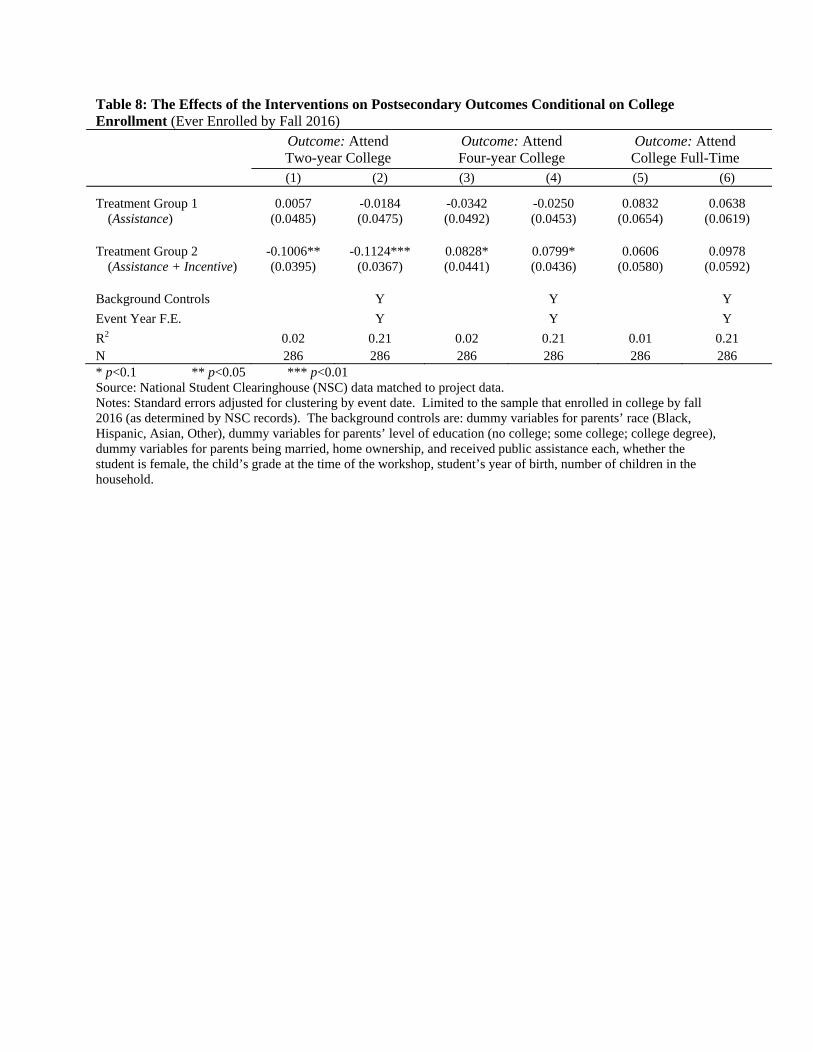
Table 8: The Effects of the Interventions on Postsecondary Outcomes Conditional on College Enrollment (Ever Enrolled by Fall 2016)
Outcome: Attend Two-year College
Outcome: Attend Four-year College
Outcome: Attend College Full-Time
(1) (2) (3) (4) (5) (6)
Treatment Group 1 (Assistance)
0.0057 (0.0485)
-0.0184 (0.0475)
-0.0342 (0.0492)
-0.0250 (0.0453)
0.0832 (0.0654)
0.0638 (0.0619)
Treatment Group 2 (Assistance + Incentive)
-0.1006** (0.0395)
-0.1124*** (0.0367)
0.0828* (0.0441)
0.0799* (0.0436)
0.0606 (0.0580)
0.0978 (0.0592)
Background Controls Y Y Y
Event Year F.E. Y Y Y
R2 0.02 0.21 0.02 0.21 0.01 0.21 N 286 286 286 286 286 286 * p<0.1 ** p<0.05 *** p<0.01 Source: National Student Clearinghouse (NSC) data matched to project data. Notes: Standard errors adjusted for clustering by event date. Limited to the sample that enrolled in college by fall 2016 (as determined by NSC records). The background controls are: dummy variables for parents’ race (Black, Hispanic, Asian, Other), dummy variables for parents’ level of education (no college; some college; college degree), dummy variables for parents being married, home ownership, and received public assistance each, whether the student is female, the child’s grade at the time of the workshop, student’s year of birth, number of children in the household.
Long and Bettinger - A Randomized Experiment to Increase College Savings (April 2017)
1
Table 9: Results from the Follow-Up Survey on Savings Behavior
Full
Sample
$0- $24,999
$25,000- $49,999
$50,000- $74,999
$75,000- $99,999
$100,000 or more
Awareness and Preparation Activity
Have you attended a college workshop during the past school year? (percent “ yes”)
58.5%
46.1% 58.7% 58.9% 62.2% 67.5%
Do you know what 529 accounts are? (percent “ yes”)
68.5%
43.4% 57.1% 66.1% 91.1% 93.8%
Have you started saving for college? (percent “ yes”)
69.9%
50.7% 57.1% 69.6% 82.2% 92.5%
Observations 336 75 77 56 45 80
Amount Saved
Saved $0-1,999 28.5% 65.8% 38.6% 35.9% 18.9% 4.1%
Saved $2,000 - $4,999 23.4% 31.6% 36.4% 25.6% 21.6% 12.2%
Saved $5,000 -$9,999 15.3% 0.0% 20.5% 12.8% 16.2% 20.3%
Saved $10,000 - $19,999 9.8% 0.0% 2.3% 12.8% 18.9% 13.5%
Saved $20,000 or more 23.0% 2.6% 2.3% 12.8% 24.3% 50.0%
Observations 235 38 44 39 37 74
Is your oldest child aware you have a college savings account for her/him? (percent “ yes”)
74.3%
58.3% 68.6% 78.6% 72.4% 83.1%
Observations 175 24 35 28 29 59 Source: ECPI Follow-up Parent Survey completed April to August 2015 (the original workshops were held in 2012 and 2013). Table 10: Results from the Follow-Up Survey on College Savings Vehicles (N=339)
Using to Save
(check all that apply) Primary Savings for
College (choose ONE)
Massachusetts’ 529 Account (U.Fund) 23.9% 14.7%
529 Account in Another State 8.3% 6.8%
Coverdell Education Savings Account 2.4% 0.3%
Retirement Account 14.2% 2.9%
Checking Account 17.7% 4.7%
Savings Account 39.5% 23.6%
Other type of Account 10.9% 7.7%
Source: ECPI Follow-up Parent Survey (completed April to August 2015).
Long and Bettinger - A Randomized Experiment to Increase College Savings (April 2017)
2
Table 11: Results from the Follow-Up Survey on Impediments to Saving % saying “Strongly Agree” or “Agree” by family income
Full
Sample
$0- $24,999
$25,000- $49,999
$50,000- $74,999
$75,000- $99,999
$100,000 or more
I don't have the money to spare 77.0% 83.1% 89.6% 71.4% 75.6% 65.0%
I have other savings priorities or debt
70.2% 55.8% 74.0% 75.0% 75.6% 77.5%
I won't be able to save enough to make a difference
47.5% 58.4% 58.4% 44.6% 37.8% 36.3%
I worry saving will hurt my ability to get financial aid
33.9% 35.1% 33.8% 32.1% 28.9% 37.5%
I am unsure of my savings options
28.9% 45.5% 31.2% 37.5% 8.9% 17.5%
I don't want to pay fees for savings accounts
28.9% 37.7% 32.5% 35.7% 24.4% 16.3%
I don't understand how college savings accounts might be beneficial
25.7% 42.9% 22.1% 30.4% 8.9% 18.8%
College savings accounts seem hard to open
16.2% 37.7% 18.2% 16.1% 4.4% 1.3%
I'm unsure whether my child will go to college
9.7% 18.2% 9.1% 10.7% 4.4% 5.0%
Observations 339 77 77 56 45 80
Source: ECPI Follow-up Parent Survey (completed April to August 2015). Note: The number of observations for each income group does not sum to the total for the full sample because several parents did not report income. The dark gray shading denotes more than 75% responded they “agree” or “strongly agree.” The medium gray shading denotes percentages 50 to 74.9%. The light gray shading denotes 30 to 49.9%.