silk performer 20 - micro focus...sample web 2.0 application silk performer offers a modern sample...
TRANSCRIPT
Silk Performer 20.5
Browser-Driven Web Load TestingTutorial
Micro FocusThe Lawn22-30 Old Bath RoadNewbury, Berkshire RG14 1QNUKhttp://www.microfocus.com
© Copyright 1992-2019 Micro Focus or one of its affiliates.
MICRO FOCUS, the Micro Focus logo and Silk Performer are trademarks or registeredtrademarks of Micro Focus or one of its affiliates.
All other marks are the property of their respective owners.
2019-10-28
ii
Contents
Browser-Driven Web Load Testing Tutorial ..................................................... 4Browser-Driven Load Testing Overview .............................................................................. 4
Support for Pop-Up Windows ................................................................................... 4Sample Web 2.0 Application .................................................................................... 4Pop-Up Window in the Sample Application .............................................................. 5Support for HTML Dialog Boxes ...............................................................................5Native Replay ........................................................................................................... 6
Web Browser Configuration Settings .................................................................................. 6Running Multiple Virtual Users .................................................................................7
Creating a Test Script ..........................................................................................................8Defining a Browser-Driven Web Load Test Project .................................................. 8Recording a Test Script ............................................................................................ 8Browser Application and Locator Spy Usage ........................................................... 9Locator Verification in Browser Application ............................................................ 11Inserting Mouse Move ............................................................................................ 11Inserting a Verification Function ............................................................................. 11Including Elements in the TTI .................................................................................12Try Script Runs .......................................................................................................12Trying Out Your Test Script ..................................................................................... 13Using Step-by-Step Try Script Replay .................................................................... 13Common Replay Errors ..........................................................................................13
Analyzing Test Scripts ....................................................................................................... 14Visual Analysis with TrueLog Explorer ................................................................... 14Analyzing a Test Run ..............................................................................................15Viewing a Summary Report ................................................................................... 15Displaying a Virtual User Summary Report ............................................................16Enabling Summary Reports ................................................................................... 16Finding Errors in a TrueLog .................................................................................... 16Viewing Page Statistics .......................................................................................... 16Viewing an Overview Page .....................................................................................17Comparing Record and Replay Truelogs ............................................................... 17
Configuring Project Profile Settings .................................................................................. 17Configuring Browser-Driven Recording Settings ....................................................17Configuring Browser-Driven Replay Settings ......................................................... 18
Advanced Concepts for Browser-driven Tests ...................................................................19Defining Browser Window Dimensions for Recording ............................................ 19Testing Websites That Use Non-system Codepage Characters ............................ 19Time to Interact ...................................................................................................... 19
Troubleshooting Browser-Driven Load Testing Issues ...................................................... 21Browser-Driven Virtual Users on Remote Agents .................................................. 21Recommended Internet Explorer settings on agents ............................................. 21Handling Client Certificates ....................................................................................22Removing Certificate Errors ................................................................................... 22Excluding URLs from AJAX Synchronization ......................................................... 23Limitations for Replay with Different Browsers ....................................................... 23
Contents | 3
Browser-Driven Web Load Testing TutorialThis tutorial will assist you in the process of using Silk Performer to load-test Web 2.0 applications,especially those that rely on AJAX technologies, and get you up and running as quickly as possible. It willhelp you take full advantage of Silk Performer's ease of use and leading-edge functionality that isembodied in e-business' load-testing tool of choice.
Browser-Driven Load Testing OverviewIn addition to facilitating testing of today's modern Web applications on the protocol level (HTTP), SilkPerformer now enables you to use real Web browsers (Internet Explorer, Firefox, and Chrome) to generateload. In this way, you can leverage the AJAX logic built into Web applications to precisely simulate complexAJAX behavior during testing. This powerful testing approach provides results that reflect real-world enduser browsing experience, including rendering time and protocol-level statistics.
Unlike other load-testing solutions that only support specific AJAX frameworks (and of those, only specificversions or a subset of controls), Silk Performer supports the full range of Web applications that aredeveloped for (and tested with) Internet Explorer, Firefox, and Chrome.
With the browser-driven load testing support, Silk Performer strives to offer the same functionality andbehavior across all supported browsers. This makes it possible to record your scripts in the InternetExplorer-based Browser Application and replay them with Firefox and Chrome.
In some rare cases however, this abstraction might not work as expected due to inherent differencesamong the browsers. For example: The Browser Application might generate a locator that cannot beresolved by Chrome or Firefox. For more information, see Limitations for Replay with Different Browsers.
Most browsers follow a frequent and silent update policy. For a load testing environment, this is not ideal,because it influences the consistency of the results. Furthermore, Silk Performer might not have beentested with the latest browser versions, especially if these have been published after the latest SilkPerformer release. As a general rule: To avoid problems, stick to the tested browser versions listed in thesection Tested Software in the release notes and install the latest hotfixes.
Support for Pop-Up WindowsSilk Performer browser-driven testing supports sites that utilize pop-up windows (for example, login dialogboxes). Pop-up browser windows often include input fields in which users enter values that are passedback to the main page (for example, username and password strings). Multiple browser-window support isavailable by default when you create a Silk Performer project of type Web browser-driven (AJAX).
A new tab is created in the Browser Application each time a pop-up window is generated during applicationrecording. Each pop-up window that is encountered results in a tab being created in the BrowserApplication. Each time you click a tab in the Browser Application during recording aBrowserActivateWindow function is scripted automatically.
Note: The manual opening of windows and tabs during recording (via menu bars, context menus, orkeyboard shortcuts) is not supported.
Sample Web 2.0 ApplicationSilk Performer offers a modern sample Web application that you can use to learn about Web 2.0application testing. The InsuranceWeb sample Web application is built upon ExtJS and JSF frameworks,uses AJAX technology, and communicates via JSON and XML.
4 | Browser-Driven Web Load Testing Tutorial

The sample application is hosted at http://demo.borland.com/InsuranceWebExtJS/.
Pop-Up Window in the Sample ApplicationThe sample Web 2.0 application includes pop-up window functionality that you can use to experiment withSilk Performer support for multiple browser windows.
1. To generate the pop-up window, visit the sample Web 2.0 application at http://demo.borland.com/InsuranceWebExtJS/.
2. From the Select a Service or Log in drop list, select Agent Lookup.
3. On the Find an Insurance Co. Agent page, click the Open in new window link at the bottom of thepage. The Find an Insurance Co. Agent page loads in a new tab within the Browser Application.
Click the Close Window link at the bottom of the page to close the tab.
Support for HTML Dialog BoxesSilk Performer recognizes the following dialog types:
Browser-Driven Web Load Testing Tutorial | 5
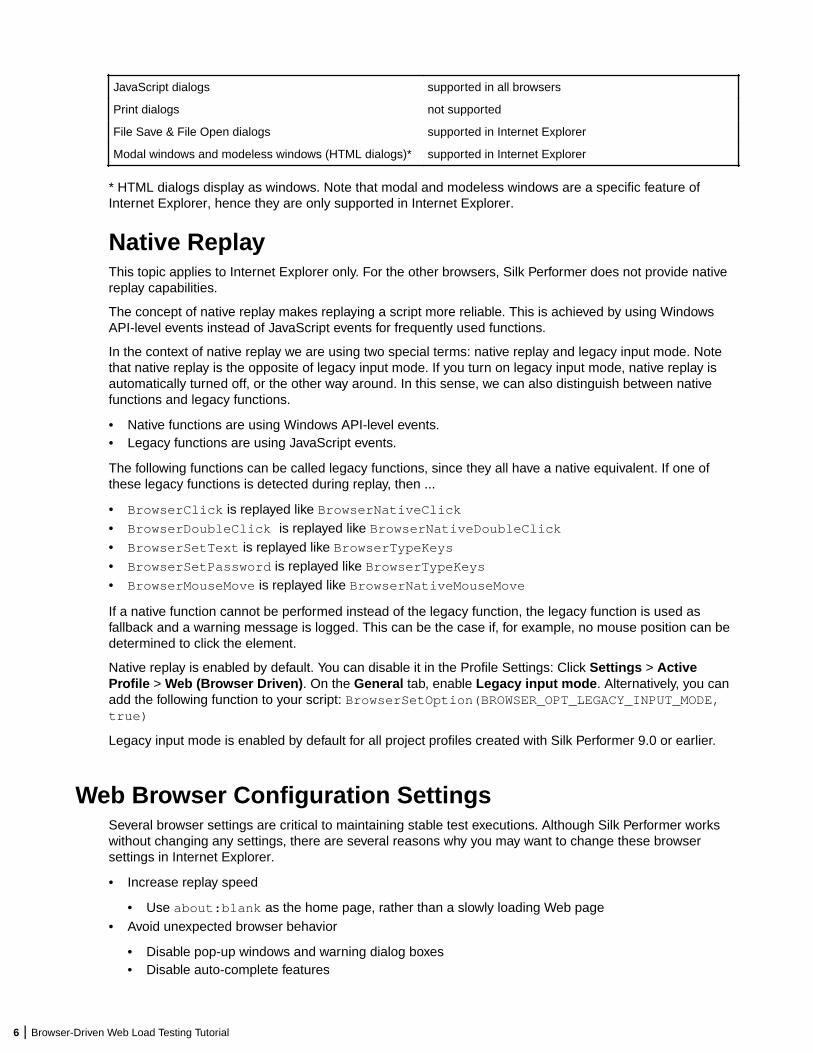
JavaScript dialogs supported in all browsers
Print dialogs not supported
File Save & File Open dialogs supported in Internet Explorer
Modal windows and modeless windows (HTML dialogs)* supported in Internet Explorer
* HTML dialogs display as windows. Note that modal and modeless windows are a specific feature ofInternet Explorer, hence they are only supported in Internet Explorer.
Native ReplayThis topic applies to Internet Explorer only. For the other browsers, Silk Performer does not provide nativereplay capabilities.
The concept of native replay makes replaying a script more reliable. This is achieved by using WindowsAPI-level events instead of JavaScript events for frequently used functions.
In the context of native replay we are using two special terms: native replay and legacy input mode. Notethat native replay is the opposite of legacy input mode. If you turn on legacy input mode, native replay isautomatically turned off, or the other way around. In this sense, we can also distinguish between nativefunctions and legacy functions.
• Native functions are using Windows API-level events.• Legacy functions are using JavaScript events.
The following functions can be called legacy functions, since they all have a native equivalent. If one ofthese legacy functions is detected during replay, then ...
• BrowserClick is replayed like BrowserNativeClick• BrowserDoubleClick is replayed like BrowserNativeDoubleClick• BrowserSetText is replayed like BrowserTypeKeys• BrowserSetPassword is replayed like BrowserTypeKeys• BrowserMouseMove is replayed like BrowserNativeMouseMove
If a native function cannot be performed instead of the legacy function, the legacy function is used asfallback and a warning message is logged. This can be the case if, for example, no mouse position can bedetermined to click the element.
Native replay is enabled by default. You can disable it in the Profile Settings: Click Settings > ActiveProfile > Web (Browser Driven). On the General tab, enable Legacy input mode. Alternatively, you canadd the following function to your script: BrowserSetOption(BROWSER_OPT_LEGACY_INPUT_MODE,true)
Legacy input mode is enabled by default for all project profiles created with Silk Performer 9.0 or earlier.
Web Browser Configuration SettingsSeveral browser settings are critical to maintaining stable test executions. Although Silk Performer workswithout changing any settings, there are several reasons why you may want to change these browsersettings in Internet Explorer.
• Increase replay speed
• Use about:blank as the home page, rather than a slowly loading Web page• Avoid unexpected browser behavior
• Disable pop-up windows and warning dialog boxes• Disable auto-complete features
6 | Browser-Driven Web Load Testing Tutorial

• Disable password wizards• If Silk Performer runs on a Windows Server operating system, disable Internet Explorer Enhanced
Security Configuration (IE ESC).• Prevent browser malfunctions
• Disable third-party plug-ins
The following table explains where you can find these settings within the Internet Explorer GUI.
Note: Browser settings are located at Tools > Internet Options.
Tab Name Option Configuration Comments
General Home page Set to about:blank Minimizes start-up time ofnew tabs.
General Tabs • Disable warning forclosing multiple tabs
• Enable switch to newtab when tabs arecreated
• Avoids unexpecteddialog boxes
• Links that open newtabs may not otherwisereplay correctly
Privacy Pop-up blocker Disable pop-up blocker Ensures that your Websitecan open new windows.
Content Auto Complete Turn off • Avoids unexpecteddialog boxes
• Avoids unexpected datainput while typing
Programs Manage add-ons Only enable required add-ons
• Third-party add-onsmay contain defects
• Third-party add-onsmay be incompatible
Advanced Settings • Disable Automaticallycheck for InternetExplorer updates
• Enable Disable scriptdebugging (InternetExplorer)
• Enable Disable scriptdebugging (other)
• Disable Displaynotification aboutevery script error
• Disable all Warn...settings
Avoids unexpected dialogboxes.
Note: Depending onyour browserversion, not allsettings may beavailable.
Running Multiple Virtual UsersWhen running multiple browser sessions in parallel, Silk Performer must make sure that these sessionsoperate independently from each other. Cache, cookie data base, and history in particular must not beshared across virtual users to simulate real user load. The separation of virtual users with regards tobrowsers is called browser sandboxing, meaning each virtual user runs its browser in its own environment.
To run browsers in sandboxed mode, Silk Performer uses different browser-dependent techniques.
Browser-Driven Web Load Testing Tutorial | 7
Internet Explorer
For performance and resource reasons, Silk Performer does not use a full Internet Explorer browserinstance to simulate a virtual user, but an Internet Explorer ActiveX control. The default behavior of theInternet Explorer control is to maintain a single cookie database, cache, and history across browserinstances started by a particular Windows user. For load tests, Silk Performer reconfigures an InternetExplorer control to maintain one cookie database, cache, and history for each virtual user.
As each virtual user has its own independent Internet Explorer sandbox, it is possible to accuratelysimulate first-time and revisiting user behavior, as is used in the protocol-based approach to Websimulation.
Chrome and Firefox
These browsers provide their own mechanism to create independent browser sessions. As a driver engin,Silk Performer uses the corresponding WebDriver interface and some custom enhancements to enablethem to run in a load testing environment.
Creating a Test ScriptThe easiest approach to creating a test script is to use the Silk Performer Recorder, the Silk Performerengine for capturing and recording Web traffic and generating test scripts based on the captured traffic.
The Silk Performer Recorder captures and records the traffic that moves between the client application andthe server under test. When recording is complete, the Silk Performer Recorder automatically generates atest script that is based on the recorded traffic. Scripts are written in the Silk Performer scripting language,Benchmark Description Language (BDL).
Defining a Browser-Driven Web Load Test Project1. Click Start here on the Silk Performer workflow bar.
Note: If another project is already open, choose File > New Project from the menu bar andconfirm that you want to close your currently open project.
The Workflow - Outline Project dialog box opens.
2. In the Name text box, enter a name for your project.
3. Enter an optional project description in Description.
4. From the Type menu tree, select Web browser-driven (AJAX).
5. Click Next to create a project based on your settings.
The Workflow - Model Script dialog box appears.
Recording a Test ScriptRecording browser-driven scripts is available for Internet Explorer only.
1. Click Model Script on the workflow bar. The Workflow - Model Script dialog box appears.
2. Select Silk Performer Browser Application from the Recording Profile list.
3. In the URL field, enter the URL that is to be recorded.
Note: The InsuranceWeb sample Web 2.0 application is available at http://demo.borland.com/InsuranceWebExtJS/. In the Select a Service or login list, the Auto Quote and Agent Lookupservices are available for testing while the other listed services do not provide any functionality.
4. Click Start recording.
8 | Browser-Driven Web Load Testing Tutorial
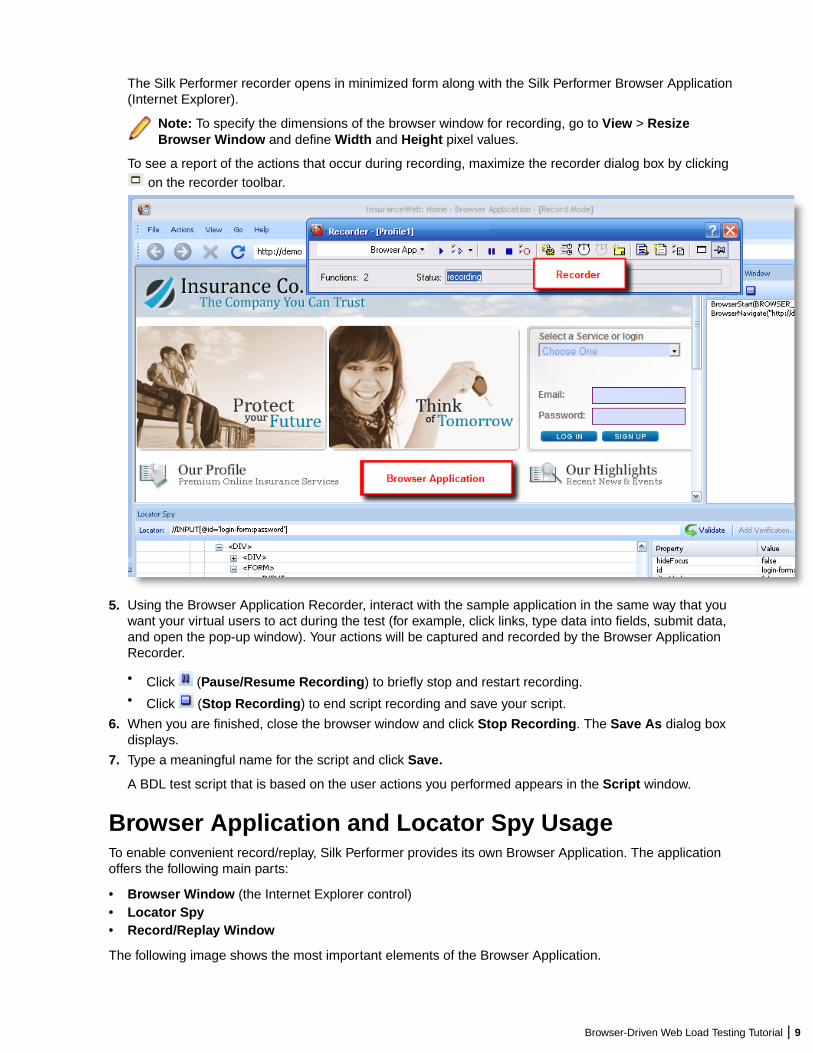
The Silk Performer recorder opens in minimized form along with the Silk Performer Browser Application(Internet Explorer).
Note: To specify the dimensions of the browser window for recording, go to View > ResizeBrowser Window and define Width and Height pixel values.
To see a report of the actions that occur during recording, maximize the recorder dialog box by clicking on the recorder toolbar.
5. Using the Browser Application Recorder, interact with the sample application in the same way that youwant your virtual users to act during the test (for example, click links, type data into fields, submit data,and open the pop-up window). Your actions will be captured and recorded by the Browser ApplicationRecorder.
• Click (Pause/Resume Recording) to briefly stop and restart recording.• Click (Stop Recording) to end script recording and save your script.
6. When you are finished, close the browser window and click Stop Recording. The Save As dialog boxdisplays.
7. Type a meaningful name for the script and click Save.
A BDL test script that is based on the user actions you performed appears in the Script window.
Browser Application and Locator Spy UsageTo enable convenient record/replay, Silk Performer provides its own Browser Application. The applicationoffers the following main parts:
• Browser Window (the Internet Explorer control)• Locator Spy• Record/Replay Window
The following image shows the most important elements of the Browser Application.
Browser-Driven Web Load Testing Tutorial | 9

Note: Tracking of UI elements must be enabled before you can select a DOM object. When tracking isenabled, a green rectangle appears around UI elements as your cursor passes over them. ClickEnable Tracking if tracking is not currently enabled.
Record/Replay Window
This window displays logging information during both record and replay. It allows you to start/stop andpause/resume recording during record mode and to pause/resume replay during replay mode.
Browser Navigation Bar
The bar enables standard browser navigation.
Highlighted DOM Element
When you move your mouse over a web page, the DOM elements under the cursor are being highlighted ingreen. The green rectangles help you to get a feeling for the architecture of the web page and its DOMhierarchy.
Inspected DOM Element
Pressing Pause/Break triggers the following actions:
• The highlighted DOM element becomes the inspected DOM element.• The position of the inspected DOM element is indicated by blue highlighting.• The DOM hierarchy tree of the current page is determined and displayed in the Locator Spy by the
HTML tags of the DOM elements.• The path to the inspected DOM element is expanded and the inspected DOM element is selected.• The attributes of the inspected DOM element are displayed.• The locator for the inspected DOM element is determined and displayed in the Locator field.
To search within the Locator Spy, press Ctrl+F on your keyboard. Alternatively, select Actions > Find inDOM Tree. You can search for strings within Tags, Property names, or Property values.
To change the inspected DOM element, press Pause/Break on any highlighted DOM element or selectanother DOM element within the DOM hierarchy tree.
When you select another DOM element in the DOM hierarchy tree, the locator for the DOM element isdetermined and displayed next to its HTML tag. The locator field is updated and the DOM element ishighlighted in blue.
When a page’s DOM becomes invalid after pressing Pause/Break and the locator for the newly selectedDOM element can not be found, a red border is displayed around the locator field. Press Pause/Break torefresh the hierarchy tree and to highlight the current DOM object. Locator strings in the DOM hierarchytree are also removed as they are now invalid.
Locator Field
The locator field shows the locator string of the currently inspected DOM element. Whenever the inspectedDOM element changes, the locator string is updated.
The locator field can be used to copy a locator string to another location, for example to a BDL script. Oryou can use the field to manually edit locator strings. When you edit a locator, it is automatically beingvalidated. If the locator is invalid, it is highlighted in red. If the locator is valid, it is highlighted in green.
If you want to add a verification during a try script run, pause the replay and click Add Verification. Addingverifications during a try script run works exactly as during recording.
In the right window of the Locator Spy, you can right-click a property and copy the property name, theproperty value, or both to the clipboard. If you copy both, the string will be saved in the form
10 | Browser-Driven Web Load Testing Tutorial
@name='value'. A real-world example is @hideFocus='false'. This way, you can convenientlyexchange properties in the locator field.
Attributes of Inspected DOM Element
This is a list of attributes (name/value pairs) belonging to the currently inspected DOM element. If thecurrent locator string does not fit your needs, you can manually build a specific locator string using some ofthe listed attributes.
Locator Verification in Browser ApplicationThe Browser Application offers commands that make it easier to analyze and navigate locator informationin the Replay window. Right click any API call in the Replay window to access context-sensitive commandsfor copying that call's locator information, copying the content of the Info column, and displaying the locatorof the call in the Locator Spy DOM hierarchy tree.
Such commands can be useful when, for example, a locator verification or an API call fail. You can use thelocator of the API call to locate the call in Locator Spy, troubleshoot the issue, and edit the scriptaccordingly. You can also use the Copy command to copy and paste API details into emails and issuereports.
Inserting Mouse MoveWhen you are testing websites where items only appear if you are hovering with your mouse over certainelements (for example a button or a menu item), you will get an error during the replay of the script. SilkPerformer cannot detect the item because the hovering event is not recorded. Menus that are built withJavaScript are a good example for such a case. However, with Silk Performer you can fix this problemduring the replay of a script.
In the Browser Application, you can click the Troubleshoot button when the error occurs, select InsertMouse Move from the list, move the mouse over the UI element, press <Pause/Break> on your keyboard,click Insert, and click Rerun Script. Now the script will run without an error.
Inserting a Verification Function1. During browser-driven script recording using the Browser Application, select a DOM object that contains
a value you want to later verify during script replay (press Pause/Break on your keyboard to select aDOM object).
Note: Tracking of UI elements must be enabled before you can select a DOM object. Whentracking is enabled, a green rectangle appears around UI elements as your cursor passes overthem. Click Enable Tracking if tracking is not currently enabled.
The locator of the selected UI object appears in the Locator text box and the DOM hierarchy isdisplayed in the tree menu.
2. Click Add Verification.
The Add Verification button is enabled when a locator value appears in the Locator field.
The Add Verification Function dialog box appears with the locator value preloaded in the Locatorfield.
3. Select a DOM Property name (For example, href, class, onmousedown, or textContents).
To serve as a meaningful verification function, the selected property name should have a verifiableProperty value. For example, property name href should have a property value of a specific URL.
4. Click Okay to insert a BrowserVerifyProperty verification function for the selected DOM elementand its corresponding property name/value pair into the script.
Browser-Driven Web Load Testing Tutorial | 11
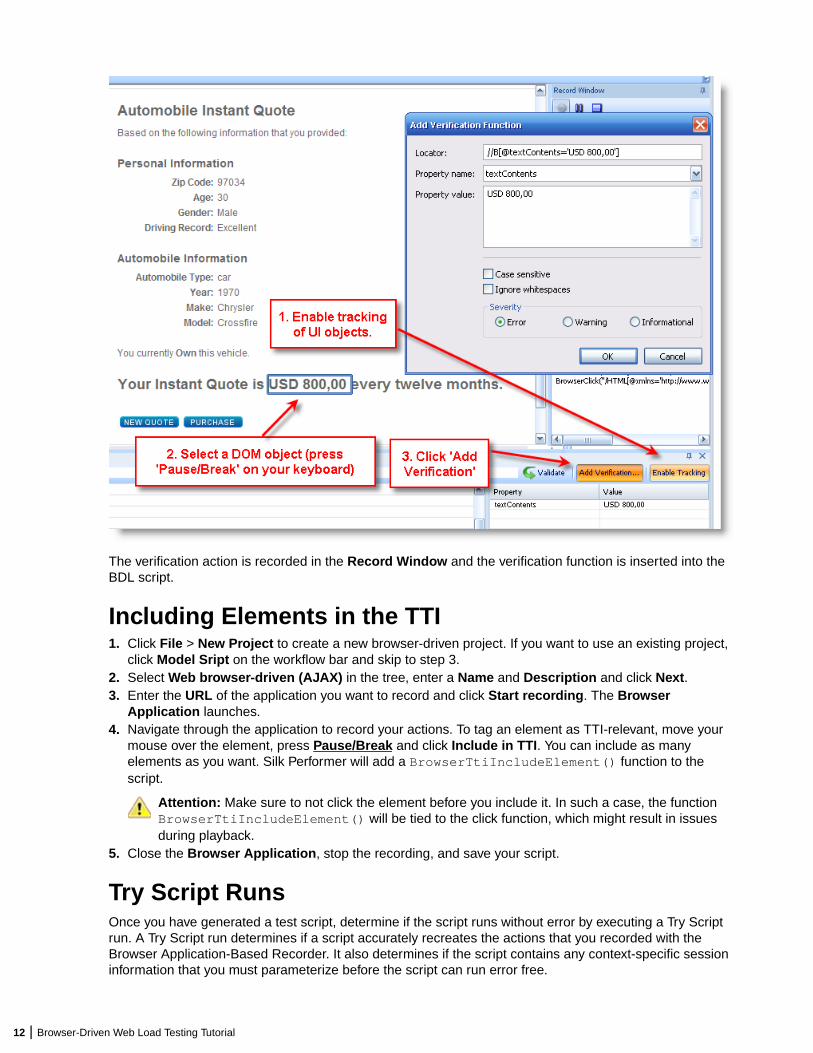
The verification action is recorded in the Record Window and the verification function is inserted into theBDL script.
Including Elements in the TTI1. Click File > New Project to create a new browser-driven project. If you want to use an existing project,
click Model Sript on the workflow bar and skip to step 3.2. Select Web browser-driven (AJAX) in the tree, enter a Name and Description and click Next.3. Enter the URL of the application you want to record and click Start recording. The Browser
Application launches.4. Navigate through the application to record your actions. To tag an element as TTI-relevant, move your
mouse over the element, press Pause/Break and click Include in TTI. You can include as manyelements as you want. Silk Performer will add a BrowserTtiIncludeElement() function to thescript.
Attention: Make sure to not click the element before you include it. In such a case, the functionBrowserTtiIncludeElement() will be tied to the click function, which might result in issuesduring playback.
5. Close the Browser Application, stop the recording, and save your script.
Try Script RunsOnce you have generated a test script, determine if the script runs without error by executing a Try Scriptrun. A Try Script run determines if a script accurately recreates the actions that you recorded with theBrowser Application-Based Recorder. It also determines if the script contains any context-specific sessioninformation that you must parameterize before the script can run error free.
12 | Browser-Driven Web Load Testing Tutorial
With Try Script runs, only a single virtual user is run and the stress test option is enabled so that thereis no think time or delay between transactions.
Note: The default option settings for browser-driven Try Script runs do not include live display ofcontent downloaded during testing (via TrueLog Explorer), though they do include the writing of logfiles, report files, and replay within the Browser Application Replay window.
Trying Out Your Test Script1. Click Try Script on the workflow bar. The Try Script dialog box appears with the script you created
selected in the Script list and the active profile selected in the Profile list. The VUser virtual user groupis selected in the Usergroup group box.
2. Configure settings as follows:
a) Select a Browser from the list: Internet Explorer, Mozilla Firefox, or Chrome.b) Enable the Visible client option so that the browser Replay window will display the web page
content.
Screenshots of the application state are made before each API function call.
Note: Simulation settings are not applied when replaying your script with the browser.
c) Enable the Step by step execution option to run your script step by step. This option is available forInternet Explorer only.
3. Click Run.
Note: You are not running an actual load test here, only a test run with a single virtual user to seeif your script requires debugging.
The Try Script run begins. The Monitor window opens, giving you detailed information about the run’sprogress.
Using Step-by-Step Try Script ReplayWhen you enable Step by step execution on the Try Script dialog box, you are given the option ofadvancing your Try Script replay one step at a time. This option is available for Internet Explorer only.
1. Execute a Try Script run as explained above.
Enable the Step by step execution option on the Try Script dialog box.
2. Use the buttons in the Replay Window to control replay:
• Click (Replay Step) to execute the current API call.• Click (Replay Run) to execute the remaining API calls without further interruption.• Click (Stop Replay) to end the Try Script run.
Common Replay ErrorsSome typical reasons why scripts do not play accurately after recording are listed below. In such instancesyou will need to customize your test script.
• Stateful scripts: Recorded scripts only work when the application under test has the same state duringreplay that it had during script recording. For example, a script that includes user login can only be runcorrectly when the application is in a logged-out state. You can work around this issue by either settingthe application state by manually adding logic to your script, or you can ensure that your recordedscripts do not change application state in the first place (for example, you could include user log outduring the recording of your script).
• Temporarily generated DOM attributes: Some AJAX frameworks generate attributes that changeeach time a page is loaded (for example, x-auto values in ext). If a locator relies on such attributes,
Browser-Driven Web Load Testing Tutorial | 13

script replay will fail. You will need to add the attributes to the ignored attributes list to prevent them frombeing recorded in the future.
• Missing mouse movements: When you are testing websites where items only appear if you arehovering with your mouse over certain elements (for example a button or a menu item), you will get anerror during the replay of the script. Silk Performer cannot detect the item because the hovering event isnot recorded. Menus that are built with JavaScript are a good example for such a case. However, withSilk Performer you can fix this problem during the replay of a script. In the Browser Application, youcan click the Troubleshoot button when the error occurs, select Insert Mouse Move from the list, movethe mouse over the UI element, press <Pause/Break> on your keyboard, click Insert, and click RerunScript. Now the script will run without an error.
• Calls that run into the synchronization timeout: Built-in AJAX synchronization waits until the browseris in an idle state before API calls are returned. This is a key factor in reliable testing of AJAX-basedapplications. However, in some situations there is no idle state (for example, if a page uses polling orkeeps connections open for server-push events). In such situations the synchronization waits until itruns into a timeout. You can work around this issue by temporarily setting the synchronization modeback to HTML.
Analyzing Test ScriptsIn contrast to the Web-protocol approach to load testing, browser-driven Web load testing uses the browseritself for script validation.
The benefits of having Try Script runs performed in the browser are as follows:
• Live application state is presented in the browser.• Locator Spy functionality for advanced script modification and adaption (supported for Internet Explorer
only).• Scripts can be executed in step-by-step mode (supported for Internet Explorer only).• Screenshots are captured before each browser API call and stored in the TrueLog for future analysis.
Once a Try Script run is shown to be successful in the Browser Application, you can analyze the results ofthe Try Script run with TrueLog Explorer. Test script analysis with TrueLog Explorer involves the followingtasks:
• Viewing Virtual User Summary Reports• Finding errors• Comparing replay test runs with recorded test runs
Visual Analysis with TrueLog ExplorerOne of TrueLog Explorer’s most powerful features is its ability to visually render Web content that isdisplayed by applications under test. In effect, it shows you what virtual users see when they interact withan application.
The TrueLog Explorer interface is comprised of the following sections:
• The Workflow Bar acts as your primary interface as you work with TrueLog Explorer. The Workflow Barreflects TrueLog Explorer’s built-in testing methodology by supporting its five primary tasks.
• The API Node Tree menu on the left of the interface allows you to expand and collapse TrueLog datadownloaded during tests. Each loaded TrueLog file is displayed here along with links to all relevant APInodes. You can click a node to display a screen shot in the Screen pane and history details inInformation view.
• The Content pane provides multiple views of all received data.• The Information pane displays data regarding testing scripts and test runs, including general
information about the loaded TrueLog file, the selected API node, BDL script, and statistics.
14 | Browser-Driven Web Load Testing Tutorial

Note: To launch TrueLog Explorer from Silk Performer, choose Results > Explore TrueLog.
Analyzing a Test Run1. With the TrueLog from a Try Script run loaded into TrueLog Explorer, click the Analyze Test button on
the Workflow bar.
The Analyze Test dialog box displays.
2. Proceed with one of the following options:
• View a virtual user summary report• Look for errors in the TrueLog• Compare the replay test run to the recorded test run
Viewing a Summary ReportVirtual user summary reports are summary reports of individual Try Script runs that offer basic descriptionsand timing averages. Each report tracks a separate virtual user and presents data in tabular format.
Virtual user summary reports include details regarding the following:
• Virtual users• Uncovered errors
Browser-Driven Web Load Testing Tutorial | 15

• Response time information tracked for each transaction defined in a test script• Page timer measurements for each downloaded Web page• Individual timers and counters used in scripts (Measure functions)
Displaying a Virtual User Summary Report1. With the TrueLog generated by your Try Script run loaded into TrueLog Explorer, click the Analyze Test
button.
2. Click the Show the virtual user summary report link.
Enabling Summary ReportsBecause virtual user summary reports require significant processing resources, they are not generated bydefault. To enable the automatic display of virtual user reports at the end of animated TryScript runs (or byclicking the root node of a TrueLog file in the API Node Tree menu) enable the Display virtual user reportoption ( Settings > Workspace > Reports ).
Note: Virtual user reports can also be viewed within Silk Performer by right-clicking a virtual username and selecting Show Virtual User Report File.
Finding Errors in a TrueLogTrueLog Explorer helps you find errors quickly after Try Script runs. Erroneous requests can be examinedand necessary customizations can be made via TrueLog Explorer.
Note: When viewed in the API Node Tree menu, API nodes that contain replay errors are tagged withred “X” marks.
1. With the TrueLog generated by your Try Script run loaded into TrueLog Explorer, click the Analyze Testbutton.
2. Click the Find errors link. The Step through TrueLog dialog appears with the Errors option selected.
3. Click Find Next to step through TrueLog result files one error at a time.
Viewing Page StatisticsAfter verifying the accuracy of a test run, you can analyze the performance of your application under “no-load” conditions via page statistics.
Overview pages detail:
• Action time: Total page response times, including processing and rendering in the browser.• Documents time: Document download times (including server busy times), and time elapsed for receipt
of embedded objects.
Detailed action statistics show exact response times for individual Web page components, allowing you toeasily pinpoint the root causes of errors and slow page downloads.
Because Try Script runs do not include think times, the measurements they produce cannot be used topredict real-world performance.
Detailed action statistics include the following data for each page component:
• DNS lookup time• Connection time• Round-trip time• Cache statistics
16 | Browser-Driven Web Load Testing Tutorial
Note: Compared to the protocol-based approach, browser-driven test statistics do not include certainlow-level/protocol-related metrics.
Viewing an Overview Page1. From the API Node Tree menu, select the API node for which you would like to view statistics.
2. Select Browser Nodes on the Step through TrueLog dialog box.
3. Click the Statistics tab to open Statistics view.
4. Select specific components listed in the URL column for detailed analysis and page drill-down.
Comparing Record and Replay TruelogsWith Web application testing, TrueLog Explorer shows the actual Web pages that are received during tests.Live monitoring of downloaded data is available via TrueLog Explorer animated mode. Data is displayed asit is received during testing.
By comparing a TrueLog that has been generated during the script development process alongside thecorresponding TrueLog was recorded originally, you can verify that the test script runs accurately.
1. Click the Analyze Test button on the Workflow Bar. The Workflow - Analyze Test dialog box appears.
2. Click Compare your test run.
3. The corresponding recorded TrueLog opens in Compare view and the Step through TrueLog dialogbox appears with the Browser Nodes option selected, allowing you to run a node-by-node comparisonof the TrueLogs.
4. Click the Find Next button to step through TrueLog result files one page at a time.
Note: Windows displaying content presented during replay have green triangles in their upper leftcorners. Windows displaying content originally displayed during application recording have redtriangles in their upper left corners.
Configuring Project Profile SettingsSilk Performer offers a variety of browser-driven Web load-testing profile settings. Web (browser-driven)profile settings are project-specific settings that relate to synchronization and object locator generation.These settings are specified on a per-project basis.
Note: For the purposes of this tutorial, you do not need to change the default settings.
Configuring Browser-Driven Recording Settings1. Right-click the Profiles node in the Project tree menu and select Edit Active Profile. The Profile -
[Profile1] - Simulation dialog box displays at the Simulation tab (Replay category).
2. Click Record.
3. Scroll down and select Web (Browser Driven).
4. Select the Recording tab.
5. Type any DOM attribute names that should be ignored during recording in the Ignored DOM attributenames text field. Attribute names that match any pattern in the Ignored DOM attribute names field willbe ignored during recording.
6. Type any DOM attribute values that should be ignored during recording in the Ignored DOM attributevalues text field. Attribute values that match any pattern in the Ignored DOM attribute values field willbe ignored during recording.
Browser-Driven Web Load Testing Tutorial | 17
7. The Preferred DOM attribute names option configures the name of the custom attributes that arerecorded.
8. Click OK.
Configuring Browser-Driven Replay Settings1. In the Projects tree menu, right-click the Profiles node and select Edit Active Profile. The Profile -
[Profile1] - Simulation dialog box opens at the Simulation tab.
2. Click the Replay category button.
3. Scroll down to and select Web (Browser Driven). The Web (Browser Driven) / General tab displays.
4. Select the browser you want to use for this settings profile from the list.
5. Use the Simulation group box to set options for realistic simulation of users visiting Web sites:
• Click the First time user option button to generate a realistic simulation of users who visit a Web sitefor the first time.
Persistent connections will be closed, the Web browser emulation will be reset, and the documentcache, the document history, the cookie database, the authentication databases, and the SSLcontext cache will be cleared after each transaction. In such instances, Silk Performer downloads thecomplete sites from the server, including all files.
• Click the Revisiting user option button to generate a realistic simulation of users who revisit a Website. Non-persistent sessions will be closed, but the document history, the persistent cookiedatabase, and the context cache will not be cleared after each transaction. In such cases, pages arenot downloaded if they exist in the document cache.
• Select the IE Compatibility Mode to define the rendering mode that Internet Explorer (IE) uses todisplay automatic replaying on the user's Web browser. The Default value depends on the user'sInternet Explorer browser version.
Note: Simulation settings are not applied when replaying your script with the Browser Application.However, all caching settings that you configure within Internet Explorer's Internet options will beapplied to your browser-driven tests.
6. Select a replay compatibility to define how locators are generated. Setting this option ensures flawlessreplay of older scripts with newer versions of Silk Performer and therefor helps to avoid compatibilityissues. You can also define the replay behavior for every single script by manually scripting theBrowserReplayCompatibility function.
7. Ensure that the Legacy input mode setting is disabled.
8. Click the Synchronization tab.
9. Configure Synchronization settings as required.
• The Synchronization mode option configures the algorithm that is used to wait for the ready stateof a browser invoke call (pre and post invocation).
• The Synchronization timeout option configures the maximum time in milliseconds that is used towait for an object to be ready (pre and post invocation).
• In the URLs to exclude from synchronization text box, type the entire URL or a fragment of theURL for any service or Web page that you want to exclude. Some AJAX frameworks or browserapplications use special HTTP requests, which are permanently open in order to retrieveasynchronous data from the server. These requests may let the synchronization hang until thespecified synchronization timeout expires. To prevent this situation, either use the HTMLsynchronization mode or specify the URL of the problematic request here. Separate multiple entrieswith a comma.
• The Object resolve timeout option configures the maximum time in milliseconds to wait for anobject to be resolved during replay.
• The Object resolve retry interval option configures the time in milliseconds after which anotherreplay attempt should be made following an object not resolving.
18 | Browser-Driven Web Load Testing Tutorial
10.Click OK.
Advanced Concepts for Browser-driven Tests
Defining Browser Window Dimensions for RecordingLaunch the Browser Application for browser-driven load testing .
Note: Browser dimensions can only be defined during script recording.
1. To define specific browser-window dimensions for recording, go to View > Resize Browser Window.The Resize Browser Window dialog box is displayed.
2. Specify a Width setting (in pixels).
3. Specify a Height setting (in pixels).
4. Click OK.
Testing Websites That Use Non-system CodepageCharactersSilk Performer is a multibyte character set (MBCS) based application. When you use browser-driven loadtesting, you must set the correct system codepage. This ensures that the characters displayed on thewebsite are processed correctly.
To enable browser-driven load testing of websites that use non-displayable characters, Silk Performerconverts these characters. For example: The following string is converted to a set of numbers:
The numbers represent the Unicode value of each character in the hexadecimal format. When you replay ascript, Silk Performer converts the string back and uses it while driving the browser.
Note: Silk Performer applies the conversion only in Browser-Driven API calls. Do not use non-displayable characters in other API calls.
Time to InteractTesting AJAX websites is challenging
Measuring the user experience of AJAX websites with the timings the browser provides can be difficult. Auser can consider a web page as ready, although the processing in the background is not yet completed.Also, the processing might be completed, but the web page is not yet ready for the user at that point intime. Essential page elements might be loaded asynchronously, that is after the onLoad Function phaseand during the Asynchronous Application Logic phase. In such a case, the perceived loading time of a webpage can differ considerably from the measured loading time. As a result, Silk Performer introduced the so-called Time to Interact (TTI).
The Time to Interact
In Silk Performer terminology, the Time to Interact is defined as the time from a user interaction (such asnavigating to a URL or a click on a link) until all relevant elements a user requires to interact with the pageare ready; even if the page has not yet completely loaded. Identifying the relevant elements of a page cannot simply be automated, as it heavily depends on the use case and on the perspective which elements toconsider relevant. For example: A web shop company can test their website from their own perspective and
Browser-Driven Web Load Testing Tutorial | 19
from the perspective of their customers. From the company-perspective, the elements that contain thespecial offers might be considered relevant. But from the customer-perspective, just the search field mightbe considered relevant.
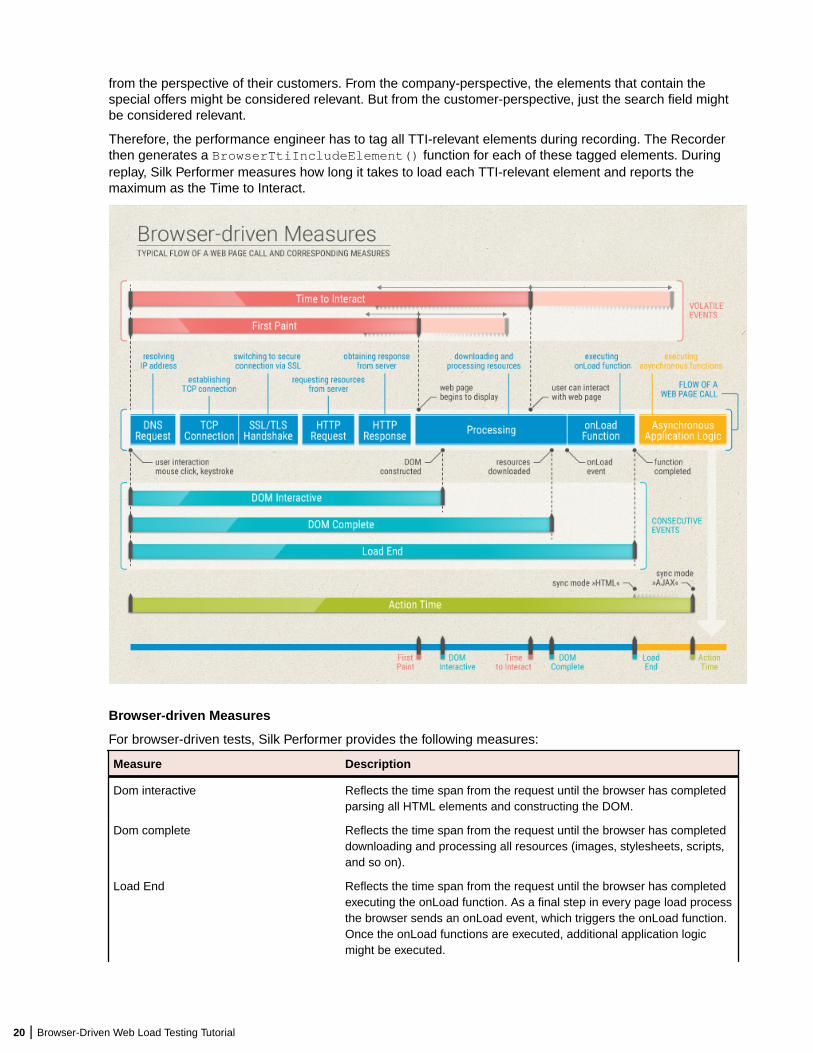
Therefore, the performance engineer has to tag all TTI-relevant elements during recording. The Recorderthen generates a BrowserTtiIncludeElement() function for each of these tagged elements. Duringreplay, Silk Performer measures how long it takes to load each TTI-relevant element and reports themaximum as the Time to Interact.
Browser-driven Measures
For browser-driven tests, Silk Performer provides the following measures:
Measure Description
Dom interactive Reflects the time span from the request until the browser has completedparsing all HTML elements and constructing the DOM.
Dom complete Reflects the time span from the request until the browser has completeddownloading and processing all resources (images, stylesheets, scripts,and so on).
Load End Reflects the time span from the request until the browser has completedexecuting the onLoad function. As a final step in every page load processthe browser sends an onLoad event, which triggers the onLoad function.Once the onLoad functions are executed, additional application logicmight be executed.
20 | Browser-Driven Web Load Testing Tutorial
Measure Description
First paint Reflects the time span from the request until the page begins to display.This measure is available for Internet Explorer only.
Time to interact Reflects the time span from the request until all TTI-relevant elementsare available on the page. At this point in time, the user can interact withthe web page.
Action time Reflects the time span from the request until the browser has completeddownloading and processing all resources. The end of this time spanvaries, depending on the defined synchronization mode: If thesynchronization mode HTML is defined, the action time ends when theonLoad function is completed. If the synchronization mode AJAX isdefined, the action time ends during the Asynchronous Application Logicphase.
Note: DOM interactive, DOM complete, and Load end can be described as consecutive events.These events all end during the Processing phase. In contrast, First paint and Time to interact arecompletely website-dependent; they can end in the HTTP Response phase, in the Processing, and inthe Asynchronous Application Logic phase.
Troubleshooting Browser-Driven Load Testing IssuesLearn how to start the perfrun process using an actual user account, handle client certificates, and excludespecific URLs from AJAX synchronization.
Note: Browser-driven load testing is supported for Internet Explorer 11.
Browser-Driven Virtual Users on Remote AgentsStarting a remote agent with an actual user account rather than the system account, which is the default,makes a big difference for browser-driven virtual users. Each virtual user employs its own Internet Explorerinstance, which loads the settings stored in the Microsoft Windows user's profile.
Under the system account, Internet Explorer loads different settings than under a user account. TypicallyInternet Explorer utilizes fewer or different HTTP headers than with user accounts. In order to avoid theissue of recorded traffic differing from generated traffic, it is recommended to run remote agents under auser account.
Note: Ensure that the specified user account is a member of the Remote Desktop Users Windowsgroup on the remote agent.
The required account setting can be configured in System Configuration Manager on the Applications tabor a user account can be set in the System Settings > Agents > Advanced tab if all remote agentsshould run under the same user account.
Recommended Internet Explorer settings on agentsWhen executing browser-driven load tests using Internet Explorer, make sure that the Internet Explorerinstallation on your agents is set-up as described below. Otherwise, you might experience issues duringreplay.
• In Internet Explorer, open the Internet Options and set the home page to about:blank.• In the Internet Options, on the Advanced tab, in the Security section ...
• disable Check for publisher's certificate revocation
Browser-Driven Web Load Testing Tutorial | 21
• disable Check for server certificate revocation• disable Warn about certificate address mismatch
• In the Internet Options, on the Security tab, do the following for each zone (Internet, Local intranet,Trusted sites, Restricted sites):
• uncheck Enable Protected Mode• set the lowest possible security level
• In Internet Explorer, in the Compatibility View Settings ...
• disable Display intranet sites in Compatibility View• disable Use Microsoft compatibility lists• remove all added websites
• On Windows Server operating systems, open the Server Manager and disable the IE EnhancedSecurity Configuration (IE ESC).
Handling Client CertificatesThe following applies only, when you use Internet Explorer.
You can select a client certificate during script recording. Client certificates facilitate authentication againstcertain Web sites. APIs are now available for importing certificates to and deleting certificates from theMicrosoft certificate store, which is used by Internet Explorer and the Silk Performer browser-driven loadtesting feature.
The certificate APIs work with Microsoft Windows 7 or later, Microsoft Windows Server 2008 R2 or later,and Internet Explorer 8 or later.
Certificate handling for browser-based Web load testing works independently of certificate handling forprotocol-based Web testing. This means that certificates need to be imported manually via InternetExplorer's Internet Options menu entry (or the management console snap-in certmgr.msc). Ifauthentication works with Internet Explorer 8 it will also work for browser-based load testing.
1. When importing your certificate, disable strong private key protection:a) On the Certificate Import wizard Password page, uncheck the Enable strong private key
protection checkbox.2. Disable server certificate revocation:
a) Open Internet Explorer's Tools menu and select Internet Options. The Internet Options dialogopens.
b) Click the Advanced tab.c) Uncheck the Check for server certificate revocation* checkbox.d) Click OK.
3. Activate prompting of the client certificate selection dialog box:a) Open Internet Explorer's Tools menu and select Internet Options. The Internet Options dialog
opens.b) Click the Security tab.c) Click Custom Level... The Security Settings page opens.d) Scroll down to Don't prompt for client certificate selection when no certificates or only one
certificate exists and select the Disable option box.e) Click OK.f) Restart Internet Explorer.
Removing Certificate ErrorsThe following applies only, when you use Internet Explorer.
During recording a Web page may appear with the message There is a problem with thiswebsite's security certificate. Additionally the Continue to this website (not
22 | Browser-Driven Web Load Testing Tutorial
recommended) link does not work. Certificate errors can occur due to multiple reasons and you mustresolve any certificate errors before you can record a Web site browser-driven. For more information oncertificate errors, visit About certificate errors.
One of the more common problems is an address mismatch. To disable address-mismatch warnings:
1. Open Internet Explorer's Tools menu and select Internet Options. The Internet Options dialog opens.
2. Click the Advanced tab.
3. Uncheck the Warn about certificate address mismatch* checkbox.
4. Click OK.
5. Restart Internet Explorer.
Excluding URLs from AJAX SynchronizationTo better facilitate the testing of AJAX-based Web applications, specific URLs can be excluded frombrowser synchronization.
To illustrate the value of this, imagine that an application displays server time by polling data from theserver. This service requires a constant stream of traffic between the client and the server. This presents achallenge to AJAX synchronization because the application never goes into an idle state. By excluding thisservice from synchronization, other application processes that use different services can be accuratelytested.
1. Right-click a profile in the Project menu tree and select Edit Profile. The Profile - Simulation windowopens.
2. In the Replay group box, click the down arrow to scroll down. Click Web (Browser Driven).
3. Select the Synchronization tab.
4. Enter URLs to be excluded into the URLs to exclude from synchronization text field.
5. Click OK.
Note: When URL exclusion is not feasible due to there being multiple processes running within asingle service, you need to disable AJAX synchronization and switch to HTML mode.
Limitations for Replay with Different BrowsersSilk Performer uses Internet Explorer to record browser-driven scripts. To replay these scripts, you can useeither Internet Explorer, Firefox, or Chrome.
Although these browsers basically resemble each other, they can behave quite differently in a variety ofcircumstances. This can also result in different behavior, when replaying the very same script with differentbrowsers.
Below you can find a number of areas where you might encounter differences or issues. Note that many ofthe described issues are corner cases and rarely occur. Also note that the limitations heavily depend onyour specific use case and on the application under test, including the underlying frameworks. Therefore, itis not possible to describe every potential limitation in every detail. If you encounter a specific limitation andneed more information, contact SupportLine.
Mouse clicks
When replaying scripts, mouse clicks are processed differently in different browsers. Or in other words: Theapplication under test receives different click events, depending on the used browser. For example:Replaying a double-click, raises a click and a double-click event in Internet Explorer and Firefox - this is thedefault behavior. But replaying a double-click in Chrome, raises just a double-click event.
Here is another example: When replaying a script in Chrome, the right-click event fails when the center ofthe clicked element is not visible. But in Internet Explorer and Firefox, the right-click event works flawlessly,even if the center of the clicked element is obscured.
Browser-Driven Web Load Testing Tutorial | 23

Key strokes
Using key strokes within browsers also results in different behavior. For example: When the cursor isplaced within a text field within Internet Explorer and you press the Esc key, everything you have typed sofar is being removed. Pressing the Esc key in the other browsers has no effect. Another example is thatFirefox and Chrome do not differentiate between the Return key and the Enter key on the numpad, whileInternet Explorer does.
Locators
A browser might use an element attribute that the other browsers do not use. For example: InternetExplorer uses spellcheck as a generic attribute that exists for every element, while Chrome and Firefoxonly use the attribute when it is explicitly specified. Since Internet Explorer is used for recording the script,this results in an error when the script is replayed with Chrome or Firefox.
New windows
When your application under test uses a number of short-lived pop-up windows, this might result inunstable behavior. Here is a real-world example that might cause issues: You click a link that opens a pop-up window. This window immediately triggers another window to open, and then it closes again. When youuse Firefox or Chrome, the window might be missed during replay. A possible workaround is to use thecustom function BrowserWaitForNewWindowWithLocator, which is located in the BrowserAPI.bdh.
Invalid URLs
When you navigate to an invalid URL, Internet Explorer raises an error, while Chrome and Firefox do not.This can be problematic when monitoring a URL. The monitor will never raise an error, although the URLcannot be reached. For such a case, it can be useful to add a verification function to your script.
Measures
Due to the diverse replay technologies and the different architectures of the applications under test, somemeasures might be missing. For example: Some traffic might not be considered, because the applicationunder test uses redirects or iframes.
Alert handling
When you use Firefox or Chrome to replay scripts, only JavaScript alerts and prompts can be handled.Native dialogs, like the file save or file open dialog, are not supported.
Compatibility mode
Scripts that are created using Silk Performer 18.5 or an earlier version, use a different replay compatibilitymode. You can set the compatibility mode in the profile settings or by using the BDL functionBrowserReplayCompatibility.
In the past, locators used to be tailored to Internet Explorer, because it was the only supported browser.Thus, the locators used in these older scripts might cause replay issues.
24 | Browser-Driven Web Load Testing Tutorial
IndexA
action time 16AJAX
analyzing a test run 15analyzing test scripts 14browser configuration 6common replay errors 13comparing record/replay TrueLogs 17configuring recording settings 17creating a test script 8defining a project 8defining browser dimensions for recording 19displaying a summary report 16enabling summary reports 16Finding errors in a TrueLog 16Locator Spy 9modeling a test script 8project profile settings 17replay settings 18running multiple virtual users 7sample Web 2.0 application 4
Try Script runsstep-by-step replay 13
verification functions 11viewing a summary report 15viewing an overview page 17viewing page statistics 16visual analysis withTrueLog Explorer 14
AJAX synchronizationbrowser-driven Web testing 23excluding URLs 23
B
browser-drivenadvanced concepts 19limitations for replay 23native replay 6recommended IE settings 21
browser-driven Web testingAJAX
synchronization 23analyzing a test run 15analyzing test scripts 14browser configuration 6certificate errors 22client certificates 22common replay errors 13comparing record/replay TrueLogs 17configuring recording settings 17creating a test script 8defining a project 8defining browser dimensions for recording 19displaying a summary report 16enabling summary reports 16finding errors in a TrueLog 16Locator Spy 9
modeling a test script 8pop-up window in the sample Web 2.0 application 5pop-up windows 4prerequisites 21project profile settings 17record and replay traffic differs 21replay settings 18running multiple virtual users 7sample Web 2.0 application 4security certificates 22starting remote agent with user account 21troubleshooting 21
Try Script runsstep-by-step replay 13
unexpected browser behavior 6verification functions 11viewing a summary report 15viewing an overview page 17viewing page statistics 16visual analysis withTrueLog Explorer 14
C
certificate errorsbrowser-driven Web testing 22
client certificatesbrowser-driven Web testing 22
D
dialog boxessupport for HTML 5
E
error replaying browser-driven script 21excluding URLs
from AJAX synchronization 23
H
HTML dialog boxessupport for 5
M
mouse moveinserting 11
N
native replaybrowser-driven 6
non-displayable characterstesting websites that use 19
Index | 25

P
pop-up window supportsample Web 2.0 application 4, 5
pop-up windowsbrowser-driven Web testing 4
prerequisitesbrowser-driven Web testing 21
S
security certificatesbrowser-driven Web testing 22
T
time to interactincluding elements in the 12
Time to InteractTTI 19
troubleshootingbrowser-driven Web testing 21
TTITime to Interact 19
U
unable to replay browser-driven script 21
W
Web 2.0 testinganalyzing a test run 15analyzing test scripts 14browser configuration 6common replay errors 13comparing record/replay TrueLogs 17configuring recording settings 17creating a test script 8defining a project 8defining browser dimensions for recording 19displaying a summary report 16enabling summary reports 16finding errors in a TrueLog 16Locator Spy 9modeling a test script 8project profile settings 17replay settings 18running multiple virtual users 7sample AJAX-based application 4, 5
Try Script runsstep-by-step replay 13
verification functions 11viewing a summary report 15viewing an overview page 17viewing page statistics 16visual analysis withTrueLog Explorer 14
26 | Index