silk performer 10 - micro focus supportline · and run load tests on oracle forms applications. ......
TRANSCRIPT
Silk Performer 10.0
Oracle Forms Tutorial
Micro Focus575 Anton Blvd., Suite 510Costa Mesa, CA 92626
Copyright 2013 Micro Focus. All Rights Reserved. Portions Copyright © 1992-2009 Borland Software Corporation (a Micro Focus company).
MICRO FOCUS, the Micro Focus logo, and Micro Focus product names are trademarks or registered trademarks of Micro Focus IP Development Limited or its subsidiaries or affiliated companies in the United States, United Kingdom, and other countries.
BORLAND, the Borland logo, and Borland product names are trademarks or registered trademarks of Borland Software Corporation or its subsidiaries or affiliated companies in theUnited States, United Kingdom, and other countries.
All other marks are the property of their respective owners.
2012-11-23
ContentsContents
Introduction 1Overview . . . . . . . . . . . . . . . . . . . . . 1Silk Performer . . . . . . . . . . . . . . . . . . . 1
Chapter 1Defining Load Test Projects 3
Overview . . . . . . . . . . . . . . . . . . . . . 3Prerequisites . . . . . . . . . . . . . . . . . . . 4Defining a Load Test Project . . . . . . . . . . . 9
Chapter 2Creating Test Scripts 11
Overview . . . . . . . . . . . . . . . . . . . . 11Creating a Load Test Script . . . . . . . . . . . 12Trying Out a Generated Script . . . . . . . . . 19
Chapter 3Customizing Test Scripts 23
Overview . . . . . . . . . . . . . . . . . . . . 23Comparing Replay and Record TrueLogs. . . . 24Customizing User Data . . . . . . . . . . . . . 26Adding Verifications . . . . . . . . . . . . . . . 32
Chapter 4Defining User Profiles 39
Overview . . . . . . . . . . . . . . . . . . . . 39Defining a Custom User Profile . . . . . . . . . 40
Chapter 5Identifying Baseline Performance 43
Overview . . . . . . . . . . . . . . . . . . . . 43Finding a Baseline . . . . . . . . . . . . . . . 43Confirming a Baseline. . . . . . . . . . . . . . 45
Chapter 6Setting Up Monitoring Templates 49
Overview . . . . . . . . . . . . . . . . . . . . 49
Setting Up a Monitoring Template . . . . . . . . 50
Chapter 7Defining Workload 59
Overview . . . . . . . . . . . . . . . . . . . . 59Defining Workload . . . . . . . . . . . . . . . . 61
Chapter 8Running & Monitoring Tests 67
Overview . . . . . . . . . . . . . . . . . . . . 67Running a Test . . . . . . . . . . . . . . . . . 68Monitoring a Test . . . . . . . . . . . . . . . . 69Monitoring a Server . . . . . . . . . . . . . . . 73
Chapter 9Exploring Test Results 75
Overview . . . . . . . . . . . . . . . . . . . . 75Working with TrueLog On Error . . . . . . . . . 76Viewing an Overview Report . . . . . . . . . . 78Viewing a Graph. . . . . . . . . . . . . . . . . 90
Index 97
Silk Performer Oracle Forms Tutorial iii

iv Silk Performer Oracle Forms Tutorial
Introduction
About these tutorials The Oracle Forms Tutorial offers an overview of using Silk Performer to set up and run load tests on Oracle Forms applications.
This Introduction contains the following sections:
Overview
The Oracle Forms Tutorial is designed to ease you into the process of load testing Oracle Forms applications with Silk Performer, and to get you up and running as quickly as possible. It will help you to take full advantage of Silk Performer’s ease of use and exploit the leading-edge functionality that’s embodied in e-business’ load-testing tool of choice.
Oracle Forms, previously called “SQL*Forms,” is part of Oracle’s Internet Developer Suite (iDS). It’s a 4GL Rapid Application Development (RAD) environment that allows forms to be deployed across the Web via Oracle’s Internet Application Server (iAS) Forms Services.
Silk Performer
Silk Performer is the industry’s most powerful and easiest to use enterprise-class load and stress testing tool. Visual script generation techniques and the ability to test multiple application environments with thousands of concurrent users allow you to thoroughly test your enterprise applications’ reliability, performance, and scalability before they’re deployed—regardless of their size and complexity.
Section Page
Overview 1
Silk Performer 1
Silk Performer Oracle Forms Tutorial 1
INTRODUCTION
Silk Performer
Powerful root cause analysis tools and management reports help you isolate problems and make quick decisions—thereby minimizing test cycles and accelerating your time to market.
Silk Performer Benefits
Ensure the scalability, performance, and reliability of your enterprise applications. Silk Performer ensures the quality of your enterprise applications by measuring their performance from the end-user perspective, as well as internally, in a variety of workload scenarios and dynamic load conditions.
Test remote components early in the development cycle. Dramatically reduce the cost of bugs in your multi-tier enterprise application by testing the functionality, interoperability, and performance of remote components early in the development cycle—even before client applications have been built. You can rapidly generate test drivers for Web services, .NET remoting objects, EJB’s and Java RMI objects by exploring them via a point & click interface. Alternately, you can reuse unit test drivers written by developers for concurrency tests or you can build new test cases directly in Java and other .NET languages, such as C# and VB.NET, using Silk Performer’s Visual Studio .NET Add-In.
Pinpoint problems easily for quick resolution. Silk Performer’s unrivaled TrueLogTM technology for HTML, XML, SQL, TCP/IP, and UDP based protocol data provides full visual root-cause analysis from the end-user perspective. TrueLogs visually recreate the data that users provide and receive during load tests—for HTML pages this includes all embedded objects—enabling you to visually analyze the behavior of your application as errors occur during load tests. In addition detailed response timer statistics help you uncover the root causes of missed Service Level Agreements before your application goes live.
Reusing projects Silk Performer’s extended workflow simplifies and deepens its integration with SilkCentral® Test Manager.
By clicking Silk Performer’s new Reuse Project button, test projects can be uploaded to and reused by SilkCentralTest Manager (for test automation). See SilkCentral Test Manager documentation for details.
2 Silk Performer Oracle Forms Tutorial
1
Chapter 1 Defining Load Test ProjectsIntroduction This tutorial explains how to define an Oracle Forms load-test project in Silk Performer.
What you will learn This chapter contains the following sections:
Overview
The first step in conducting an Oracle Forms load test is to define the basic settings for your Silk Performer load-test project. A project is given a name, and optionally, a brief description. The type of application to be tested is Oracle Forms 9i, though a range of other choices are available for other projects, encompassing all the major traffic that is encountered in e-business today on the Internet and on the Web, including the most important database and distributed applications.
Though the settings that you specify will be associated with a specific load-testing project, later you’ll find that it’s easy to switch between projects, to edit projects, and to save projects so that they can later be modified and reused.
A project contains all the resources that are required to complete a load test. These include a workload, one or more profiles and test scripts, all the data files that are accessed from scripts, a specific number of agent computers, and information for server-side monitoring.
Section Page
Overview 3
Prerequisites 4
Defining a Load Test Project 9
Silk Performer Oracle Forms Tutorial 3
1 DEFINING LOAD TEST PROJECTS
Prerequisites
Prerequisites
Because Oracle Forms is based on Java technology, before you can record and replay Oracle Forms transactions, you must configure the Java Virtual Machine using Silk Performer’s profile settings. Java’s Just-In-Time Compiler must also be disabled while recording Oracle Forms 6i or higher.
Java Virtual Machine Procedure To configure the Java Virtual Machine:
1 Open the Active Profile Settings dialog box by selecting Settings/Active Profile.
2 Click the Java icon.
3 Select the version of your JVM from the Version list box.
4 Click the Browse (...) button and select the Java home directory of your JVM.
5 Select the Advanced tab.
6 Click Check JVM to verify your JVM settings.
7 Click OK on the confirmation dialog box.
Note If there is a problem with the path or settings you’ve set, make sure that a Java JDK is actually installed on your computer, and verify that your profile settings are correctly defined.
Java Just In Time Compiler
Before you can record Oracle Forms 6i or higher you must disable Java Just In Time compiler (JIT) using one of three methods:
Option #1Configure Java virtual machine settings including the command line options, JIT compiler option, and other advanced settings.
1 From the Silk Performer menu bar, choose Settings > System. The System Settings dialog box displays.
2 Click the Java icon. The General page opens.
Tip You can also open this dialog box by clicking Model Script on the Silk Performer workflow bar and Settings in the Workflow - Model Script dialog box.
3 Click the Advanced tab.
4 Silk Performer Oracle Forms Tutorial
1 DEFINING LOAD TEST PROJECTS
Prerequisites
4 In the Command line options field, enter any command line options that are to be passed to the Java Virtual Machine. Some Java classes require specific Virtual Machine options to run successfully. Tuning parameters may also be specified in VM parameters.
5 Select the Disable JIT compiler check box if you want to disable the Just In Time (JIT) compiler of the Java Virtual Machine. The JIT compiler can be disabled when required and non-standard VM DLLs can be specified.
6 Click the open folder icon to the right of the JVM dll field to navigate to the Dynamic Link Library (.dll) that implements the Java Virtual Machine that is to be used.
7 Click Check JVM to verify your Java Virtual Machine configuration settings. To ensure that the Java environment is set up properly, the configuration should be tested.
8 Click OK to save your settings.
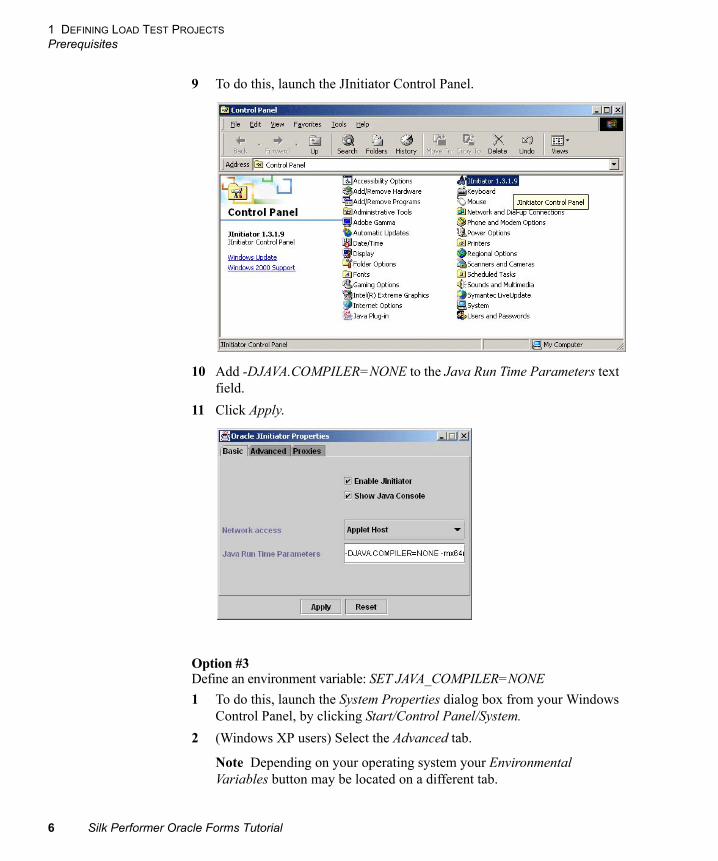
Option #2Define -DJAVA.COMPILER=NONE in the Java runtime settings of the Oracle JInitiator Properties dialog box. This must be done using the JInitator control panel, which is installed with JInitiator. For Oracle Forms 9i, this is available through the Windows control panel.
Note For Oracle Forms 6 or higher, JInitiator is installed at C:\Program Files\Oracle\Jinitiator <version>. A shortcut with the name JInitiator <version> can be found at Start/All Programs. <version> reflects the exact version, which is either 1.1.7.x or 1.1.8.x, depending on the Oracle Forms patch.
Silk Performer Oracle Forms Tutorial 5
1 DEFINING LOAD TEST PROJECTS
Prerequisites
9 To do this, launch the JInitiator Control Panel.
10 Add -DJAVA.COMPILER=NONE to the Java Run Time Parameters text field.
11 Click Apply.
Option #3Define an environment variable: SET JAVA_COMPILER=NONE
1 To do this, launch the System Properties dialog box from your Windows Control Panel, by clicking Start/Control Panel/System.
2 (Windows XP users) Select the Advanced tab.
Note Depending on your operating system your Environmental Variables button may be located on a different tab.
6 Silk Performer Oracle Forms Tutorial
1 DEFINING LOAD TEST PROJECTS
Prerequisites
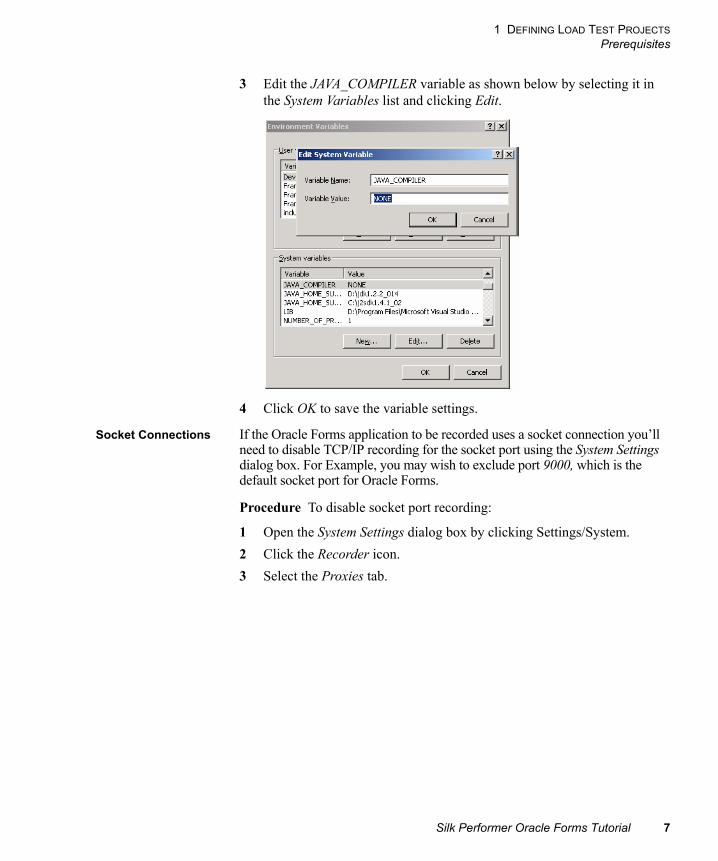
3 Edit the JAVA_COMPILER variable as shown below by selecting it in the System Variables list and clicking Edit.
4 Click OK to save the variable settings.
Socket Connections If the Oracle Forms application to be recorded uses a socket connection you’ll need to disable TCP/IP recording for the socket port using the System Settings dialog box. For Example, you may wish to exclude port 9000, which is the default socket port for Oracle Forms.
Procedure To disable socket port recording:
1 Open the System Settings dialog box by clicking Settings/System.
2 Click the Recorder icon.
3 Select the Proxies tab.
Silk Performer Oracle Forms Tutorial 7
1 DEFINING LOAD TEST PROJECTS
Prerequisites
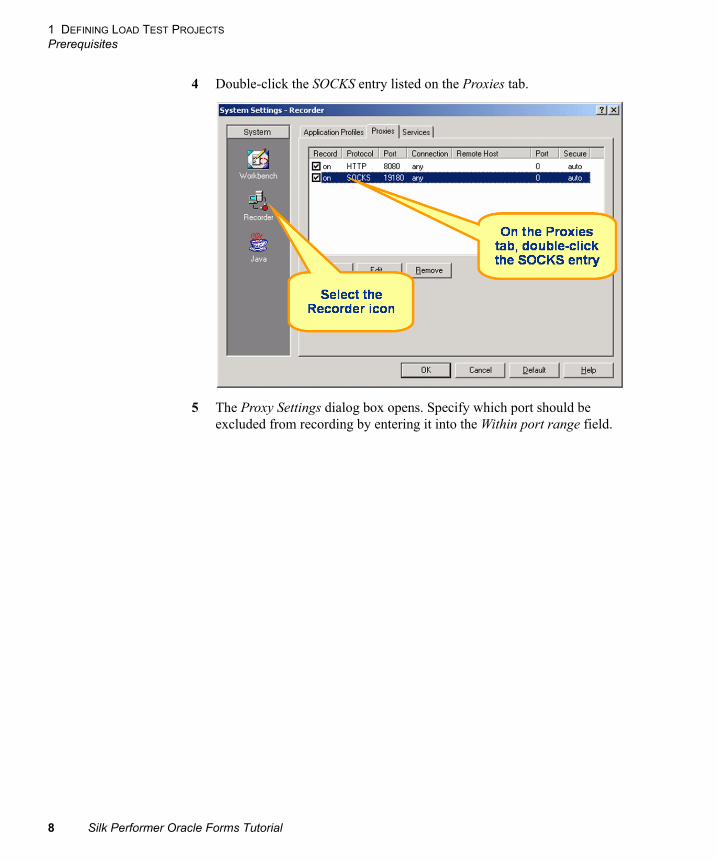
4 Double-click the SOCKS entry listed on the Proxies tab.
5 The Proxy Settings dialog box opens. Specify which port should be excluded from recording by entering it into the Within port range field.
8 Silk Performer Oracle Forms Tutorial
1 DEFINING LOAD TEST PROJECTS
Defining a Load Test Project
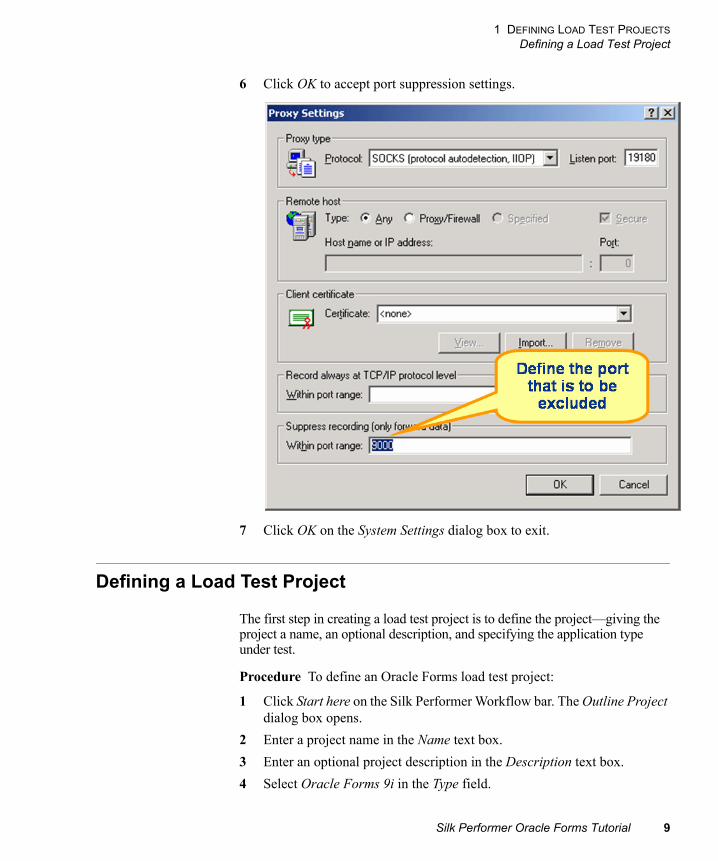
6 Click OK to accept port suppression settings.
7 Click OK on the System Settings dialog box to exit.
Defining a Load Test Project
The first step in creating a load test project is to define the project—giving the project a name, an optional description, and specifying the application type under test.
Procedure To define an Oracle Forms load test project:
1 Click Start here on the Silk Performer Workflow bar. The Outline Project dialog box opens.
2 Enter a project name in the Name text box.
3 Enter an optional project description in the Description text box.
4 Select Oracle Forms 9i in the Type field.
Silk Performer Oracle Forms Tutorial 9

1 DEFINING LOAD TEST PROJECTS
Defining a Load Test Project
5 Click OK to create a project based on your settings.
10 Silk Performer Oracle Forms Tutorial
2
Chapter 2 Creating Test ScriptsIntroduction This tutorial explains how to model load test scripts and try out test scripts via TryScript runs.
What you will learn This chapter contains the following sections:
Overview
The easiest approach to creating a load test script is to use the Silk Performer Recorder, Silk Performer’s engine for capturing and recording traffic and generating test scripts.
The Silk Performer Recorder captures and records the traffic between a client application and the server under test. When recording is complete, the Silk Performer Recorder automatically generates a test script based on the recorded traffic. Scripts are written in Silk Performer’s scripting language, Benchmark Description Language (BDL).
During the recording phase, you must define transactions. A transaction is a discrete action that can be assigned to a virtual user in a load test and for which separate time measurements can be made. You should create new transactions only for actions that don’t have dependencies on other actions. Individual time measurements can be made for any action or series of actions that occur during recording.
Section Page
Overview 11
Creating a Load Test Script 12
Trying Out a Generated Script 19
Silk Performer Oracle Forms Tutorial 11
2 CREATING TEST SCRIPTS
Creating a Load Test Script
Creating a Load Test Script
Procedure To model a load test script:
1 Click Model Script on the Silk Performer Workflow bar. The Model Script dialog box opens.
2 From the Application Profile list box, select Oracle Forms 9i to record an Oracle application.
3 In the URL field, enter the URL of the Oracle Forms application that is to be recorded.
Note Ensure that you delete your browser’s cookies if you wish to record a script that emulates the actions of a first-time user.
4 Click Start recording.
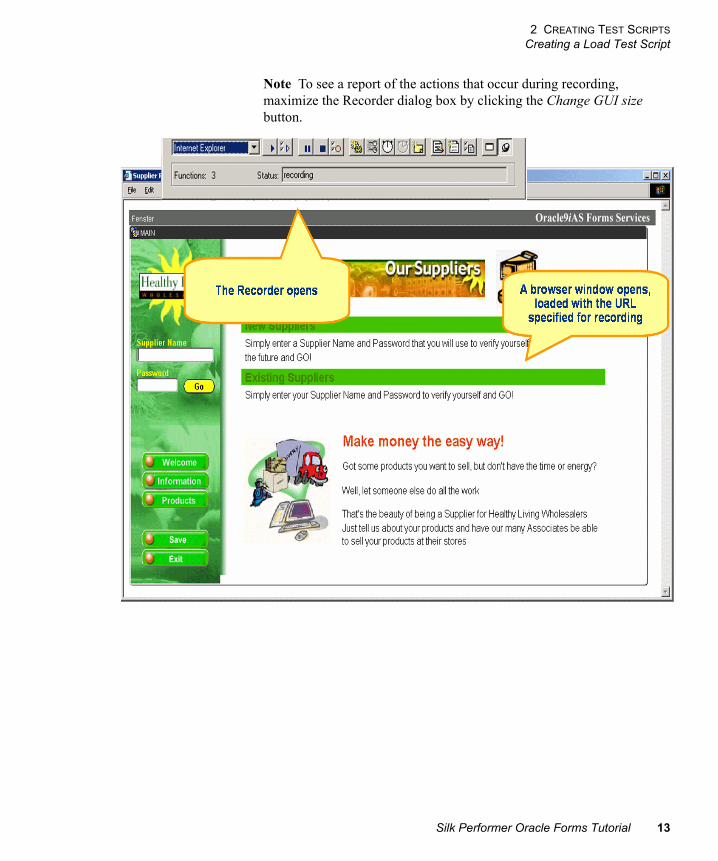
5 The Silk Performer Recorder then opens in minimized form and a browser is launched, loaded with the URL that you specified for recording.
12 Silk Performer Oracle Forms Tutorial
2 CREATING TEST SCRIPTS
Creating a Load Test Script
Note To see a report of the actions that occur during recording, maximize the Recorder dialog box by clicking the Change GUI size button.
Silk Performer Oracle Forms Tutorial 13
2 CREATING TEST SCRIPTS
Creating a Load Test Script
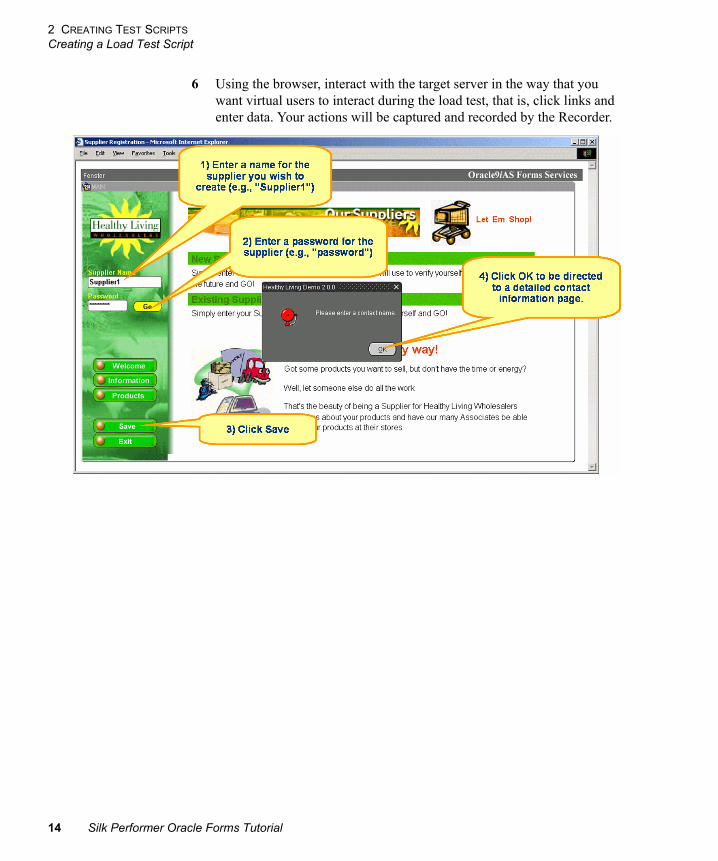
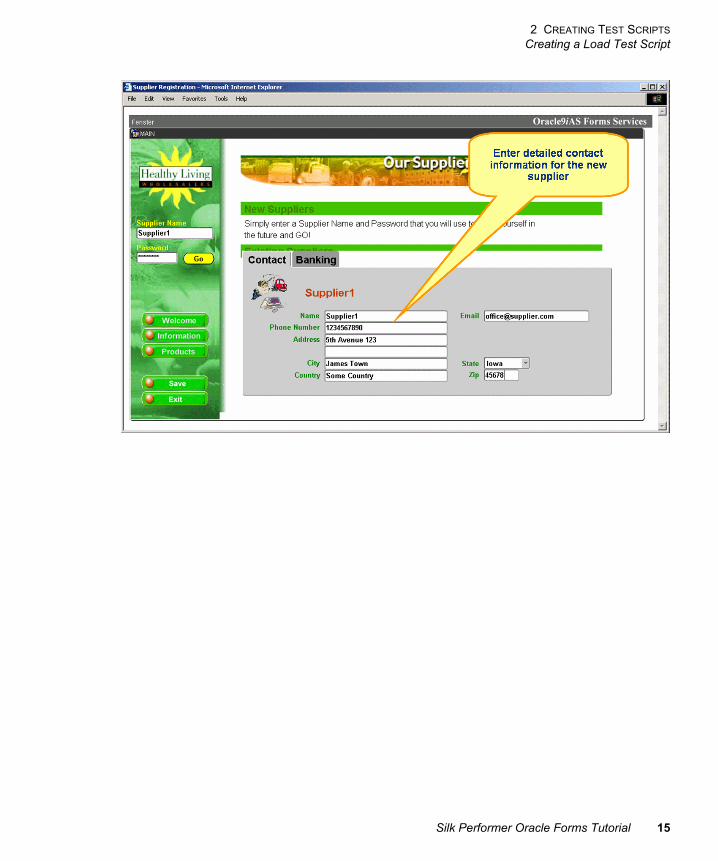
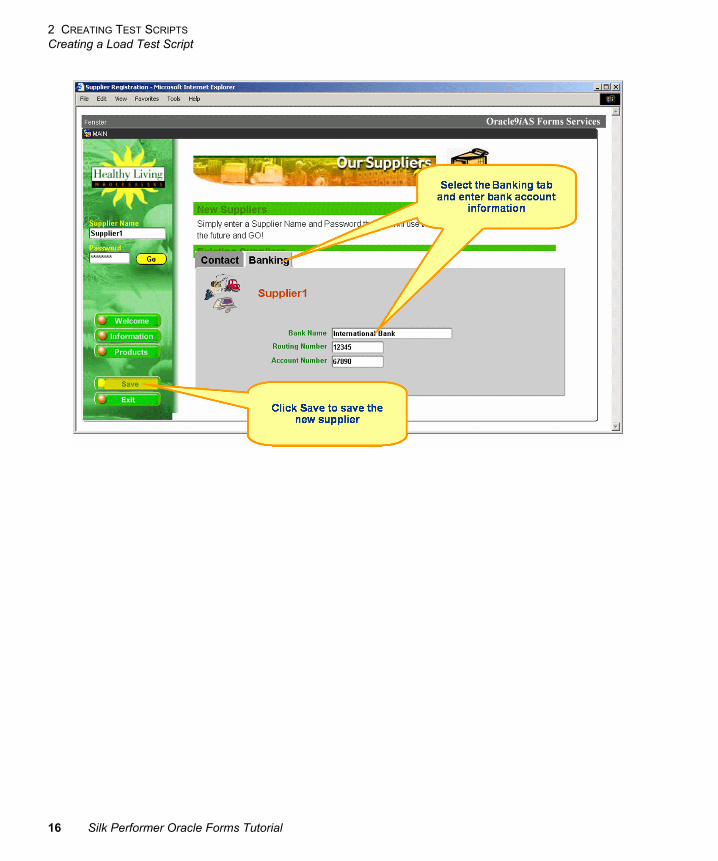
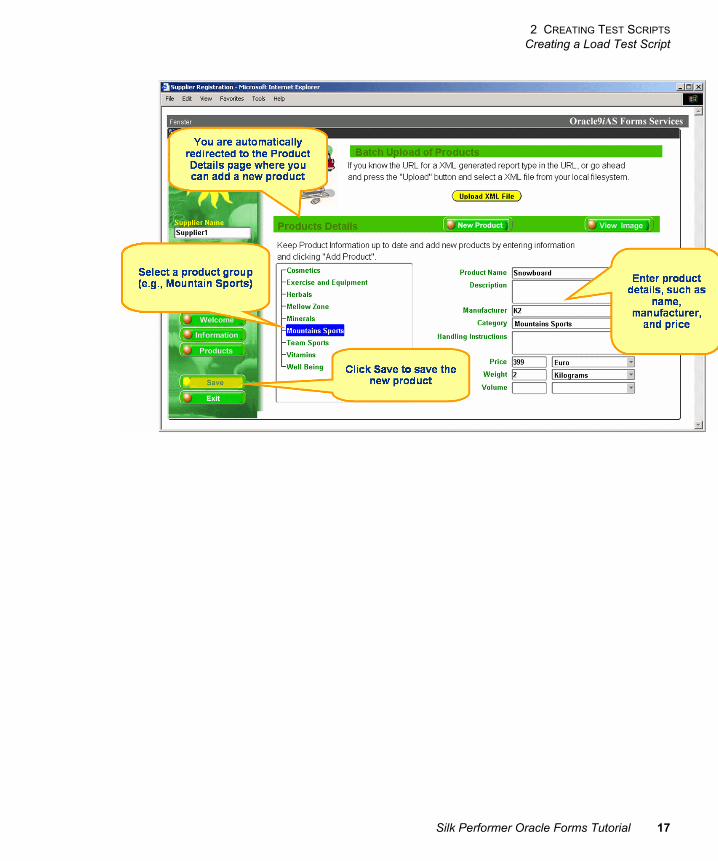
6 Using the browser, interact with the target server in the way that you want virtual users to interact during the load test, that is, click links and enter data. Your actions will be captured and recorded by the Recorder.
14 Silk Performer Oracle Forms Tutorial
2 CREATING TEST SCRIPTS
Creating a Load Test Script
Silk Performer Oracle Forms Tutorial 15
2 CREATING TEST SCRIPTS
Creating a Load Test Script
16 Silk Performer Oracle Forms Tutorial
2 CREATING TEST SCRIPTS
Creating a Load Test Script
Silk Performer Oracle Forms Tutorial 17
2 CREATING TEST SCRIPTS
Creating a Load Test Script
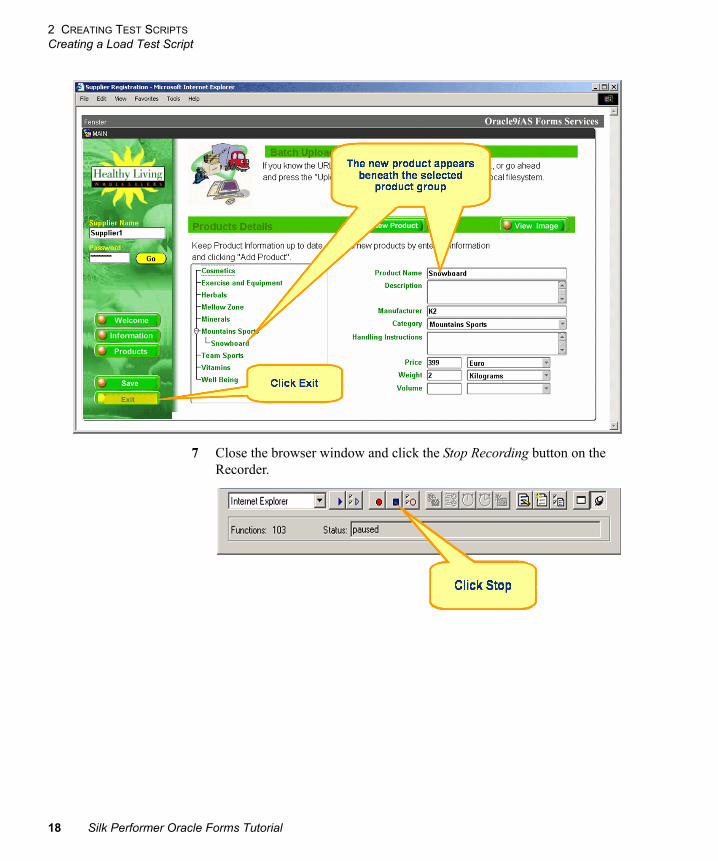
7 Close the browser window and click the Stop Recording button on the Recorder.
18 Silk Performer Oracle Forms Tutorial
2 CREATING TEST SCRIPTS
Trying Out a Generated Script
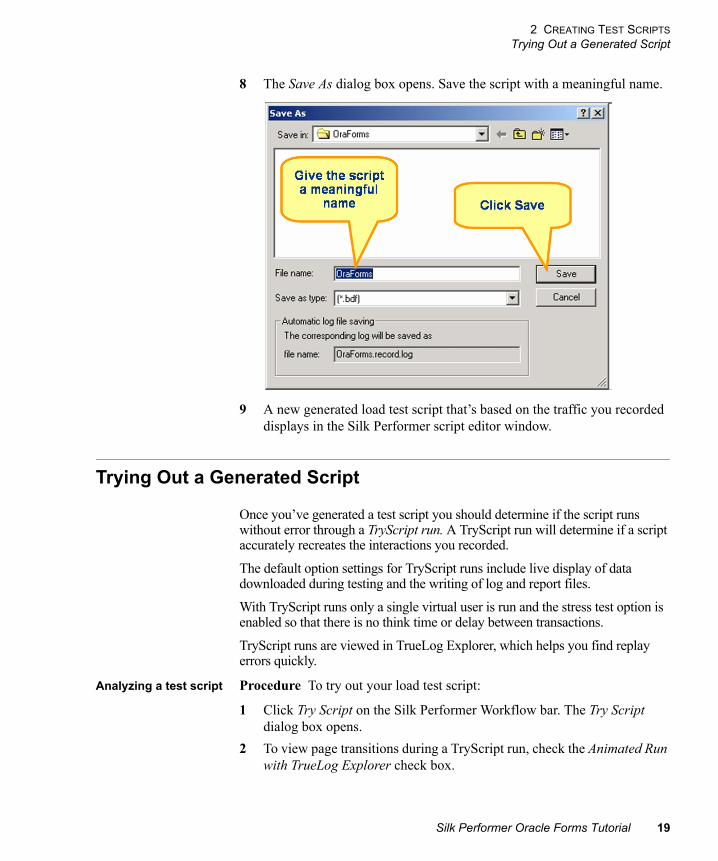
8 The Save As dialog box opens. Save the script with a meaningful name.
9 A new generated load test script that’s based on the traffic you recorded displays in the Silk Performer script editor window.
Trying Out a Generated Script
Once you’ve generated a test script you should determine if the script runs without error through a TryScript run. A TryScript run will determine if a script accurately recreates the interactions you recorded.
The default option settings for TryScript runs include live display of data downloaded during testing and the writing of log and report files.
With TryScript runs only a single virtual user is run and the stress test option is enabled so that there is no think time or delay between transactions.
TryScript runs are viewed in TrueLog Explorer, which helps you find replay errors quickly.
Analyzing a test script Procedure To try out your load test script:
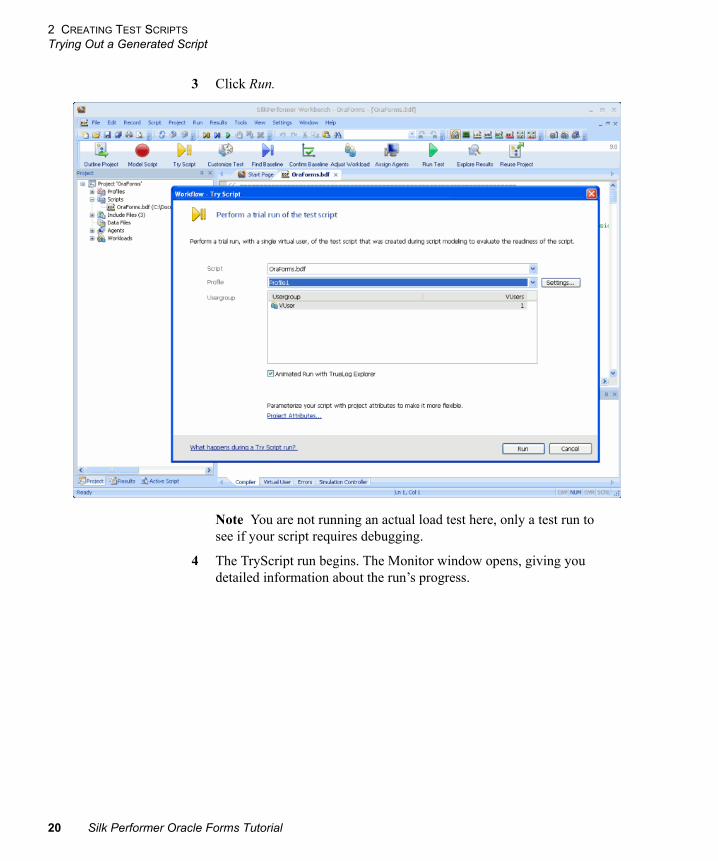
1 Click Try Script on the Silk Performer Workflow bar. The Try Script dialog box opens.
2 To view page transitions during a TryScript run, check the Animated Run with TrueLog Explorer check box.
Silk Performer Oracle Forms Tutorial 19
2 CREATING TEST SCRIPTS
Trying Out a Generated Script
3 Click Run.
Note You are not running an actual load test here, only a test run to see if your script requires debugging.
4 The TryScript run begins. The Monitor window opens, giving you detailed information about the run’s progress.
20 Silk Performer Oracle Forms Tutorial
2 CREATING TEST SCRIPTS
Trying Out a Generated Script
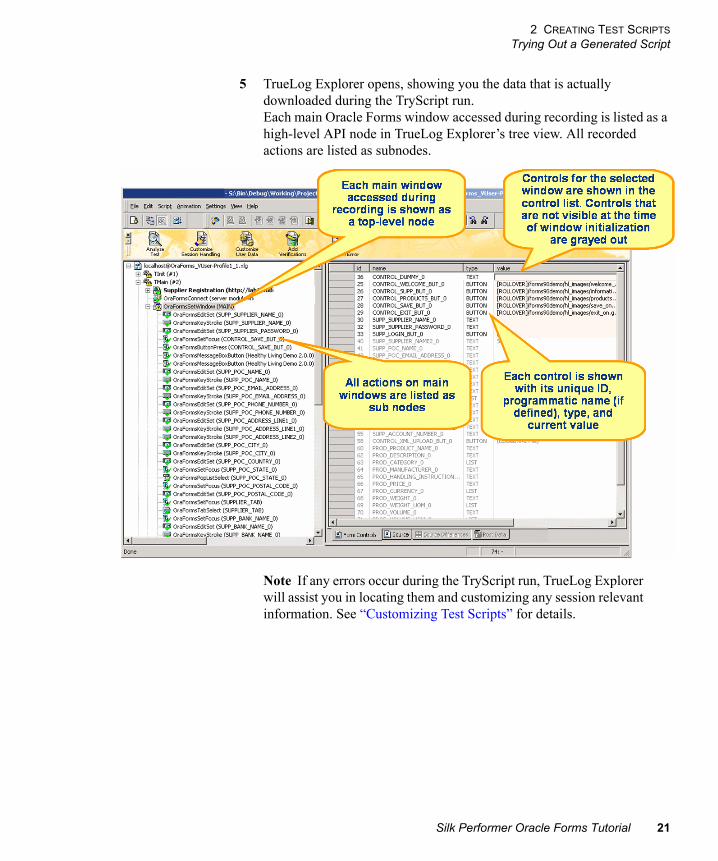
5 TrueLog Explorer opens, showing you the data that is actually downloaded during the TryScript run. Each main Oracle Forms window accessed during recording is listed as a high-level API node in TrueLog Explorer’s tree view. All recorded actions are listed as subnodes.
Note If any errors occur during the TryScript run, TrueLog Explorer will assist you in locating them and customizing any session relevant information. See “Customizing Test Scripts” for details.
Silk Performer Oracle Forms Tutorial 21

2 CREATING TEST SCRIPTS
Trying Out a Generated Script
22 Silk Performer Oracle Forms Tutorial
3
Chapter 3 Customizing Test ScriptsIntroduction This tutorial explains how to customize a recorded load test script based on the results of a TryScript run.
What you will learn This chapter contains the following sections:
Overview
Once you’ve generated a load test script with Silk Performer and executed a TryScript run, TrueLog Explorer can help you customize the script in the following ways:
• Parameterize input data - With user data customization you can make your test scripts more realistic by replacing static recorded user input data with dynamic, parameterized user data that changes with each transaction. Manual scripting isn’t required to create such “data-driven” tests.
• Add verifications to test scripts - Using the Add Verifications tool, you can gain tremendous insight into data that’s downloaded during load tests—enabling you to verify that the content that is to be sent by the server is correct. Verifications remain useful after system deployment for ongoing performance management.
Section Page
Overview 23
Comparing Replay and Record TrueLogs 24
Customizing User Data 26
Adding Verifications 32
Silk Performer Oracle Forms Tutorial 23
3 CUSTOMIZING TEST SCRIPTS
Comparing Replay and Record TrueLogs
Comparing Replay and Record TrueLogs
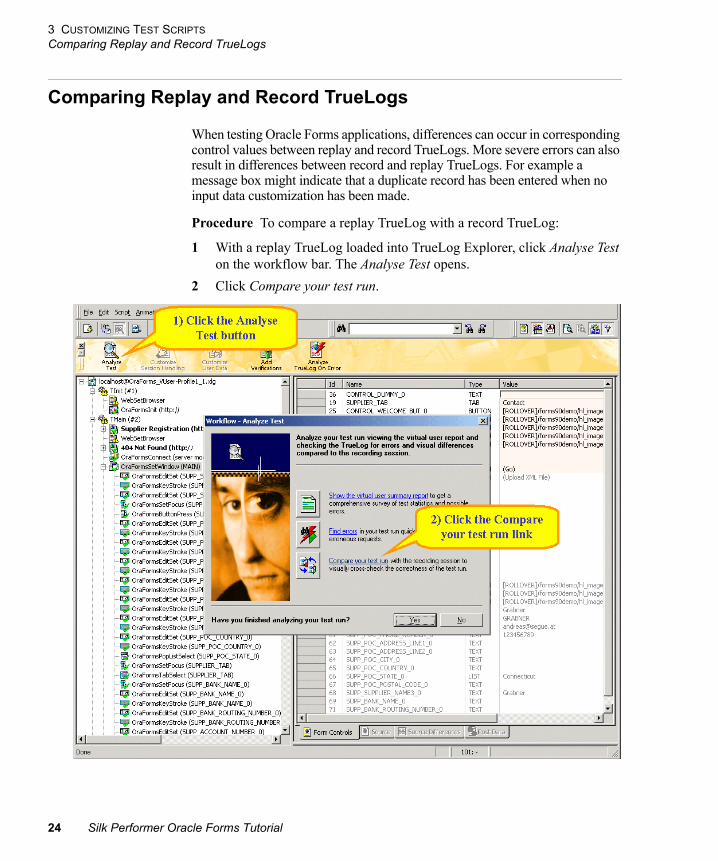
When testing Oracle Forms applications, differences can occur in corresponding control values between replay and record TrueLogs. More severe errors can also result in differences between record and replay TrueLogs. For example a message box might indicate that a duplicate record has been entered when no input data customization has been made.
Procedure To compare a replay TrueLog with a record TrueLog:
1 With a replay TrueLog loaded into TrueLog Explorer, click Analyse Test on the workflow bar. The Analyse Test opens.
2 Click Compare your test run.
24 Silk Performer Oracle Forms Tutorial
3 CUSTOMIZING TEST SCRIPTS
Comparing Replay and Record TrueLogs
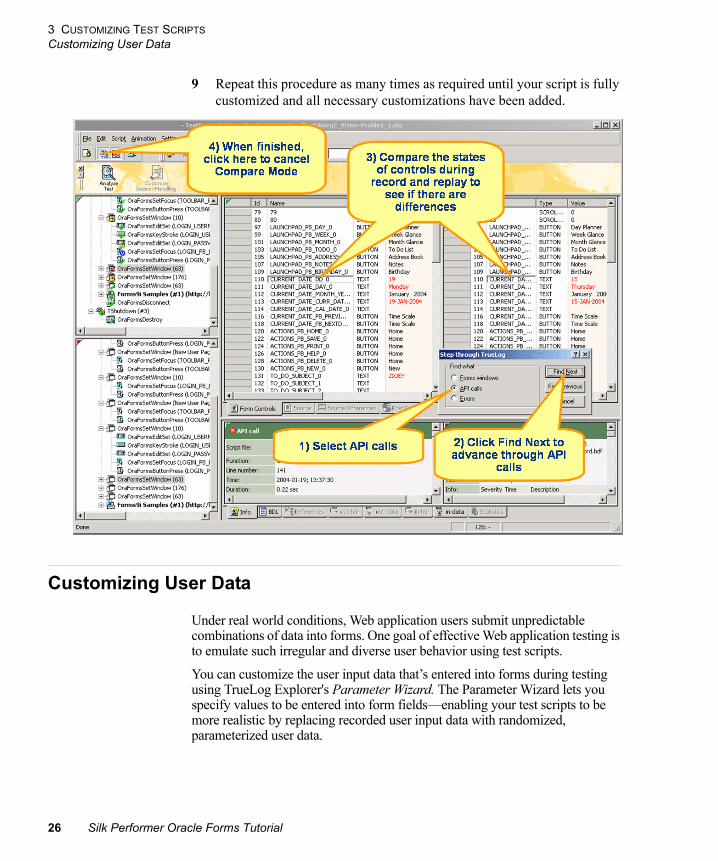
3 The associated record and replay TrueLogs open in compare view. The Step through TrueLog dialog box also opens.
4 Select a criteria to search by (Forms windows, API calls, or Errors).
5 Click Find Next to advance to the first set of corresponding Forms windows, API calls, or errors in the record and replay TrueLogs. Compare the states of the controls to see if there are differences.
TrueLog Explorer highlights any control that’s name or value changes between record and replay with focused and changed tags. This helps you identify where customizations may be necessary and where verifications may be beneficial.
6 Once you’ve completed any required customizations based on differences you’ve discovered, click TryScript Run to confirm that your customizations run without error.
7 Analyze the results of subsequent test runs to determine whether your customizations were successful or if further customization is required.
8 Click the Compare Mode button to disable compare mode.
Silk Performer Oracle Forms Tutorial 25
3 CUSTOMIZING TEST SCRIPTS
Customizing User Data
9 Repeat this procedure as many times as required until your script is fully customized and all necessary customizations have been added.
Customizing User Data
Under real world conditions, Web application users submit unpredictable combinations of data into forms. One goal of effective Web application testing is to emulate such irregular and diverse user behavior using test scripts.
You can customize the user input data that’s entered into forms during testing using TrueLog Explorer's Parameter Wizard. The Parameter Wizard lets you specify values to be entered into form fields—enabling your test scripts to be more realistic by replacing recorded user input data with randomized, parameterized user data.
26 Silk Performer Oracle Forms Tutorial
3 CUSTOMIZING TEST SCRIPTS
Customizing User Data
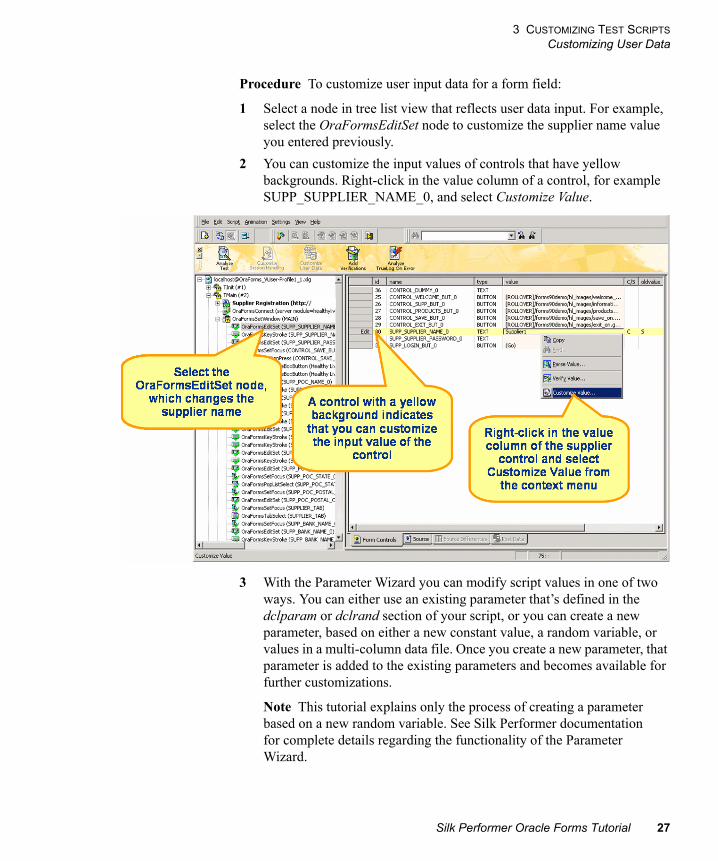
Procedure To customize user input data for a form field:
1 Select a node in tree list view that reflects user data input. For example, select the OraFormsEditSet node to customize the supplier name value you entered previously.
2 You can customize the input values of controls that have yellow backgrounds. Right-click in the value column of a control, for example SUPP_SUPPLIER_NAME_0, and select Customize Value.
3 With the Parameter Wizard you can modify script values in one of two ways. You can either use an existing parameter that’s defined in the dclparam or dclrand section of your script, or you can create a new parameter, based on either a new constant value, a random variable, or values in a multi-column data file. Once you create a new parameter, that parameter is added to the existing parameters and becomes available for further customizations.
Note This tutorial explains only the process of creating a parameter based on a new random variable. See Silk Performer documentation for complete details regarding the functionality of the Parameter Wizard.
Silk Performer Oracle Forms Tutorial 27
3 CUSTOMIZING TEST SCRIPTS
Customizing User Data
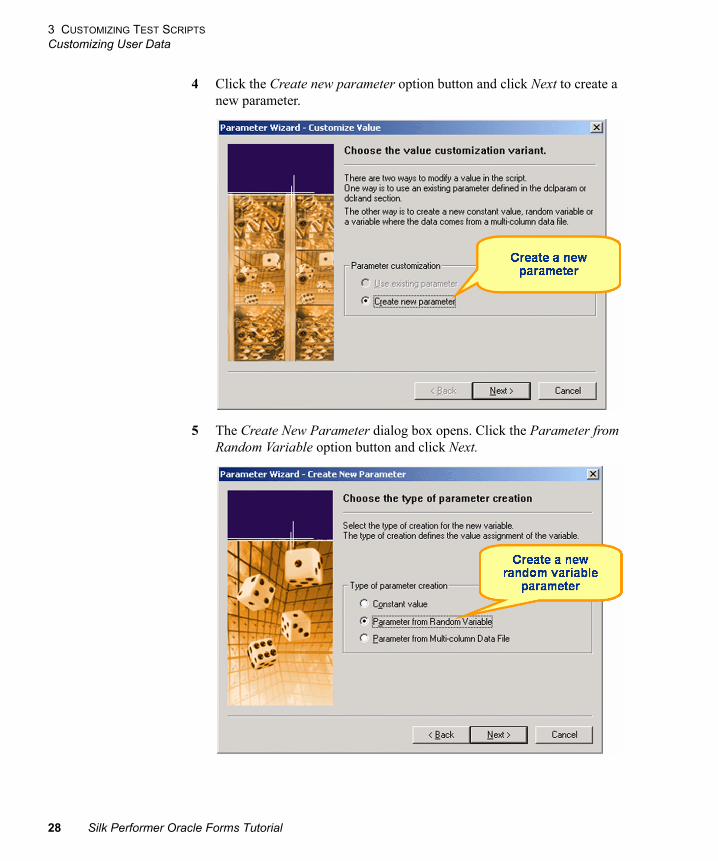
4 Click the Create new parameter option button and click Next to create a new parameter.
5 The Create New Parameter dialog box opens. Click the Parameter from Random Variable option button and click Next.
28 Silk Performer Oracle Forms Tutorial
3 CUSTOMIZING TEST SCRIPTS
Customizing User Data
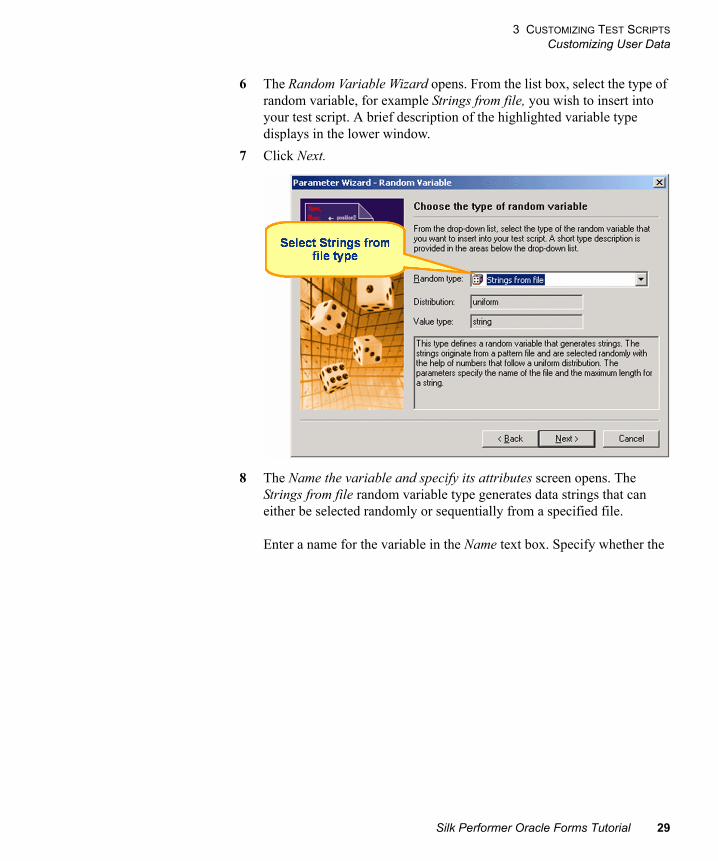
6 The Random Variable Wizard opens. From the list box, select the type of random variable, for example Strings from file, you wish to insert into your test script. A brief description of the highlighted variable type displays in the lower window.
7 Click Next.
8 The Name the variable and specify its attributes screen opens. The Strings from file random variable type generates data strings that can either be selected randomly or sequentially from a specified file.
Enter a name for the variable in the Name text box. Specify whether the
Silk Performer Oracle Forms Tutorial 29
3 CUSTOMIZING TEST SCRIPTS
Customizing User Data
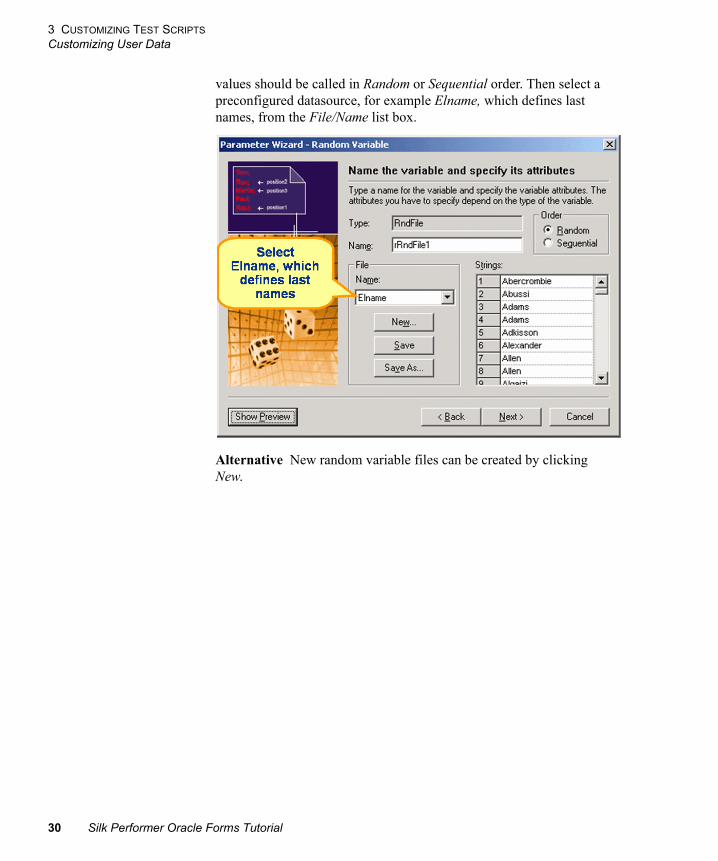
values should be called in Random or Sequential order. Then select a preconfigured datasource, for example Elname, which defines last names, from the File/Name list box.
Alternative New random variable files can be created by clicking New.
30 Silk Performer Oracle Forms Tutorial
3 CUSTOMIZING TEST SCRIPTS
Customizing User Data
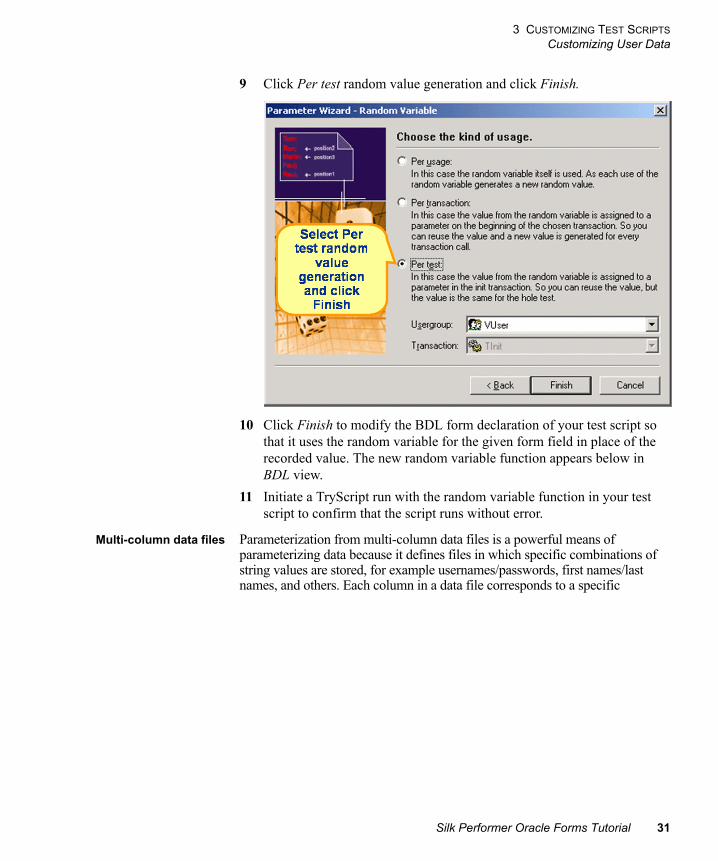
9 Click Per test random value generation and click Finish.
10 Click Finish to modify the BDL form declaration of your test script so that it uses the random variable for the given form field in place of the recorded value. The new random variable function appears below in BDL view.
11 Initiate a TryScript run with the random variable function in your test script to confirm that the script runs without error.
Multi-column data files Parameterization from multi-column data files is a powerful means of parameterizing data because it defines files in which specific combinations of string values are stored, for example usernames/passwords, first names/last names, and others. Each column in a data file corresponds to a specific
Silk Performer Oracle Forms Tutorial 31
3 CUSTOMIZING TEST SCRIPTS
Adding Verifications
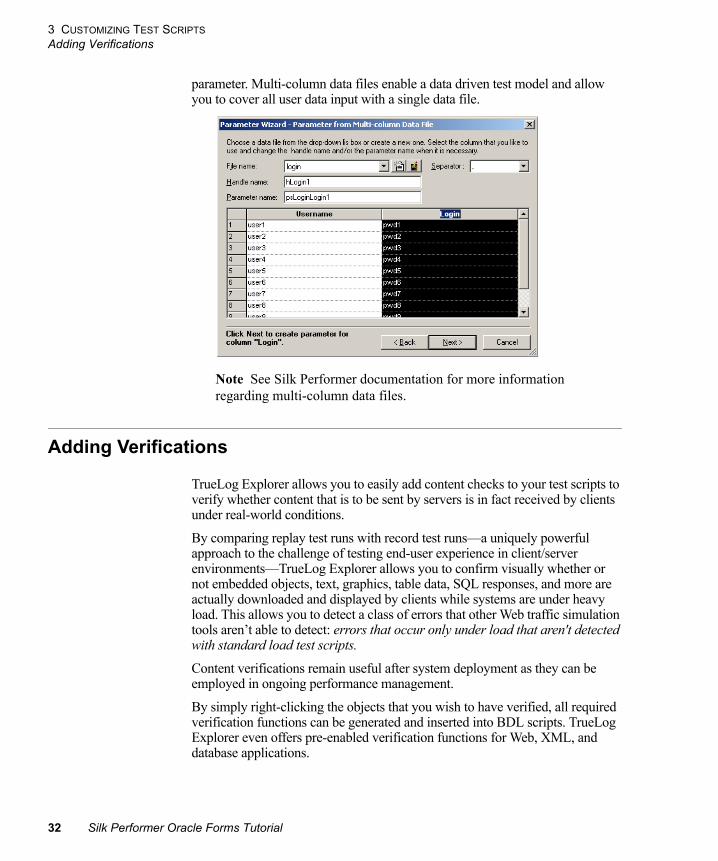
parameter. Multi-column data files enable a data driven test model and allow you to cover all user data input with a single data file.
Note See Silk Performer documentation for more information regarding multi-column data files.
Adding Verifications
TrueLog Explorer allows you to easily add content checks to your test scripts to verify whether content that is to be sent by servers is in fact received by clients under real-world conditions.
By comparing replay test runs with record test runs—a uniquely powerful approach to the challenge of testing end-user experience in client/server environments—TrueLog Explorer allows you to confirm visually whether or not embedded objects, text, graphics, table data, SQL responses, and more are actually downloaded and displayed by clients while systems are under heavy load. This allows you to detect a class of errors that other Web traffic simulation tools aren’t able to detect: errors that occur only under load that aren't detected with standard load test scripts.
Content verifications remain useful after system deployment as they can be employed in ongoing performance management.
By simply right-clicking the objects that you wish to have verified, all required verification functions can be generated and inserted into BDL scripts. TrueLog Explorer even offers pre-enabled verification functions for Web, XML, and database applications.
32 Silk Performer Oracle Forms Tutorial
3 CUSTOMIZING TEST SCRIPTS
Adding Verifications
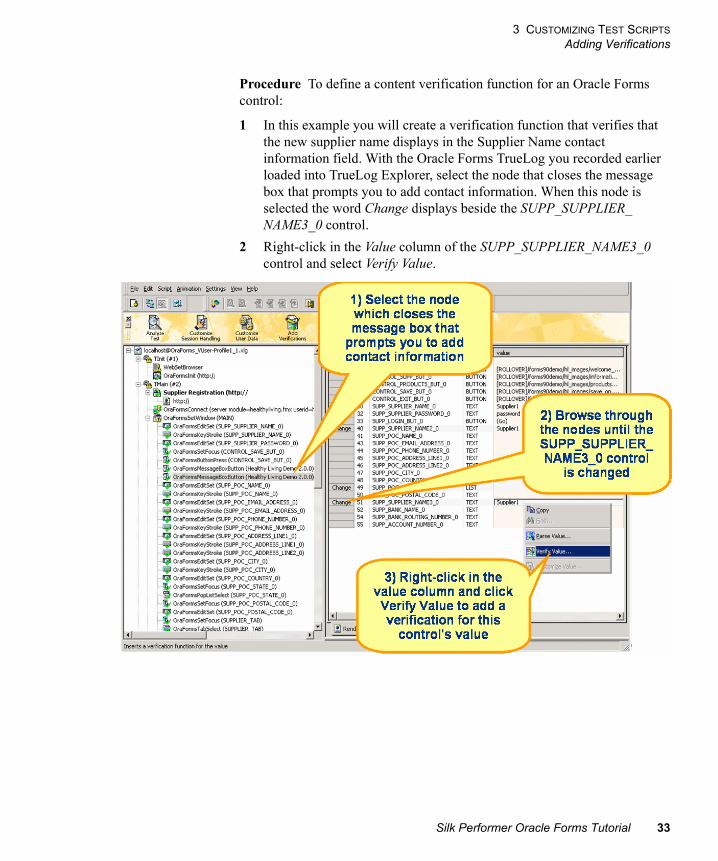
Procedure To define a content verification function for an Oracle Forms control:
1 In this example you will create a verification function that verifies that the new supplier name displays in the Supplier Name contact information field. With the Oracle Forms TrueLog you recorded earlier loaded into TrueLog Explorer, select the node that closes the message box that prompts you to add contact information. When this node is selected the word Change displays beside the SUPP_SUPPLIER_NAME3_0 control.
2 Right-click in the Value column of the SUPP_SUPPLIER_NAME3_0 control and select Verify Value.
Silk Performer Oracle Forms Tutorial 33
3 CUSTOMIZING TEST SCRIPTS
Adding Verifications
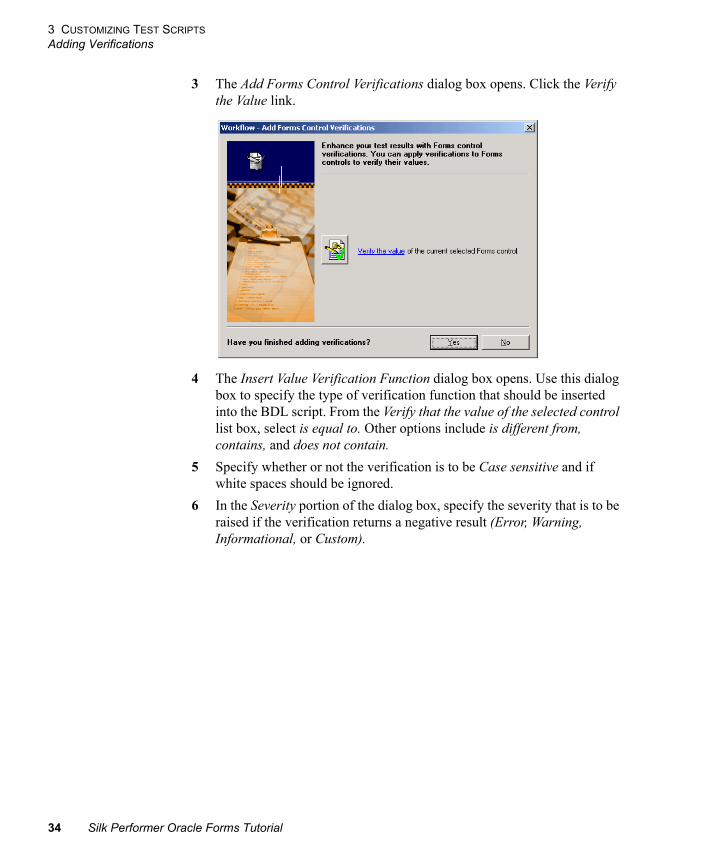
3 The Add Forms Control Verifications dialog box opens. Click the Verify the Value link.
4 The Insert Value Verification Function dialog box opens. Use this dialog box to specify the type of verification function that should be inserted into the BDL script. From the Verify that the value of the selected control list box, select is equal to. Other options include is different from, contains, and does not contain.
5 Specify whether or not the verification is to be Case sensitive and if white spaces should be ignored.
6 In the Severity portion of the dialog box, specify the severity that is to be raised if the verification returns a negative result (Error, Warning, Informational, or Custom).
34 Silk Performer Oracle Forms Tutorial
3 CUSTOMIZING TEST SCRIPTS
Adding Verifications
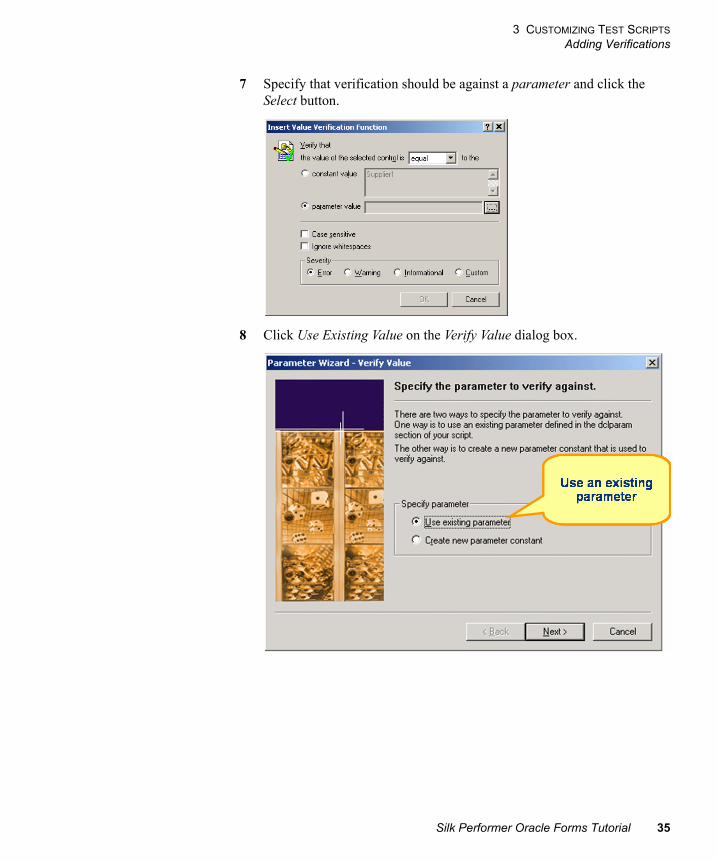
7 Specify that verification should be against a parameter and click the Select button.
8 Click Use Existing Value on the Verify Value dialog box.
Silk Performer Oracle Forms Tutorial 35
3 CUSTOMIZING TEST SCRIPTS
Adding Verifications
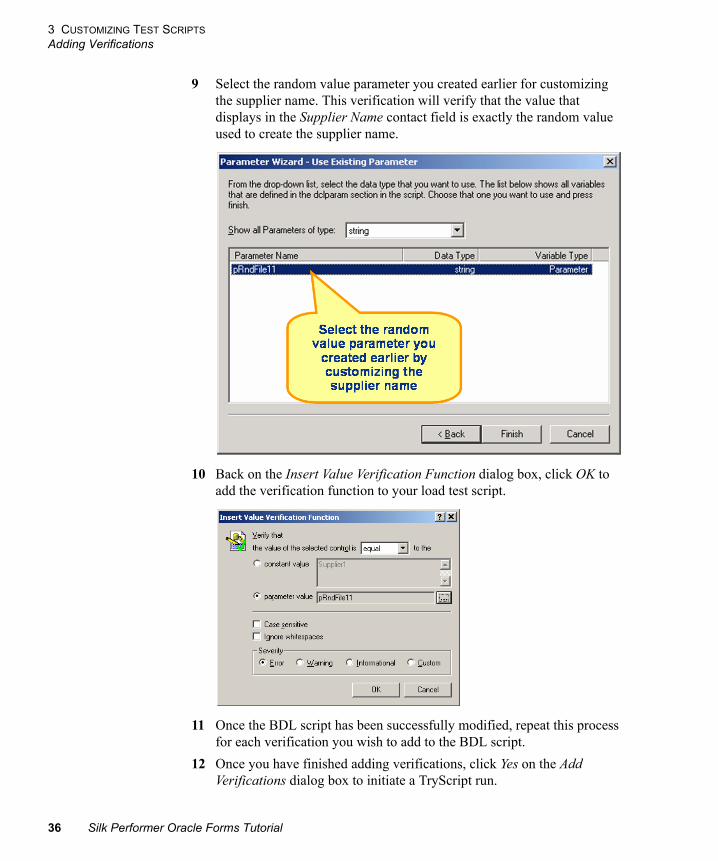
9 Select the random value parameter you created earlier for customizing the supplier name. This verification will verify that the value that displays in the Supplier Name contact field is exactly the random value used to create the supplier name.
10 Back on the Insert Value Verification Function dialog box, click OK to add the verification function to your load test script.
11 Once the BDL script has been successfully modified, repeat this process for each verification you wish to add to the BDL script.
12 Once you have finished adding verifications, click Yes on the Add Verifications dialog box to initiate a TryScript run.
36 Silk Performer Oracle Forms Tutorial
3 CUSTOMIZING TEST SCRIPTS
Adding Verifications
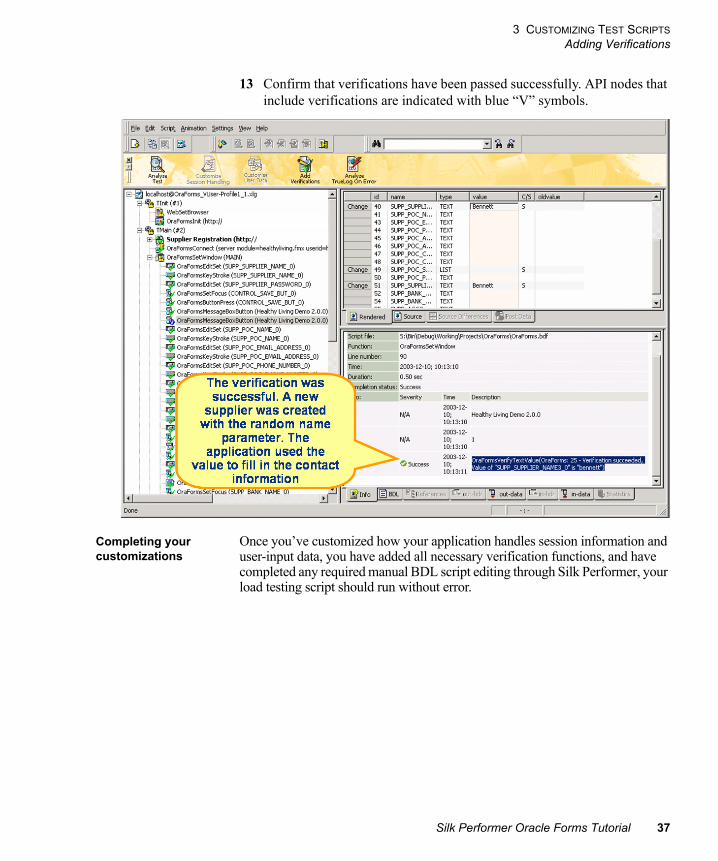
13 Confirm that verifications have been passed successfully. API nodes that include verifications are indicated with blue “V” symbols.
Completing your customizations
Once you’ve customized how your application handles session information and user-input data, you have added all necessary verification functions, and have completed any required manual BDL script editing through Silk Performer, your load testing script should run without error.
Silk Performer Oracle Forms Tutorial 37

3 CUSTOMIZING TEST SCRIPTS
Adding Verifications
38 Silk Performer Oracle Forms Tutorial
4
Chapter 4 Defining User ProfilesIntroduction This tutorial explains how to configure custom user profiles.
What you will learn This chapter contains the following sections:
Overview
Load test scripts that offer a range of user behavior can be created based on user types, which are unique combinations of user groups and load test profiles. New user types can be created by defining new user groups and test profiles.
User groups are sets of users that share common transactions and transaction frequency settings. User groups are defined in the dcluser sections of BDL scripts.
By adding profiles to your load test project you can endow a single user type with a range of traits, for example varying connection speeds, protocols, browsers, and others. Silk Performer has a default profile that you can use. In some instances you may require multiple profiles. For example, if you want to emulate three different bandwidths during your load test, you will need to create three profiles that define three different bandwidths.
Project profiles contain important project-specific settings. A project may contain as many profiles as required, each with unique settings. New profiles can easily be added to projects, and existing profiles can be copied, renamed, and deleted.
Within profiles, options can be set for how the Silk Performer Recorder generates test scripts from recorded traffic and how protocols are used during recording. Simulation settings can also be defined for script replay. Options for
Section Page
Overview 39
Defining a Custom User Profile 40
Silk Performer Oracle Forms Tutorial 39
4 DEFINING USER PROFILES
Defining a Custom User Profile
result files generated during tests are defined. Options are also set for the different kinds of network traffic that are to be simulated—Internet, Web, CORBA/IIOP, TUXEDO, Jolt, database and Oracle Forms.
Defining a Custom User Profile
Procedure To define a custom user profile:
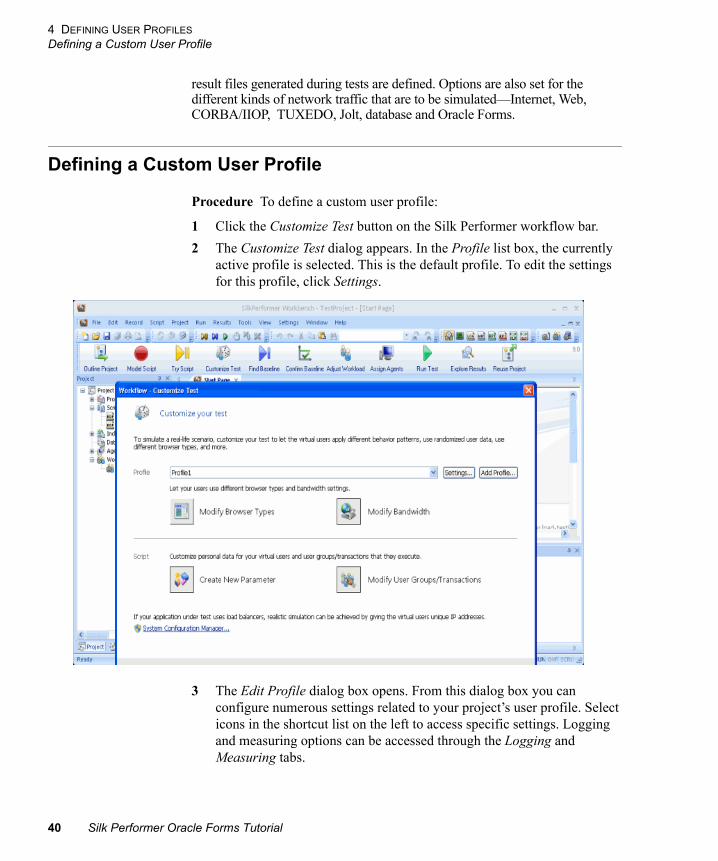
1 Click the Customize Test button on the Silk Performer workflow bar.
2 The Customize Test dialog appears. In the Profile list box, the currently active profile is selected. This is the default profile. To edit the settings for this profile, click Settings.
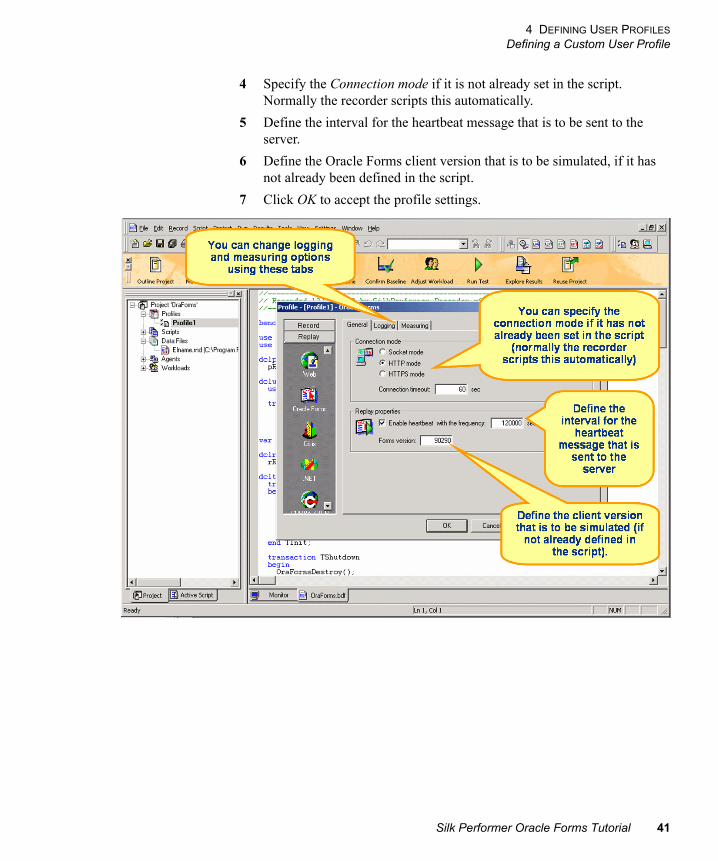
3 The Edit Profile dialog box opens. From this dialog box you can configure numerous settings related to your project’s user profile. Select icons in the shortcut list on the left to access specific settings. Logging and measuring options can be accessed through the Logging and Measuring tabs.
40 Silk Performer Oracle Forms Tutorial
4 DEFINING USER PROFILES
Defining a Custom User Profile
4 Specify the Connection mode if it is not already set in the script. Normally the recorder scripts this automatically.
5 Define the interval for the heartbeat message that is to be sent to the server.
6 Define the Oracle Forms client version that is to be simulated, if it has not already been defined in the script.
7 Click OK to accept the profile settings.
Silk Performer Oracle Forms Tutorial 41

4 DEFINING USER PROFILES
Defining a Custom User Profile
8 Back on the Customize Test dialog box, click OK to complete this workflow step.
42 Silk Performer Oracle Forms Tutorial
5
Chapter 5 Identifying BaselinePerformance
Introduction This tutorial explains how to identify and confirm the baseline performance of a Web application.
What you will learn This chapter contains the following sections:
Overview
The next step in conducting a Silk Performer load test is to ascertain baseline performance (i.e., the ideal performance of the application under test). Baseline tests are run using only one user per user type, and performance measurements of unstressed applications form the basis for calculating appropriate numbers of concurrent users per user type and appropriate boundaries for HTML page response timers and transaction response timers. The bandwidth required to run load tests is also calculated from baseline results. Baseline tests utilize the identical measurement types that are used for actual load tests. As with actual load tests, baseline tests also output reports and other standard files.
Finding a Baseline
By assigning different profiles to a user group and script you define new user types that represent unique combinations of script, user group, and profile.
Section Page
Overview 43
Finding a Baseline 43
Confirming a Baseline 45
Silk Performer Oracle Forms Tutorial 43
5 IDENTIFYING BASELINE PERFORMANCE
Finding a Baseline
Baseline tests establish baseline performance for load tests using specific user types. For baseline tests, only one virtual user per user type is executed.
The Find Baseline dialog allows you to define multiple user types (unique combinations of script, user group, and profile).
The following option settings are automatically set for baseline tests:
• Baseline report files are automatically created
• The Stop virtual users after simulation time (Queuing Workload) option is activated
• The Random think time option is deactivated
• The Load test description field is set to BaseLine Test.
• The Display All Errors Of All Users option in the Monitor window is activated
• The Virtual user output files (.wrt) option is activated
• The Virtual user report files (.rpt) option is activated
Procedure To identify a test baseline:
1 Click the Find Baseline button on the Silk Performer Workflow bar to identify the ideal performance of the application under test.
2 The Find Baseline dialog appears. Select the user types you wish to have run in the baseline test. One virtual user from each user type will be executed.
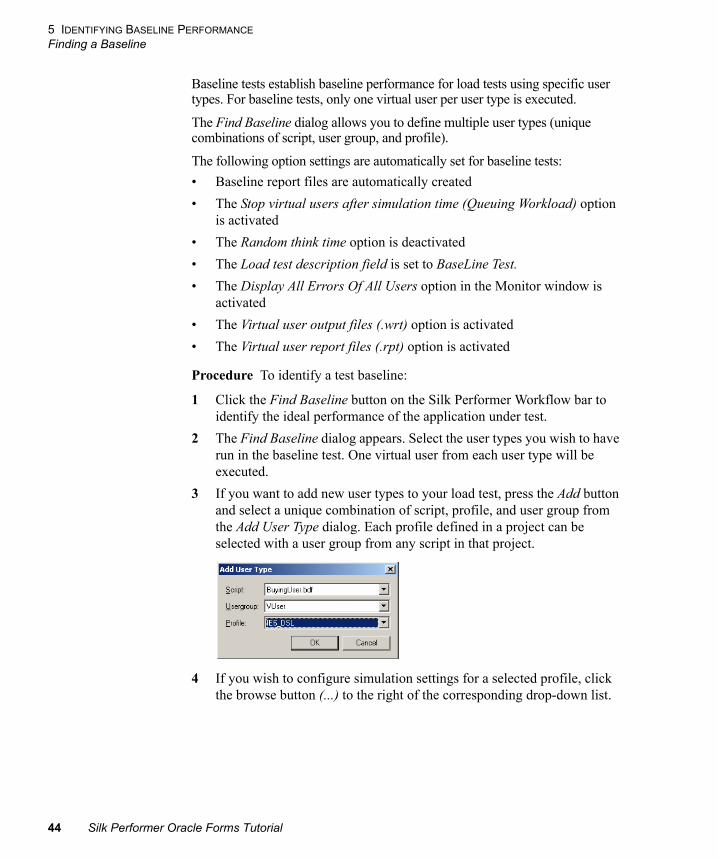
3 If you want to add new user types to your load test, press the Add button and select a unique combination of script, profile, and user group from the Add User Type dialog. Each profile defined in a project can be selected with a user group from any script in that project.
4 If you wish to configure simulation settings for a selected profile, click the browse button (...) to the right of the corresponding drop-down list.
44 Silk Performer Oracle Forms Tutorial

5 IDENTIFYING BASELINE PERFORMANCE
Confirming a Baseline
5 Click Run to run the baseline test.
6 The baseline test runs. The Monitor window opens, giving you detailed information about the progress of the test.
Confirming a Baseline
The next step in conducting a Silk Performer load test is to confirm that the test baseline established by the test actually reflects the desired performance of the application under test. Resulting measurements are used to calculate the appropriate number of concurrent virtual users, required bandwidth, and acceptable thresholds for load tests.
This is done by inspecting the results of a test in a baseline report. If results are satisfactory, they can be stored for further processing.
Once a baseline test is complete, a baseline report is displayed. Baseline reports are based on XML/XSL and include important test results in tabular form.
Silk Performer Oracle Forms Tutorial 45
5 IDENTIFYING BASELINE PERFORMANCE
Confirming a Baseline
Note Baseline reports can be displayed for any load test you wish to use as a baseline (i.e., you can use the results of any past load test to generate a baseline report).
Procedure To view a baseline report:
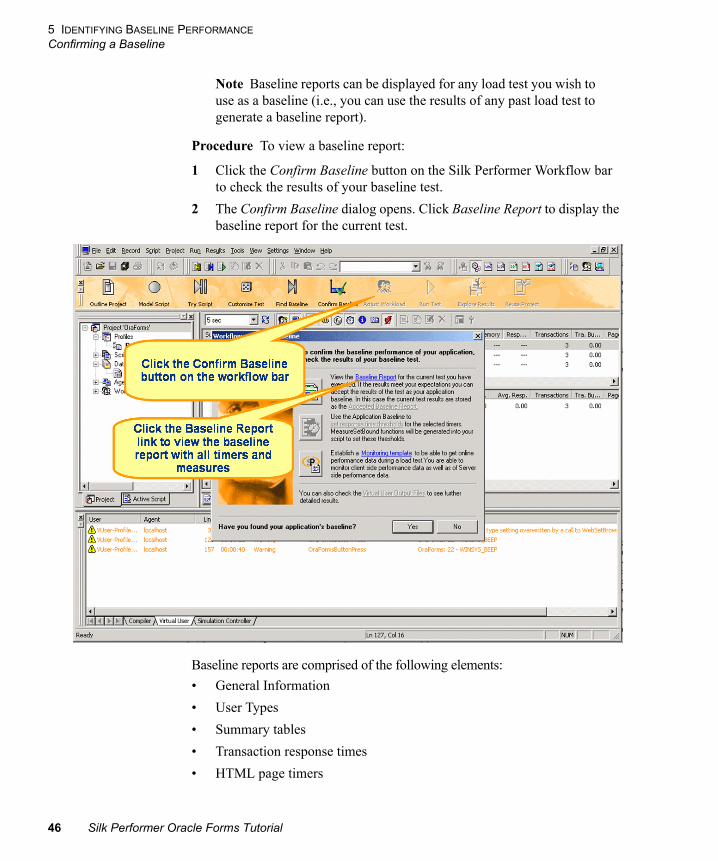
1 Click the Confirm Baseline button on the Silk Performer Workflow bar to check the results of your baseline test.
2 The Confirm Baseline dialog opens. Click Baseline Report to display the baseline report for the current test.
Baseline reports are comprised of the following elements:
• General Information
• User Types
• Summary tables
• Transaction response times
• HTML page timers
46 Silk Performer Oracle Forms Tutorial
5 IDENTIFYING BASELINE PERFORMANCE
Confirming a Baseline
• Web form measurements
• Accept Results button
The General Information section of baseline reports includes administrative information in tabular format, including Silk Performer version information, project name, description of the project, date and time of the baseline test, workload definition, workload model, and number of errors.
Summary lines in the User Types section offer details on measured response times for each user type. Summary lines include number of virtual users (‘1’ for baseline tests), duration of the test, session time, session busy time, average page time, and number of transactions executed (OK, cancelled, and failed) and number of errors.
Session Time is the time required for the virtual user to step through the application. Session Busy Time is the time the virtual user required to step through the application without think time.
Select a user type to see baseline test results for that specific user type.
Silk Performer Oracle Forms Tutorial 47
5 IDENTIFYING BASELINE PERFORMANCE
Confirming a Baseline
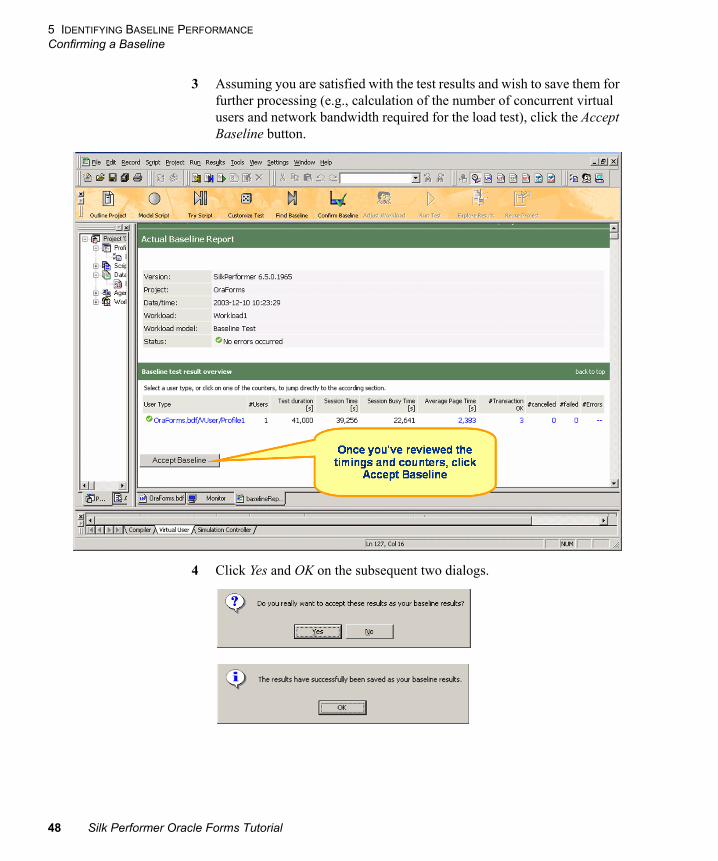
3 Assuming you are satisfied with the test results and wish to save them for further processing (e.g., calculation of the number of concurrent virtual users and network bandwidth required for the load test), click the Accept Baseline button.
4 Click Yes and OK on the subsequent two dialogs.
48 Silk Performer Oracle Forms Tutorial
6
Chapter 6 Setting Up MonitoringTemplates
Introduction This tutorial explains how to set up monitoring templates to generate server-side results information during load tests.
What you will learn This chapter contains the following sections:
Overview
Silk Performer offers server and client-side monitoring during load tests—enabling you to view live graphical display of server performance while tests run. Monitoring servers during tests is important because it enables server-side results information to be generated. This information can then be viewed and correlated with other test measurements during results analysis.
Among other uses, monitoring servers helps you determine if bottlenecks are present and, if so, where they are located. Allowing you to examine the performance of both operating systems and server applications.
Custom server monitoring templates can be set up or you can use pre-installed templates (available for most application types).
Section Page
Overview 49
Setting Up a Monitoring Template 50
Silk Performer Oracle Forms Tutorial 49
6 SETTING UP MONITORING TEMPLATES
Setting Up a Monitoring Template
Setting Up a Monitoring Template
Procedure To set up a template to monitor an Oracle Forms Server:
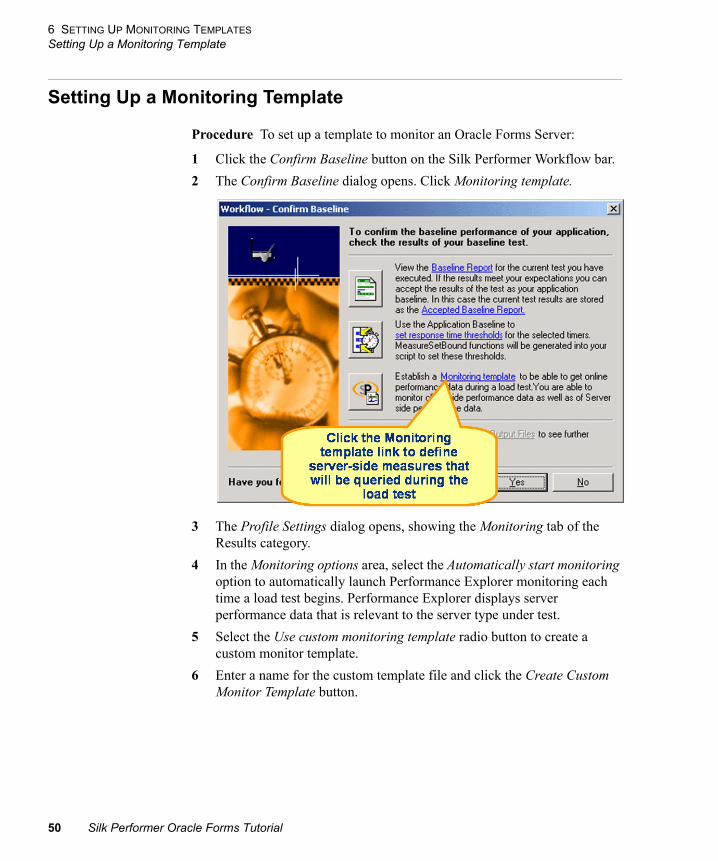
1 Click the Confirm Baseline button on the Silk Performer Workflow bar.
2 The Confirm Baseline dialog opens. Click Monitoring template.
3 The Profile Settings dialog opens, showing the Monitoring tab of the Results category.
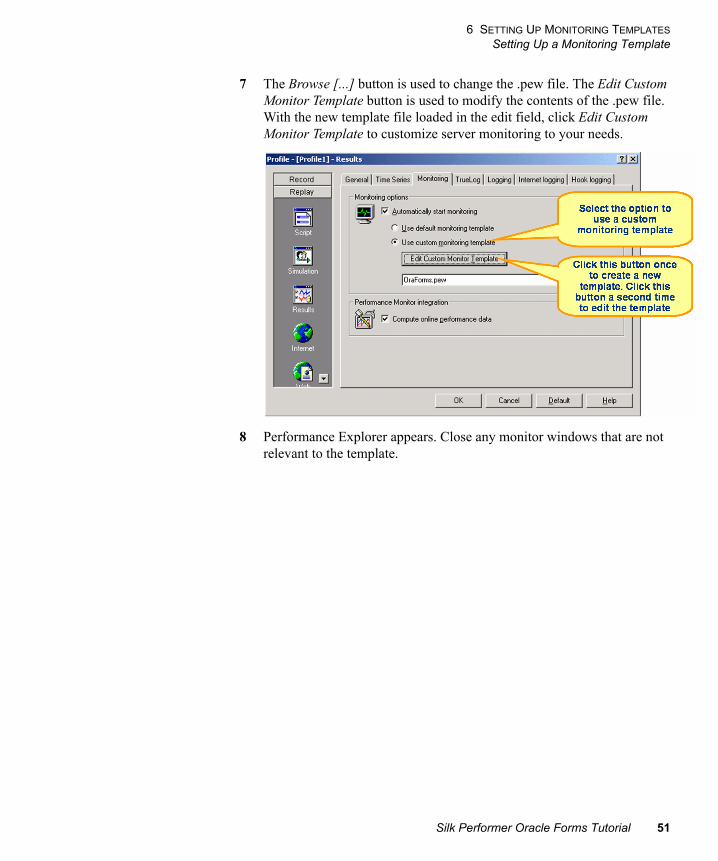
4 In the Monitoring options area, select the Automatically start monitoring option to automatically launch Performance Explorer monitoring each time a load test begins. Performance Explorer displays server performance data that is relevant to the server type under test.
5 Select the Use custom monitoring template radio button to create a custom monitor template.
6 Enter a name for the custom template file and click the Create Custom Monitor Template button.
50 Silk Performer Oracle Forms Tutorial
6 SETTING UP MONITORING TEMPLATES
Setting Up a Monitoring Template
7 The Browse [...] button is used to change the .pew file. The Edit Custom Monitor Template button is used to modify the contents of the .pew file. With the new template file loaded in the edit field, click Edit Custom Monitor Template to customize server monitoring to your needs.
8 Performance Explorer appears. Close any monitor windows that are not relevant to the template.
Silk Performer Oracle Forms Tutorial 51
6 SETTING UP MONITORING TEMPLATES
Setting Up a Monitoring Template
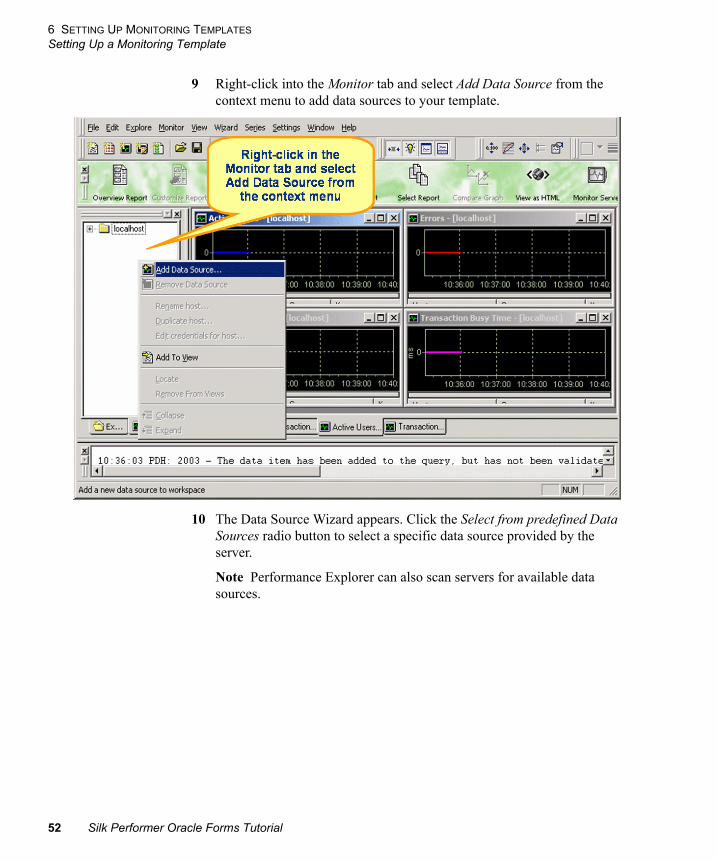
9 Right-click into the Monitor tab and select Add Data Source from the context menu to add data sources to your template.
10 The Data Source Wizard appears. Click the Select from predefined Data Sources radio button to select a specific data source provided by the server.
Note Performance Explorer can also scan servers for available data sources.
52 Silk Performer Oracle Forms Tutorial
6 SETTING UP MONITORING TEMPLATES
Setting Up a Monitoring Template
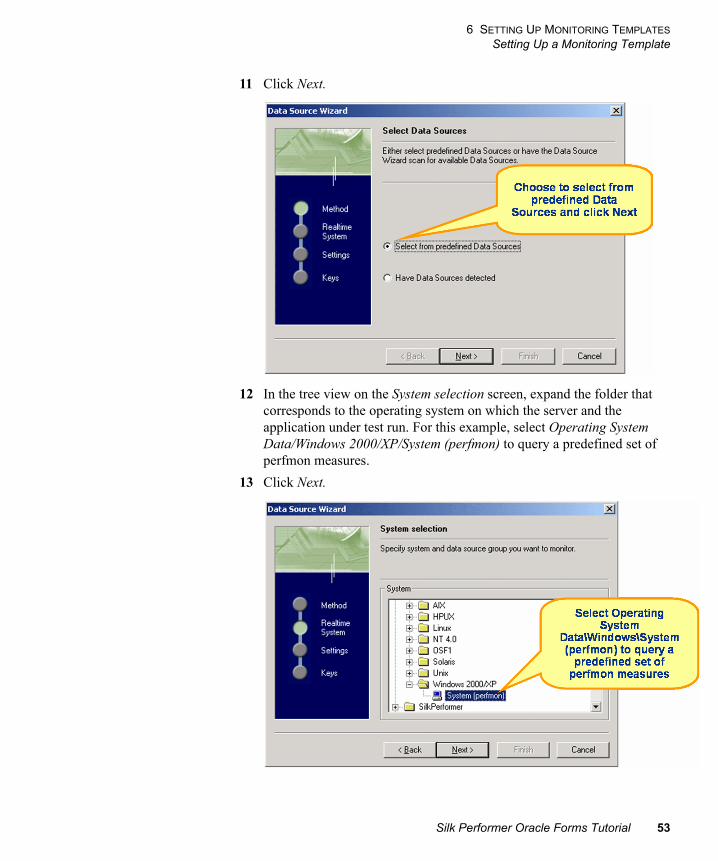
11 Click Next.
12 In the tree view on the System selection screen, expand the folder that corresponds to the operating system on which the server and the application under test run. For this example, select Operating System Data/Windows 2000/XP/System (perfmon) to query a predefined set of perfmon measures.
13 Click Next.
Silk Performer Oracle Forms Tutorial 53
6 SETTING UP MONITORING TEMPLATES
Setting Up a Monitoring Template
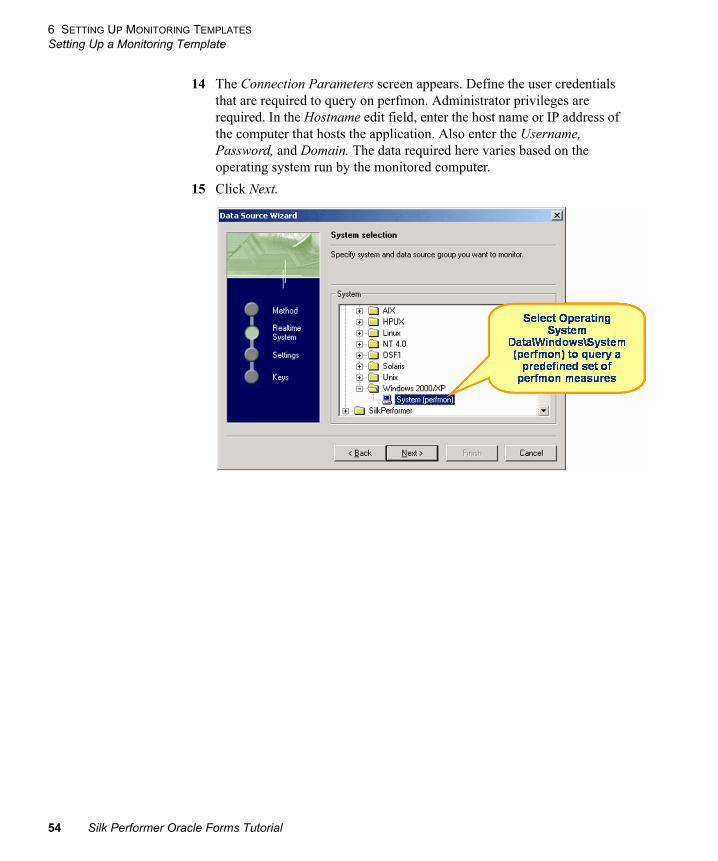
14 The Connection Parameters screen appears. Define the user credentials that are required to query on perfmon. Administrator privileges are required. In the Hostname edit field, enter the host name or IP address of the computer that hosts the application. Also enter the Username, Password, and Domain. The data required here varies based on the operating system run by the monitored computer.
15 Click Next.
54 Silk Performer Oracle Forms Tutorial
6 SETTING UP MONITORING TEMPLATES
Setting Up a Monitoring Template
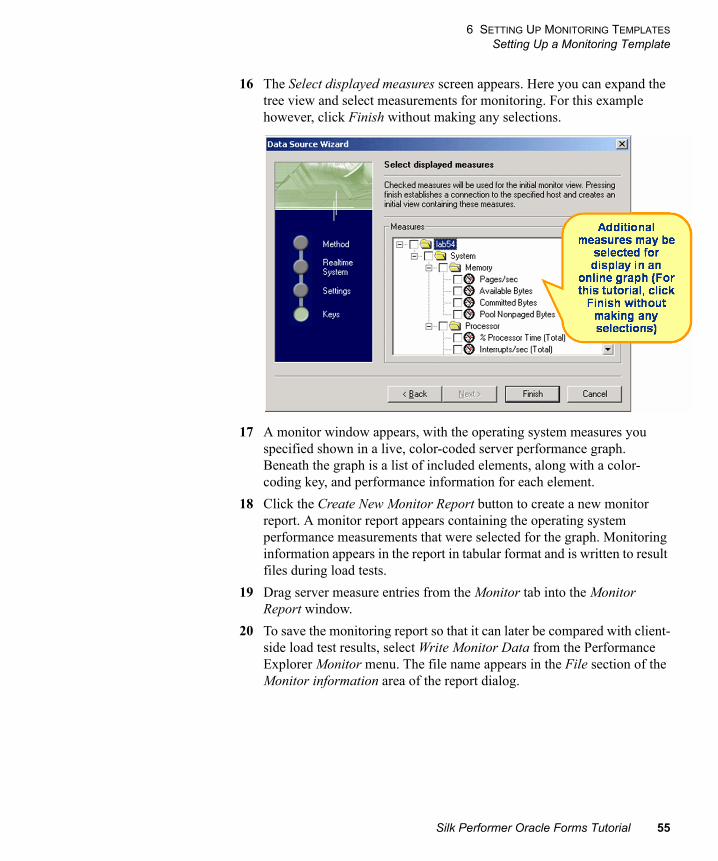
16 The Select displayed measures screen appears. Here you can expand the tree view and select measurements for monitoring. For this example however, click Finish without making any selections.
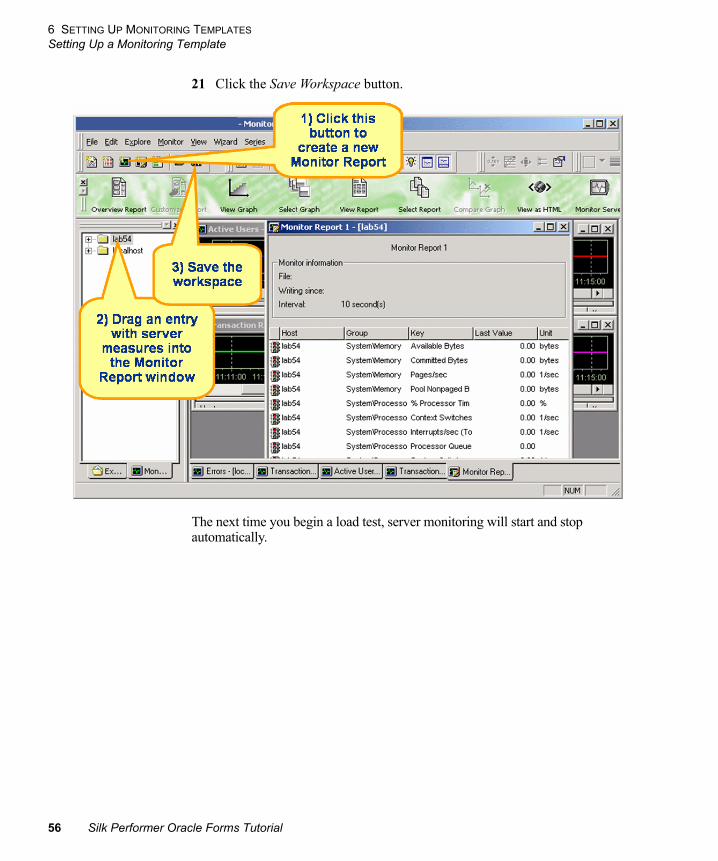
17 A monitor window appears, with the operating system measures you specified shown in a live, color-coded server performance graph. Beneath the graph is a list of included elements, along with a color-coding key, and performance information for each element.
18 Click the Create New Monitor Report button to create a new monitor report. A monitor report appears containing the operating system performance measurements that were selected for the graph. Monitoring information appears in the report in tabular format and is written to result files during load tests.
19 Drag server measure entries from the Monitor tab into the Monitor Report window.
20 To save the monitoring report so that it can later be compared with client-side load test results, select Write Monitor Data from the Performance Explorer Monitor menu. The file name appears in the File section of the Monitor information area of the report dialog.
Silk Performer Oracle Forms Tutorial 55
6 SETTING UP MONITORING TEMPLATES
Setting Up a Monitoring Template
21 Click the Save Workspace button.
The next time you begin a load test, server monitoring will start and stop automatically.
56 Silk Performer Oracle Forms Tutorial
6 SETTING UP MONITORING TEMPLATES
Setting Up a Monitoring Template
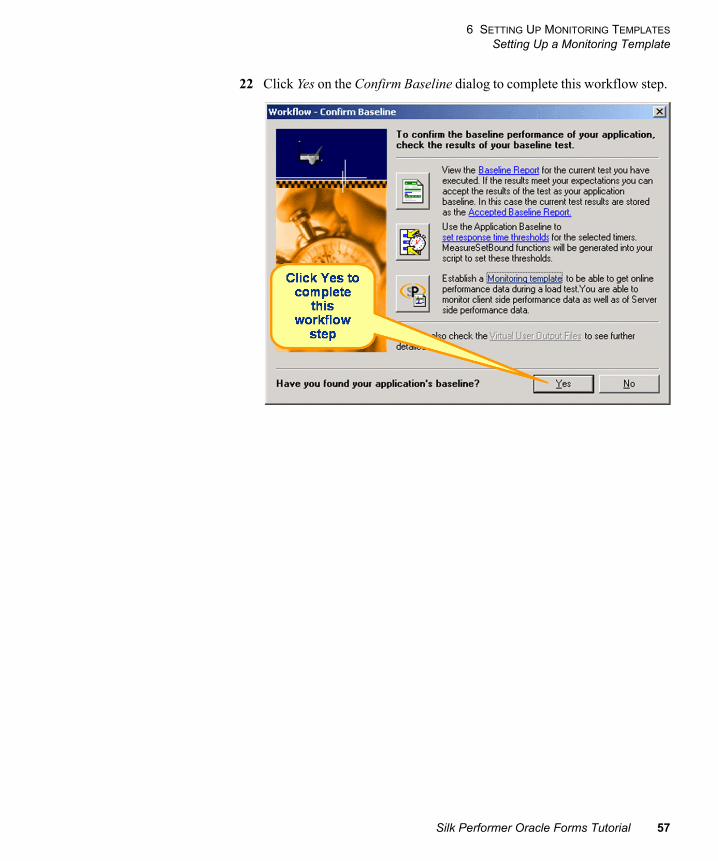
22 Click Yes on the Confirm Baseline dialog to complete this workflow step.
Silk Performer Oracle Forms Tutorial 57

6 SETTING UP MONITORING TEMPLATES
Setting Up a Monitoring Template
58 Silk Performer Oracle Forms Tutorial
7
Chapter 7 Defining WorkloadIntroduction This tutorial explains how to define workload settings for load tests.
What you will learn This chapter contains the following sections:
Overview
The next step in conducting an Oracle Forms load test with Silk Performer is to configure workload. Silk Performer offers different workload models that can be used as the basis for load tests. You must select the workload model that best meets your needs prior to the execution of your load test.
The number of concurrent virtual users per user type, the duration, and the involved agents must also be configured when defining workload.
The following workload models are available:
Increasing workloadWith this workload model, at the beginning of a load test, Silk Performer simulates not the total number of defined users, but only a specified number. Gradually workload is increased until all the users in the user list are running.
This workload model is useful when you want to determine at which load level your system crashes or does not respond within acceptable response times or error thresholds.
Steady state workloadIn this model, the same number of virtual users is employed throughout the test. Each virtual user executes the transactions defined in the load testing script. When work is complete, the virtual users begin executing the transactions again.
Section Page
Overview 59
Defining Workload 61
Silk Performer Oracle Forms Tutorial 59
7 DEFINING WORKLOAD
Overview
There is no delay between transactions. The test is complete when the specified simulation time is reached.
This workload model is useful when you want to find out about the behavior of the system under test at a specific load level.
Dynamic workloadWith this model you can manually change the number of virtual users in a test while the test runs. The maximum number of virtual users to be run is set; within this limit, the number can be increased and decreased anytime during the test. No simulation time is specified, and you must end the test manually.
This workload model is useful when you want to experiment with different load levels and have control over load levels during tests.
All day workload This workload model allows you to define the distribution of your load in the most flexible way. You can assign different numbers of virtual users to any interval of a load test. Each user type can use a different load distribution. With this model you can design complex workload scenarios such as workday workloads and weekly workloads. During load tests you can adjust load levels for intervals that have not yet been executed.
This workload model is especially useful when you wish to model complex, extended workload scenarios as realistically as possible.
Queuing workload In this model, transactions are scheduled following a prescribed arrival rate. This rate is a random value based on an average interval calculated from the simulation time and the number of transactions specified in the script (dcluser section: number of transactions per user). Load tests are complete when all virtual users have completed their prescribed tasks.
Note Tests may take longer than specified simulation times due to randomized arrival rates. For example, if you specify a simulation time of 3,000 seconds and want to execute 100 transactions, then you will receive an average transaction arrival rate of 30 seconds.
This workload model is especially useful when you want to simulate workloads that use queuing mechanisms to handle multiple concurrent requests. Typically, application servers such as servlet engines and transaction servers—which receive their requests from Web servers rather than end users—can be accurately tested with the queuing model.
Verification workload Verification test runs are especially useful when combined with Silk Performer’s extended verification functionality. This combination can be used for regression testing of Web-based applications. A verification test runs a single user of a specific user type on a specified agent computer.
60 Silk Performer Oracle Forms Tutorial
7 DEFINING WORKLOAD
Defining Workload
This workload model is especially useful when you wish to automate the verification of Web applications and want to begin verification tests from a command-line interface.
Adjusting workload The Adjust Workload button on the workflow bar launches the workload wizard, which helps you define all necessary parameters for your workload.
After specifying the simulation time for a load test, the wizard helps you calculate the number of concurrent virtual users per user type associated with your load test. This task is important for emulating real user behavior. If you know the number of expected real user sessions per hour for the application under test, the number of concurrent virtual users will be calculated based on the results of accepted baseline tests.
Additionally, required network bandwidth per user type is displayed. This helps you check network infrastructure for bottlenecks. Required bandwidth is calculated based on accepted baseline results.
You can define multiple workload models in your load test project and save them for later use, but only one workload model can be active at a time. Accepted baseline results are associated with workload models—if you copy or rename a workload model, the accepted baseline results will be copied and renamed accordingly.
Defining Workload
Procedure To specify the workload of a load test:
1 Click the Adjust Workload button on the Silk Performer workflow bar.
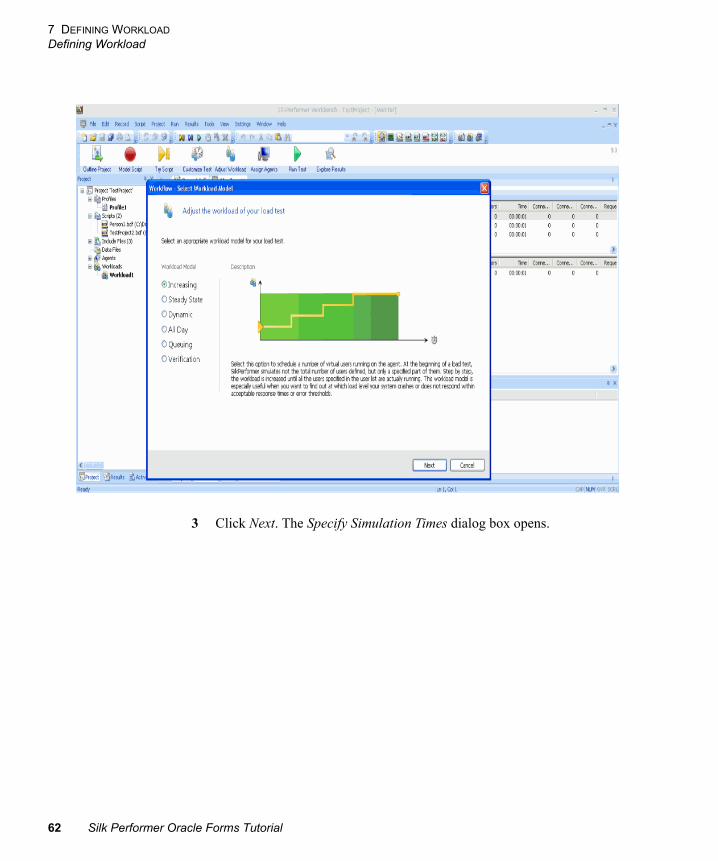
2 Select the workload model that most closely meets your needs (the Increasing workload model is illustrated in this tutorial).
Silk Performer Oracle Forms Tutorial 61
7 DEFINING WORKLOAD
Defining Workload
3 Click Next. The Specify Simulation Times dialog box opens.
62 Silk Performer Oracle Forms Tutorial
7 DEFINING WORKLOAD
Defining Workload
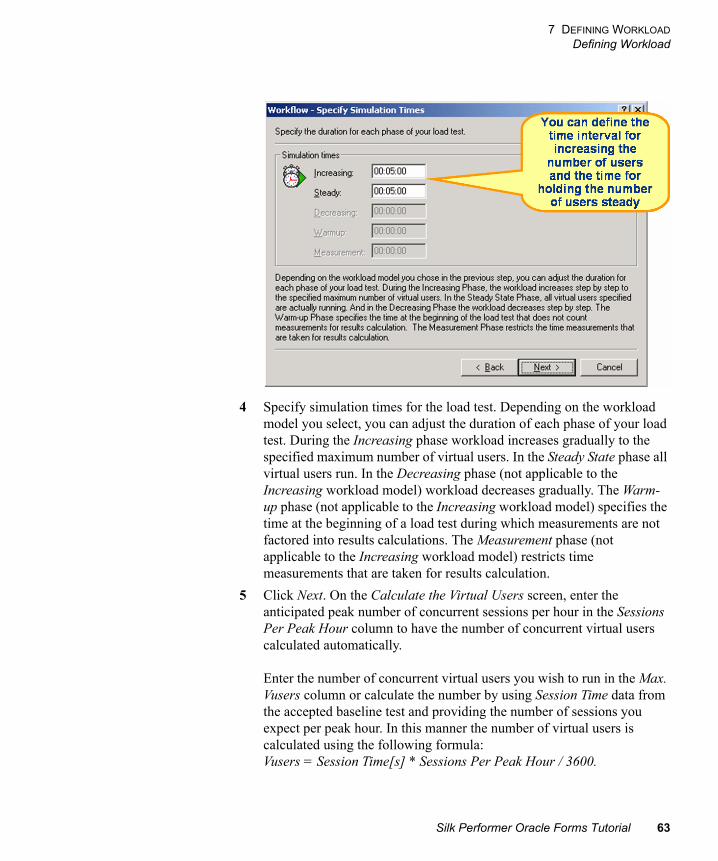
4 Specify simulation times for the load test. Depending on the workload model you select, you can adjust the duration of each phase of your load test. During the Increasing phase workload increases gradually to the specified maximum number of virtual users. In the Steady State phase all virtual users run. In the Decreasing phase (not applicable to the Increasing workload model) workload decreases gradually. The Warm-up phase (not applicable to the Increasing workload model) specifies the time at the beginning of a load test during which measurements are not factored into results calculations. The Measurement phase (not applicable to the Increasing workload model) restricts time measurements that are taken for results calculation.
5 Click Next. On the Calculate the Virtual Users screen, enter the anticipated peak number of concurrent sessions per hour in the Sessions Per Peak Hour column to have the number of concurrent virtual users calculated automatically.
Enter the number of concurrent virtual users you wish to run in the Max. Vusers column or calculate the number by using Session Time data from the accepted baseline test and providing the number of sessions you expect per peak hour. In this manner the number of virtual users is calculated using the following formula: Vusers = Session Time[s] * Sessions Per Peak Hour / 3600.
Silk Performer Oracle Forms Tutorial 63
7 DEFINING WORKLOAD
Defining Workload
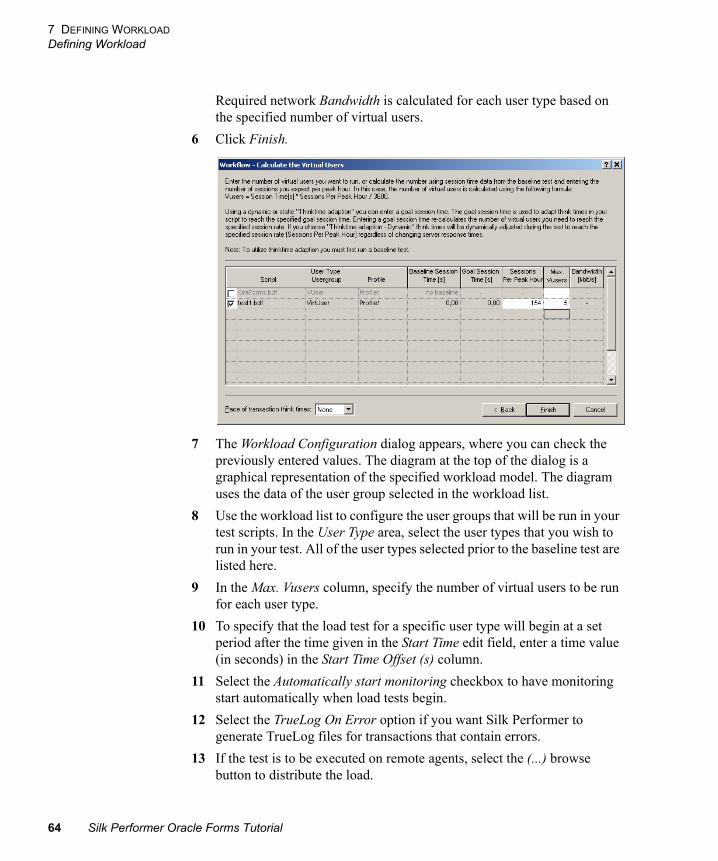
Required network Bandwidth is calculated for each user type based on the specified number of virtual users.
6 Click Finish.
7 The Workload Configuration dialog appears, where you can check the previously entered values. The diagram at the top of the dialog is a graphical representation of the specified workload model. The diagram uses the data of the user group selected in the workload list.
8 Use the workload list to configure the user groups that will be run in your test scripts. In the User Type area, select the user types that you wish to run in your test. All of the user types selected prior to the baseline test are listed here.
9 In the Max. Vusers column, specify the number of virtual users to be run for each user type.
10 To specify that the load test for a specific user type will begin at a set period after the time given in the Start Time edit field, enter a time value (in seconds) in the Start Time Offset (s) column.
11 Select the Automatically start monitoring checkbox to have monitoring start automatically when load tests begin.
12 Select the TrueLog On Error option if you want Silk Performer to generate TrueLog files for transactions that contain errors.
13 If the test is to be executed on remote agents, select the (...) browse button to distribute the load.
64 Silk Performer Oracle Forms Tutorial
7 DEFINING WORKLOAD
Defining Workload
14 In the Load Test Description area, enter a description for the load test (this is optional). This feature is provided only for your project management needs.
15 Click the User Distribution Overview button to view the assignment of virtual users to the agent computers that are currently available.
16 Click OK to save your changes.
Note If you wish to define multiple workloads for your load test and save them for future use, expand the Workloads section of the tree view, right-click on one of the workload options to edit, copy, rename, delete, set the workload as active, or create a new workload. If you create a new workload model, the baseline must be accepted again for this model. You can copy previously accepted baseline results from an existing workload model by copying and renaming a workload.
Silk Performer Oracle Forms Tutorial 65
7 DEFINING WORKLOAD
Defining Workload
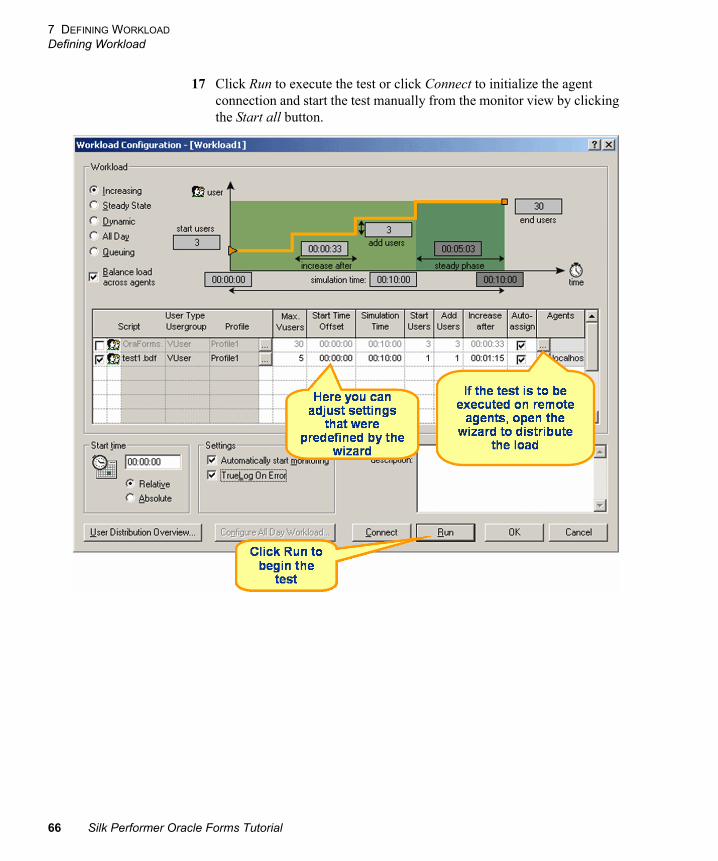
17 Click Run to execute the test or click Connect to initialize the agent connection and start the test manually from the monitor view by clicking the Start all button.
66 Silk Performer Oracle Forms Tutorial
8
Chapter 8 Running & Monitoring TestsIntroduction This tutorial explains how to run and monitor load tests using Silk Performer.
What you will learn This chapter contains the following sections:
Overview
Running tests The next step in conducting a Silk Performer load test is to run a full load test. To test target servers, multiple virtual users are run by means of test scripts. A large load test requires an appropriate testing environment set up on the local area network, including a full complement of agent computers to host the virtual users.
It is essential to set options for the Oracle Forms application test type, to accurately define workloads, and to enable generation of test results that will be needed to assess the performance of the Oracle Forms server. The logging option however should be disabled to prevent interference with load test results.
Comprehensive information is provided to testers while load tests run. This includes real-time information about agent computers, virtual users, and transactions as they are conducted. In addition, real-time monitoring of the target server is available in graphical form.
Monitoring tests Graphical displays and full textual reporting of activity on both the client side and the server side offer easily understandable monitoring of test progress. Comprehensive overview information about agent computers and virtual users
Section Page
Overview 67
Running a Test 68
Monitoring a Test 69
Monitoring a Server 73
Silk Performer Oracle Forms Tutorial 67
8 RUNNING & MONITORING TESTS
Running a Test
is available directly from the workbench where tests are conducted. There is full control over the level of information detail offered—from a global view of the progress of all agent computers in a test down to exhaustive detail regarding the transactions conducted by individual virtual users. Progress information for each agent and user is available in many categories. Run-time details for each user include customizable, color-coded readouts on transactions, timers, functions, and errors as they happen.
Monitoring servers In addition, real-time monitoring of the performance of the target server is available in graphical form. Charts can display the most relevant performance information from a comprehensive collection of the most commonly used Web servers, application servers, database servers, and operating systems in use today. Multiple charts can be open at the same time, and these can be juxtaposed to provide the most relevant comparisons and contrasts. A tree-view editor allows elements from any data source to be combined in the charts. Performance information from the client application—for example, response times—can easily be placed in the same chart as performance data from the server. This enables a direct visual comparison to be made, so that you can see directly how shortcomings on the server influence client behavior.
Running a Test
Procedure To start a load test:
1 Activate the workload you wish to use for the test. To activate a workload, right-click it and select Activate.
2 Click Run Test on the Silk Performer workflow bar.
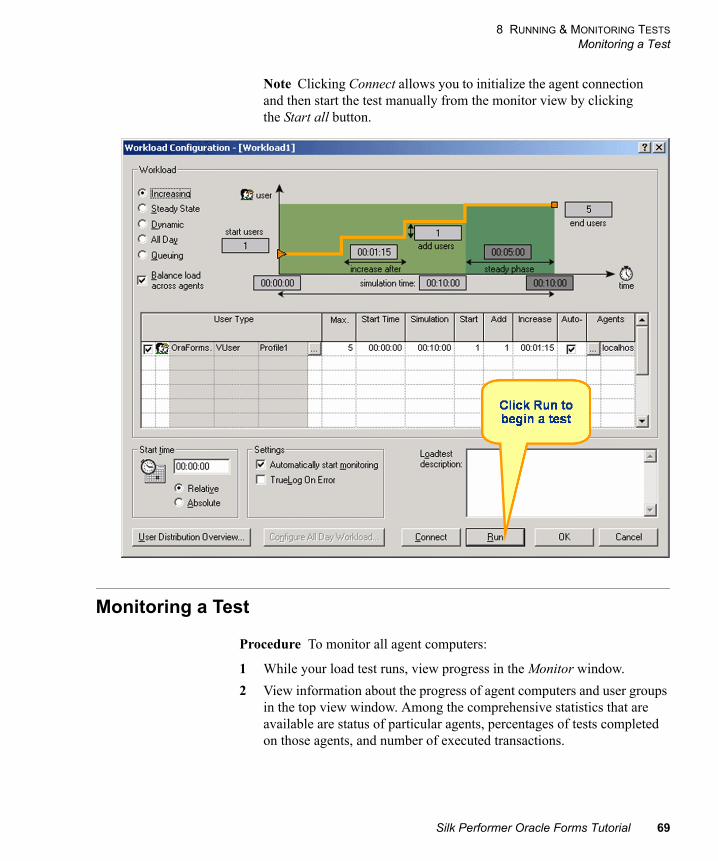
3 The Workload Configuration dialog box opens. Confirm all workload settings that you wish to use for the load test.
4 Click Run to start the load test.
68 Silk Performer Oracle Forms Tutorial
8 RUNNING & MONITORING TESTS
Monitoring a Test
Note Clicking Connect allows you to initialize the agent connection and then start the test manually from the monitor view by clicking the Start all button.
Monitoring a Test
Procedure To monitor all agent computers:
1 While your load test runs, view progress in the Monitor window.
2 View information about the progress of agent computers and user groups in the top view window. Among the comprehensive statistics that are available are status of particular agents, percentages of tests completed on those agents, and number of executed transactions.
Silk Performer Oracle Forms Tutorial 69
8 RUNNING & MONITORING TESTS
Monitoring a Test
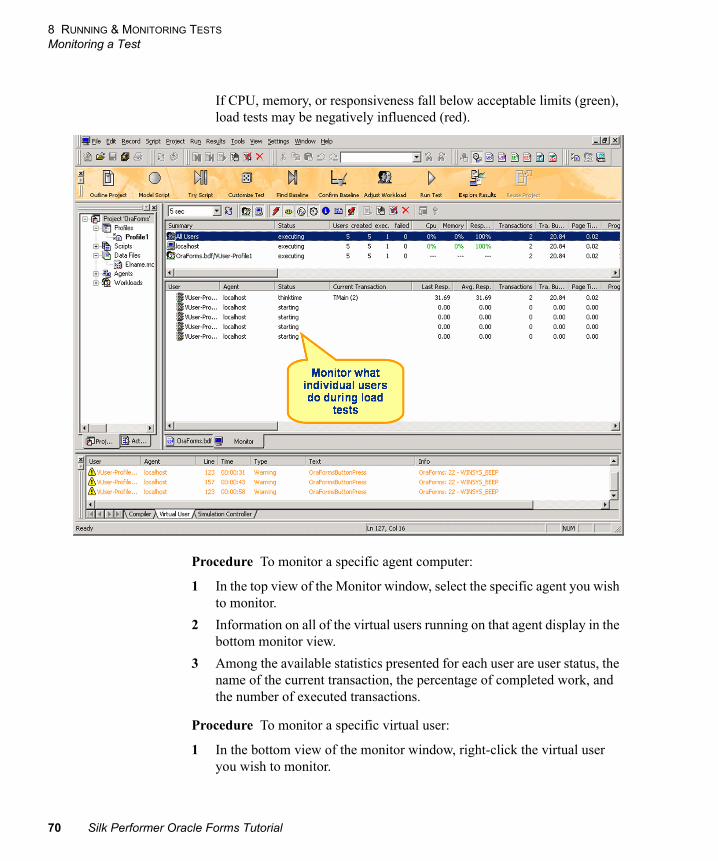
If CPU, memory, or responsiveness fall below acceptable limits (green), load tests may be negatively influenced (red).
Procedure To monitor a specific agent computer:
1 In the top view of the Monitor window, select the specific agent you wish to monitor.
2 Information on all of the virtual users running on that agent display in the bottom monitor view.
3 Among the available statistics presented for each user are user status, the name of the current transaction, the percentage of completed work, and the number of executed transactions.
Procedure To monitor a specific virtual user:
1 In the bottom view of the monitor window, right-click the virtual user you wish to monitor.
70 Silk Performer Oracle Forms Tutorial
8 RUNNING & MONITORING TESTS
Monitoring a Test
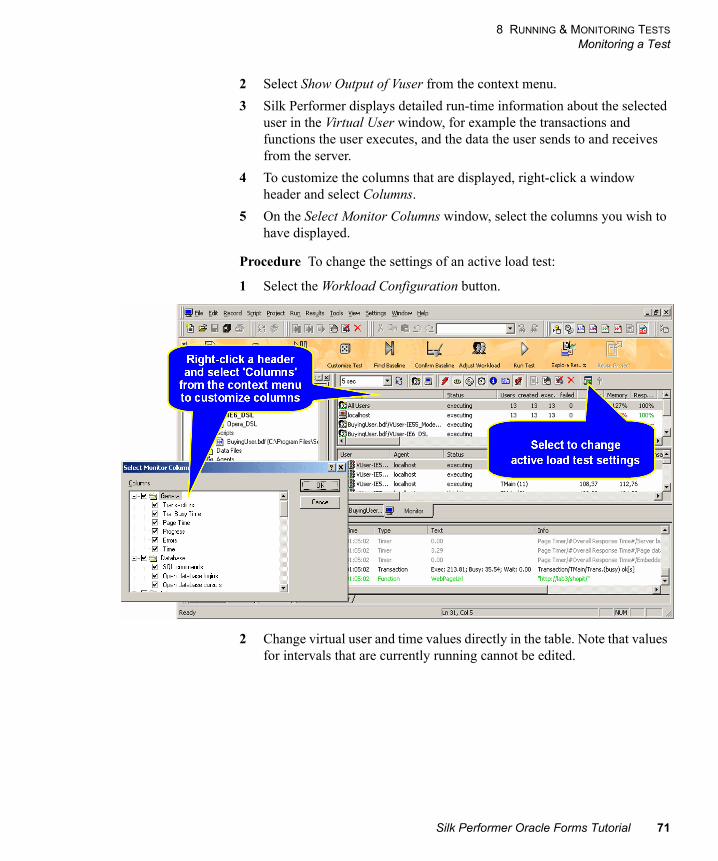
2 Select Show Output of Vuser from the context menu.
3 Silk Performer displays detailed run-time information about the selected user in the Virtual User window, for example the transactions and functions the user executes, and the data the user sends to and receives from the server.
4 To customize the columns that are displayed, right-click a window header and select Columns.
5 On the Select Monitor Columns window, select the columns you wish to have displayed.
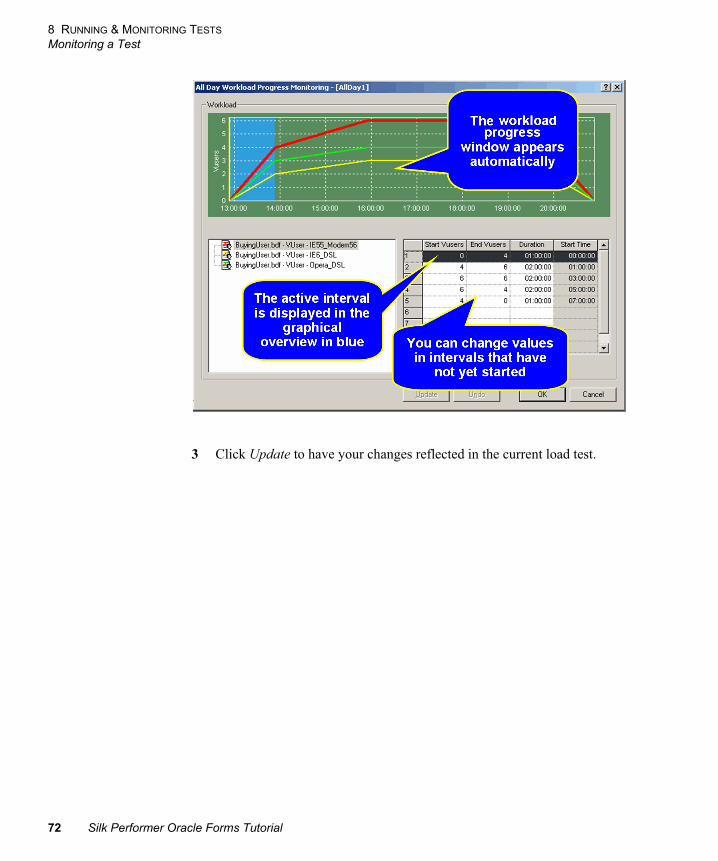
Procedure To change the settings of an active load test:
1 Select the Workload Configuration button.
2 Change virtual user and time values directly in the table. Note that values for intervals that are currently running cannot be edited.
Silk Performer Oracle Forms Tutorial 71
8 RUNNING & MONITORING TESTS
Monitoring a Test
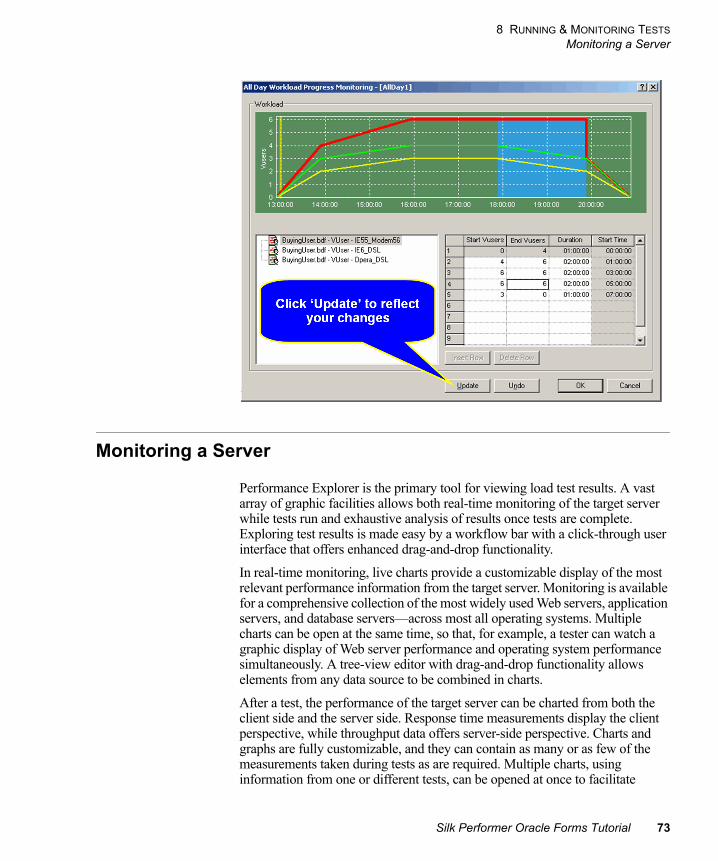
3 Click Update to have your changes reflected in the current load test.
72 Silk Performer Oracle Forms Tutorial
8 RUNNING & MONITORING TESTS
Monitoring a Server
Monitoring a Server
Performance Explorer is the primary tool for viewing load test results. A vast array of graphic facilities allows both real-time monitoring of the target server while tests run and exhaustive analysis of results once tests are complete. Exploring test results is made easy by a workflow bar with a click-through user interface that offers enhanced drag-and-drop functionality.
In real-time monitoring, live charts provide a customizable display of the most relevant performance information from the target server. Monitoring is available for a comprehensive collection of the most widely used Web servers, application servers, and database servers—across most all operating systems. Multiple charts can be open at the same time, so that, for example, a tester can watch a graphic display of Web server performance and operating system performance simultaneously. A tree-view editor with drag-and-drop functionality allows elements from any data source to be combined in charts.
After a test, the performance of the target server can be charted from both the client side and the server side. Response time measurements display the client perspective, while throughput data offers server-side perspective. Charts and graphs are fully customizable, and they can contain as many or as few of the measurements taken during tests as are required. Multiple charts, using information from one or different tests, can be opened at once to facilitate
Silk Performer Oracle Forms Tutorial 73
8 RUNNING & MONITORING TESTS
Monitoring a Server
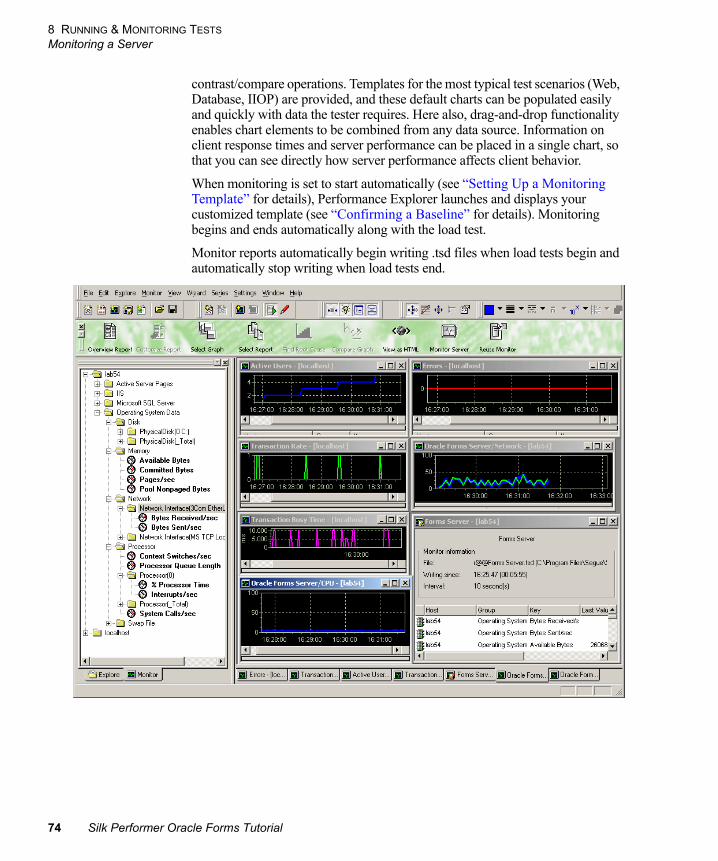
contrast/compare operations. Templates for the most typical test scenarios (Web, Database, IIOP) are provided, and these default charts can be populated easily and quickly with data the tester requires. Here also, drag-and-drop functionality enables chart elements to be combined from any data source. Information on client response times and server performance can be placed in a single chart, so that you can see directly how server performance affects client behavior.
When monitoring is set to start automatically (see “Setting Up a Monitoring Template” for details), Performance Explorer launches and displays your customized template (see “Confirming a Baseline” for details). Monitoring begins and ends automatically along with the load test.
Monitor reports automatically begin writing .tsd files when load tests begin and automatically stop writing when load tests end.
74 Silk Performer Oracle Forms Tutorial
9
Chapter 9 Exploring Test ResultsIntroduction This tutorial explains how to analyze Oracle Forms load test results using Silk Performer.
What you will learn This chapter contains the following sections:
Overview
TrueLog On Error TrueLog On Error files provide complete histories of erroneous transactions uncovered during load tests—enabling you to drill down through real content to analyze error conditions. TrueLog On Error files maintain histories of all client requests and server responses. Because they present errors in the context of the sessions within which they occur and are closely integrated with test scripts, TrueLog On Error files are uniquely suited for root-cause analysis of system and application faults.
Overview Reports Once a load test is complete, Performance Explorer provides an overview report for the load test. These reports include the most important test results in tabular and graphical form.
Graphs Performance Explorer offers a comprehensive array of graphic features for displaying test results, primarily in user-defined graphs, with as many elements as required. The results of different tests can be compared, and there are extensive features for server monitoring.
Section Page
Overview 75
Working with TrueLog On Error 76
Viewing an Overview Report 78
Viewing a Graph 90
Silk Performer Oracle Forms Tutorial 75
9 EXPLORING TEST RESULTS
Working with TrueLog On Error
Working with TrueLog On Error
After load tests, it’s typical to have multiple TrueLog On Error files loaded into TrueLog Explorer, one TrueLog for each virtual user who returns an error. With TrueLog Explorer’s Find Errors feature, you can jump from one error to the next sequentially as they occurred in time, regardless of which TrueLogs the errors were recorded in. This simplifies the process of analyzing errors—there’s no need for you to manually review all open TrueLogs to find the next error in a sequence.
Procedure To analyze erroneous transactions uncovered during a load test:
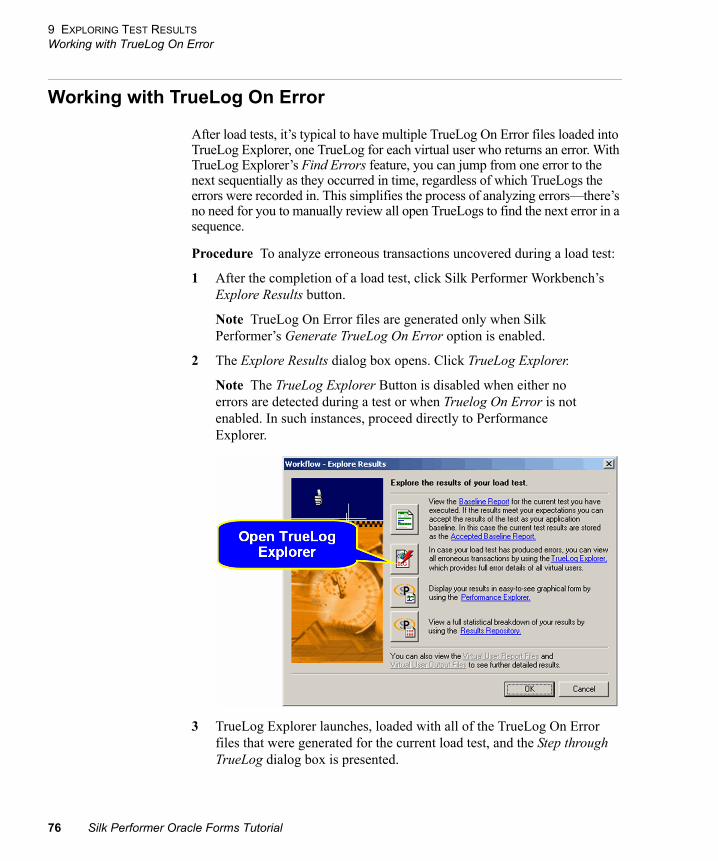
1 After the completion of a load test, click Silk Performer Workbench’s Explore Results button.
Note TrueLog On Error files are generated only when Silk Performer’s Generate TrueLog On Error option is enabled.
2 The Explore Results dialog box opens. Click TrueLog Explorer.
Note The TrueLog Explorer Button is disabled when either no errors are detected during a test or when Truelog On Error is not enabled. In such instances, proceed directly to Performance Explorer.
3 TrueLog Explorer launches, loaded with all of the TrueLog On Error files that were generated for the current load test, and the Step through TrueLog dialog box is presented.
76 Silk Performer Oracle Forms Tutorial
9 EXPLORING TEST RESULTS
Working with TrueLog On Error
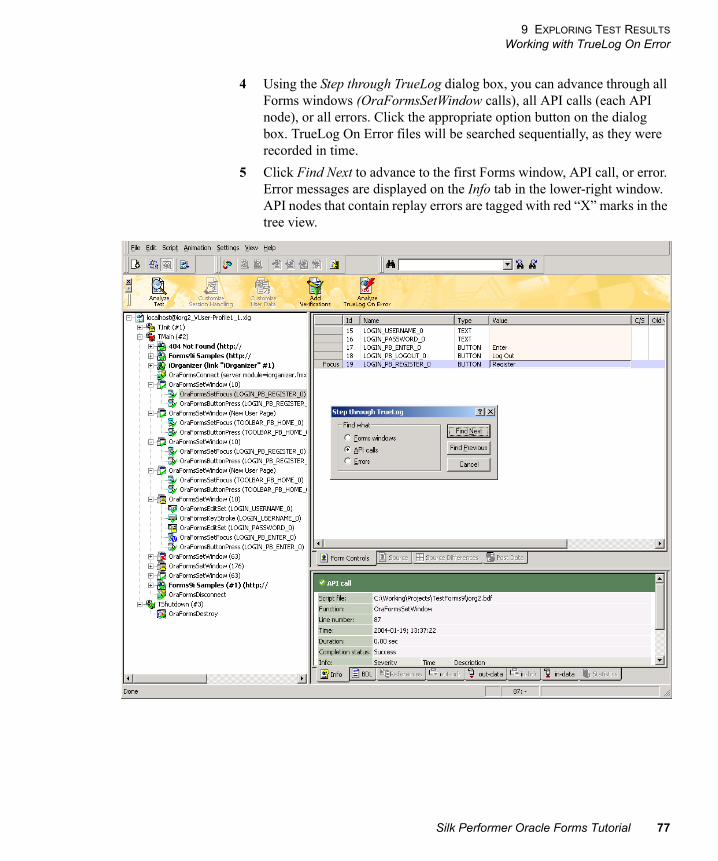
4 Using the Step through TrueLog dialog box, you can advance through all Forms windows (OraFormsSetWindow calls), all API calls (each API node), or all errors. Click the appropriate option button on the dialog box. TrueLog On Error files will be searched sequentially, as they were recorded in time.
5 Click Find Next to advance to the first Forms window, API call, or error. Error messages are displayed on the Info tab in the lower-right window. API nodes that contain replay errors are tagged with red “X” marks in the tree view.
Silk Performer Oracle Forms Tutorial 77
9 EXPLORING TEST RESULTS
Viewing an Overview Report
Viewing an Overview Report
Overview reports include the most important load test results in tabular and graphical form.
Overview reports are comprised of the following sections:
• General information
• Summary tables
• User types
• Custom charts
• Custom tables
• Detailed charts
• General information
Procedure To view an overview summary report:
1 Click the Explore Results button on the Silk Performer Workflow bar.
2 The Explore Results dialog appears.
78 Silk Performer Oracle Forms Tutorial
9 EXPLORING TEST RESULTS
Viewing an Overview Report
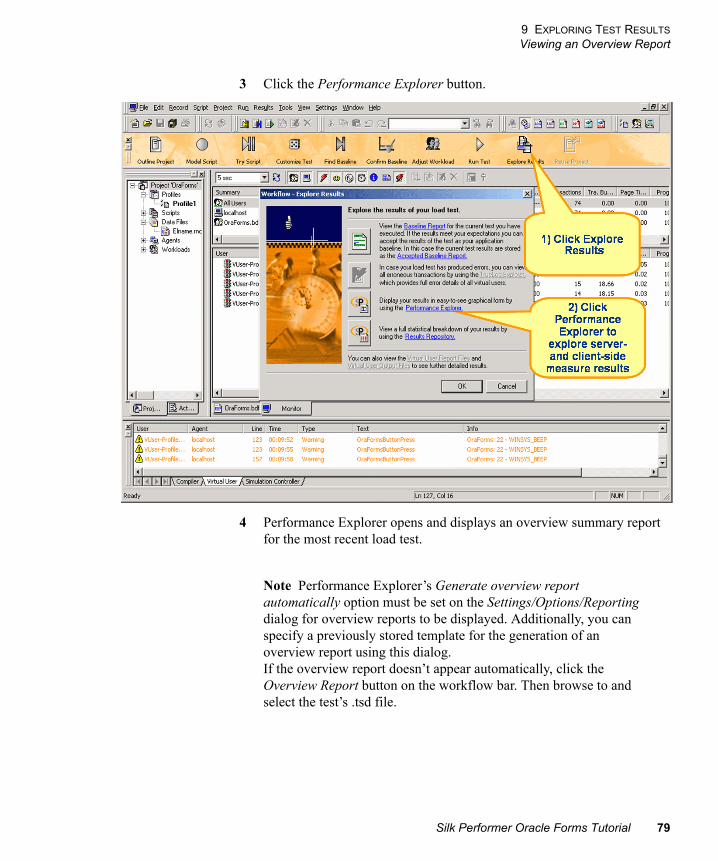
3 Click the Performance Explorer button.
4 Performance Explorer opens and displays an overview summary report for the most recent load test.
Note Performance Explorer’s Generate overview report automatically option must be set on the Settings/Options/Reporting dialog for overview reports to be displayed. Additionally, you can specify a previously stored template for the generation of an overview report using this dialog.If the overview report doesn’t appear automatically, click the Overview Report button on the workflow bar. Then browse to and select the test’s .tsd file.
Silk Performer Oracle Forms Tutorial 79
9 EXPLORING TEST RESULTS
Viewing an Overview Report
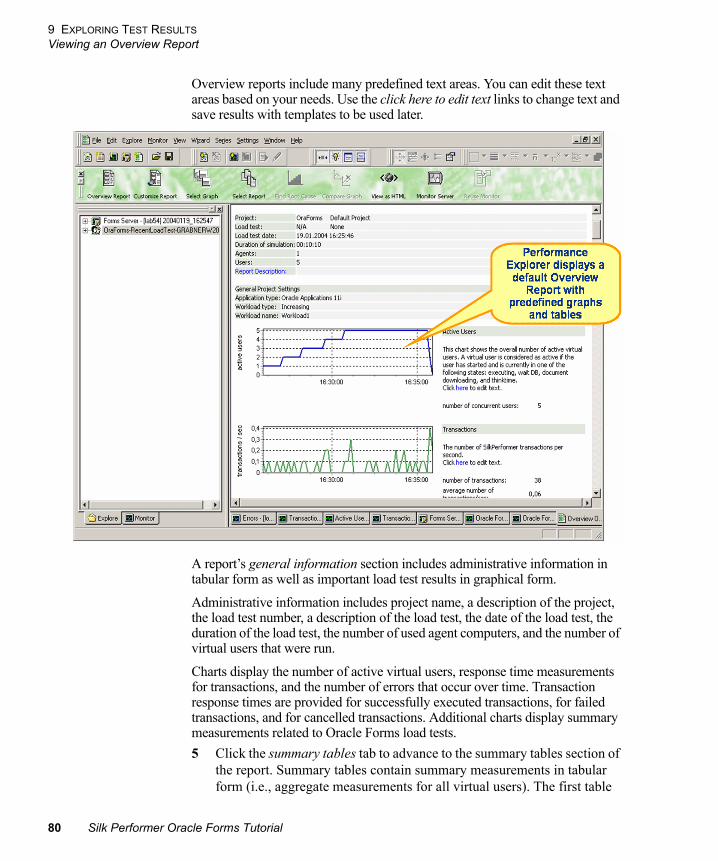
Overview reports include many predefined text areas. You can edit these text areas based on your needs. Use the click here to edit text links to change text and save results with templates to be used later.
A report’s general information section includes administrative information in tabular form as well as important load test results in graphical form.
Administrative information includes project name, a description of the project, the load test number, a description of the load test, the date of the load test, the duration of the load test, the number of used agent computers, and the number of virtual users that were run.
Charts display the number of active virtual users, response time measurements for transactions, and the number of errors that occur over time. Transaction response times are provided for successfully executed transactions, for failed transactions, and for cancelled transactions. Additional charts display summary measurements related to Oracle Forms load tests.
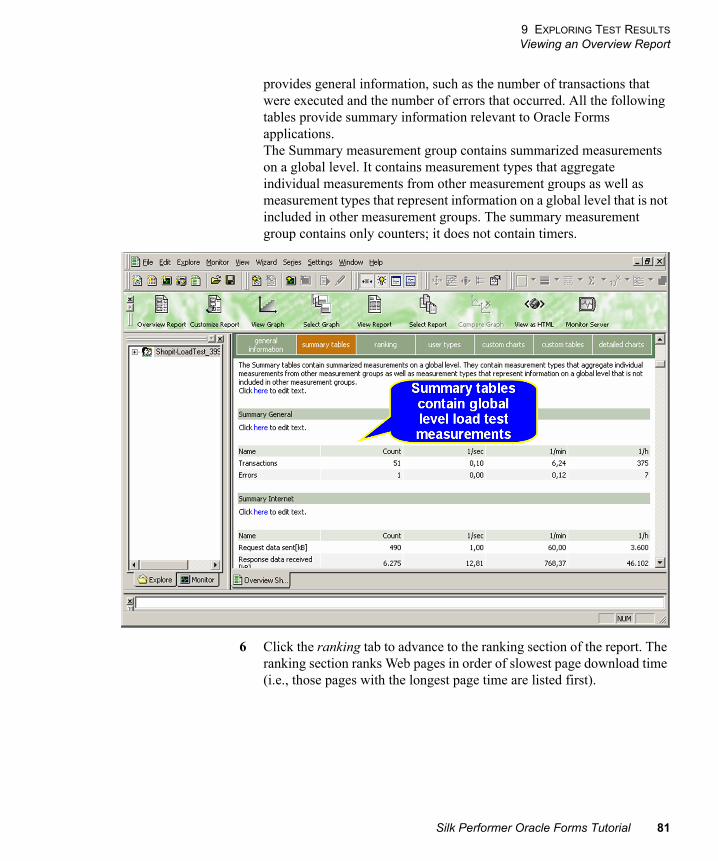
5 Click the summary tables tab to advance to the summary tables section of the report. Summary tables contain summary measurements in tabular form (i.e., aggregate measurements for all virtual users). The first table
80 Silk Performer Oracle Forms Tutorial
9 EXPLORING TEST RESULTS
Viewing an Overview Report
provides general information, such as the number of transactions that were executed and the number of errors that occurred. All the following tables provide summary information relevant to Oracle Forms applications.The Summary measurement group contains summarized measurements on a global level. It contains measurement types that aggregate individual measurements from other measurement groups as well as measurement types that represent information on a global level that is not included in other measurement groups. The summary measurement group contains only counters; it does not contain timers.
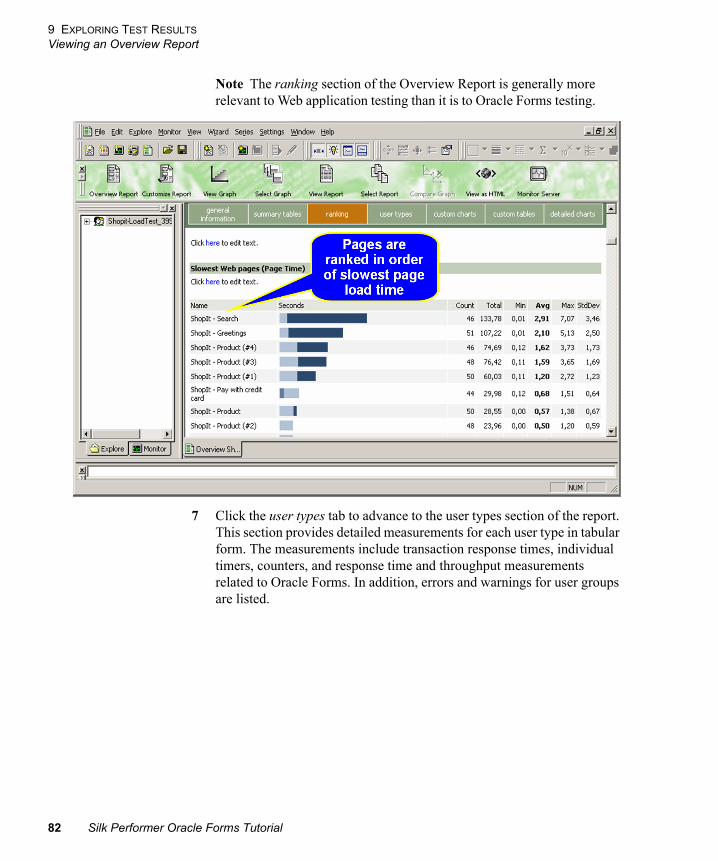
6 Click the ranking tab to advance to the ranking section of the report. The ranking section ranks Web pages in order of slowest page download time (i.e., those pages with the longest page time are listed first).
Silk Performer Oracle Forms Tutorial 81
9 EXPLORING TEST RESULTS
Viewing an Overview Report
Note The ranking section of the Overview Report is generally more relevant to Web application testing than it is to Oracle Forms testing.
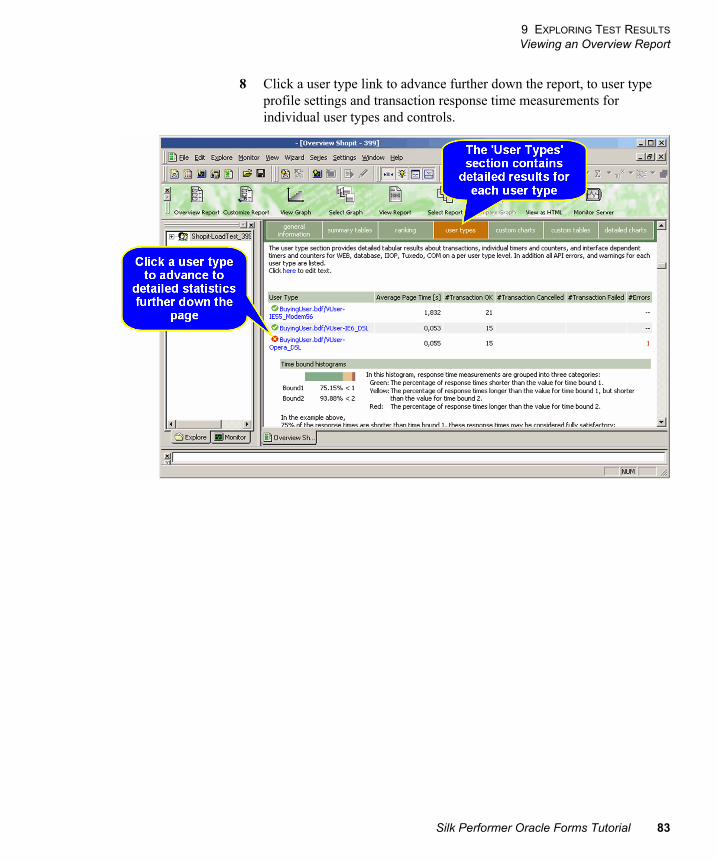
7 Click the user types tab to advance to the user types section of the report. This section provides detailed measurements for each user type in tabular form. The measurements include transaction response times, individual timers, counters, and response time and throughput measurements related to Oracle Forms. In addition, errors and warnings for user groups are listed.
82 Silk Performer Oracle Forms Tutorial
9 EXPLORING TEST RESULTS
Viewing an Overview Report
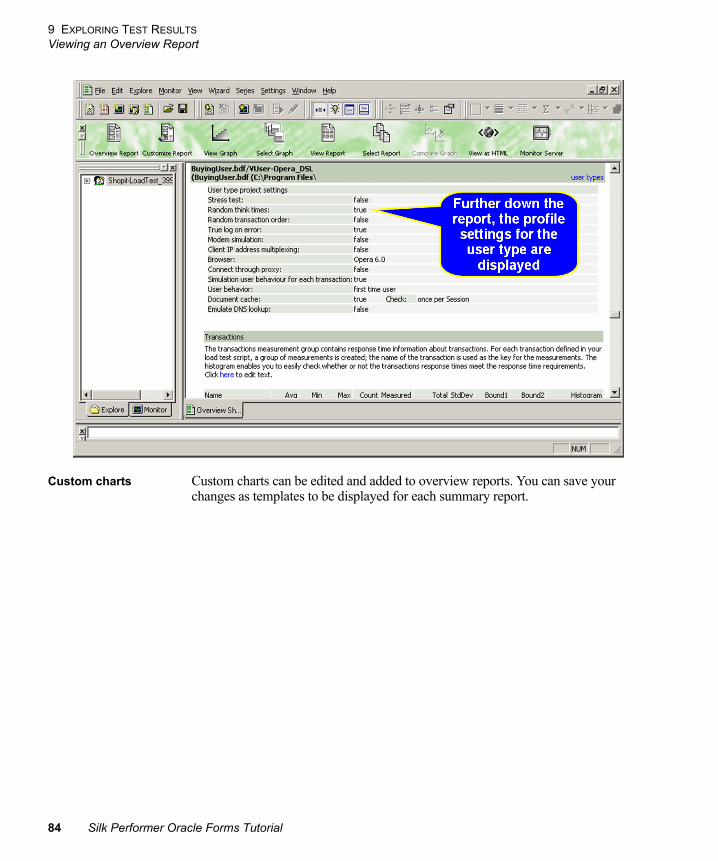
8 Click a user type link to advance further down the report, to user type profile settings and transaction response time measurements for individual user types and controls.
Silk Performer Oracle Forms Tutorial 83
9 EXPLORING TEST RESULTS
Viewing an Overview Report
Custom charts Custom charts can be edited and added to overview reports. You can save your changes as templates to be displayed for each summary report.
84 Silk Performer Oracle Forms Tutorial
9 EXPLORING TEST RESULTS
Viewing an Overview Report
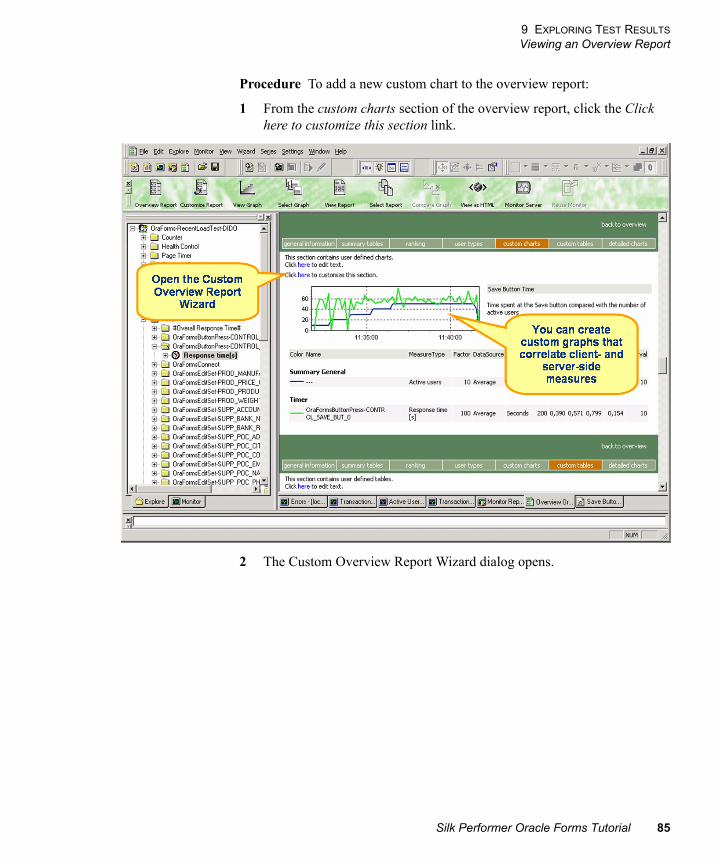
Procedure To add a new custom chart to the overview report:
1 From the custom charts section of the overview report, click the Click here to customize this section link.
2 The Custom Overview Report Wizard dialog opens.
Silk Performer Oracle Forms Tutorial 85
9 EXPLORING TEST RESULTS
Viewing an Overview Report
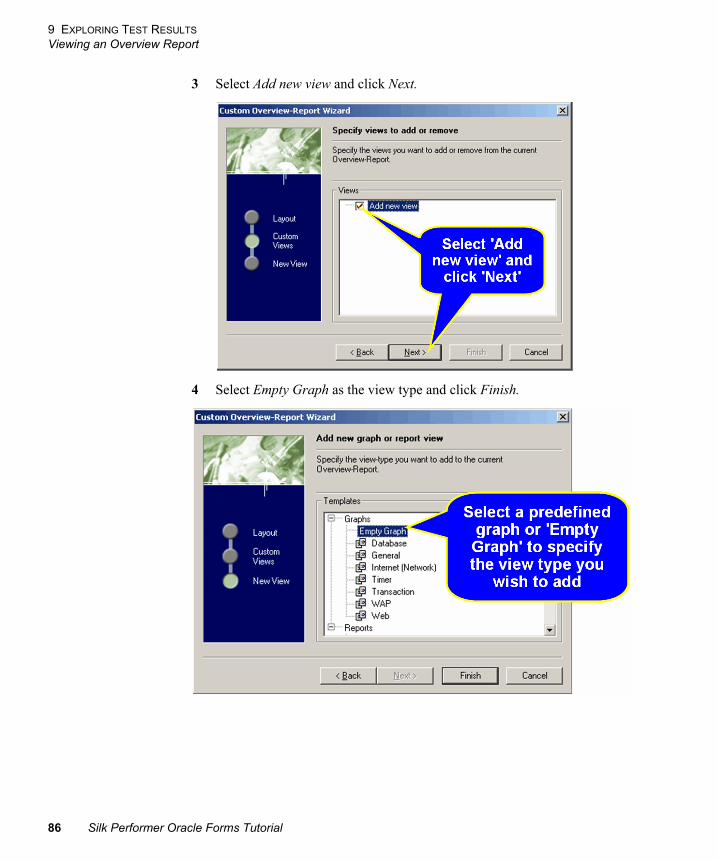
3 Select Add new view and click Next.
4 Select Empty Graph as the view type and click Finish.
86 Silk Performer Oracle Forms Tutorial
9 EXPLORING TEST RESULTS
Viewing an Overview Report
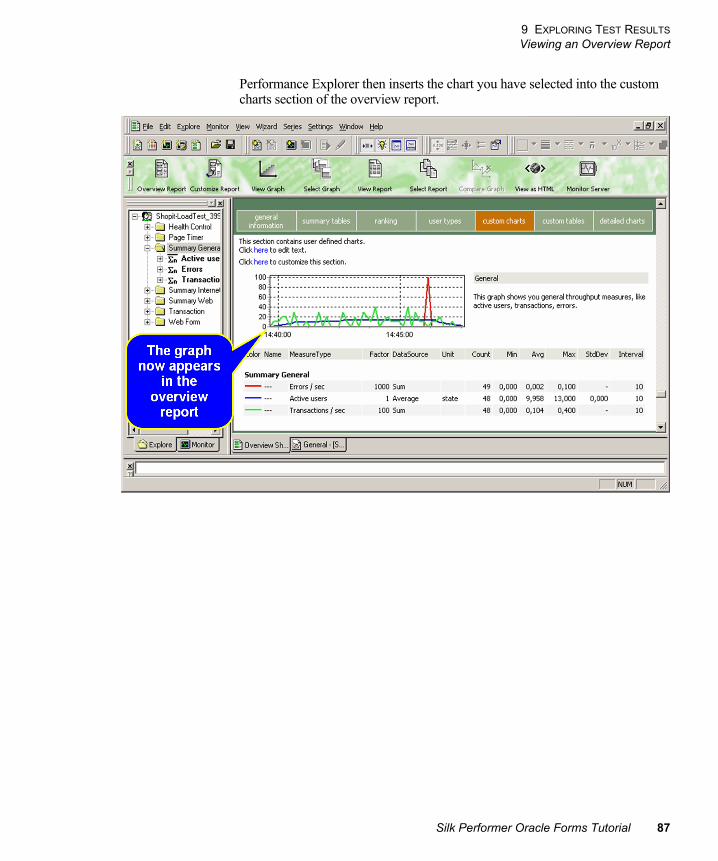
Performance Explorer then inserts the chart you have selected into the custom charts section of the overview report.
Silk Performer Oracle Forms Tutorial 87
9 EXPLORING TEST RESULTS
Viewing an Overview Report
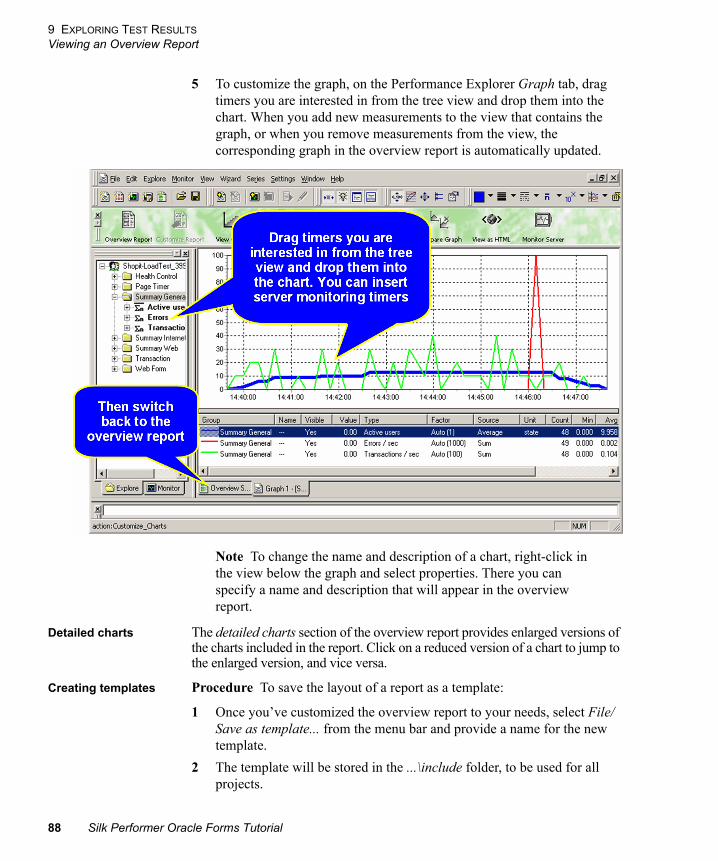
5 To customize the graph, on the Performance Explorer Graph tab, drag timers you are interested in from the tree view and drop them into the chart. When you add new measurements to the view that contains the graph, or when you remove measurements from the view, the corresponding graph in the overview report is automatically updated.
Note To change the name and description of a chart, right-click in the view below the graph and select properties. There you can specify a name and description that will appear in the overview report.
Detailed charts The detailed charts section of the overview report provides enlarged versions of the charts included in the report. Click on a reduced version of a chart to jump to the enlarged version, and vice versa.
Creating templates Procedure To save the layout of a report as a template:
1 Once you’ve customized the overview report to your needs, select File/Save as template... from the menu bar and provide a name for the new template.
2 The template will be stored in the ...\include folder, to be used for all projects.
88 Silk Performer Oracle Forms Tutorial
9 EXPLORING TEST RESULTS
Viewing an Overview Report
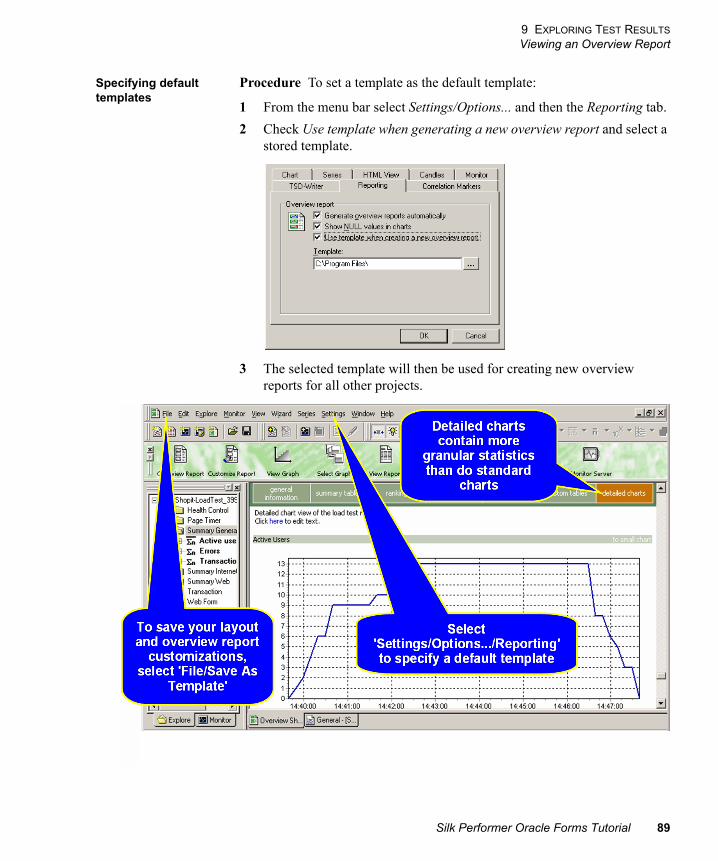
Specifying default templates
Procedure To set a template as the default template:
1 From the menu bar select Settings/Options... and then the Reporting tab.
2 Check Use template when generating a new overview report and select a stored template.
3 The selected template will then be used for creating new overview reports for all other projects.
Silk Performer Oracle Forms Tutorial 89
9 EXPLORING TEST RESULTS
Viewing a Graph
Viewing a Graph
Procedure To view results in a graph:
1 Click the Explore Results button in the Silk Performer Workflow bar.
2 The Explore Results dialog appears.
3 Click the Performance Explorer button.
4 Performance Explorer opens.
90 Silk Performer Oracle Forms Tutorial
9 EXPLORING TEST RESULTS
Viewing a Graph
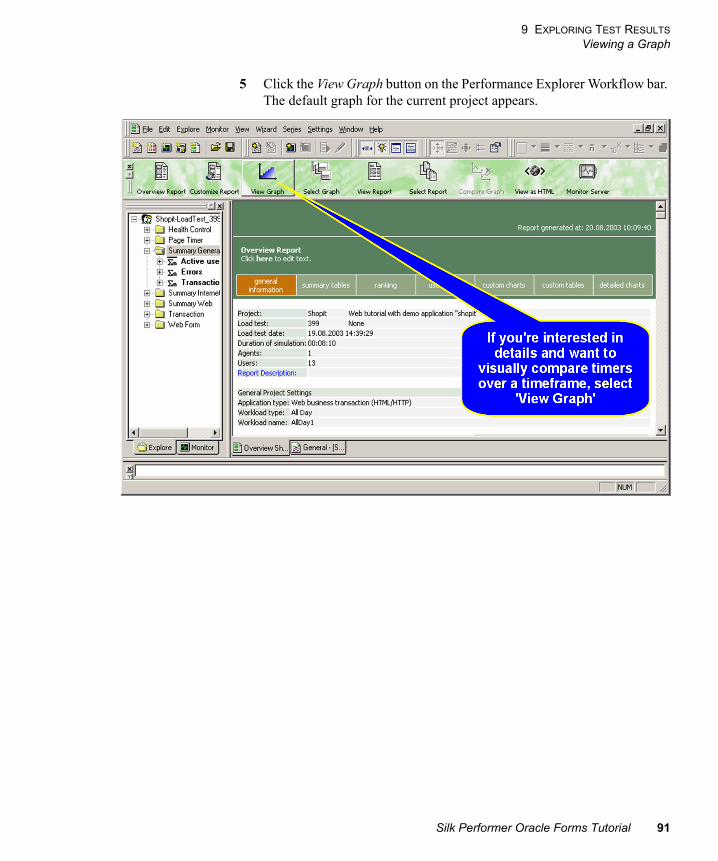
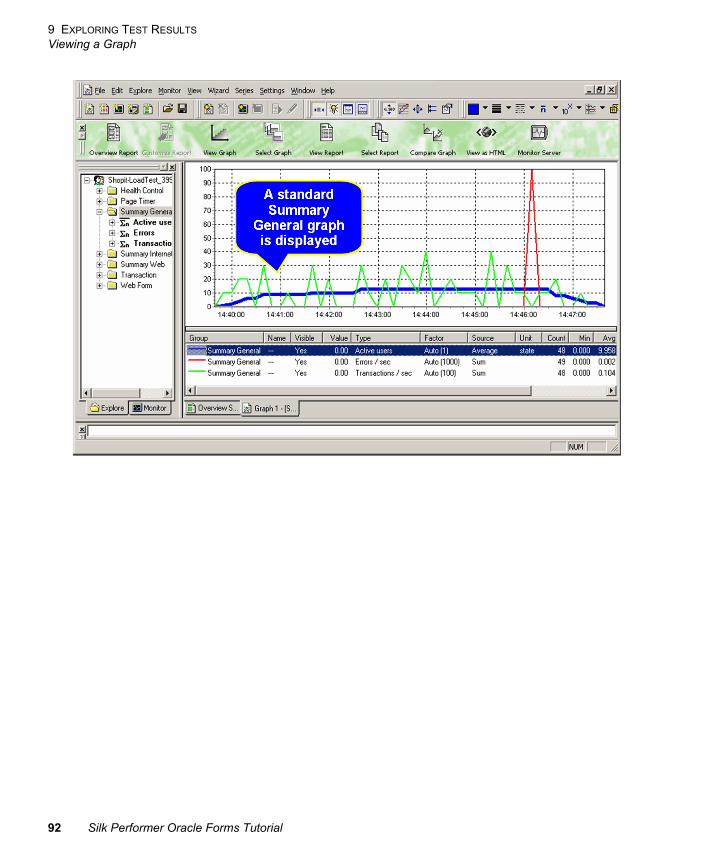
5 Click the View Graph button on the Performance Explorer Workflow bar. The default graph for the current project appears.
Silk Performer Oracle Forms Tutorial 91
9 EXPLORING TEST RESULTS
Viewing a Graph
92 Silk Performer Oracle Forms Tutorial
9 EXPLORING TEST RESULTS
Viewing a Graph
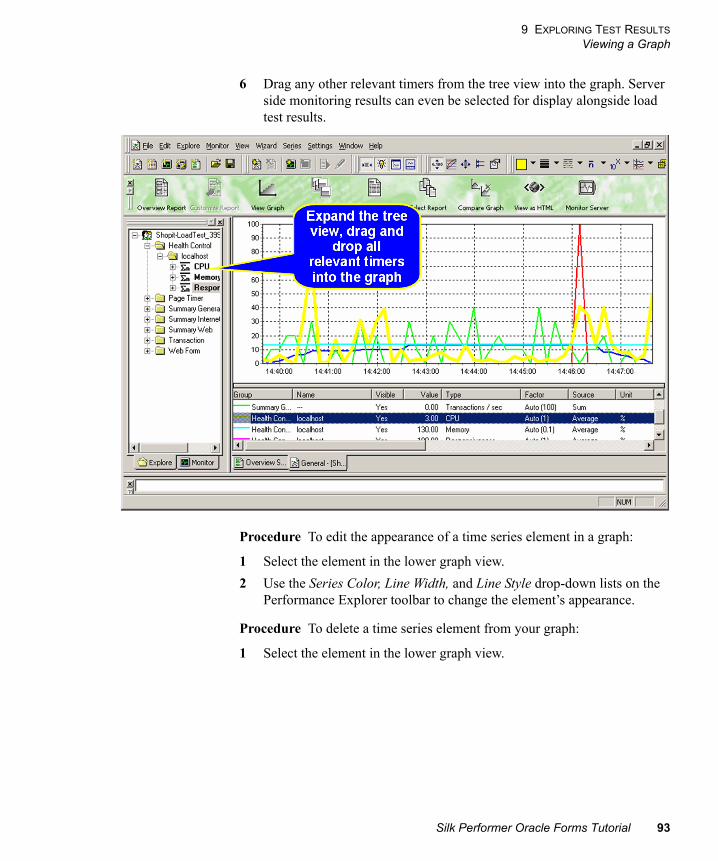
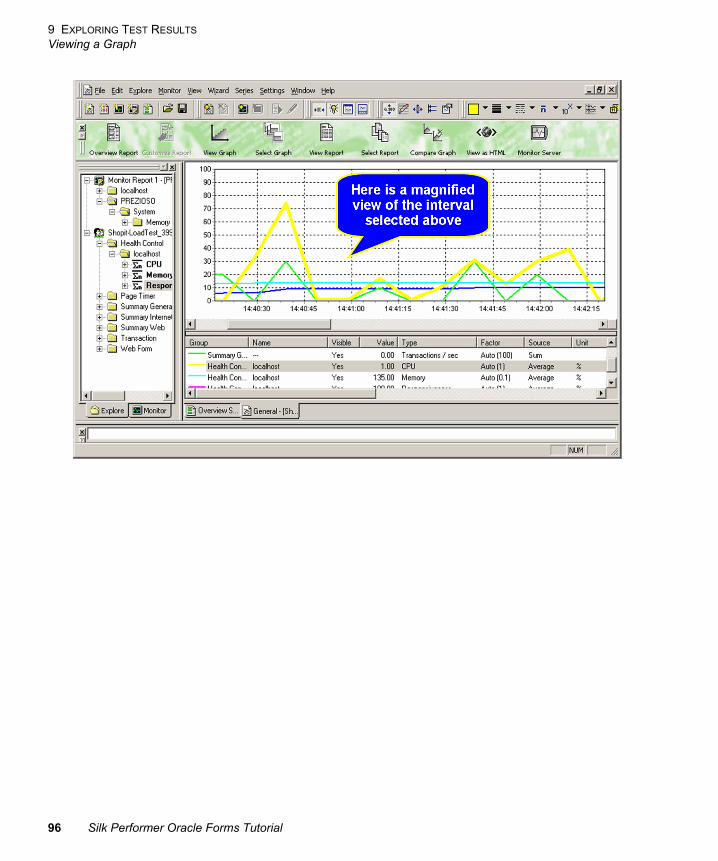
6 Drag any other relevant timers from the tree view into the graph. Server side monitoring results can even be selected for display alongside load test results.
Procedure To edit the appearance of a time series element in a graph:
1 Select the element in the lower graph view.
2 Use the Series Color, Line Width, and Line Style drop-down lists on the Performance Explorer toolbar to change the element’s appearance.
Procedure To delete a time series element from your graph:
1 Select the element in the lower graph view.
Silk Performer Oracle Forms Tutorial 93
9 EXPLORING TEST RESULTS
Viewing a Graph
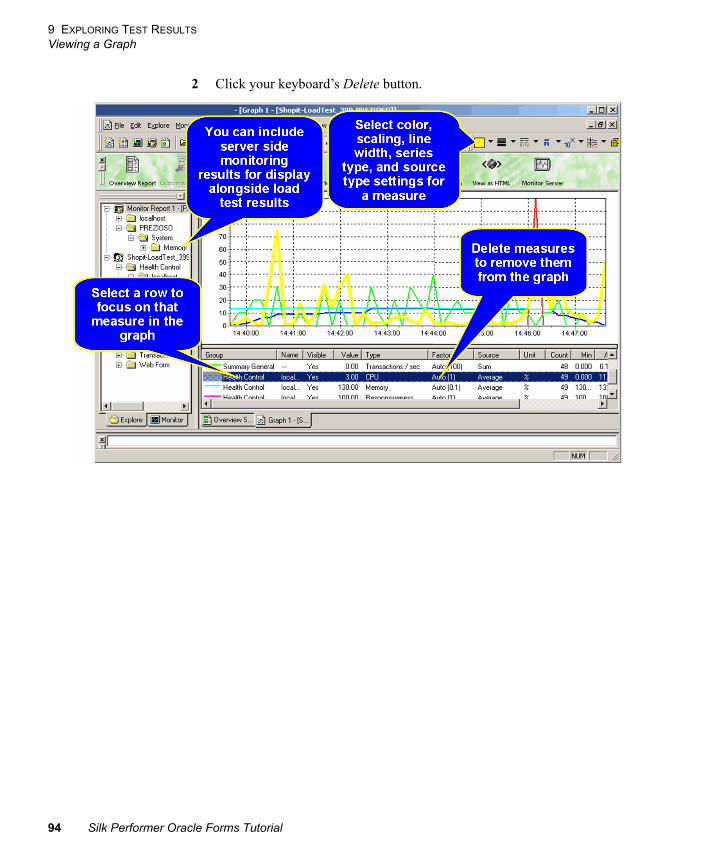
2 Click your keyboard’s Delete button.
94 Silk Performer Oracle Forms Tutorial
9 EXPLORING TEST RESULTS
Viewing a Graph
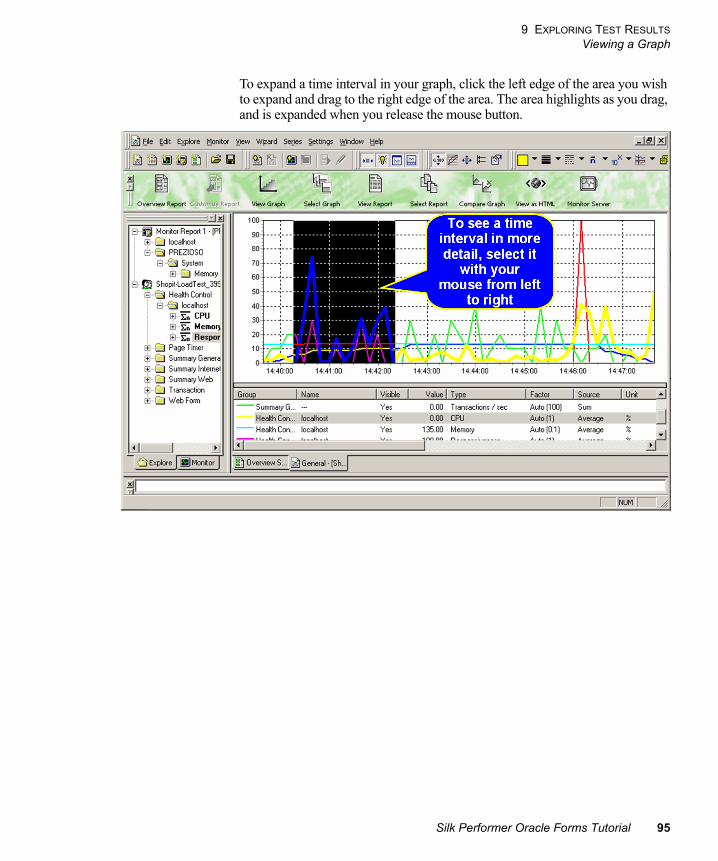
To expand a time interval in your graph, click the left edge of the area you wish to expand and drag to the right edge of the area. The area highlights as you drag, and is expanded when you release the mouse button.
Silk Performer Oracle Forms Tutorial 95
9 EXPLORING TEST RESULTS
Viewing a Graph
96 Silk Performer Oracle Forms Tutorial
Index
A
Accept Results button 47Agents 70
B
Baseline performanceConfirming 45Identifying 43
Baseline reports 45BDL 11, 32, 34, 37
C
Charts 73, 80, 88Client-side monitoring 49Connection parameters 54Content verifications 23, 32CORBA 40Custom charts 84Customizing user input data 26
D
Data files, multi-column 31Data Source Wizard 52dclparam 27dclrand 27Detailed charts 88
E
Errors 37
F
Find differences 24
G
Graphs 73, 75, 88Viewing 90
H
HTMLPage timers 46User data customization 26-32
I
IIOP 40Input data, customization 26-32
J
Jolt 40
L
Load test scriptsCreating 11Customizing 23, 26Trying out 19
Load tests, running 67
M
MonitoringCustom templates 50Starting automatically 50
Monitoring tests 69Multi-column data files 31
O
Overview Report Wizard 85
P
Parameter Wizard 26Parameters
Creating new for HTML 28From random variables 28
Performance Explorer 73, 75, 87Projects
Defining new 3Reusing 2
Silk Performer Oracle Forms Tutorial 97
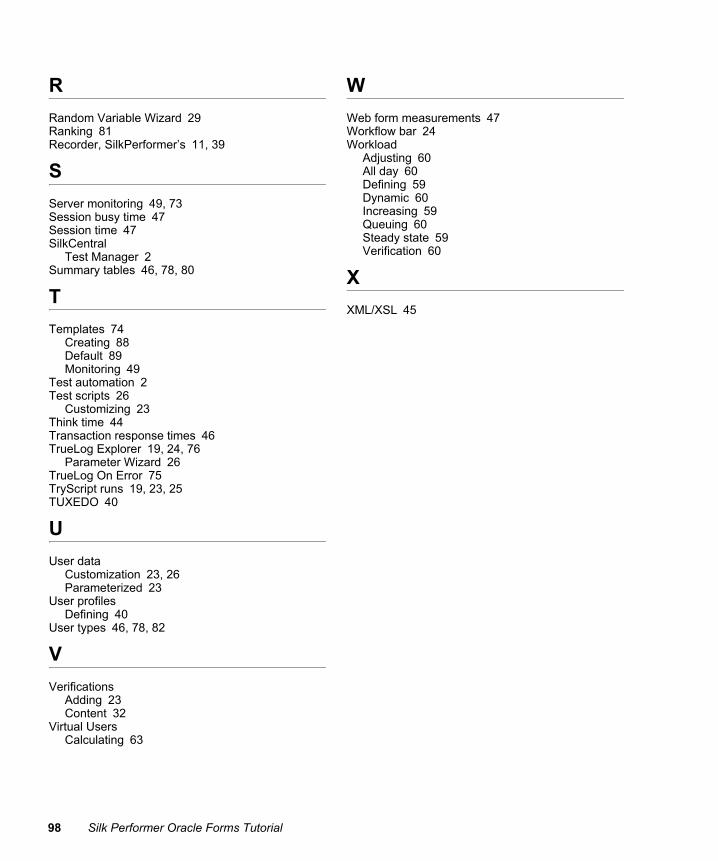
R
Random Variable Wizard 29Ranking 81Recorder, SilkPerformer’s 11, 39
S
Server monitoring 49, 73Session busy time 47Session time 47SilkCentral
Test Manager 2Summary tables 46, 78, 80
T
Templates 74Creating 88Default 89Monitoring 49
Test automation 2Test scripts 26
Customizing 23Think time 44Transaction response times 46TrueLog Explorer 19, 24, 76
Parameter Wizard 26TrueLog On Error 75TryScript runs 19, 23, 25TUXEDO 40
U
User dataCustomization 23, 26Parameterized 23
User profilesDefining 40
User types 46, 78, 82
V
VerificationsAdding 23Content 32
Virtual UsersCalculating 63
W
Web form measurements 47Workflow bar 24Workload
Adjusting 60All day 60Defining 59Dynamic 60Increasing 59Queuing 60Steady state 59Verification 60
X
XML/XSL 45
98 Silk Performer Oracle Forms Tutorial

Silk Performer Oracle Forms Tutorial 99

100 Silk Performer Oracle Forms Tutorial