signs of collaborative ideation and the hybrid ideation … · signs of collaborative ideation and...
TRANSCRIPT
Signs of Collaborative Ideation and the Hybrid Ideation Space
Tomás Dorta1, Annemarie Lesage1, Edgar Pérez1 and J.M. Christian Bastien2 1 Hybridlab, École de design industriel, Université de Montréal, Canada 2 InterPsy-ETIC, Université Paul Verlaine – Metz, France
Abstract. We describe the signs of Collaborative Ideation (CI) that have been observed in face-to-face design settings using two methodological tools, the CI Loop and the Design Flow pattern. The CI Loop, which includes body gestures, was first observed in this study and captures the participants’ design conversation while collaborating. The Design Flow assesses the designer’s experience while designing. The main goal is to better understand collaborative ideation, from the user’s experience point of view, in order to better assess collaborative design tools. We present two protocols (short with students; long with professionals) done in the Hybrid Ideation Space (HIS), a face-to-face CI tool. The HIS has previously been evaluated and compared to traditional and digital tools, and appears to enhance the collaborative ideation process. This study also proposes an eventual relationship between CI Loop and Design Flow pattern at micro (during a minute) and macro levels (during a longer period).
Keywords: Collaborative ideation, Design Flow, CI Loop, Hybrid Ideation Space
1 Introduction
Vital signs in medicine traditionally refer to body temperature, blood pressure, pulse and respiratory rate. They show the more basic body functions that are used to detect medical problems. In design research, there is a lack of recognized vital signs to assess the essential aspects of the design activity. This can become an important problem because improperly assessed collaborative design tools affect designers’ basic functions to the point of choking design creativity.
In this article, we present two methodological tools to better observe the activity of collaborative “ideation” (or conceptual design) and capture the information it provides. They could give a new, richer picture of what collaborative ideation (CI) is. One new tool, the CI Loop, is combined here with a former one, the Design Flow pattern. We propose that the role of collaborative ideation’s vital signs could help keep tabs on what is going on while the designer is engaged in the CI process. These vital signs could help analyze one of the more important moments of the design
creativity process, like the ideation (when basic ideas emerge), while collaborating, in order to propose more effective collaborative design interfaces.
Having had to evaluate design tools and go deeper on the mechanisms of ideation and collaborative ideation, we have developed two assessment methods: the Design Flow (Dorta, Pérez and Lesage, 2008) and the CI Analysis Grid (Dorta, Lesage and Pérez, 2009). Both of these tools eschew assessing results or efficiency of the task, focusing on what is experienced by the designers during the collaborative ideation process. With Design Flow, we follow the psychological states of the designer throughout the creative process, while the CI Analysis Grid highlights the different elements of the design conversation thus capturing the heart of the collaborative ideation. These methods have exposed recurring patterns over time that can be seen as characteristics of the ideation process (Design Flow pattern) and of the collaborative ideation process (CI Loop).
We ran an experience of collaborative ideation with design students using the Hybrid Ideation Space (HIS) as playground for this study. This tool was developed to allow the designers to be inside their representations generating immersive freehand sketches and physical models in real-time and at life scale (Dorta, 2007). The effectiveness of this tool for ideation (Dorta, Pérez and Lesage, 2008) and collaborative ideation (Dorta, Lesage and Pérez, 2009) was evaluated in several contexts and by different users. The overall results show that the HIS seems to improve the collaborative ideation.
The aim of this study is to see how the designer’s experience evolves not only through the design creativity process but this time through collaboration. This was achieved by looking at how the CI Loop and the Design Flow pattern were related. With the design student protocol, their 20-minute sessions did not yield enough fine-grained information to attempt to make this link. So we revisited the video recordings of a prior experience we did with two professional designers while designing a real-life project over two 3-hour sessions. The results point toward an eventual
2 T. Dorta, A. Lesage, E. Pérez, and J.M. C. Bastien
relationship between the CI Loops and the Design Flow at micro (during a minute) and macro levels (during a longer period of ideation).
2 Collaborative Ideation
In order to exteriorize verbally and visually an idea (Goldschmidt, 1990), designers need qualitative and ambiguous mental images and external visualizations in a continuous interaction (Visser, 2006). Typically, designers see more in their sketches and physical models than what they put in when they made them (Schön, 1983). They often work with incomplete information, assuming and taking provisional decisions that need to be revisited. Inaccuracy (flexibility), ambiguity (alternative meanings), and abstraction (simplification) are the main characteristics of this kind of reflective representations (Goel, 1995).
Furthermore, designing is considered a social process (Buccarelli, 1988). Teams discuss and negotiate between participants whose representations of the design are not aligned, and they do so by respecting the ambiguity while fostering a design conversation between the parties.
Verbal communication is considered to be the first design tool and the principal way of explaining ideas, even before visual representations (Jonson, 2005). In a collaborative work setting, the designers communicate their ideas to others using verbal communication, gestures and physical and graphical representations. Verbalization on its own or in combination with other design tools drives ideation and is the most common means of externalizing design intentions (Jonson, 2005). The strength of verbalization relies on words, in face-to-face settings or in computer-mediated environments (Lawson and Loke, 1997). Words are more than just medium for communication: they are part of the thinking process. Creativity and information exchange are mediated by the social nature of design. And in turn, the collaborative and social aspects of design are supported by verbalization (Cross and Cross, 1995).
2.1 Assessing Collaborative Ideation
Cognitive science and design theory have studied ideation, with controlled lab experiments mostly concerned with task execution, and through experiments using idea generation methods. There are two approaches in order to evaluate the effectiveness of ideation: process-based that measures the process of ideation, and outcome-based relating to the results (Shah and Vargas-Hernandez, 2003). For the first
approach, data collection comes from protocol analysis. However, this approach is often unfortunately based on simple problems or tasks as opposed to real design issues (Shah and Vargas-Hernandez, 2003). On the other hand, the outcome-based approach is questionable because it is based on the designer’s performance. Evaluating the results of ideation is hard because it depends on the designers practice and capabilities, which rely on subjectivity.
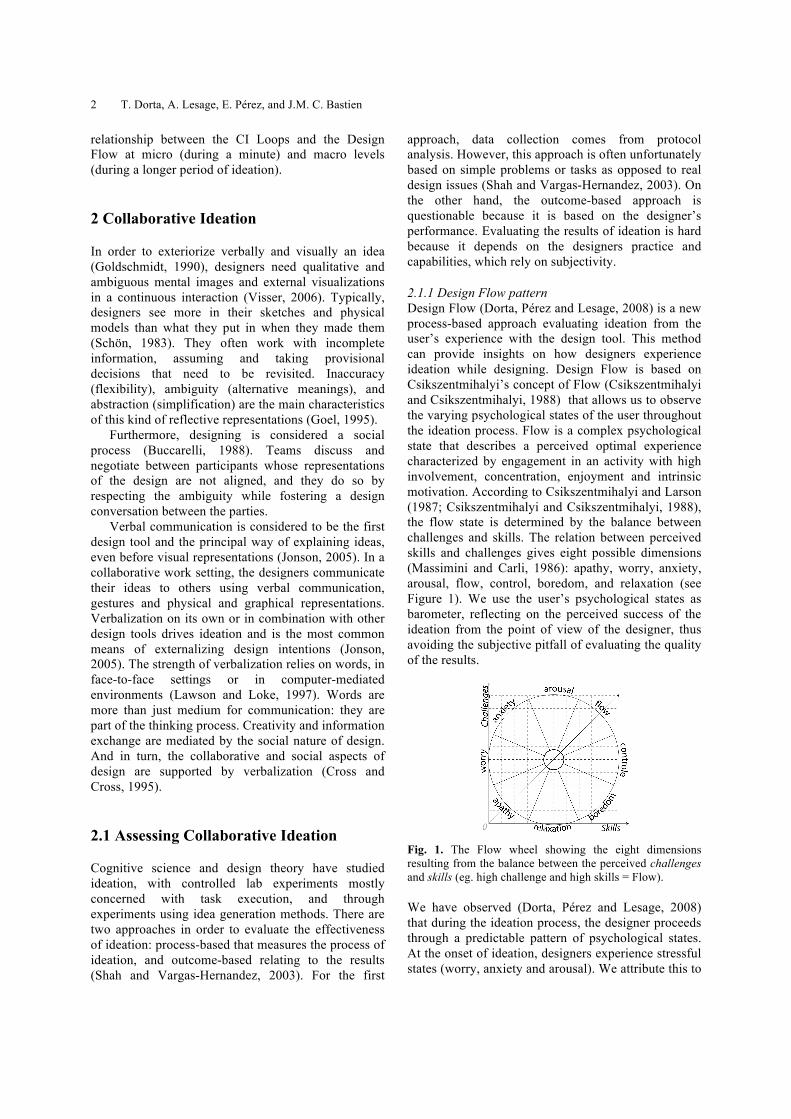
2.1.1 Design Flow pattern Design Flow (Dorta, Pérez and Lesage, 2008) is a new process-based approach evaluating ideation from the user’s experience with the design tool. This method can provide insights on how designers experience ideation while designing. Design Flow is based on Csikszentmihalyi’s concept of Flow (Csikszentmihalyi and Csikszentmihalyi, 1988) that allows us to observe the varying psychological states of the user throughout the ideation process. Flow is a complex psychological state that describes a perceived optimal experience characterized by engagement in an activity with high involvement, concentration, enjoyment and intrinsic motivation. According to Csikszentmihalyi and Larson (1987; Csikszentmihalyi and Csikszentmihalyi, 1988), the flow state is determined by the balance between challenges and skills. The relation between perceived skills and challenges gives eight possible dimensions (Massimini and Carli, 1986): apathy, worry, anxiety, arousal, flow, control, boredom, and relaxation (see Figure 1). We use the user’s psychological states as barometer, reflecting on the perceived success of the ideation from the point of view of the designer, thus avoiding the subjective pitfall of evaluating the quality of the results.
Fig. 1. The Flow wheel showing the eight dimensions resulting from the balance between the perceived challenges and skills (eg. high challenge and high skills = Flow).
We have observed (Dorta, Pérez and Lesage, 2008) that during the ideation process, the designer proceeds through a predictable pattern of psychological states. At the onset of ideation, designers experience stressful states (worry, anxiety and arousal). We attribute this to
Signs of Collaborative Ideation and the Hybrid Ideation Space 3
the process of giving form to unknown ideas. Once the process is engaged and the concepts are starting to form, the designer’s experience alternates from arousal to flow, entering flow with every satisfying result.
Once a concept is identified, her/his experience will alternate between flow and control. If being in the flow can be a sign of good performance, on its own it doesn’t account for the whole process. This progression from more stressful to less stressful states transiting through flow is what we consider as the Design Flow pattern.
2.1.2 CI Loop To observe collaborative ideation, we had to pay attention to the design conversation, which led us to develop the CI Analysis Grid (Dorta, Lesage and Pérez, 2009). This methodological instrument is a composite grounded in Bucciarelli’s design as social process (Buccarelli, 1988), Schön’s reflective conversation (Schön, 1983) and Goldschmidt’s graphical representation of concepts and actions (Goldschmidt, 1990). We developed this analysis grid based on five elements common in the analysis of the design conversation and design process among those three authors: naming, constraining, negotiating, decision making and moving.
Designers will be naming things, outlining a common concern, constraining the project through requirements or boundaries (time, budget, constraints), negotiating or articulating verbal meanings associated to visual images. They will be making decisions, and moving (making a design move), such as adding to the representation and making pointing and sketching gestures towards the representation. The first four actions are usually in the form of verbal exchange, while the moving is characterized by an act, an operation, which transforms the design situation (Goldschmidt, 1990; Valkenburg and Dorst, 1998). Gestures (pointing with hand or laser pointer, or through body movement) complement the verbal exchanges, but like design moves they also push the design forward (by drawing a new shape in the air, for example) (Visser, 2010). We have used the CI Analysis Grid to identify these five elements, to see how they appeared in what configuration and their relationship with gestures.
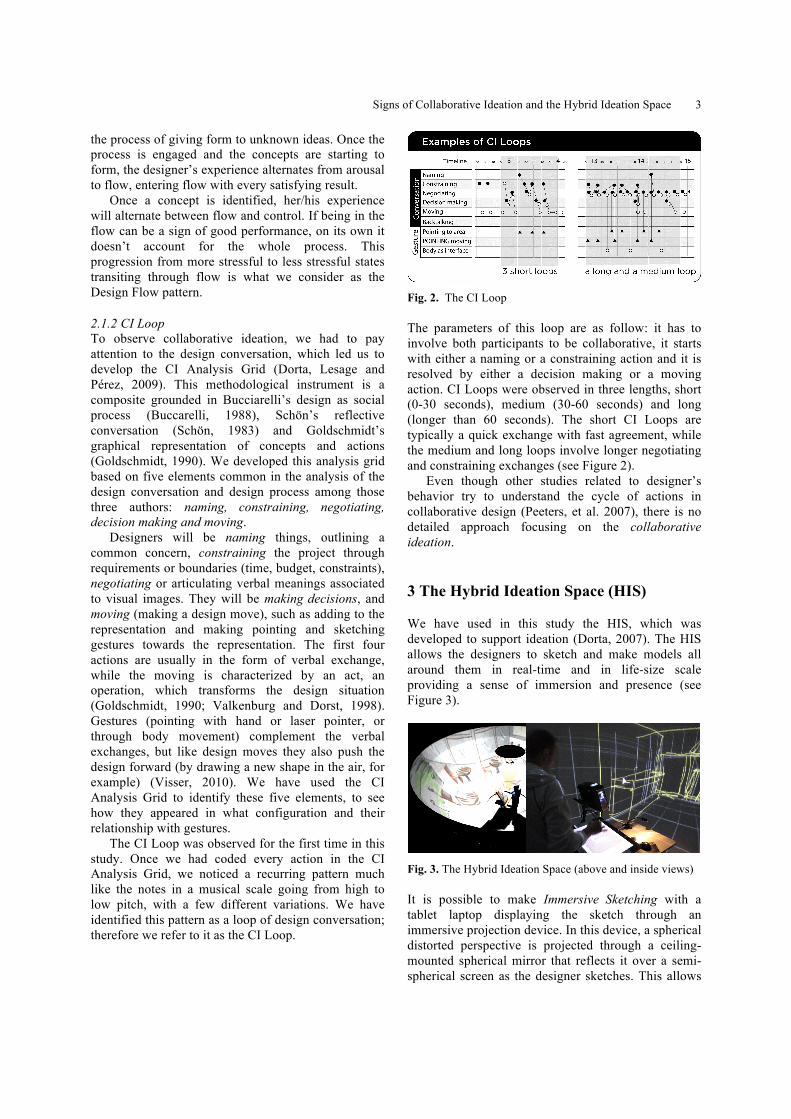
The CI Loop was observed for the first time in this study. Once we had coded every action in the CI Analysis Grid, we noticed a recurring pattern much like the notes in a musical scale going from high to low pitch, with a few different variations. We have identified this pattern as a loop of design conversation; therefore we refer to it as the CI Loop.
Fig. 2. The CI Loop
The parameters of this loop are as follow: it has to involve both participants to be collaborative, it starts with either a naming or a constraining action and it is resolved by either a decision making or a moving action. CI Loops were observed in three lengths, short (0-30 seconds), medium (30-60 seconds) and long (longer than 60 seconds). The short CI Loops are typically a quick exchange with fast agreement, while the medium and long loops involve longer negotiating and constraining exchanges (see Figure 2).
Even though other studies related to designer’s behavior try to understand the cycle of actions in collaborative design (Peeters, et al. 2007), there is no detailed approach focusing on the collaborative ideation.
3 The Hybrid Ideation Space (HIS)
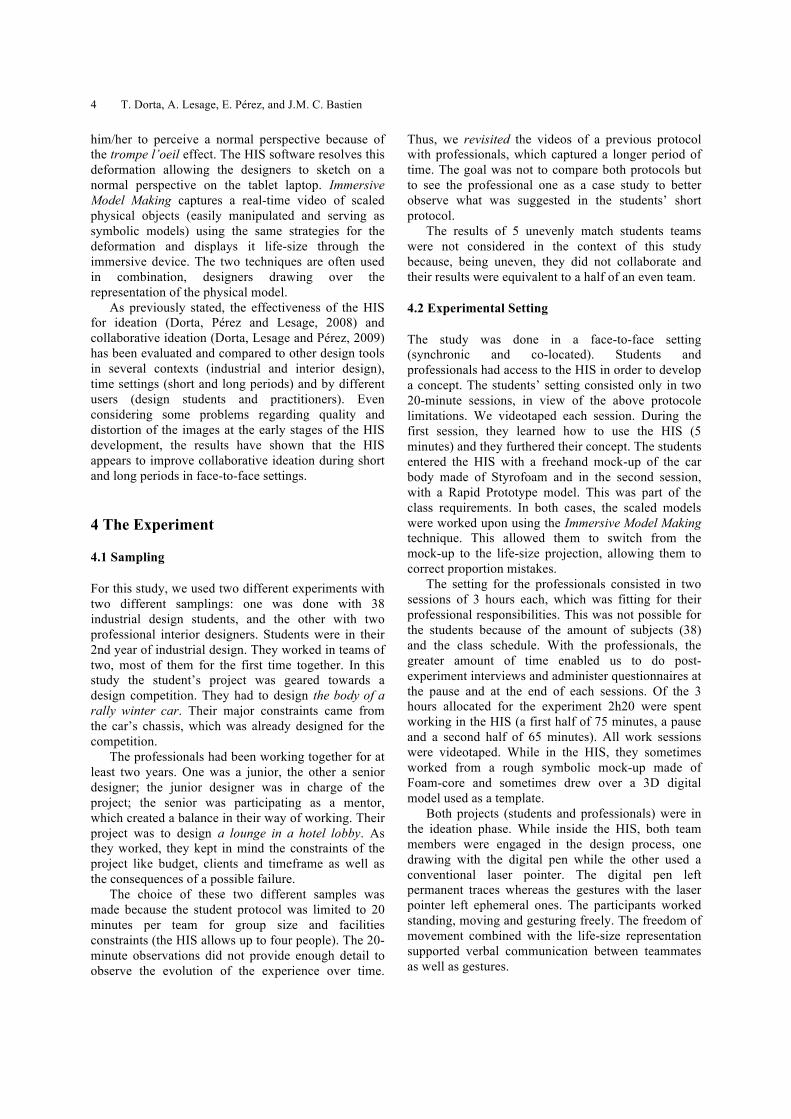
We have used in this study the HIS, which was developed to support ideation (Dorta, 2007). The HIS allows the designers to sketch and make models all around them in real-time and in life-size scale providing a sense of immersion and presence (see Figure 3).
Fig. 3. The Hybrid Ideation Space (above and inside views)
It is possible to make Immersive Sketching with a tablet laptop displaying the sketch through an immersive projection device. In this device, a spherical distorted perspective is projected through a ceiling-mounted spherical mirror that reflects it over a semi-spherical screen as the designer sketches. This allows
4 T. Dorta, A. Lesage, E. Pérez, and J.M. C. Bastien
him/her to perceive a normal perspective because of the trompe l’oeil effect. The HIS software resolves this deformation allowing the designers to sketch on a normal perspective on the tablet laptop. Immersive Model Making captures a real-time video of scaled physical objects (easily manipulated and serving as symbolic models) using the same strategies for the deformation and displays it life-size through the immersive device. The two techniques are often used in combination, designers drawing over the representation of the physical model.
As previously stated, the effectiveness of the HIS for ideation (Dorta, Pérez and Lesage, 2008) and collaborative ideation (Dorta, Lesage and Pérez, 2009) has been evaluated and compared to other design tools in several contexts (industrial and interior design), time settings (short and long periods) and by different users (design students and practitioners). Even considering some problems regarding quality and distortion of the images at the early stages of the HIS development, the results have shown that the HIS appears to improve collaborative ideation during short and long periods in face-to-face settings.
4 The Experiment
4.1 Sampling
For this study, we used two different experiments with two different samplings: one was done with 38 industrial design students, and the other with two professional interior designers. Students were in their 2nd year of industrial design. They worked in teams of two, most of them for the first time together. In this study the student’s project was geared towards a design competition. They had to design the body of a rally winter car. Their major constraints came from the car’s chassis, which was already designed for the competition.
The professionals had been working together for at least two years. One was a junior, the other a senior designer; the junior designer was in charge of the project; the senior was participating as a mentor, which created a balance in their way of working. Their project was to design a lounge in a hotel lobby. As they worked, they kept in mind the constraints of the project like budget, clients and timeframe as well as the consequences of a possible failure.
The choice of these two different samples was made because the student protocol was limited to 20 minutes per team for group size and facilities constraints (the HIS allows up to four people). The 20-minute observations did not provide enough detail to observe the evolution of the experience over time.
Thus, we revisited the videos of a previous protocol with professionals, which captured a longer period of time. The goal was not to compare both protocols but to see the professional one as a case study to better observe what was suggested in the students’ short protocol.
The results of 5 unevenly match students teams were not considered in the context of this study because, being uneven, they did not collaborate and their results were equivalent to a half of an even team.
4.2 Experimental Setting
The study was done in a face-to-face setting (synchronic and co-located). Students and professionals had access to the HIS in order to develop a concept. The students’ setting consisted only in two 20-minute sessions, in view of the above protocole limitations. We videotaped each session. During the first session, they learned how to use the HIS (5 minutes) and they furthered their concept. The students entered the HIS with a freehand mock-up of the car body made of Styrofoam and in the second session, with a Rapid Prototype model. This was part of the class requirements. In both cases, the scaled models were worked upon using the Immersive Model Making technique. This allowed them to switch from the mock-up to the life-size projection, allowing them to correct proportion mistakes.
The setting for the professionals consisted in two sessions of 3 hours each, which was fitting for their professional responsibilities. This was not possible for the students because of the amount of subjects (38) and the class schedule. With the professionals, the greater amount of time enabled us to do post-experiment interviews and administer questionnaires at the pause and at the end of each sessions. Of the 3 hours allocated for the experiment 2h20 were spent working in the HIS (a first half of 75 minutes, a pause and a second half of 65 minutes). All work sessions were videotaped. While in the HIS, they sometimes worked from a rough symbolic mock-up made of Foam-core and sometimes drew over a 3D digital model used as a template.
Both projects (students and professionals) were in the ideation phase. While inside the HIS, both team members were engaged in the design process, one drawing with the digital pen while the other used a conventional laser pointer. The digital pen left permanent traces whereas the gestures with the laser pointer left ephemeral ones. The participants worked standing, moving and gesturing freely. The freedom of movement combined with the life-size representation supported verbal communication between teammates as well as gestures.
Signs of Collaborative Ideation and the Hybrid Ideation Space 5
4.3 Data Collection Techniques
Different techniques were used in this study. Design Flow called for two techniques to capture the Flow and its neighbouring states: a simple questionnaire collecting the experienced states after each continuous work session, and the Experience Sampling Method (ESM) (Csikszentmihalyi and Larson, 1987) used during the professionals’ longer work sessions.
In the student protocol, once the 20-minute work session was over, the students had to individually identify their psychological states at the beginning, middle and end of this period. After every half-session, the professionals also identified retrospectively the dimensions of their experience.
Flow is a fleeting state. Since the professionals had longer work sessions in the HIS, we were able to collect data with the ESM. Every 10 min or so, while in session, participants were asked to call out their state. This allowed for in-the-moment experience sampling. We asked the participants to tell what their state was at a given moment because they were aware of how they were feeling. The participants were explained before hand what is the Flow and its seven related psychological state. All they had to do is identify with one of eight words how they felt. We are conscious that this interrupts the design process but reviewing the videos with the participants to get their states afterwards was not possible with these professional participants.
The CI Analysis Grid was used to code the data collected on the video recordings of the students’ and professionals’ work sessions. This Grid yielded two different sets of data: a CI Loop counts as well as a breakdown of the collaborative ideation actions that occurred during the CI Loops.
5 Results
5.1 Design Flow Pattern
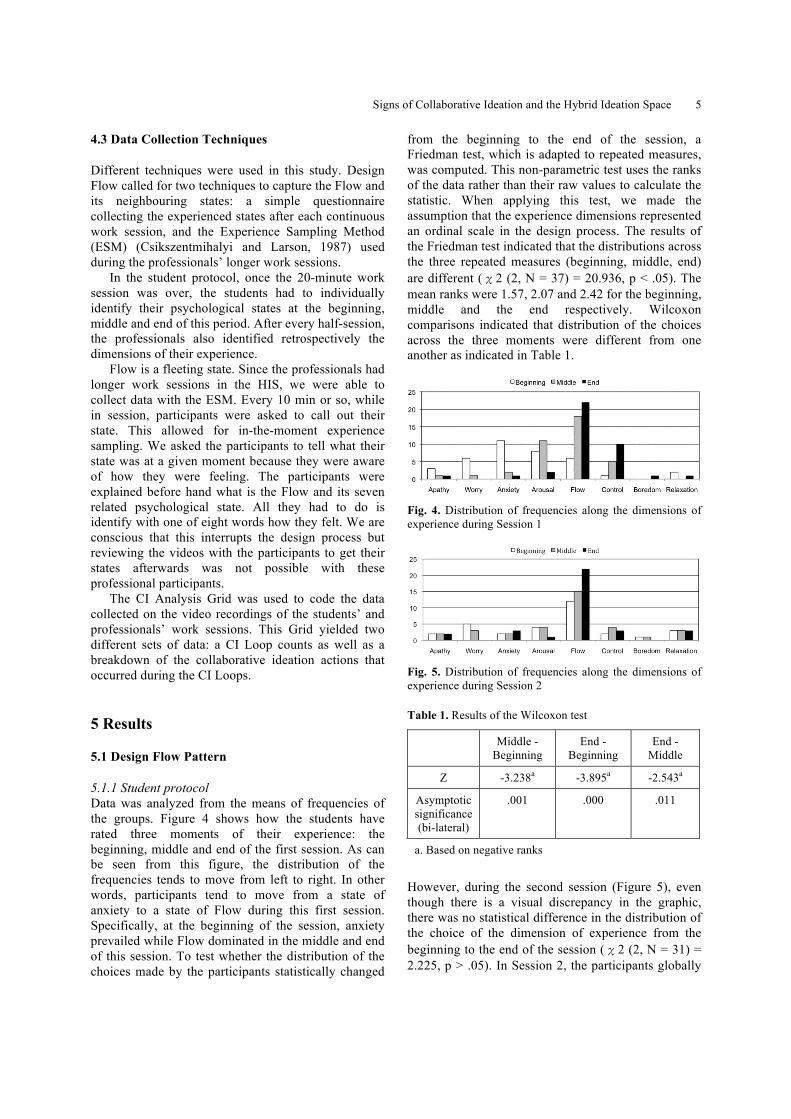
5.1.1 Student protocol Data was analyzed from the means of frequencies of the groups. Figure 4 shows how the students have rated three moments of their experience: the beginning, middle and end of the first session. As can be seen from this figure, the distribution of the frequencies tends to move from left to right. In other words, participants tend to move from a state of anxiety to a state of Flow during this first session. Specifically, at the beginning of the session, anxiety prevailed while Flow dominated in the middle and end of this session. To test whether the distribution of the choices made by the participants statistically changed
from the beginning to the end of the session, a Friedman test, which is adapted to repeated measures, was computed. This non-parametric test uses the ranks of the data rather than their raw values to calculate the statistic. When applying this test, we made the assumption that the experience dimensions represented an ordinal scale in the design process. The results of the Friedman test indicated that the distributions across the three repeated measures (beginning, middle, end) are different (χ2 (2, N = 37) = 20.936, p < .05). The mean ranks were 1.57, 2.07 and 2.42 for the beginning, middle and the end respectively. Wilcoxon comparisons indicated that distribution of the choices across the three moments were different from one another as indicated in Table 1.
Fig. 4. Distribution of frequencies along the dimensions of experience during Session 1
Fig. 5. Distribution of frequencies along the dimensions of experience during Session 2
Table 1. Results of the Wilcoxon test
Middle - Beginning
End - Beginning
End -Middle
Z -3.238a -3.895a -2.543a
Asymptotic significance (bi-lateral)
.001 .000 .011
a. Based on negative ranks
However, during the second session (Figure 5), even though there is a visual discrepancy in the graphic, there was no statistical difference in the distribution of the choice of the dimension of experience from the beginning to the end of the session (χ2 (2, N = 31) = 2.225, p > .05). In Session 2, the participants globally
6 T. Dorta, A. Lesage, E. Pérez, and J.M. C. Bastien
stay in the Flow state probably because their design concept had been previously identified.
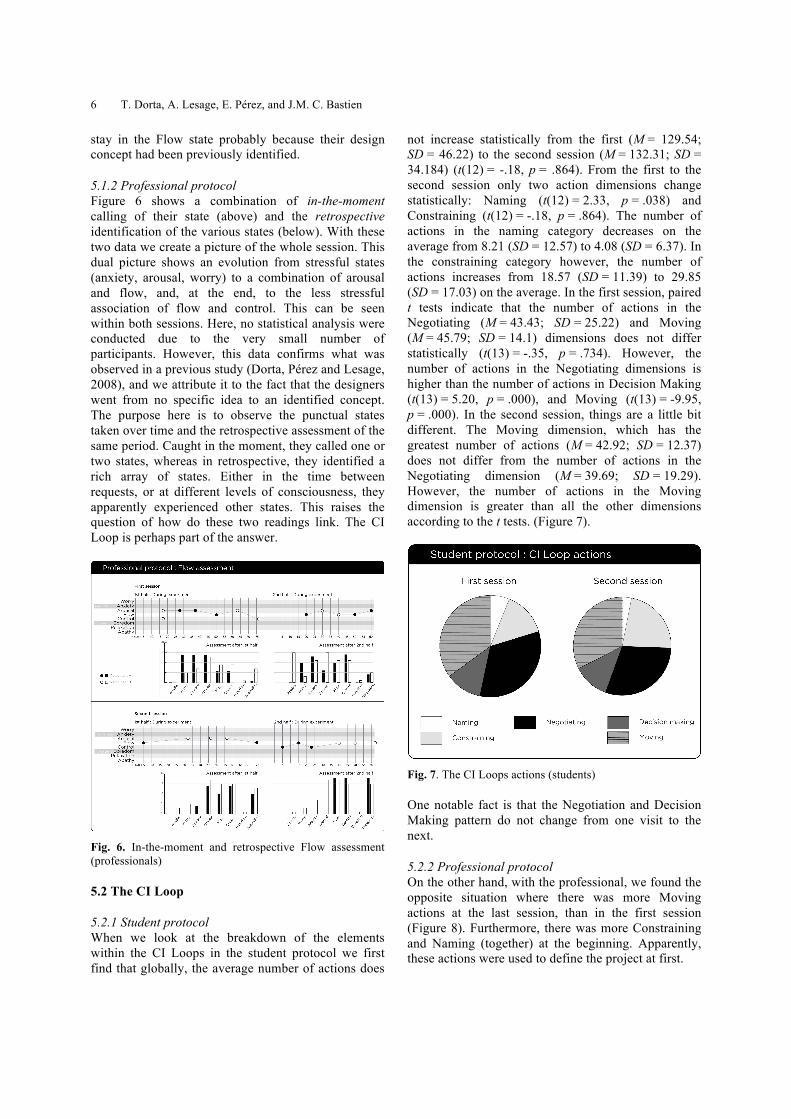
5.1.2 Professional protocol Figure 6 shows a combination of in-the-moment calling of their state (above) and the retrospective identification of the various states (below). With these two data we create a picture of the whole session. This dual picture shows an evolution from stressful states (anxiety, arousal, worry) to a combination of arousal and flow, and, at the end, to the less stressful association of flow and control. This can be seen within both sessions. Here, no statistical analysis were conducted due to the very small number of participants. However, this data confirms what was observed in a previous study (Dorta, Pérez and Lesage, 2008), and we attribute it to the fact that the designers went from no specific idea to an identified concept. The purpose here is to observe the punctual states taken over time and the retrospective assessment of the same period. Caught in the moment, they called one or two states, whereas in retrospective, they identified a rich array of states. Either in the time between requests, or at different levels of consciousness, they apparently experienced other states. This raises the question of how do these two readings link. The CI Loop is perhaps part of the answer.
Fig. 6. In-the-moment and retrospective Flow assessment (professionals)
5.2 The CI Loop
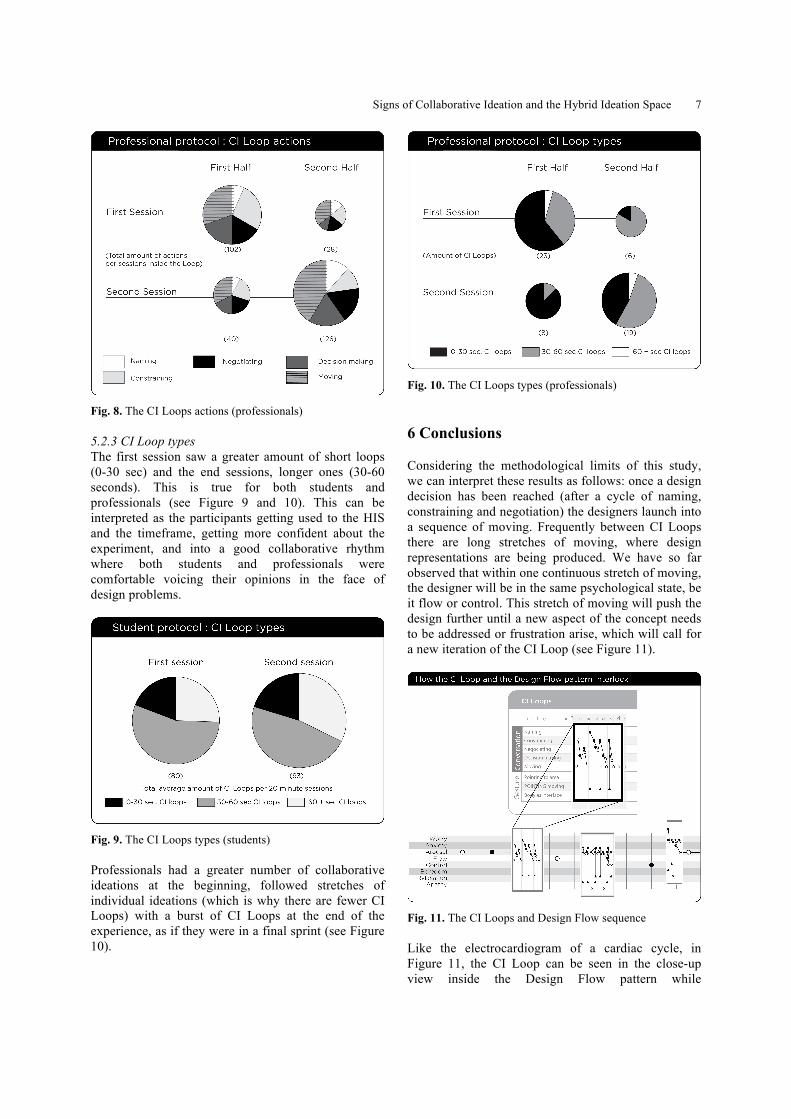
5.2.1 Student protocol When we look at the breakdown of the elements within the CI Loops in the student protocol we first find that globally, the average number of actions does
not increase statistically from the first (M = 129.54; SD = 46.22) to the second session (M = 132.31; SD = 34.184) (t(12) = -.18, p = .864). From the first to the second session only two action dimensions change statistically: Naming (t(12) = 2.33, p = .038) and Constraining (t(12) = -.18, p = .864). The number of actions in the naming category decreases on the average from 8.21 (SD = 12.57) to 4.08 (SD = 6.37). In the constraining category however, the number of actions increases from 18.57 (SD = 11.39) to 29.85 (SD = 17.03) on the average. In the first session, paired t tests indicate that the number of actions in the Negotiating (M = 43.43; SD = 25.22) and Moving (M = 45.79; SD = 14.1) dimensions does not differ statistically (t(13) = -.35, p = .734). However, the number of actions in the Negotiating dimensions is higher than the number of actions in Decision Making (t(13) = 5.20, p = .000), and Moving (t(13) = -9.95, p = .000). In the second session, things are a little bit different. The Moving dimension, which has the greatest number of actions (M = 42.92; SD = 12.37) does not differ from the number of actions in the Negotiating dimension (M = 39.69; SD = 19.29). However, the number of actions in the Moving dimension is greater than all the other dimensions according to the t tests. (Figure 7).
Fig. 7. The CI Loops actions (students)
One notable fact is that the Negotiation and Decision Making pattern do not change from one visit to the next.
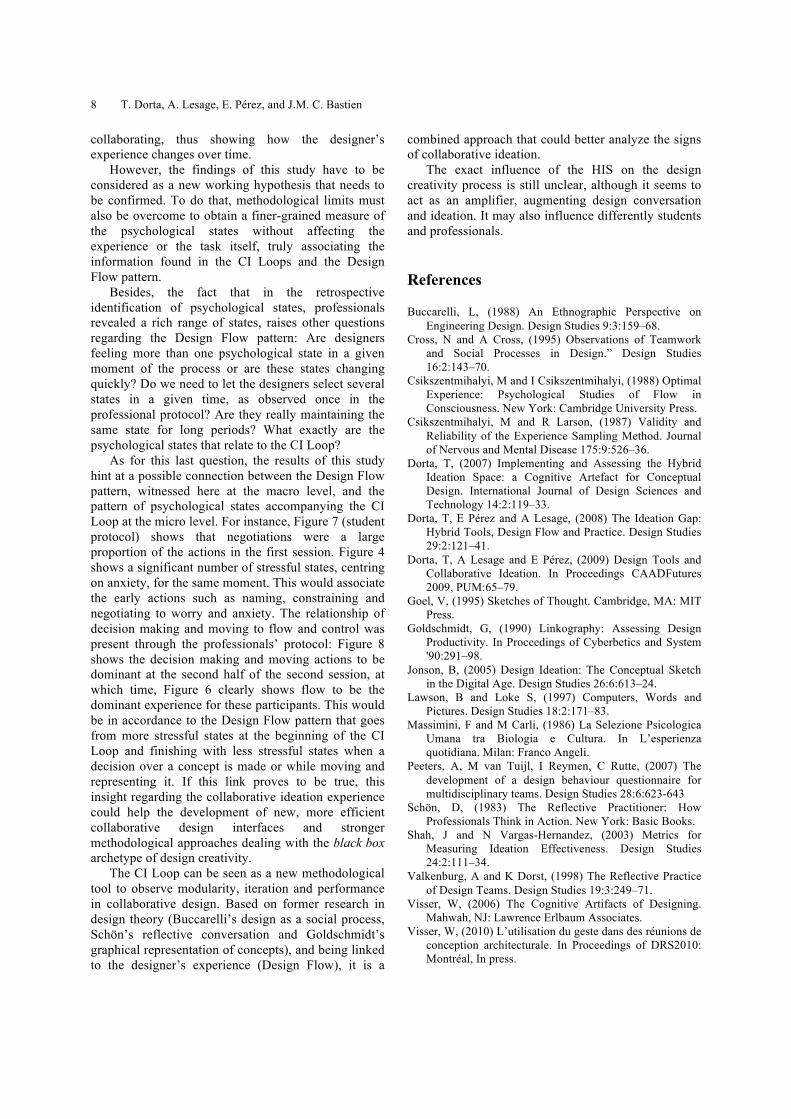
5.2.2 Professional protocol On the other hand, with the professional, we found the opposite situation where there was more Moving actions at the last session, than in the first session (Figure 8). Furthermore, there was more Constraining and Naming (together) at the beginning. Apparently, these actions were used to define the project at first.
Signs of Collaborative Ideation and the Hybrid Ideation Space 7
Fig. 8. The CI Loops actions (professionals)
5.2.3 CI Loop types The first session saw a greater amount of short loops (0-30 sec) and the end sessions, longer ones (30-60 seconds). This is true for both students and professionals (see Figure 9 and 10). This can be interpreted as the participants getting used to the HIS and the timeframe, getting more confident about the experiment, and into a good collaborative rhythm where both students and professionals were comfortable voicing their opinions in the face of design problems.
Fig. 9. The CI Loops types (students)
Professionals had a greater number of collaborative ideations at the beginning, followed stretches of individual ideations (which is why there are fewer CI Loops) with a burst of CI Loops at the end of the experience, as if they were in a final sprint (see Figure 10).
Fig. 10. The CI Loops types (professionals)
6 Conclusions
Considering the methodological limits of this study, we can interpret these results as follows: once a design decision has been reached (after a cycle of naming, constraining and negotiation) the designers launch into a sequence of moving. Frequently between CI Loops there are long stretches of moving, where design representations are being produced. We have so far observed that within one continuous stretch of moving, the designer will be in the same psychological state, be it flow or control. This stretch of moving will push the design further until a new aspect of the concept needs to be addressed or frustration arise, which will call for a new iteration of the CI Loop (see Figure 11).
Fig. 11. The CI Loops and Design Flow sequence
Like the electrocardiogram of a cardiac cycle, in Figure 11, the CI Loop can be seen in the close-up view inside the Design Flow pattern while
8 T. Dorta, A. Lesage, E. Pérez, and J.M. C. Bastien
collaborating, thus showing how the designer’s experience changes over time.
However, the findings of this study have to be considered as a new working hypothesis that needs to be confirmed. To do that, methodological limits must also be overcome to obtain a finer-grained measure of the psychological states without affecting the experience or the task itself, truly associating the information found in the CI Loops and the Design Flow pattern.
Besides, the fact that in the retrospective identification of psychological states, professionals revealed a rich range of states, raises other questions regarding the Design Flow pattern: Are designers feeling more than one psychological state in a given moment of the process or are these states changing quickly? Do we need to let the designers select several states in a given time, as observed once in the professional protocol? Are they really maintaining the same state for long periods? What exactly are the psychological states that relate to the CI Loop?
As for this last question, the results of this study hint at a possible connection between the Design Flow pattern, witnessed here at the macro level, and the pattern of psychological states accompanying the CI Loop at the micro level. For instance, Figure 7 (student protocol) shows that negotiations were a large proportion of the actions in the first session. Figure 4 shows a significant number of stressful states, centring on anxiety, for the same moment. This would associate the early actions such as naming, constraining and negotiating to worry and anxiety. The relationship of decision making and moving to flow and control was present through the professionals’ protocol: Figure 8 shows the decision making and moving actions to be dominant at the second half of the second session, at which time, Figure 6 clearly shows flow to be the dominant experience for these participants. This would be in accordance to the Design Flow pattern that goes from more stressful states at the beginning of the CI Loop and finishing with less stressful states when a decision over a concept is made or while moving and representing it. If this link proves to be true, this insight regarding the collaborative ideation experience could help the development of new, more efficient collaborative design interfaces and stronger methodological approaches dealing with the black box archetype of design creativity.
The CI Loop can be seen as a new methodological tool to observe modularity, iteration and performance in collaborative design. Based on former research in design theory (Buccarelli’s design as a social process, Schön’s reflective conversation and Goldschmidt’s graphical representation of concepts), and being linked to the designer’s experience (Design Flow), it is a
combined approach that could better analyze the signs of collaborative ideation.
The exact influence of the HIS on the design creativity process is still unclear, although it seems to act as an amplifier, augmenting design conversation and ideation. It may also influence differently students and professionals.
References
Buccarelli, L, (1988) An Ethnographic Perspective on Engineering Design. Design Studies 9:3:159–68.
Cross, N and A Cross, (1995) Observations of Teamwork and Social Processes in Design.” Design Studies 16:2:143–70.
Csikszentmihalyi, M and I Csikszentmihalyi, (1988) Optimal Experience: Psychological Studies of Flow in Consciousness. New York: Cambridge University Press.
Csikszentmihalyi, M and R Larson, (1987) Validity and Reliability of the Experience Sampling Method. Journal of Nervous and Mental Disease 175:9:526–36.
Dorta, T, (2007) Implementing and Assessing the Hybrid Ideation Space: a Cognitive Artefact for Conceptual Design. International Journal of Design Sciences and Technology 14:2:119–33.
Dorta, T, E Pérez and A Lesage, (2008) The Ideation Gap: Hybrid Tools, Design Flow and Practice. Design Studies 29:2:121–41.
Dorta, T, A Lesage and E Pérez, (2009) Design Tools and Collaborative Ideation. In Proceedings CAADFutures 2009, PUM:65–79.
Goel, V, (1995) Sketches of Thought. Cambridge, MA: MIT Press.
Goldschmidt, G, (1990) Linkography: Assessing Design Productivity. In Proceedings of Cyberbetics and System '90:291–98.
Jonson, B, (2005) Design Ideation: The Conceptual Sketch in the Digital Age. Design Studies 26:6:613–24.
Lawson, B and Loke S, (1997) Computers, Words and Pictures. Design Studies 18:2:171–83.
Massimini, F and M Carli, (1986) La Selezione Psicologica Umana tra Biologia e Cultura. In L’esperienza quotidiana. Milan: Franco Angeli.
Peeters, A, M van Tuijl, I Reymen, C Rutte, (2007) The development of a design behaviour questionnaire for multidisciplinary teams. Design Studies 28:6:623-643
Schön, D, (1983) The Reflective Practitioner: How Professionals Think in Action. New York: Basic Books.
Shah, J and N Vargas-Hernandez, (2003) Metrics for Measuring Ideation Effectiveness. Design Studies 24:2:111–34.
Valkenburg, A and K Dorst, (1998) The Reflective Practice of Design Teams. Design Studies 19:3:249–71.
Visser, W, (2006) The Cognitive Artifacts of Designing. Mahwah, NJ: Lawrence Erlbaum Associates.
Visser, W, (2010) L’utilisation du geste dans des réunions de conception architecturale. In Proceedings of DRS2010: Montréal, In press.