signature recognition dr. marina gavrilova. topics definitions feature extraction signature forgery...
TRANSCRIPT
Signature recognition
Dr. Marina Gavrilova
Topics
Definitions Feature extraction Signature Forgery Signature models Advantages and disadvantages of
signature as biometrics
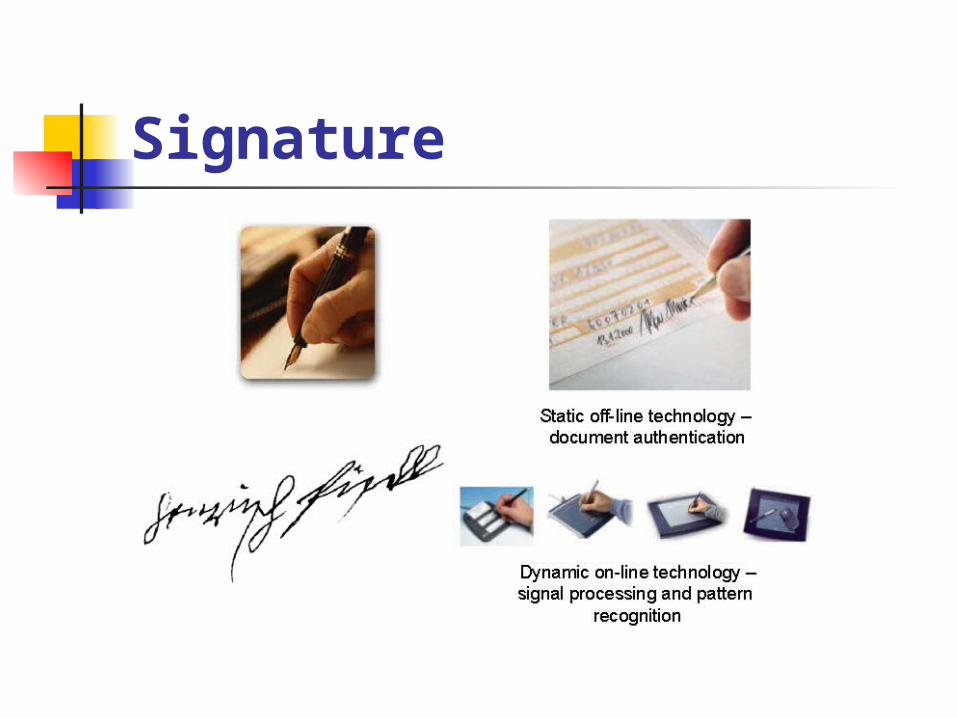
Signature
Signatures Off-line or static signatures are scanned from
paper documents, where they were written in conventional way. Off-line signature analysis can be carried out with a scanned image of the signature using a standard camera or scanner.
On-line or dynamic signatures are written with an electronically instrumented device and the dynamic information (pen tip location through time) is usually available at high resolution, even when the pen is not in contact with the paper.
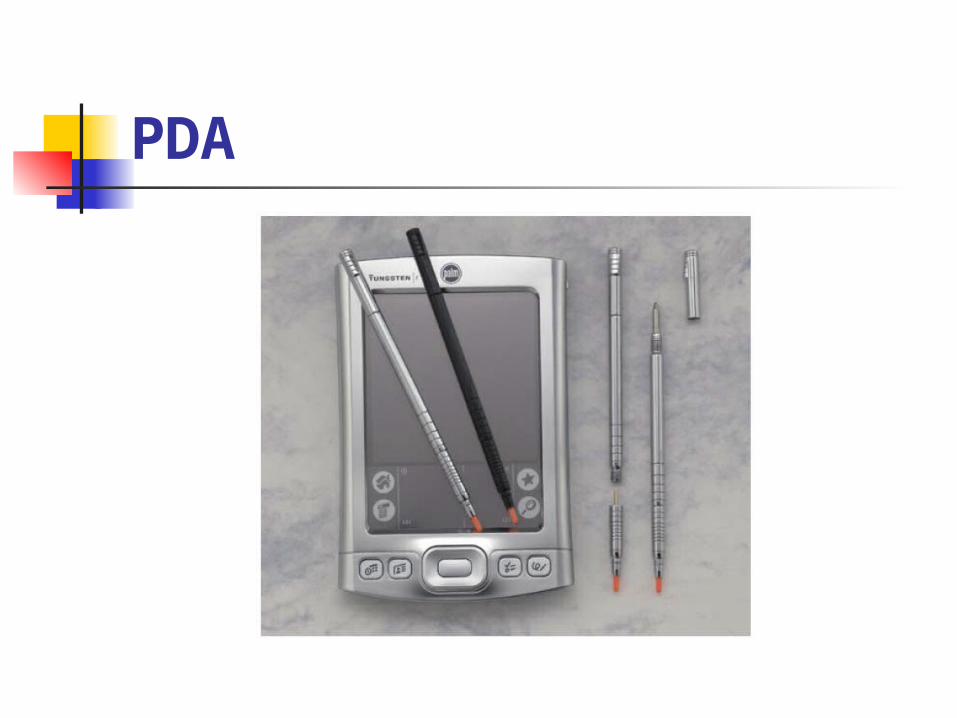
PDA

Super PDA
The Delivery Information Acquisition Device-that Brown tablet you sign when receiving a package -is one hell of a PDA. The fourth version can handle personal (Bluetooth), local (802.11b), and wide (GPRS or CDMA) area wireless networking. It also has a dialup modem, an infrared scanner, GPS capability, 128 Mbytes of RAM, and a color screen. All UPS drivers carry the device for capturing and transmitting parcel pickup and delivery data.
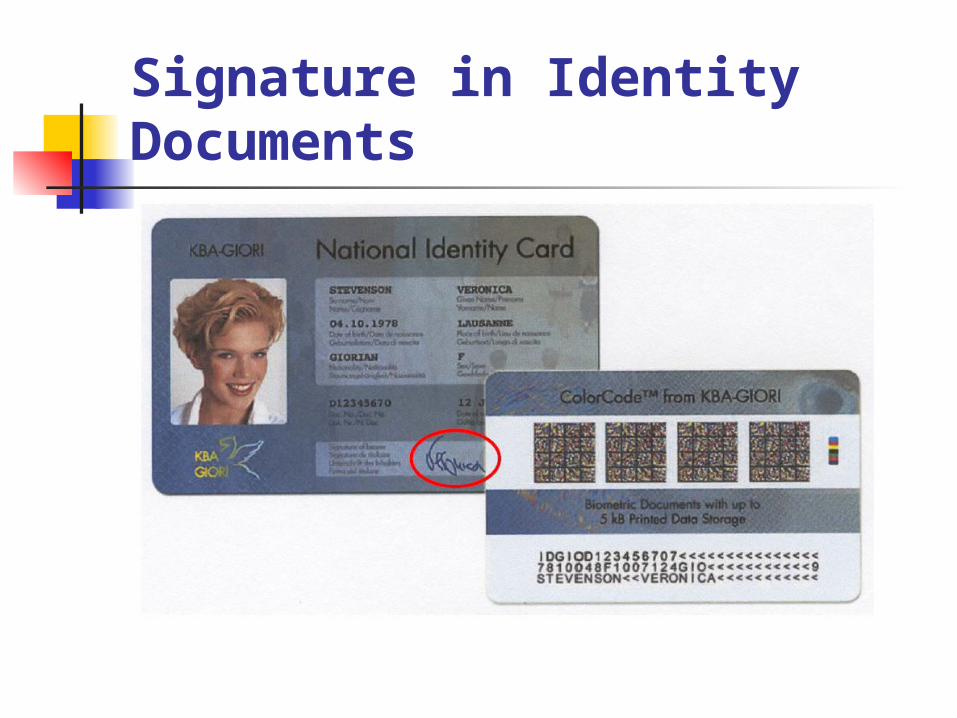
Signature in Identity Documents

Digitizing Tablet

Pen-Tablet System (WACOM)

Pen-Tablet System –How It Works? The WACOM stylus looks and feels like a pen yet contains no
batteries or magnets. Instead it takes advantage of electro-magnetic resonance technology in which radio waves are sent to the stylus and returned for position analysis.
In operation, a grid of wires below the screen alternates between transmit and receive modes (about every 20μs):
In transmit mode, the electro-magnetic signal stimulates ascillation in the coil-and capacitor resonant circuit in the pen
In receive mode, the energy of the resonant circuit oscillation in the pen is detected by the antenna grid. This is then analysed to determine position and other information including pressure
Since the grid provides the power to the pen through resonant coupling, no batteries are required. Thus there are no consumables that will run down and need to be replaced or that would make the pen top-heavy.

Automatic identification Traditional means of automatic identification:
Possession-based (credit card, smart card) Use “something that you have”
Knowledge-based (password, PIN) Use “something that you know”
Biometrics-based (biometric identifier) Use something that relies on “what you are”
Signature is inherently a combination of knowledge and biometric, the knowledge component (what is written and how it is written) can be chosen, and indeed changed, by the user
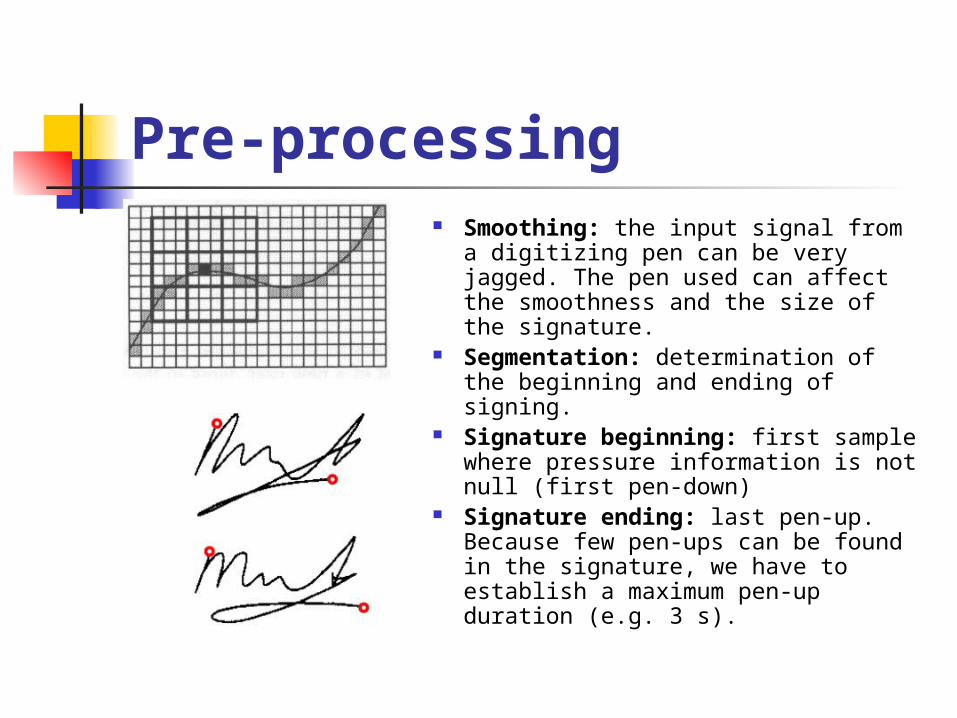
Pre-processing Smoothing: the input signal from a
digitizing pen can be very jagged. The pen used can affect the smoothness and the size of the signature.
Segmentation: determination of the beginning and ending of signing.
Signature beginning: first sample where pressure information is not null (first pen-down)
Signature ending: last pen-up. Because few pen-ups can be found in the signature, we have to establish a maximum pen-up duration (e.g. 3 s).

Pre-processing
Initial point alignment: all the signatures have to be aligned with respect to the initial point (e.g. the coordinate origin) to make information independent from the position on the tablet.
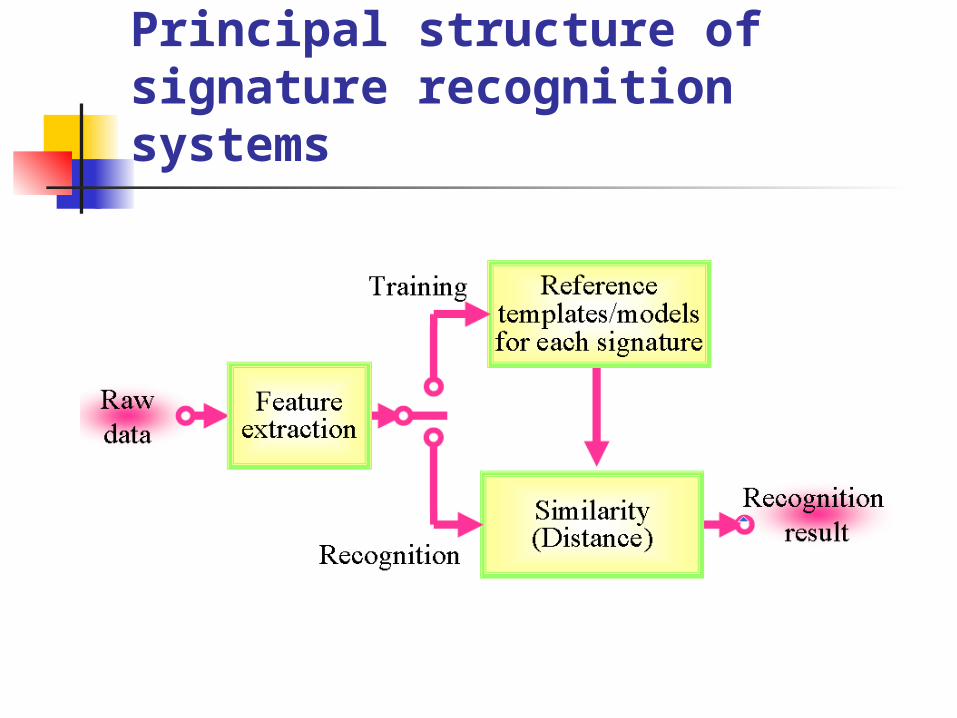
Principal structure of signature recognition systems

Dynamic Signature
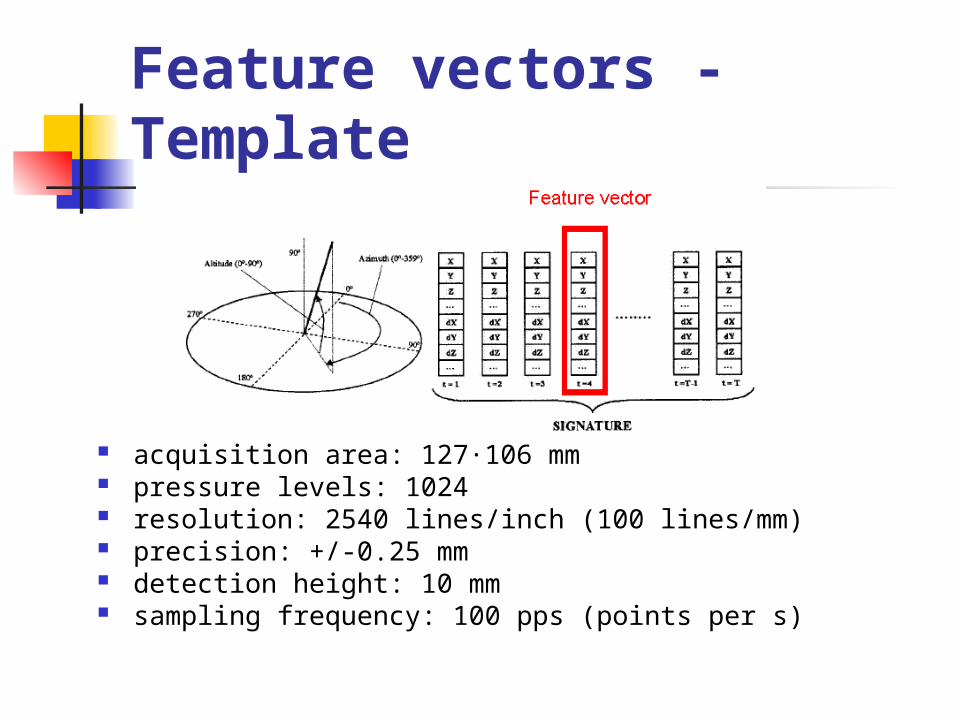
Feature vectors -Template
acquisition area: 127·106 mm pressure levels: 1024 resolution: 2540 lines/inch (100 lines/mm) precision: +/-0.25 mm detection height: 10 mm sampling frequency: 100 pps (points per s)

Local and Global Features Local features
x, y coordinates Velocity (v) Acceleration (A) Trajectory angle (Θ) Azimuth Elevation First derivative of feature (Δ) Second derivative of feature (ΔΔ)
Local and Global Features Global features
Signature length, height, weight Total signature time Total pen-down time Total pen-up time Average velocity Maximum velocity Minimum velocity –etc,.
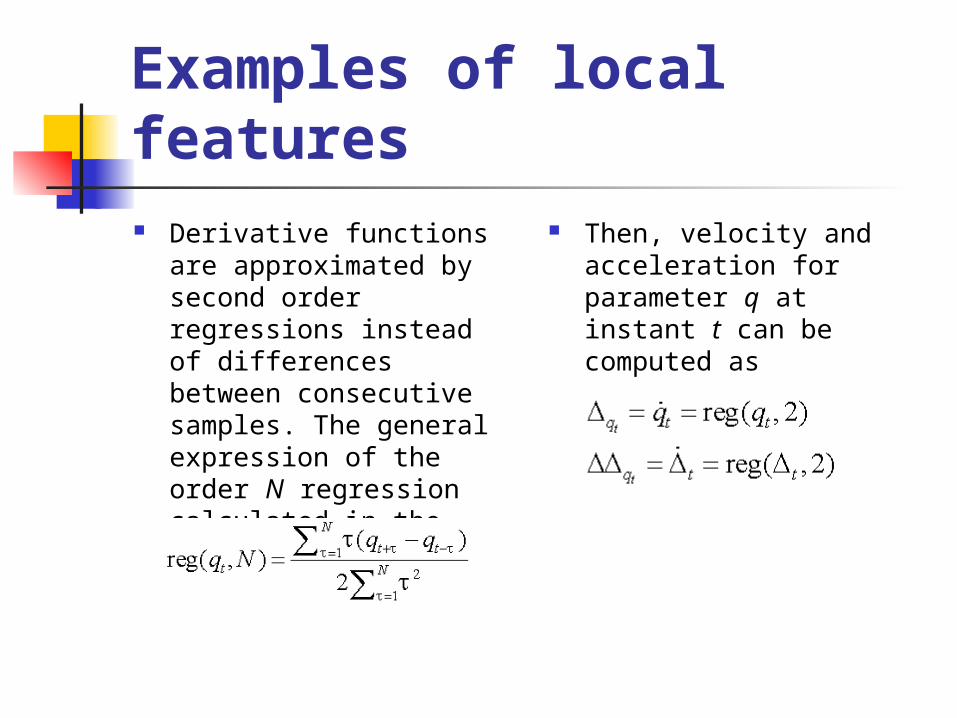
Examples of local features Derivative functions are
approximated by second order regressions instead of differences between consecutive samples. The general expression of the order N regression calculated in the instant t for parameter q is:
Then, velocity and acceleration for parameter q at instant t can be computed as
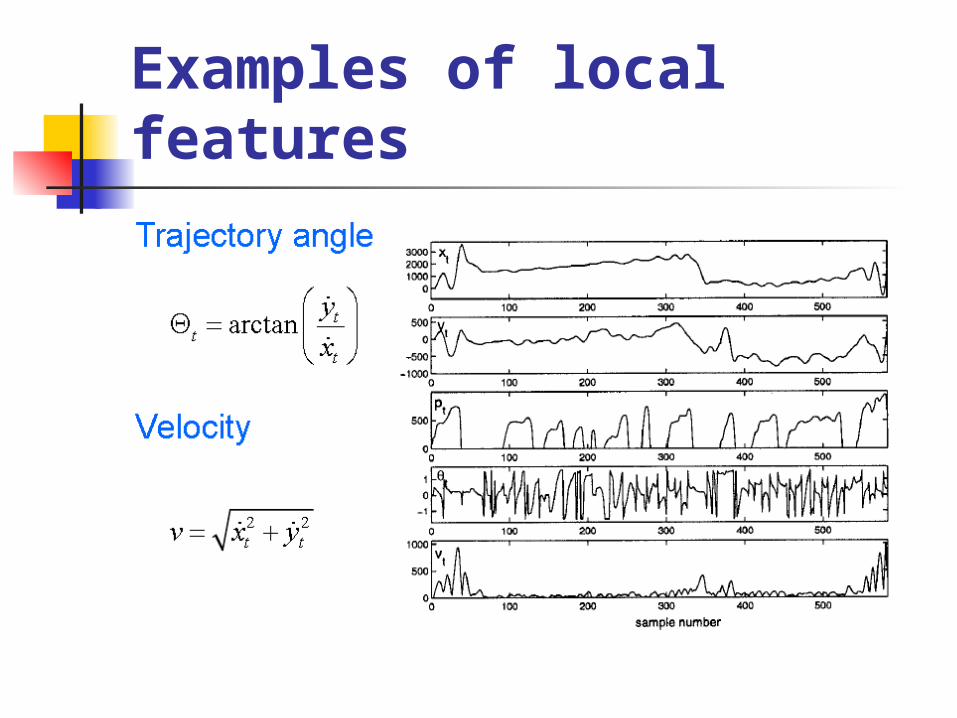
Examples of local features
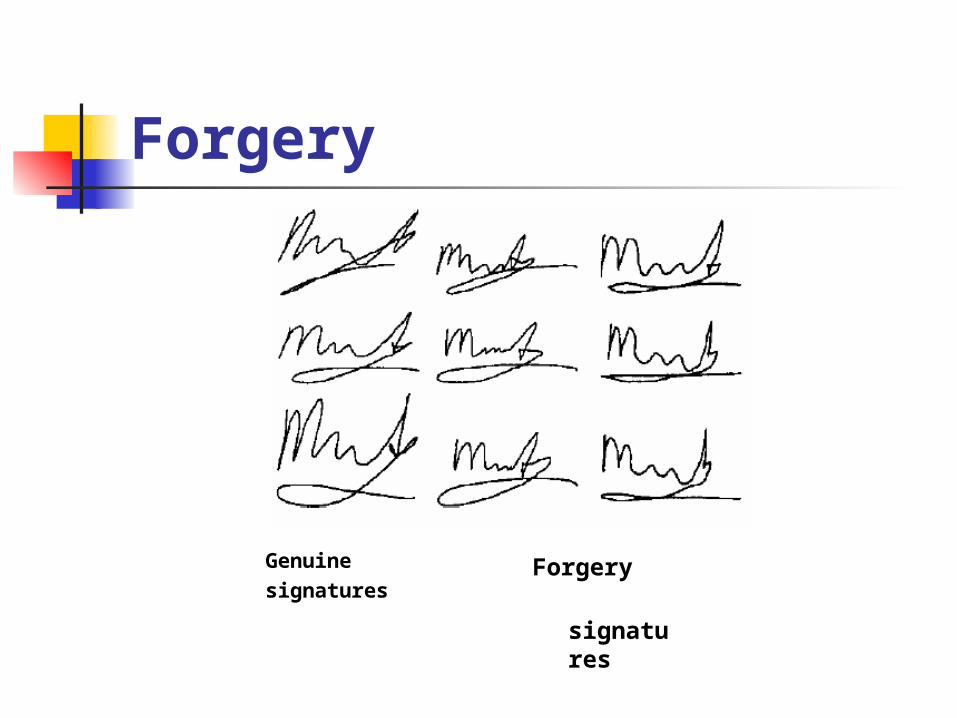
Forgery
Genuine signatures
Forgery
signatures
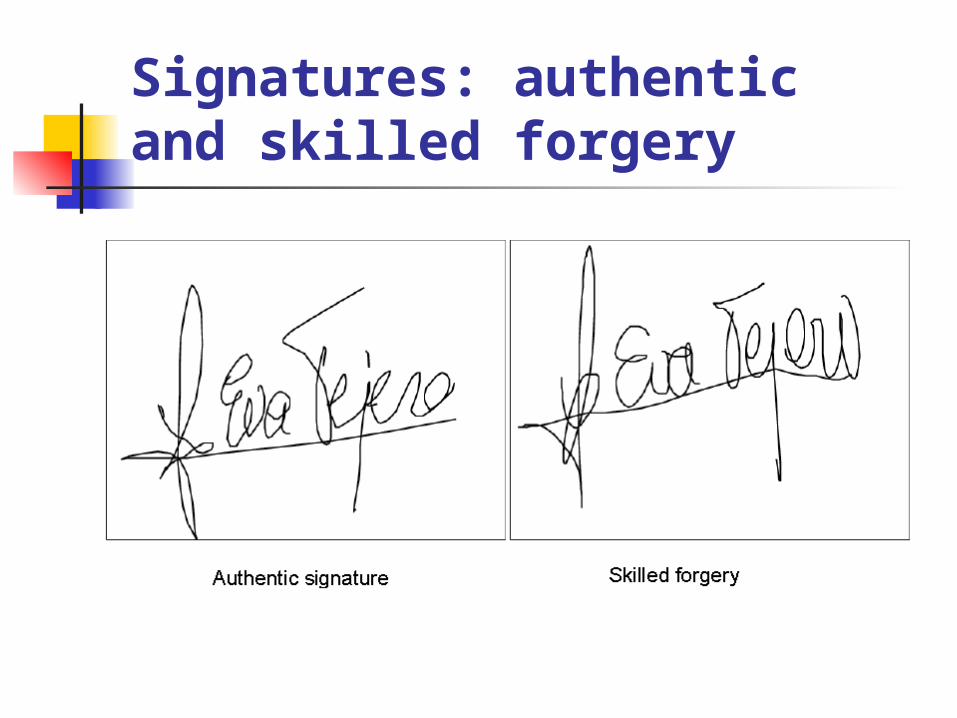
Signatures: authentic and skilled forgery
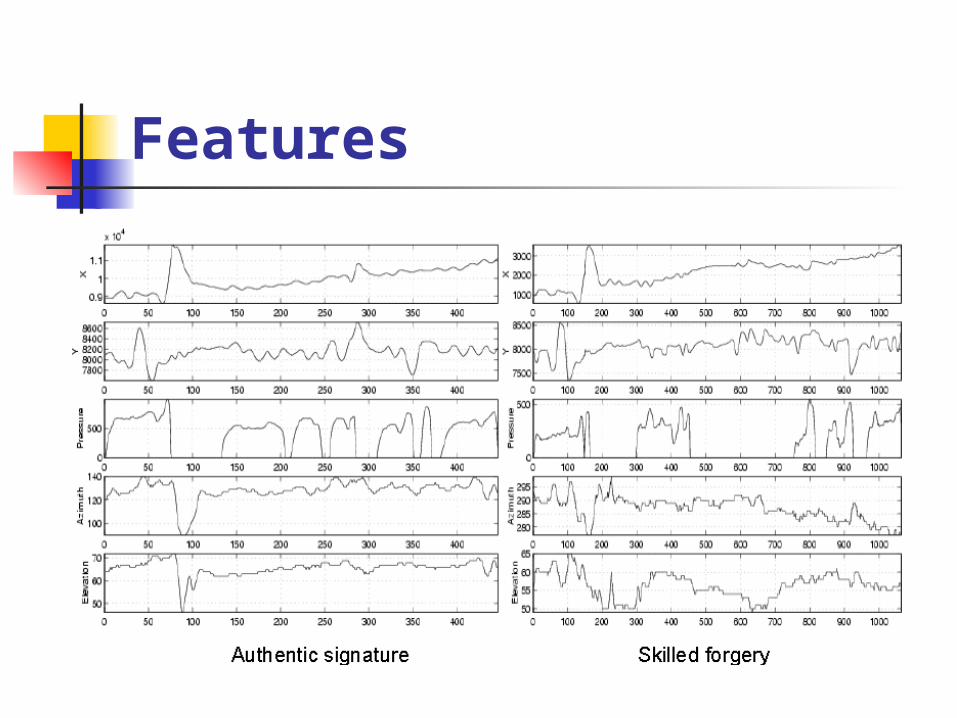
Features
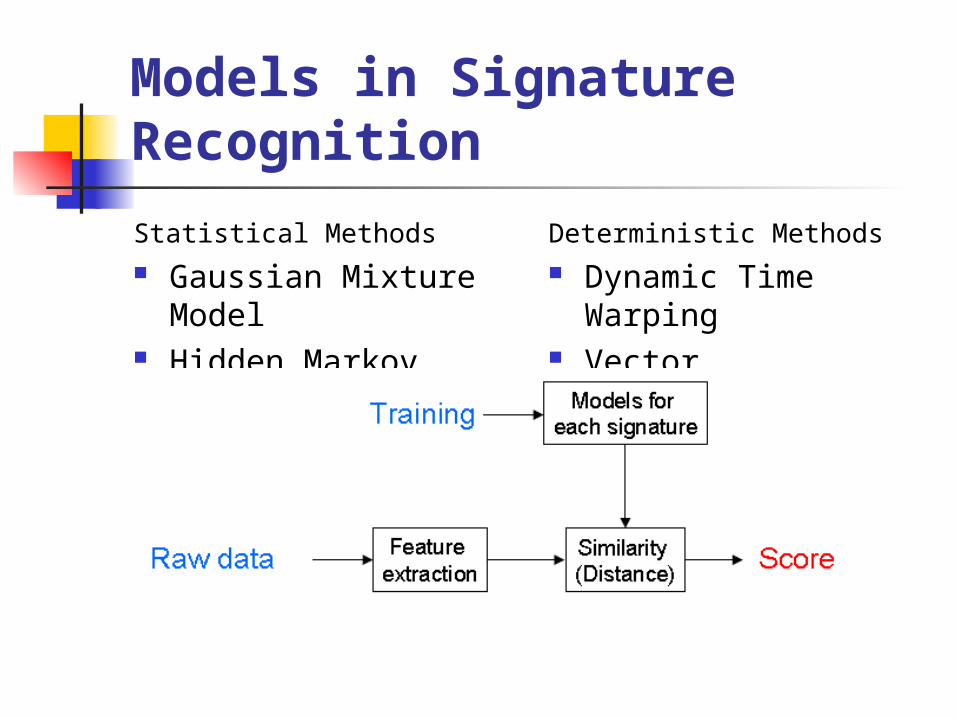
Models in Signature Recognition
Statistical Methods Gaussian Mixture
Model Hidden Markov
Model
Deterministic Methods Dynamic Time
Warping Vector Quantization

Gaussian Mixture Model (GMM)
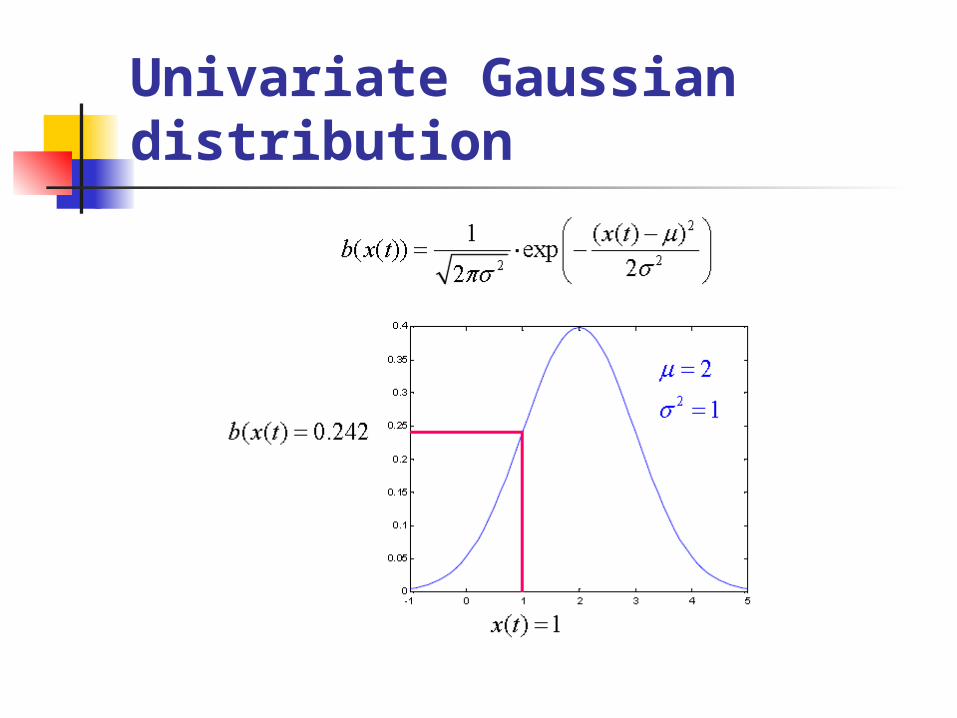
Univariate Gaussian distribution

Signature Recognition Advantages Signature is a man-made biometric where
forgery has been studied extensively Enrollment (training) is intuitive and fast Signature verification in general has a fast
response and low storage requirements A signature verification is “independent” of
the native language user Very high compression rates do not affect
shape of the signature (100-150 bytes)
Signature Recognition Disadvantages
There is much precedence for using signature to authenticate documents and not for security applications
A five-dimensional pen may be needed to arrive at the desired accuracy. This makes the hardware costly.
Some people have palsies, while others do not have enough fine motor coordination to write consistently
Voice recognition
Dr. Marina Gavrilova
Topics
Definitions Feature extraction Speaker verification methodology Advantages and disadvantages of
voice as biometrics
Early automatic speaker verification and identification in 1960s: the emergence of various pattern recognition techniques statistical methods exploration of features and feature selection methods.
However, theories were not well supported byexperimental evidence and the selected features were insufficient
With advent of more powerful computer resources and larger and better annotated devices such as the Switchboard Corpus (UK) there has been steady progress over the years, using more sophisticated statistical models and training methods.
Introduction

The problem of speaker verification is that of recognizing the
identity of speakers from their voices. The basic assumption is that the voice production
apparatus singularly characterizes the acoustic waves and emanations that we interpret as words and sounds with the identity of the speaker.
In order to establish an identity from these acoustic events, we need a model that characterizes a speaker's voice.
We next verify an utterance from an enrolled or target speaker (a speaker for which we have training data) by evaluating speech with the speaker model.
If the collected speech data fits the model, then we will affirm the speech as having come from our enrollee or, if not, reject the claim.
Speaker Verification Problem
The choice for the representation of speech defines a feature space.The training data fills up the feature space with feature vectors. When we are given a speech utterance that is asserted to be from a
particular enrolled speaker, the question becomes that of determining whether the collection of features generated by the utterance in question "matches" the training data.
The speaker verification problem can be formulated as one in which
weask either: 1. The test data matches the training data from the target speaker 2. The test data more closely matches the data from other speakers
Speaker Verification Problem
The theoretical justification is a consequence of Bayes' Theorem.That is, if we want to determine whether our observation x wasgenerated by target speaker T, we need to compute P(T|x), theprobability of speaker T having produced the utterance thatgenerated the observed features x. From Bayes' Theorem, we canwrite
pP(T|x) = PT(x)P(T) / p(x)
Where PT(x) is the probability of observing features x given usingthe model for speaker T, P(T) is the prior probability that speaker Thas spoken, and p(x) is the probability of observing features xirrespective of who was speaking.
Speaker Verification Methods
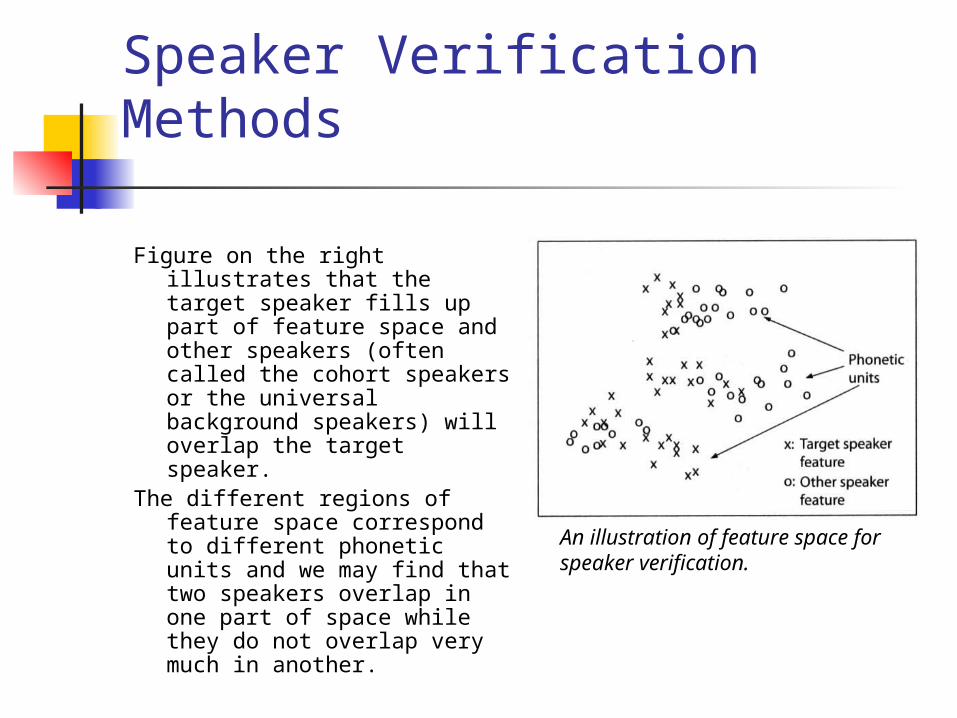
Figure on the right illustrates that the target speaker fills up part of feature space and other speakers (often called the cohort speakers or the universal background speakers) will overlap the target speaker.
The different regions of feature space correspond to different phonetic units and we may find that two speakers overlap in one part of space while they do not overlap very much in another.
An illustration of feature space for speaker verification.
Speaker Verification Methods
The setting of the threshold determines the size of the errors thatthe verification system will make. There are two types of error tobe concerned with:
1. The error of missing a target, PM, when the target speaker is rejected incorrectly.
2. The error of false acceptance or false alarm, PFA, when an impostor speaker is accepted as the target speaker.
The adjustment of the threshold enables the trade-off between thetwo types of error. Increasing the threshold will reduce thefrequency of false acceptances by demanding an increase in thedifference in the scores of the target and the alternative models.
Threshold Estimates
The price now paid for such a change in threshold is that it is nowmore difficult for acceptance to occur when the target is actuallypresent, resulting in an increase in the false dismissals.
This trade- off between the two errors is characterized by a ROC (Receiver
Operating Characteristic) curve which is a plot of the probability ofcorrect acceptance, which is 1- PM versus PFA.
Quite often a variant of the ROC is employed: the DET curve (thedetection error trade-off curve). It allows for a more directcomparison of errors by plotting PM versus PFA . This is doneon a logarithmic scale for easier reading of the smaller errorregion.
Threshold Estimates

Example of a DET curve based on scores from multiple speakers.
Threshold Estimates
Feature selectionIt is in the selection of the features that we encounter thedistinctive characteristics of the speech process in definingthis speaker verification pattern recognition problem.
At the heart of the problem is to distinguish one person's speech production mechanism from another person's.
Given that speech is considered to be a time-varying linear filter (our vocal tract) operating on signal sources (glottal pulses or noise generators), a reasonable feature set would characterize the signal produced by the filter acting on the signal source.
The time-varying character of the speech process is captured by
performing the spectral analysis at short time intervals andrepeating the analysis periodically.
Features are the Mel-frequency Cepstral Coefficients, usually referred to as MFCCs. These speech features seem particularly well suited to density function models such as mixture models or Hidden Markov Models (HMMs).
The Mel-frequency represents a warping of the frequency band that is linear from 0 to 1 kHz and logarithmic at the higher frequencies, and the analysis is performed over this warped axis. This warping function has its origins in the human perception of tones.
The speech signal is constrained to a bandwidth of about 150-3500 Hz for telephone speech and about 50 Hz - 8kHz for broadband communications.
The cepstral features are obtained by analyzing the Mel-scaled speech every 0.01 seconds over a time interval of about 20 milliseconds in duration.
This yields the Mel-scale spectrum. Depending on the system there are about 12-20 such coefficients produced every 0.01 seconds. These coefficients, MFCCs, are used to generate cepstral derivatives by differencing techniques, resulting in about 24 to 40 features and sometimes second derivatives.
Feature selection
Speaker Models
Speaker models enable to generate the scores from which wewill make decisions. As in any pattern recognition problem thechoices are numerous, and include the likes of neural networks,Support Vector Machines, Gaussian Mixture Models (GMMs)and Hidden Markov Models (HMMs), as well as combinations of
thevarious approaches.
While some models are capable of exploiting dependency in thesequence of feature vectors from the target speakers, the
currentstate-of-the-art modeling approaches, based on Gaussian
MixtureModels, treat the sequence of feature vectors as independentrandom vectors.
The Gaussian Mixture ModelAt the heart of today's state-of-the-art speaker verification systems
is the Gaussian Mixture Model (GMM). This is a probability density
function (PDF) that itself consists of a sum of multivariate Gaussian
density functions. Being a mixture of Gaussians, it has the ability to
place mass where collections of training data exist.
Additionally, its parameters can be readily estimated by Maximum
Likelihood (ML) training procedures including the EM (Estimate-
Maximize) algorithm, a well-known iterative algorithm for finding
the ML estimate.
The process of creating speaker models via adaptation starts with a
generic model for a speaker and uses the data collected from the
target speaker to tailor the generic model to the speaker. If we
consider the generic model as a prior probability distribution we
can view the process of model adaptation in the Bayesian
framework of parameter estimation.
Speaker Model Training
The discriminative training of models is concerned with the
important and relevant question of "How should I select the
parameters of my model or models such that we maximize the
performance on our goal of speaker separability?"
In order to accomplish this we need to move away from the ML
criterion and employ as a training criterion the actual loss function
that will be employed in the evaluation of an SV system or some
other criterion that is highly correlated with our performance
metric.
Speaker Model Training
Class conditional models that have discriminative training imposed on them via the discriminative training criterion form one class of discriminatively trained models.
The other class is that for which Discrimination is inherent in the approach: neural networks, Support Vector Machines (SVM), and classification trees.
What these approaches have in common is that the training process involves the separation of two or more classes from each other (e.g. the target speaker from the non-target speaker).
Speaker Model Training

Model selectionThe selection of the appropriate model for a particular application is still
an art.
GMMs have shown themselves to be adaptable to a wide variety of situations and should be one of the contenders in almost any application.
However, any of the discriminative approaches, such as neural networks, offer the possibility of being more effective in situations with limited training data, since they use all the training data to find the decision boundary between classes rather than modeling classes separately and then combining the separate models.
Performance measures
We have already noted that we can measure the performance of aspeaker verification system by its probability of a false dismissalversus the probability of false acceptance at a given thresholdsetting.
As we change the system's detection threshold,we end up with a collection of values that give the DET (DetectionError Trade-off) curve. While this is a fairly straightforwardconcept, how one should proceed from the collection of scores forindividuals to the system DET curve is not uniquely defined.
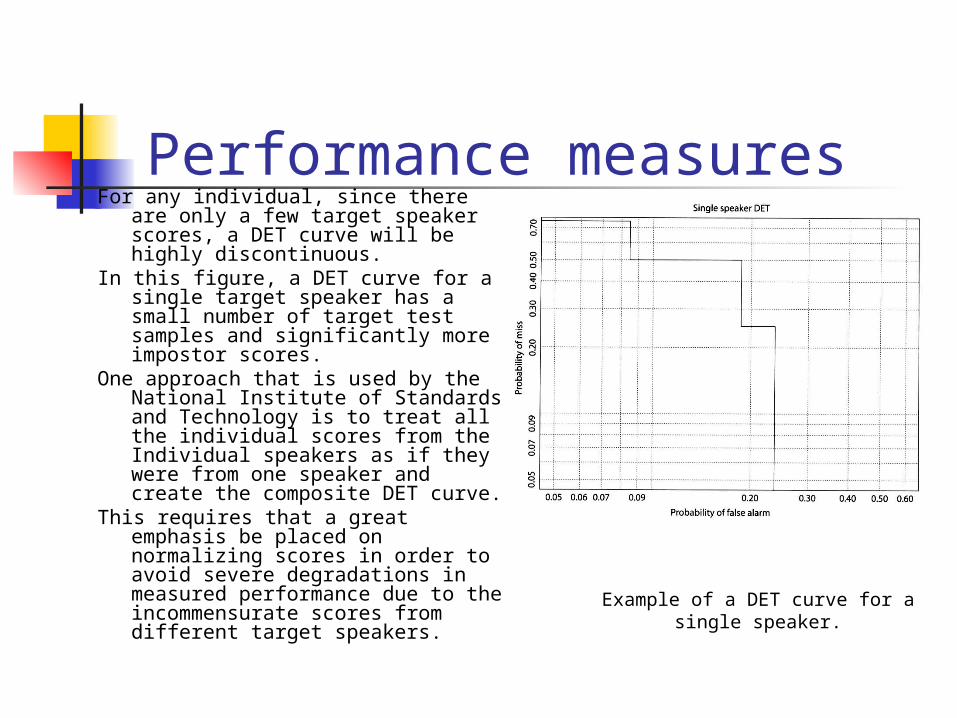
For any individual, since there are only a few target speaker scores, a DET curve will be highly discontinuous.
In this figure, a DET curve for a single target speaker has a small number of target test samples and significantly more impostor scores.
One approach that is used by the National Institute of Standards and Technology is to treat all the individual scores from the Individual speakers as if they were from one speaker and create the composite DET curve.
This requires that a great emphasis be placed on normalizing scores in order to avoid severe degradations in measured performance due to the incommensurate scores from different target speakers.
Example of a DET curve for a single speaker.
Performance measures

While the DET or ROC curves provide a great deal of information
about SV system performance, it is often desirable to characterize
the performance of a system by a single number in order tofacilitate system comparisons. The number often employed
is theequal error rate (ERR), the point on the DET or ROC where
theprobability of a miss is equal to the probability of false
acceptance.
The factors affecting performance include the amounts of training data and the duration of the evaluation data, the variability and types of channels used etc.
Performance measures
Alternative approachesThe approaches that we have considered thus far have treated the data
extracted from the speech as independent events in time, and have not exploited any of the higher level information in the speech process, relying primarily on the general characteristics of an individual's vocal production mechanism.
On contrary, the Dragon Systems approach focused on the recognizer's ability to provide higher-level acoustic knowledge (context-independent phonetic units).
Words (and Phonetic Units) Count: The natural extension of the proceeding work was to combine language information with acoustic information.
Models Exploring the Shape of Feature Space: This model ignores the fine structure of the speech, working with the shape that a speaker's features form in feature space.
Voice Recognition Advantages
Voice is a physiological and behavioral characteristic where forgery has been studied extensively
Enrollment (training) is relatively fast Inexpensive to obtain Provides vast grounds for physiological
and psychological studies

Voice Recognition Disadvantages
A voice verification is highly dependent on the native language user
Very high compression rates are not easy to achieve
A majority of research is on automated voice recognition, and not for biometric applications.

Reference and Links
Signal Processing Institute, Swiss Federal Institute of Technologyhttp://scgwww.epfl.ch/
Biometric Systems Lab, University ofBolognahttp://bias.csr.unibo.it/research/biolab/
Course text book