shrimp production review - global aquaculture alliance · pdf fileshrimp production review...
TRANSCRIPT
Shrimp Production Review
James L. Anderson, Director, Institute for Sustainable Food Systems University of Florida
Diego Valderrama, University of los Andes, Colombia Darryl Jory, Global Aquaculture Alliance
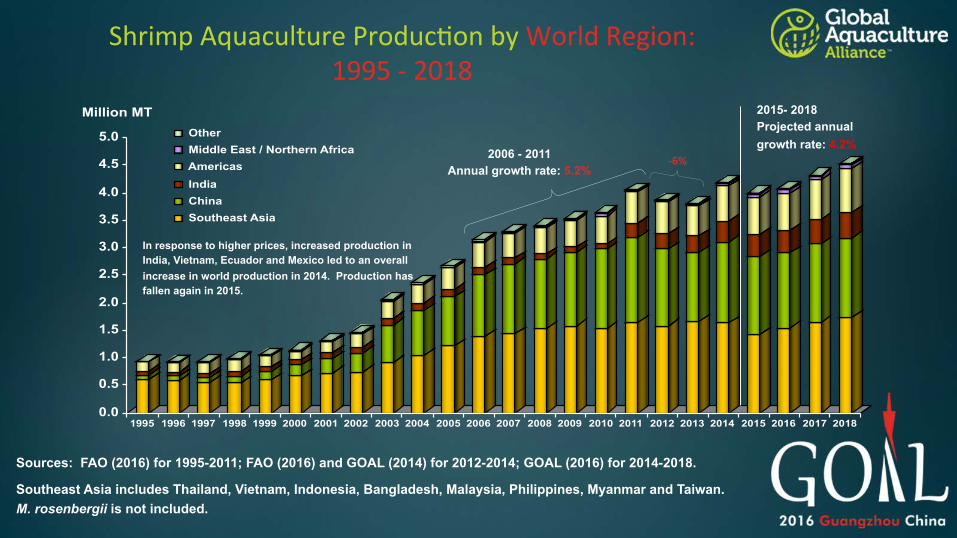
Shrimp Aquaculture Produc3on by World Region: 1995 -‐ 2018
Sources: FAO (2016) for 1995-2011; FAO (2016) and GOAL (2014) for 2012-2014; GOAL (2016) for 2014-2018.
Southeast Asia includes Thailand, Vietnam, Indonesia, Bangladesh, Malaysia, Philippines, Myanmar and Taiwan. M. rosenbergii is not included.
0.0
0.5
1.0
1.5
2.0
2.5
3.0
3.5
4.0
4.5
5.0
Million MT
1995 1996 1997 1998 1999 2000 2001 2002 2003 2004 2005 2006 2007 2008 2009 2010 2011 2012 2013 2014 2015 2016 2017 2018
Other Middle East / Northern Africa Americas India China Southeast Asia
2006 - 2011 Annual growth rate: 5.2%
-‐6%
2015- 2018 Projected annual growth rate: 4.2%
In response to higher prices, increased production in India, Vietnam, Ecuador and Mexico led to an overall increase in world production in 2014. Production has fallen again in 2015.

0.0
0.5
1.0
1.5
2.0
Million MT
Southeast Asia China India Americas Middle East / NorthAfrica
2011 2012 2013 2014 2015 2016 2017 2018
Shrimp Aquaculture by Major Producing Regions: 2011 – 2018
Impact of EMS: China, Thailand and Mexico reported declines in production in 2012/2013. China, Thailand, Vietnam, and Indonesia reported lower production in 2015 relative to 2014.
Sources: FAO (2016) for 2011; FAO (2016) and GOAL (2014) for 2012-2014; GOAL (2016) for 2014-2018.
Southeast Asia includes Thailand, Vietnam, Indonesia, Bangladesh, Malaysia, Philippines, Myanmar and Taiwan. M. rosenbergii is not included.
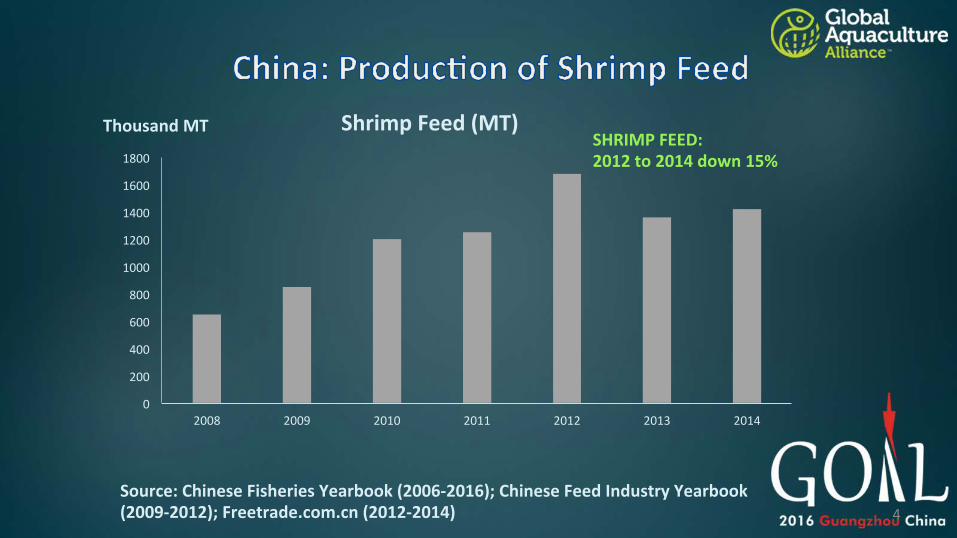
4 Source: Chinese Fisheries Yearbook (2006-‐2016); Chinese Feed Industry Yearbook (2009-‐2012); Freetrade.com.cn (2012-‐2014)
0
200
400
600
800
1000
1200
1400
1600
1800
2008 2009 2010 2011 2012 2013 2014
Shrimp Feed (MT) Thousand MT SHRIMP FEED: 2012 to 2014 down 15%
5
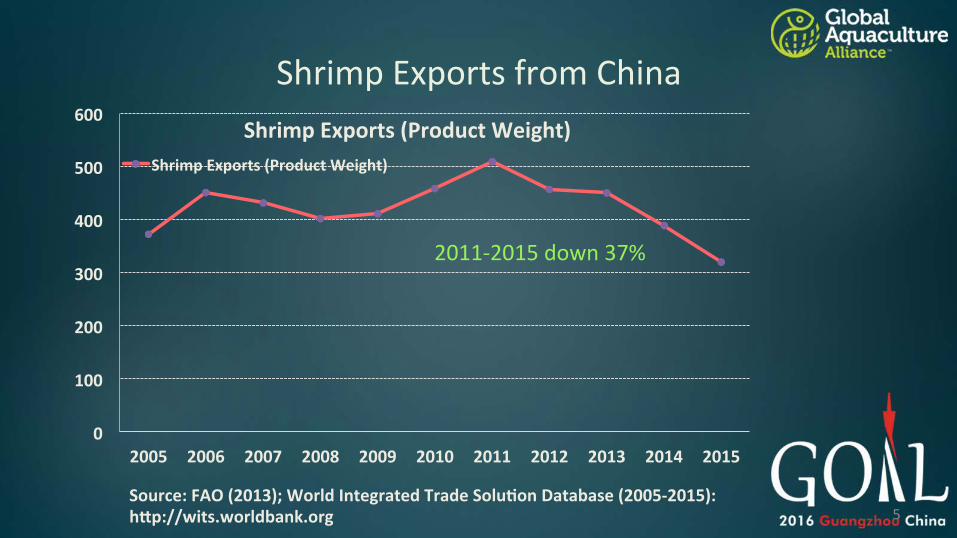
Shrimp Exports from China
Source: FAO (2013); World Integrated Trade SoluTon Database (2005-‐2015): hUp://wits.worldbank.org
0
100
200
300
400
500
600
2005 2006 2007 2008 2009 2010 2011 2012 2013 2014 2015
Shrimp Exports (Product Weight) Shrimp Exports (Product Weight)
2011-‐2015 down 37%

6
China – Es3mated Domes3c Shrimp Consump3on (Round Weight)
Source: Chinese Fisheries Yearbook; FAO (2013); World Integrated Trade SoluTon Database (2005-‐2015): hUp://wits.worldbank.org
0
200
400
600
800
1,000
1,200
1,400
1,600
1,800
2005 2006 2007 2008 2009 2010 2011 2012 2013 2014 2015
Thousand MT
Domes3c Consump3on
Note: EsTmated ConsumpTon = ProducTon + Import -‐ Export
+60% 2010-‐15 +123% 2005-‐15
7
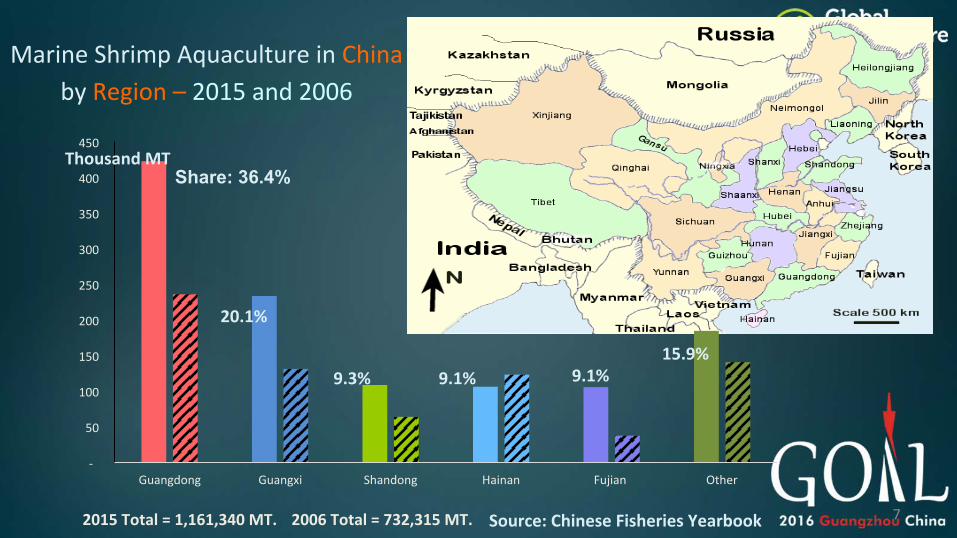
Marine Shrimp Aquaculture in China by Region – 2015 and 2006
2015 Total = 1,161,340 MT. 2006 Total = 732,315 MT. Source: Chinese Fisheries Yearbook
-‐
50
100
150
200
250
300
350
400
450
Guangdong Guangxi Shandong Hainan Fujian Other
Thousand MT Share: 36.4%
20.1%
9.3% 9.1% 9.1% 15.9%

Shrimp Aquaculture by Major Producing Regions: 2011-‐2014 vs. 2014-‐2018
-0.20%
13.70%
4.20%
32.90%
-1.70%
4.90%
10.30%
2.50%1.60%
-0.50%
-10%
0%
10%
20%
30%
40%
Southeast Asia China India Americas Middle East / NorthAfrica
Average Annual Growth Rate
2011-2014 2014-2018
Sources: FAO (2016) for 2011; FAO (2016) and GOAL (2014) for 2012-2014; GOAL (2016) for 2014-2018.
Southeast Asia includes Thailand, Vietnam, Indonesia, Bangladesh, Malaysia, Philippines, Myanmar and Taiwan. M. rosenbergii is not included.
0.0
0.3
0.6
0.9
1.2
1.5
1.8
Million MT
China Thailand Vietnam Indonesia India
2011 2012 2013 2014 2015 2016 2017 2018
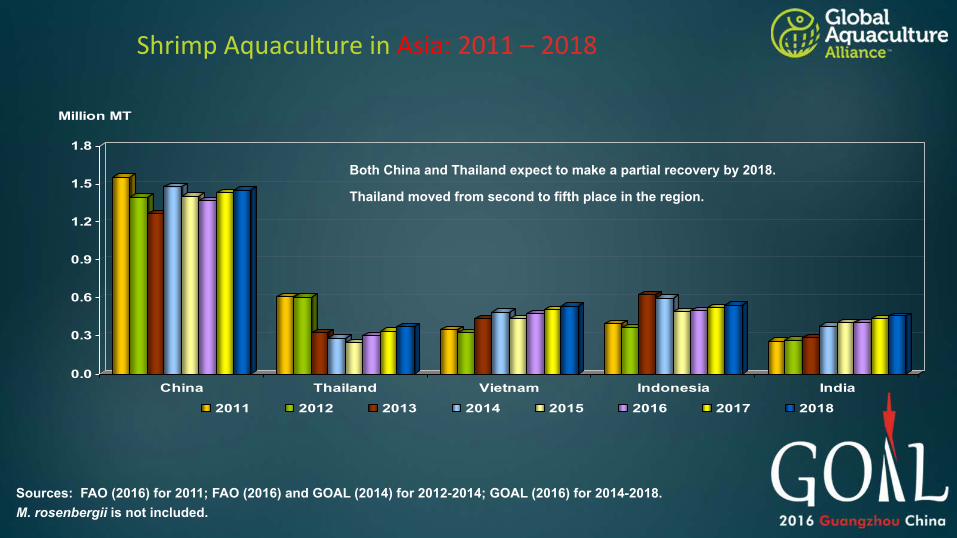
Shrimp Aquaculture in Asia: 2011 – 2018
Sources: FAO (2016) for 2011; FAO (2016) and GOAL (2014) for 2012-2014; GOAL (2016) for 2014-2018. M. rosenbergii is not included.
Both China and Thailand expect to make a partial recovery by 2018.
Thailand moved from second to fifth place in the region.
0
20
40
60
80
100
120
Thousand MT
Bangladesh Malaysia Philippines Taiwan
2011 2012 2013 2014 2015 2016 2017 2018
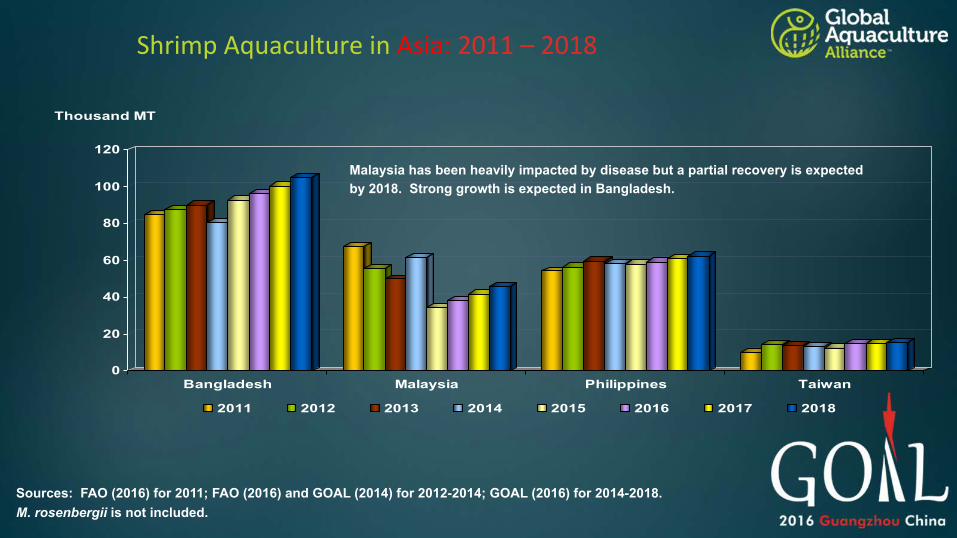
Shrimp Aquaculture in Asia: 2011 – 2018
Sources: FAO (2016) for 2011; FAO (2016) and GOAL (2014) for 2012-2014; GOAL (2016) for 2014-2018. M. rosenbergii is not included.
Malaysia has been heavily impacted by disease but a partial recovery is expected by 2018. Strong growth is expected in Bangladesh.
0
100
200
300
400
Thousand MT
Ecuador Mexico Brazil
2011 2012 2013 2014 2015 2016 2017 2018
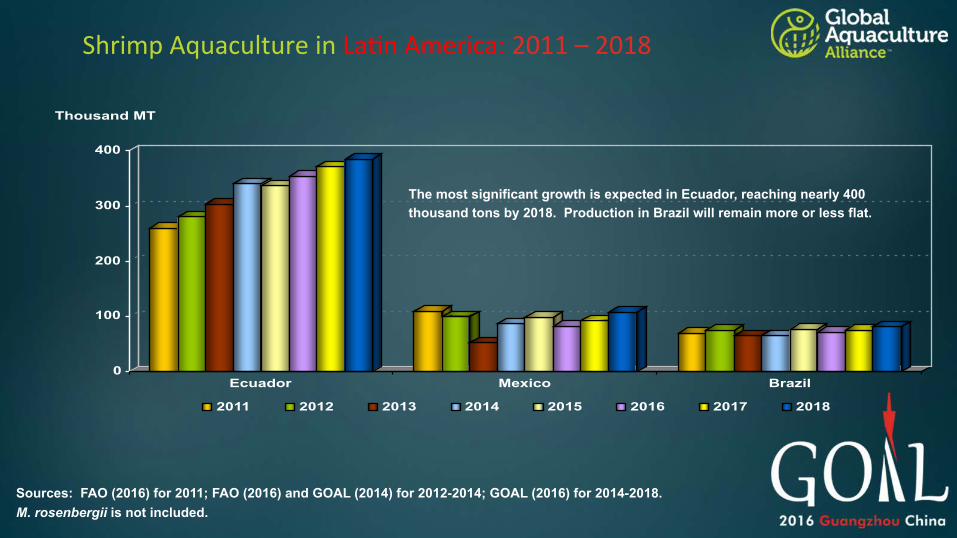
Shrimp Aquaculture in La3n America: 2011 – 2018
Sources: FAO (2016) for 2011; FAO (2016) and GOAL (2014) for 2012-2014; GOAL (2016) for 2014-2018. M. rosenbergii is not included.
The most significant growth is expected in Ecuador, reaching nearly 400 thousand tons by 2018. Production in Brazil will remain more or less flat.
0
5
10
15
20
25
30
35
40
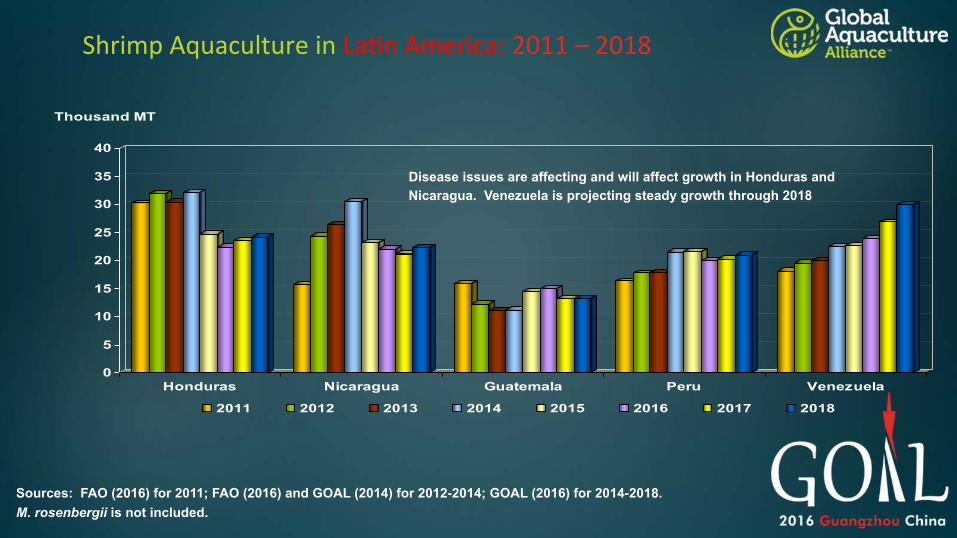
Thousand MT
Honduras Nicaragua Guatemala Peru Venezuela
2011 2012 2013 2014 2015 2016 2017 2018
Shrimp Aquaculture in La3n America: 2011 – 2018
Sources: FAO (2016) for 2011; FAO (2016) and GOAL (2014) for 2012-2014; GOAL (2016) for 2014-2018. M. rosenbergii is not included.
Disease issues are affecting and will affect growth in Honduras and Nicaragua. Venezuela is projecting steady growth through 2018
0
2
4
6
8
10
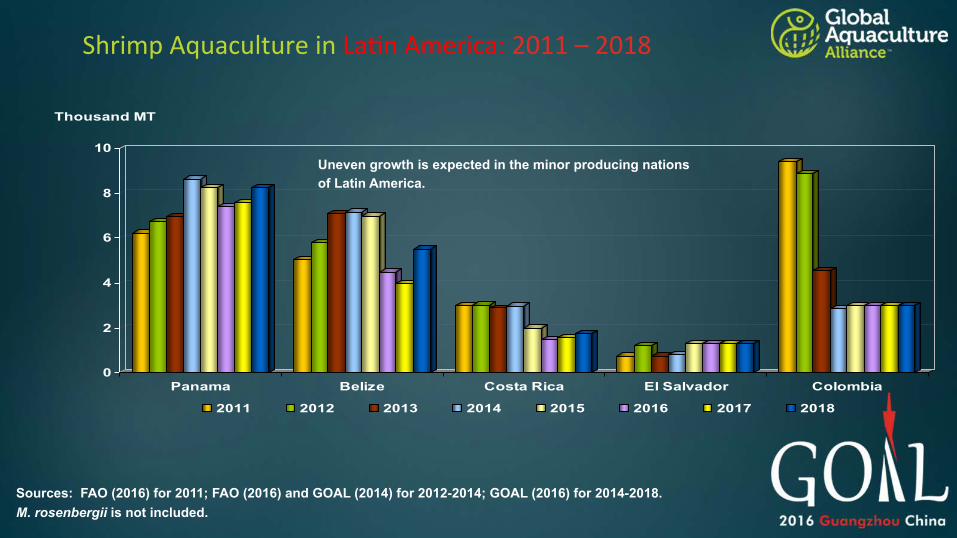
Thousand MT
Panama Belize Costa Rica El Salvador Colombia
2011 2012 2013 2014 2015 2016 2017 2018
Shrimp Aquaculture in La3n America: 2011 – 2018
Sources: FAO (2016) for 2011; FAO (2016) and GOAL (2014) for 2012-2014; GOAL (2016) for 2014-2018. M. rosenbergii is not included.
Uneven growth is expected in the minor producing nations of Latin America.
0
5
10
15
20
25
30
35
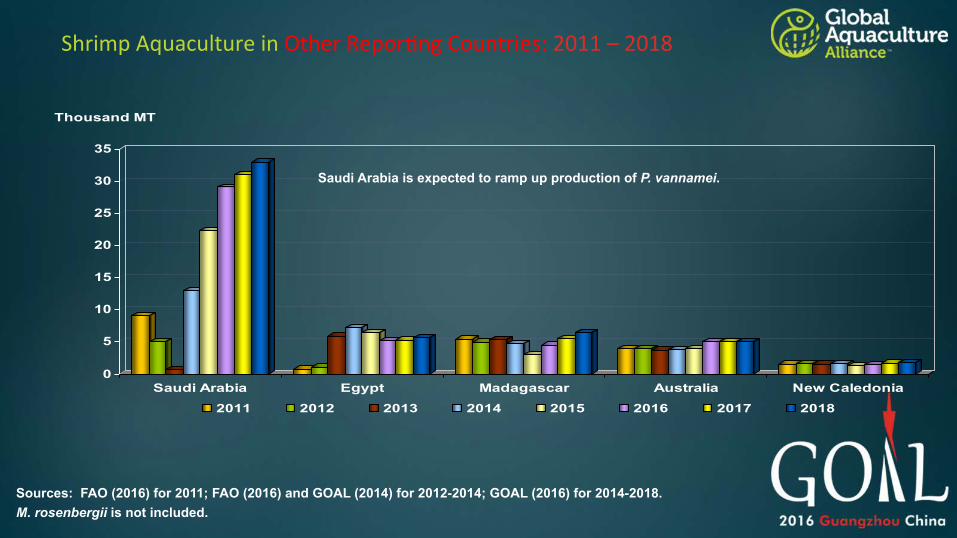
Thousand MT
Saudi Arabia Egypt Madagascar Australia New Caledonia
2011 2012 2013 2014 2015 2016 2017 2018
Shrimp Aquaculture in Other Repor3ng Countries: 2011 – 2018
Sources: FAO (2016) for 2011; FAO (2016) and GOAL (2014) for 2012-2014; GOAL (2016) for 2014-2018. M. rosenbergii is not included.
Saudi Arabia is expected to ramp up production of P. vannamei.
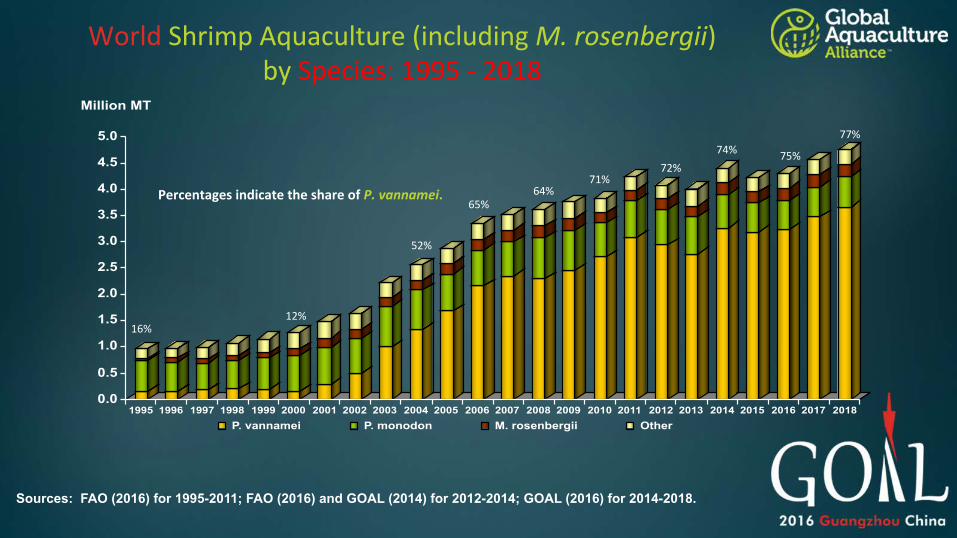
World Shrimp Aquaculture (including M. rosenbergii) by Species: 1995 -‐ 2018
Sources: FAO (2016) for 1995-2011; FAO (2016) and GOAL (2014) for 2012-2014; GOAL (2016) for 2014-2018.
0.0
0.5
1.0
1.5
2.0
2.5
3.0
3.5
4.0
4.5
5.0
Million MT
1995 1996 1997 1998 1999 2000 2001 2002 2003 2004 2005 2006 2007 2008 2009 2010 2011 2012 2013 2014 2015 2016 2017 2018 P. vannamei P. monodon M. rosenbergii Other
65%
71%
52%
72%
16% 12%
75%
64%
77% 74%
Percentages indicate the share of P. vannamei.
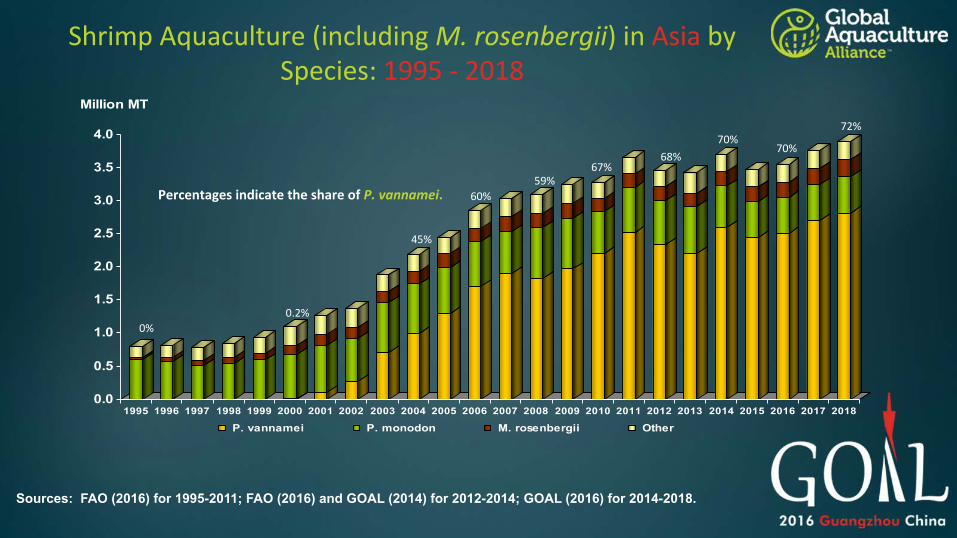
Shrimp Aquaculture (including M. rosenbergii) in Asia by Species: 1995 -‐ 2018
Sources: FAO (2016) for 1995-2011; FAO (2016) and GOAL (2014) for 2012-2014; GOAL (2016) for 2014-2018.
0.0
0.5
1.0
1.5
2.0
2.5
3.0
3.5
4.0
Million MT
1995 1996 1997 1998 1999 2000 2001 2002 2003 2004 2005 2006 2007 2008 2009 2010 2011 2012 2013 2014 2015 2016 2017 2018
P. vannamei P. monodon M. rosenbergii Other
60%
67%
45%
68%
0% 0.2%
70%
59%
72% 70%
Percentages indicate the share of P. vannamei.
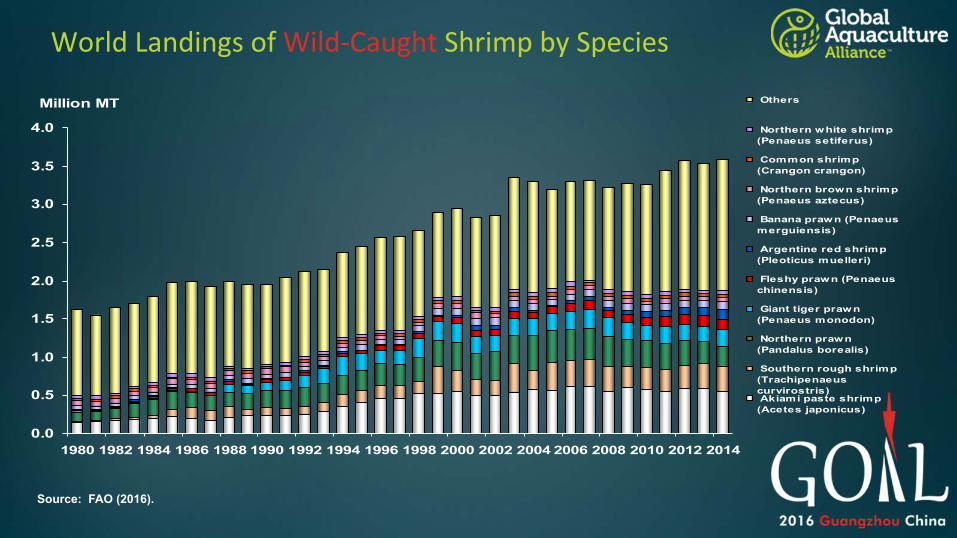
World Landings of Wild-‐Caught Shrimp by Species
0.0
0.5
1.0
1.5
2.0
2.5
3.0
3.5
4.0
1980 1982 1984 1986 1988 1990 1992 1994 1996 1998 2000 2002 2004 2006 2008 2010 2012 2014
Million MT Others
Northern white shrimp(Penaeus setiferus)
Common shrimp(Crangon crangon)
Northern brown shrimp(Penaeus aztecus)
Banana prawn (Penaeusmerguiensis)
Argentine red shrimp(Pleoticus muelleri)
Fleshy prawn (Penaeuschinensis)
Giant tiger prawn(Penaeus monodon)
Northern prawn(Pandalus borealis)
Southern rough shrimp(Trachipenaeuscurvirostris) Akiami paste shrimp(Acetes japonicus)
Source: FAO (2016).

World Produc3on of Shrimp Capture Fisheries & Aquaculture
0.0
1.0
2.0
3.0
4.0
5.0
6.0
7.0
8.0
1980 1982 1984 1986 1988 1990 1992 1994 1996 1998 2000 2002 2004 2006 2008 2010 2012 2014
Million MT
Capture Fisheries Aquaculture
Aquaculture accounted for 54% of world shrimp supplies in 2014.
28%
51%
52%
26%
54%
53% 49%
Sources: FAO (2016); GOAL (2014, 2016). Notes: M. rosenbergii is not included. China includes freshwater production of P. vannamei.
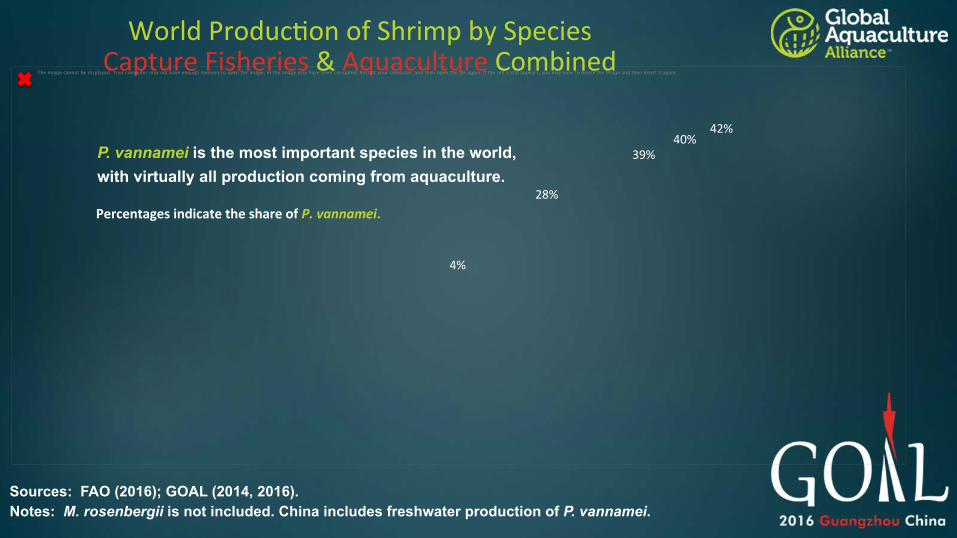
World Produc3on of Shrimp by Species Capture Fisheries & Aquaculture Combined
The image cannot be displayed. Your computer may not have enough memory to open the image, or the image may have been corrupted. Restart your computer, and then open the file again. If the red x still appears, you may have to delete the image and then insert it again.
28%
40% 42%
39%
4%
Sources: FAO (2016); GOAL (2014, 2016). Notes: M. rosenbergii is not included. China includes freshwater production of P. vannamei.
P. vannamei is the most important species in the world, with virtually all production coming from aquaculture.
Percentages indicate the share of P. vannamei.
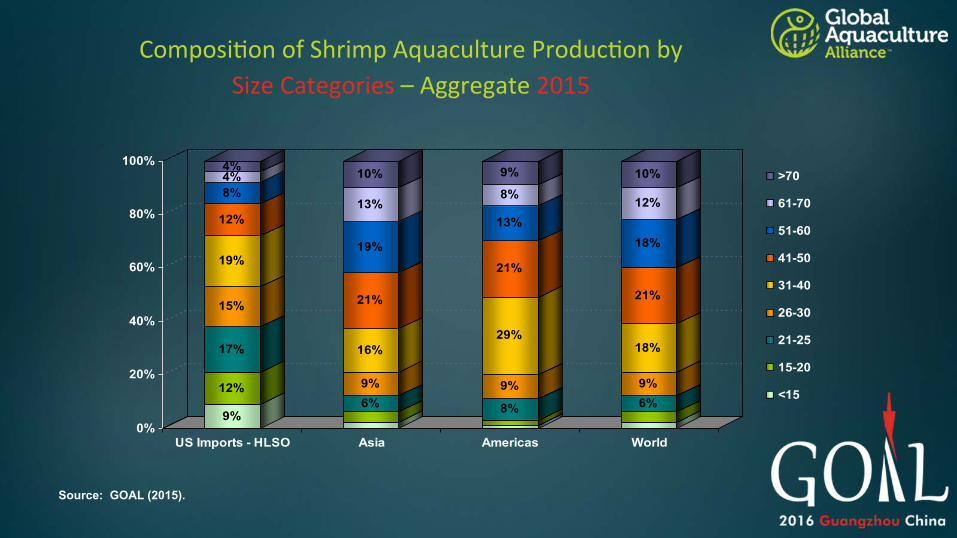
Composi3on of Shrimp Aquaculture Produc3on by Size Categories – Aggregate 2015
9%
12%
17%
15%
19%
12%
8%4%4%
6%9%
16%
21%
19%
13%
10%
8%
9%
29%
21%
13%
8%
9%
6%9%
18%
21%
18%
12%
10%
0%
20%
40%
60%
80%
100%
US Imports - HLSO Asia Americas World
>70
61-70
51-60
41-50
31-40
26-30
21-25
15-20
<15
Source: GOAL (2015).

Expected Trends in Shrimp Aquaculture Size Categories -‐ GOAL Survey 2016
Size Category Asia Americas World
<15 Decrease/Stable Stable Decrease/Stable
15-‐20 Decrease/Stable Decrease/Stable Decrease/Stable
21-‐25 Stable Stable Stable
26-‐30 Stable Increase Stable
31-‐40 Increase/Stable Increase Increase/Stable
41-‐50 Increase Stable Increase
51-‐60 Increase Stable Increase
61-‐70 Increase/Stable Increase Increase
>70 Increase Decrease Increase/Stable
India, Indonesia and Vietnam expect increased production of smaller counts.
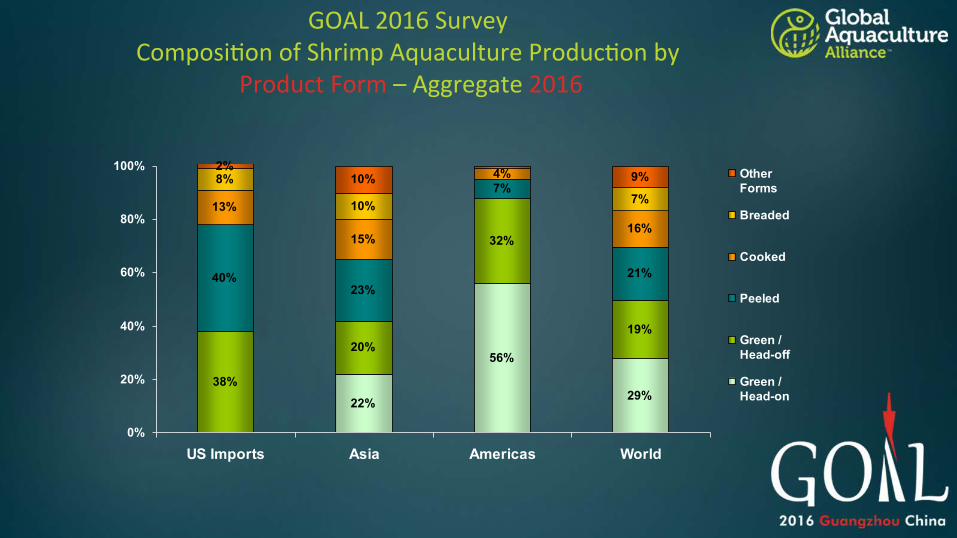
GOAL 2016 Survey Composi3on of Shrimp Aquaculture Produc3on by
Product Form – Aggregate 2016
40%
7%13%
15%
4%8%
29%
56%
22%
38%
19%
32%
20%
21%23%
16%
7%10%
9%10%2%
0%
20%
40%
60%
80%
100%
US Imports Asia Americas World
OtherForms
Breaded
Cooked
Peeled
Green /Head-off
Green /Head-on

Expected Trends in Shrimp Aquaculture Product Form -‐ GOAL Survey 2015
Product Form Asia Americas World
Green / Head-‐on Stable/Decrease Stable/Increase Stable
Green / Head-‐off Increase Stable/Decrease Stable/Increase
Peeled Stable/Increase Stable Stable/Increase
Cooked Stable Stable Stable
Breaded Increase Stable/Decrease Increase
Other Forms Increase Decrease Increase
For a number of years there has been a trend for increased production of green / head-on
shrimp in Ecuador for the European and Asian markets.
Diseases ***Production costs - Feed/Fishmeal
Seed stock quality & availability Access to disease-free broodstock
***International market prices Production costs - Others
Product quality control Environmental management Feed quality and availability
Production costs - Fuel Access to Credit
Banned chemicals / antibiotic use ***International trade barriers
Market coordination Infrastructure
Public Relations Management Conflicts with other users
Not Important Extremely Important
Moderately Important
GOAL 2016 Survey Issues & Challenges in Shrimp Aquaculture
All Countries
Asterisk indicates a Top 3 issue in GOAL 2007 Survey

International market prices
Diseases
Production costs - Feed/Fishmeal
Environmental management
Access to disease-free broodstock
Seed stock quality & availability
International trade barriers
Production costs - Fuel
Access to Credit
Production costs - Others
2016 2015
Worldwide Top Issues & Challenges in Shrimp Aquaculture: 2016 Survey vs. 2015 Survey
Not Important Extremely Important
Moderately Important
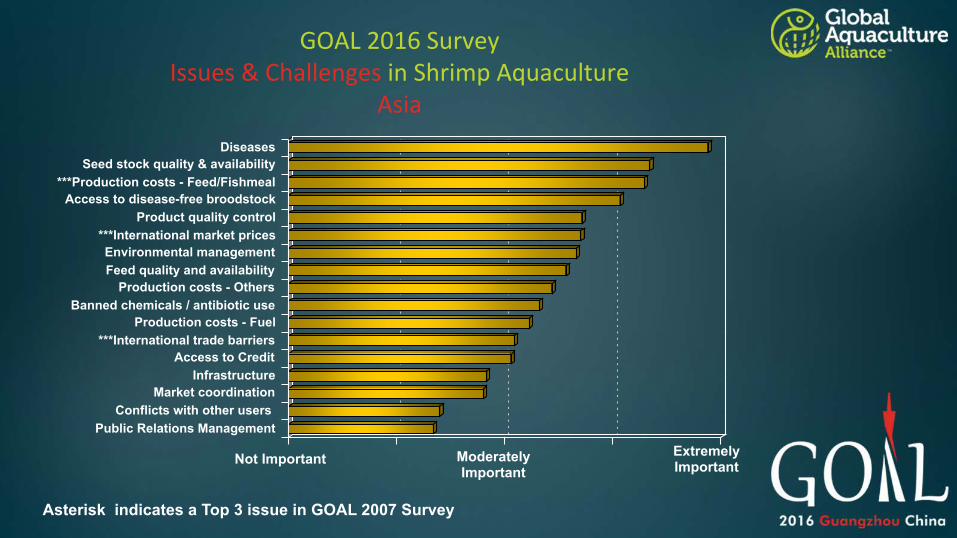
Diseases Seed stock quality & availability
***Production costs - Feed/Fishmeal Access to disease-free broodstock
Product quality control ***International market prices Environmental management Feed quality and availability
Production costs - Others Banned chemicals / antibiotic use
Production costs - Fuel ***International trade barriers
Access to Credit Infrastructure
Market coordination Conflicts with other users
Public Relations Management
Not Important Extremely Important
Moderately Important
GOAL 2016 Survey Issues & Challenges in Shrimp Aquaculture
Asia
Asterisk indicates a Top 3 issue in GOAL 2007 Survey
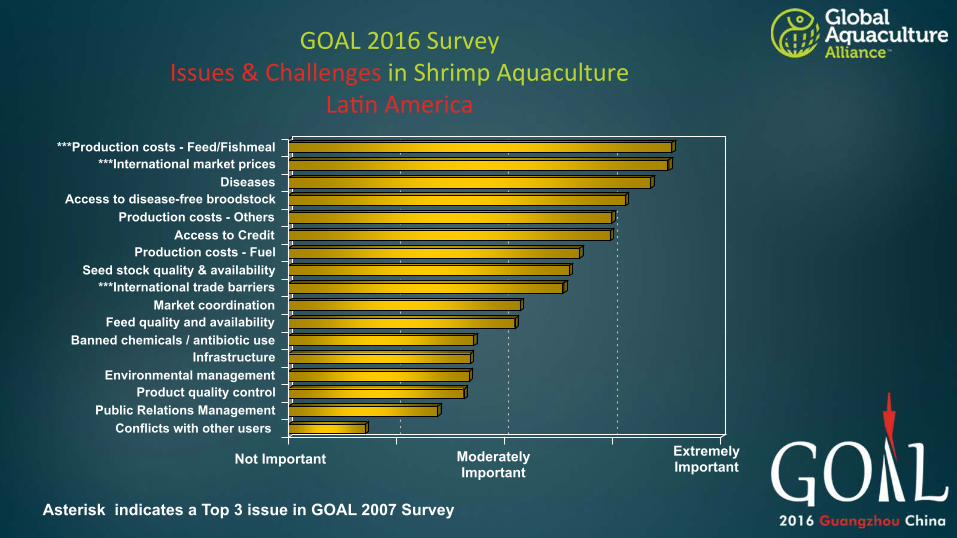
***Production costs - Feed/Fishmeal ***International market prices
Diseases Access to disease-free broodstock
Production costs - Others Access to Credit
Production costs - Fuel Seed stock quality & availability
***International trade barriers Market coordination
Feed quality and availability Banned chemicals / antibiotic use
Infrastructure Environmental management
Product quality control Public Relations Management
Conflicts with other users
Not Important Extremely Important
Moderately Important
GOAL 2016 Survey Issues & Challenges in Shrimp Aquaculture
La3n America
Asterisk indicates a Top 3 issue in GOAL 2007 Survey
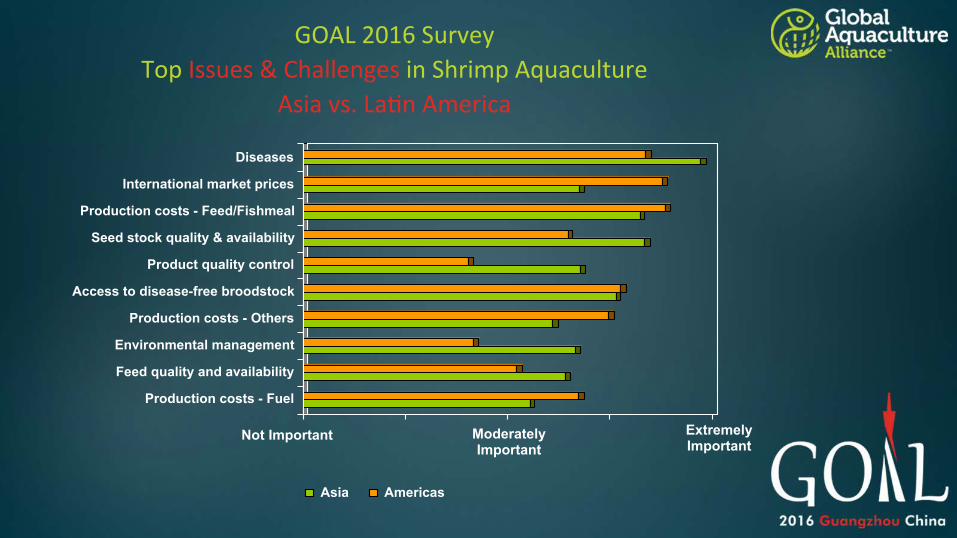
Diseases
International market prices
Production costs - Feed/Fishmeal
Seed stock quality & availability
Product quality control
Access to disease-free broodstock
Production costs - Others
Environmental management
Feed quality and availability
Production costs - Fuel
Asia Americas
GOAL 2016 Survey Top Issues & Challenges in Shrimp Aquaculture
Asia vs. La3n America
Not Important Extremely Important
Moderately Important
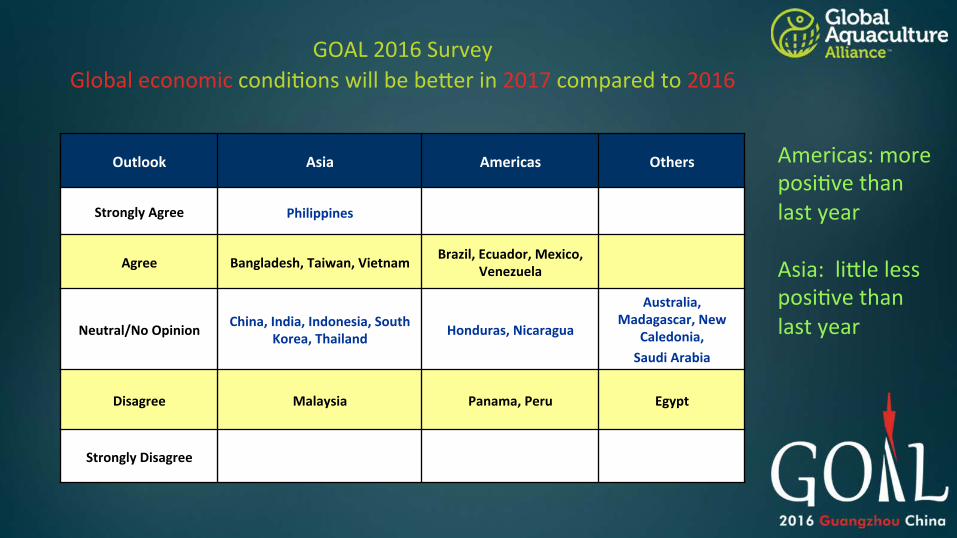
GOAL 2016 Survey Global economic condi3ons will be be`er in 2017 compared to 2016
Outlook Asia Americas Others
Strongly Agree Philippines
Agree Bangladesh, Taiwan, Vietnam Brazil, Ecuador, Mexico, Venezuela
Neutral/No Opinion China, India, Indonesia, South Korea, Thailand Honduras, Nicaragua
Australia, Madagascar, New
Caledonia, Saudi Arabia
Disagree Malaysia Panama, Peru Egypt
Strongly Disagree
Americas: more posi3ve than last year Asia: li`le less posi3ve than last year
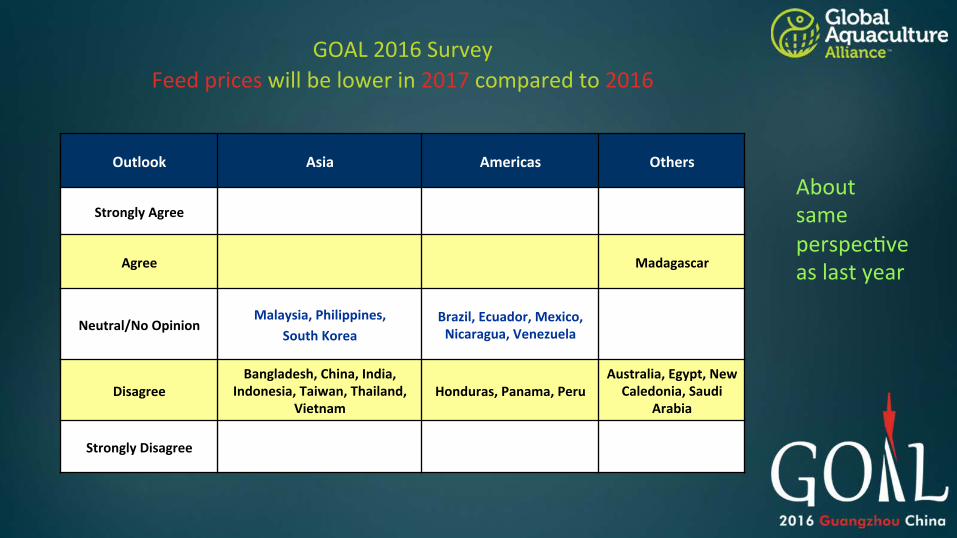
GOAL 2016 Survey Feed prices will be lower in 2017 compared to 2016
Outlook Asia Americas Others
Strongly Agree
Agree Madagascar
Neutral/No Opinion Malaysia, Philippines,
South Korea Brazil, Ecuador, Mexico, Nicaragua, Venezuela
Disagree Bangladesh, China, India,
Indonesia, Taiwan, Thailand, Vietnam
Honduras, Panama, Peru Australia, Egypt, New Caledonia, Saudi
Arabia
Strongly Disagree
About same perspec3ve as last year
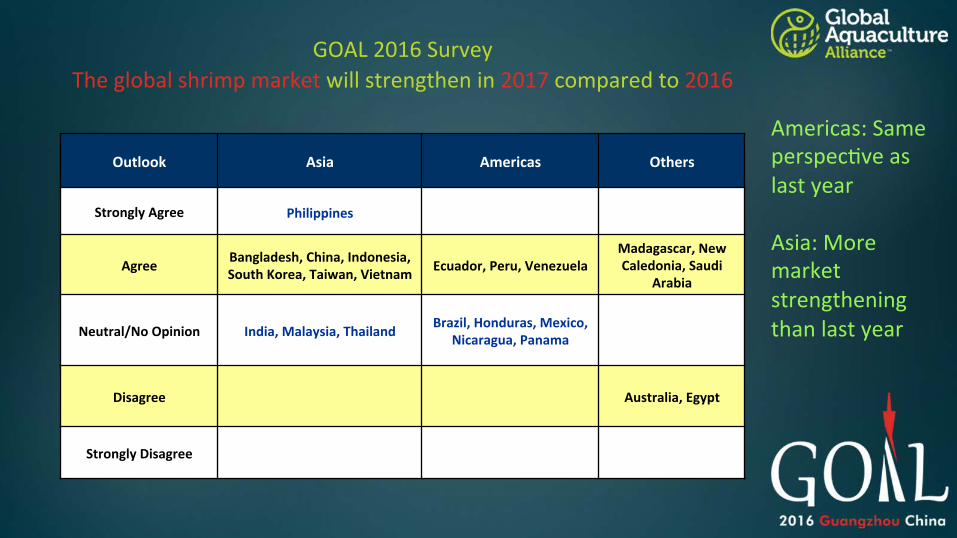
GOAL 2016 Survey The global shrimp market will strengthen in 2017 compared to 2016
Outlook Asia Americas Others
Strongly Agree Philippines
Agree Bangladesh, China, Indonesia, South Korea, Taiwan, Vietnam Ecuador, Peru, Venezuela
Madagascar, New Caledonia, Saudi
Arabia
Neutral/No Opinion India, Malaysia, Thailand Brazil, Honduras, Mexico, Nicaragua, Panama
Disagree Australia, Egypt
Strongly Disagree
Americas: Same perspec3ve as last year Asia: More market strengthening than last year

Trends in Trade
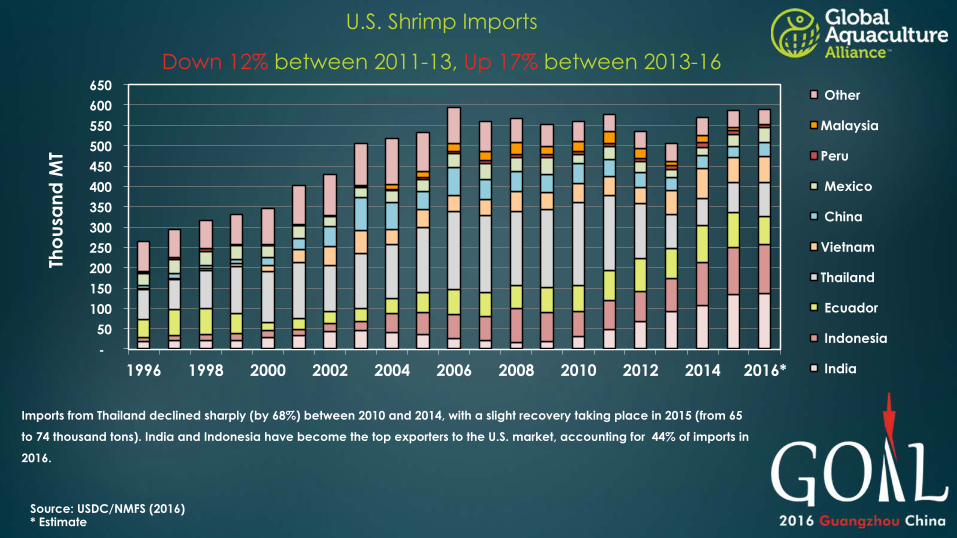
Source: USDC/NMFS (2016) * Estimate
Imports from Thailand declined sharply (by 68%) between 2010 and 2014, with a slight recovery taking place in 2015 (from 65
to 74 thousand tons). India and Indonesia have become the top exporters to the U.S. market, accounting for 44% of imports in
2016.
-
50
100
150
200
250
300
350
400
450
500
550
600
650
1996 1998 2000 2002 2004 2006 2008 2010 2012 2014 2016*
Tho
usa
nd M
T
Other
Malaysia
Peru
Mexico
China
Vietnam
Thailand
Ecuador
Indonesia
India
U.S. Shrimp Imports
Down 12% between 2011-13, Up 17% between 2013-16
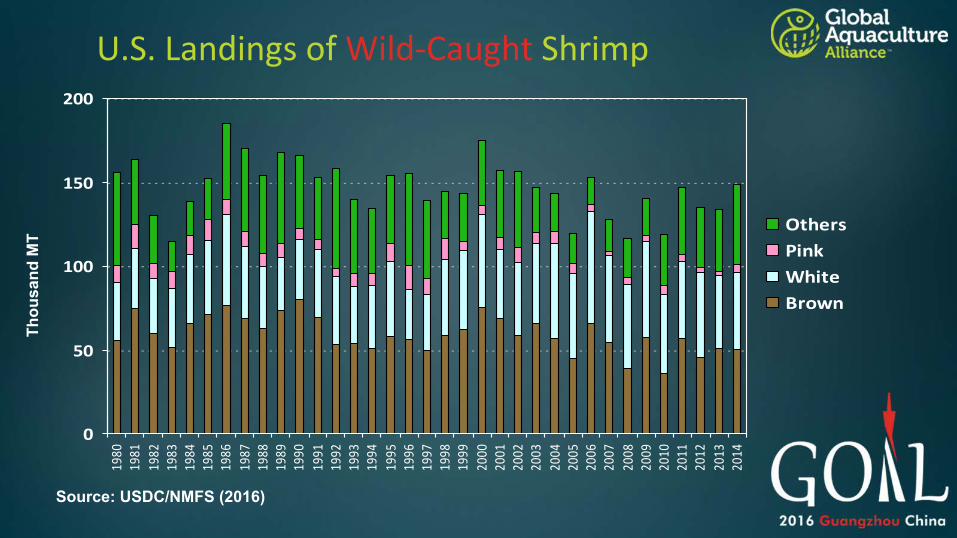
U.S. Landings of Wild-‐Caught Shrimp
0
50
100
150
20019
8019
8119
8219
8319
8419
8519
8619
8719
8819
8919
9019
9119
9219
9319
9419
9519
9619
9719
9819
9920
0020
0120
0220
0320
0420
0520
0620
0720
0820
0920
1020
1120
1220
1320
14
OthersPinkWhiteBrown
Source: USDC/NMFS (2016)
Thou
sand
MT
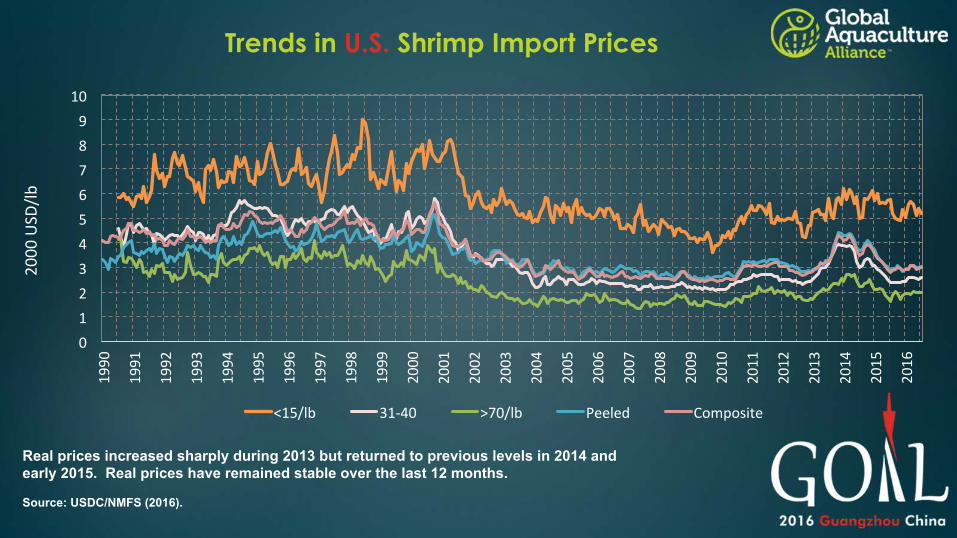
Source: USDC/NMFS (2016).
Real prices increased sharply during 2013 but returned to previous levels in 2014 and early 2015. Real prices have remained stable over the last 12 months.
Trends in U.S. Shrimp Import Prices
0 1 2 3 4 5 6 7 8 9
10 1990
1991
1992
1993
1994
1995
1996
1997
1998
1999
2000
2001
2002
2003
2004
2005
2006
2007
2008
2009
2010
2011
2012
2013
2014
2015
2016
2000 USD
/lb
<15/lb 31-‐40 >70/lb Peeled Composite
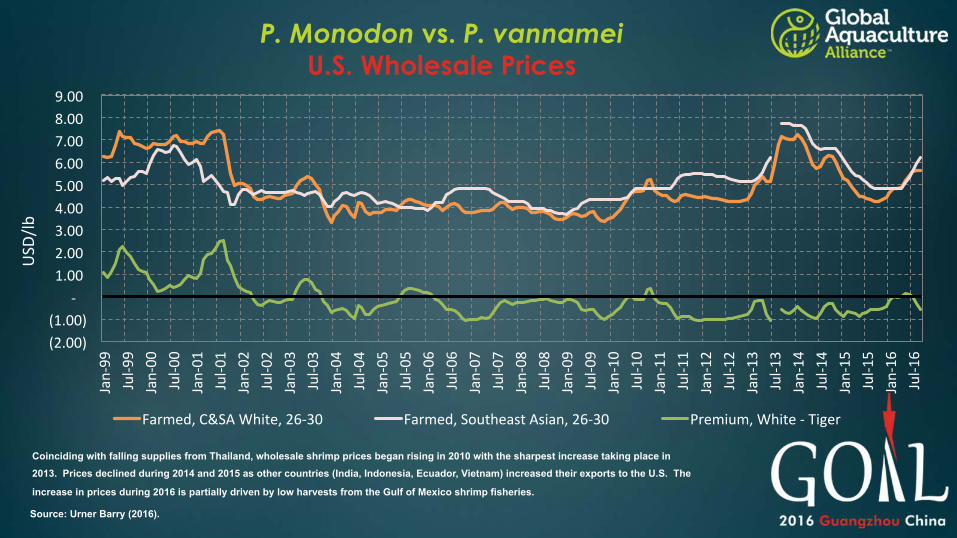
Source: Urner Barry (2016).
Coinciding with falling supplies from Thailand, wholesale shrimp prices began rising in 2010 with the sharpest increase taking place in 2013. Prices declined during 2014 and 2015 as other countries (India, Indonesia, Ecuador, Vietnam) increased their exports to the U.S. The
increase in prices during 2016 is partially driven by low harvests from the Gulf of Mexico shrimp fisheries.
(2.00) (1.00)
-‐ 1.00 2.00 3.00 4.00 5.00 6.00 7.00 8.00 9.00
Jan-‐99
Jul-‐9
9 Jan-‐00
Jul-‐0
0 Jan-‐01
Jul-‐0
1 Jan-‐02
Jul-‐0
2 Jan-‐03
Jul-‐0
3 Jan-‐04
Jul-‐0
4 Jan-‐05
Jul-‐0
5 Jan-‐06
Jul-‐0
6 Jan-‐07
Jul-‐0
7 Jan-‐08
Jul-‐0
8 Jan-‐09
Jul-‐0
9 Jan-‐10
Jul-‐1
0 Jan-‐11
Jul-‐1
1 Jan-‐12
Jul-‐1
2 Jan-‐13
Jul-‐1
3 Jan-‐14
Jul-‐1
4 Jan-‐15
Jul-‐1
5 Jan-‐16
Jul-‐1
6
USD
/lb
Farmed, C&SA White, 26-‐30 Farmed, Southeast Asian, 26-‐30 Premium, White -‐ Tiger
P. Monodon vs. P. vannamei U.S. Wholesale Prices
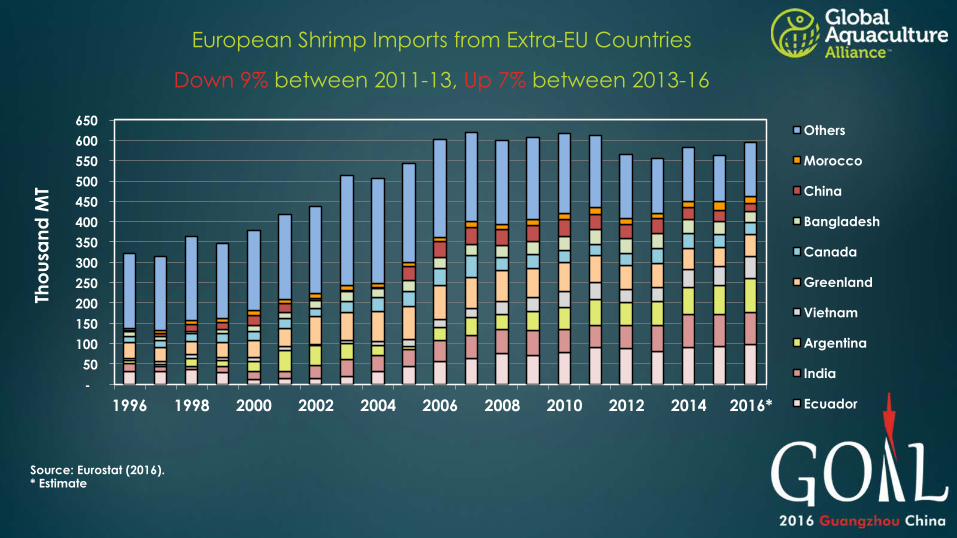
European Shrimp Imports from Extra-EU Countries
Down 9% between 2011-13, Up 7% between 2013-16
Source: Eurostat (2016). * Estimate
-
50
100
150
200
250
300
350
400
450
500
550
600
650
1996 1998 2000 2002 2004 2006 2008 2010 2012 2014 2016*
Tho
usa
nd M
T
Others
Morocco
China
Bangladesh
Canada
Greenland
Vietnam
Argentina
India
Ecuador
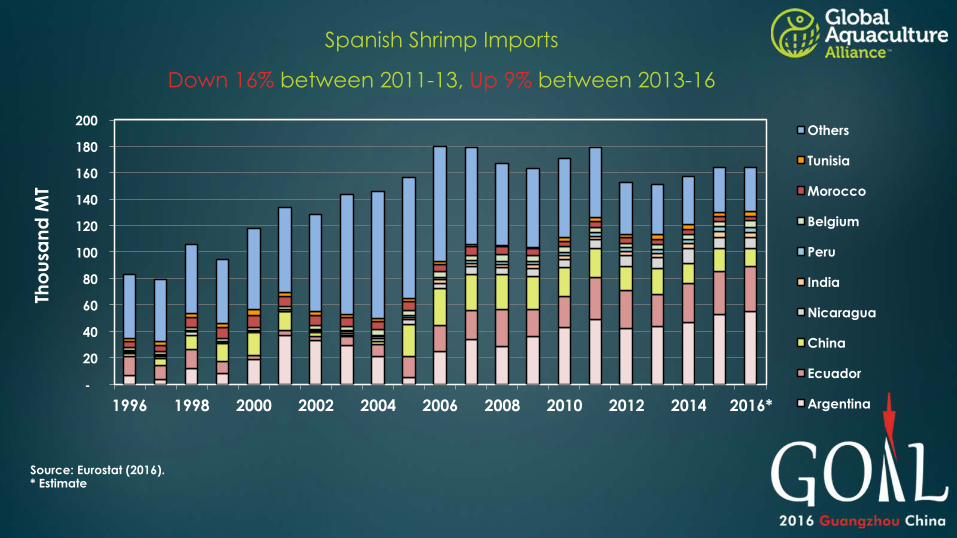
Spanish Shrimp Imports
Down 16% between 2011-13, Up 9% between 2013-16
Source: Eurostat (2016). * Estimate
-
20
40
60
80
100
120
140
160
180
200
1996 1998 2000 2002 2004 2006 2008 2010 2012 2014 2016*
Tho
usa
nd M
T
Others
Tunisia
Morocco
Belgium
Peru
India
Nicaragua
China
Ecuador
Argentina
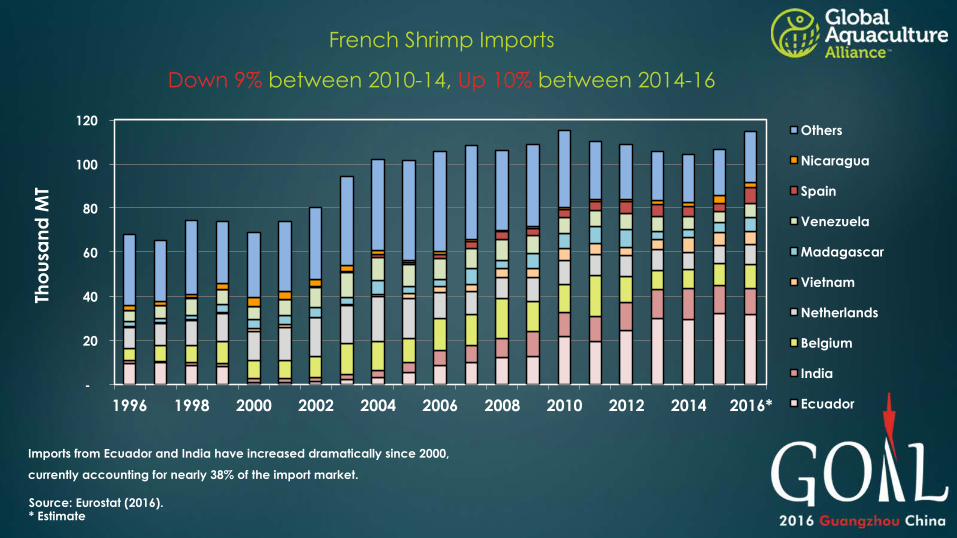
French Shrimp Imports
Down 9% between 2010-14, Up 10% between 2014-16
Source: Eurostat (2016). * Estimate
-
20
40
60
80
100
120
1996 1998 2000 2002 2004 2006 2008 2010 2012 2014 2016*
Tho
usa
nd M
T
Others
Nicaragua
Spain
Venezuela
Madagascar
Vietnam
Netherlands
Belgium
India
Ecuador
Imports from Ecuador and India have increased dramatically since 2000,
currently accounting for nearly 38% of the import market.
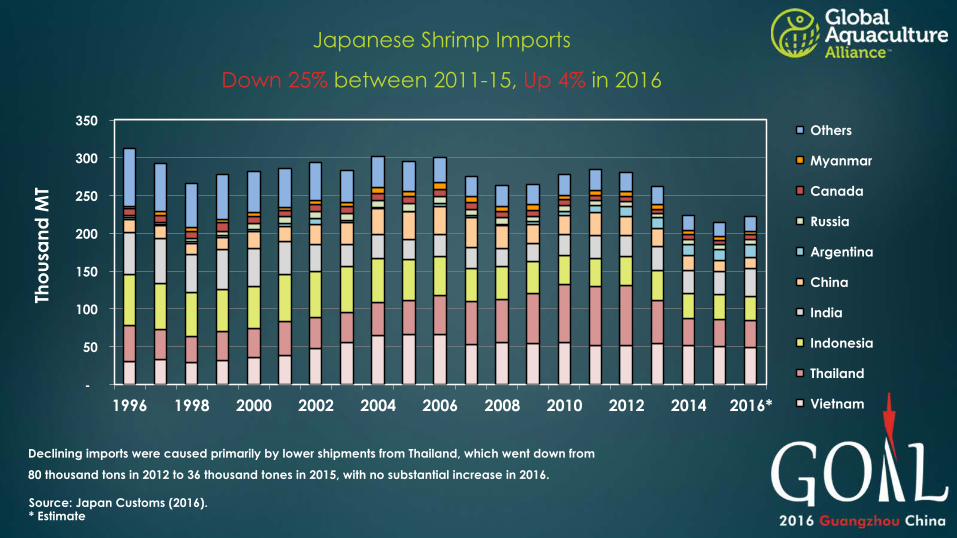
Japanese Shrimp Imports
Down 25% between 2011-15, Up 4% in 2016
Source: Japan Customs (2016). * Estimate
-
50
100
150
200
250
300
350
1996 1998 2000 2002 2004 2006 2008 2010 2012 2014 2016*
Tho
usa
nd M
T
Others
Myanmar
Canada
Russia
Argentina
China
India
Indonesia
Thailand
Vietnam
Declining imports were caused primarily by lower shipments from Thailand, which went down from
80 thousand tons in 2012 to 36 thousand tones in 2015, with no substantial increase in 2016.
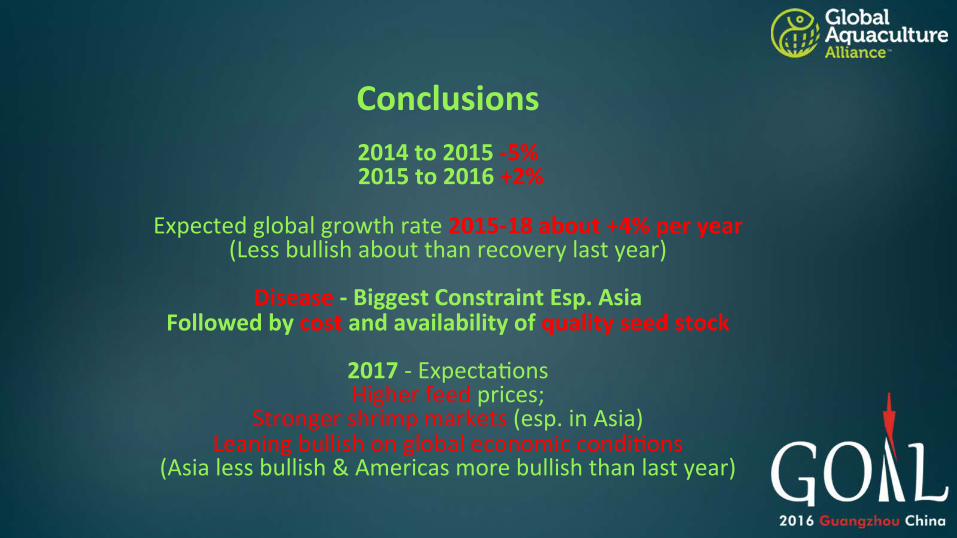
Conclusions
2014 to 2015 -‐5% 2015 to 2016 +2%
Expected global growth rate 2015-‐18 about +4% per year
(Less bullish about than recovery last year)
Disease -‐ Biggest Constraint Esp. Asia Followed by cost and availability of quality seed stock
2017 -‐ Expecta3ons Higher feed prices;
Stronger shrimp markets (esp. in Asia) Leaning bullish on global economic condi3ons
(Asia less bullish & Americas more bullish than last year)


BONUS SLIDES
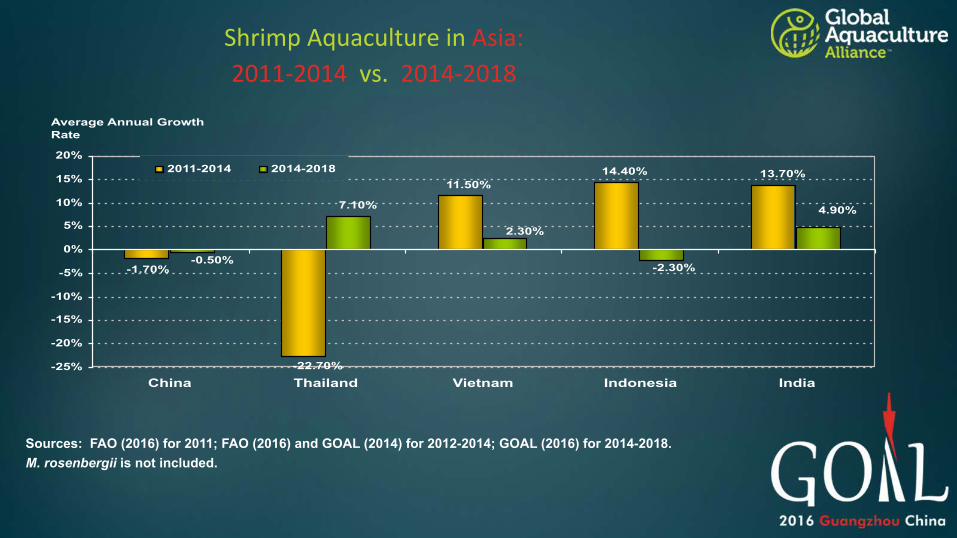
Shrimp Aquaculture in Asia: 2011-‐2014 vs. 2014-‐2018
-1.70%
11.50%14.40% 13.70%
-22.70%
2.30%
4.90%
-2.30%-0.50%
7.10%
-25%
-20%
-15%
-10%
-5%
0%
5%
10%
15%
20%
China Thailand Vietnam Indonesia India
Average Annual Growth Rate
2011-2014 2014-2018
Sources: FAO (2016) for 2011; FAO (2016) and GOAL (2014) for 2012-2014; GOAL (2016) for 2014-2018. M. rosenbergii is not included.
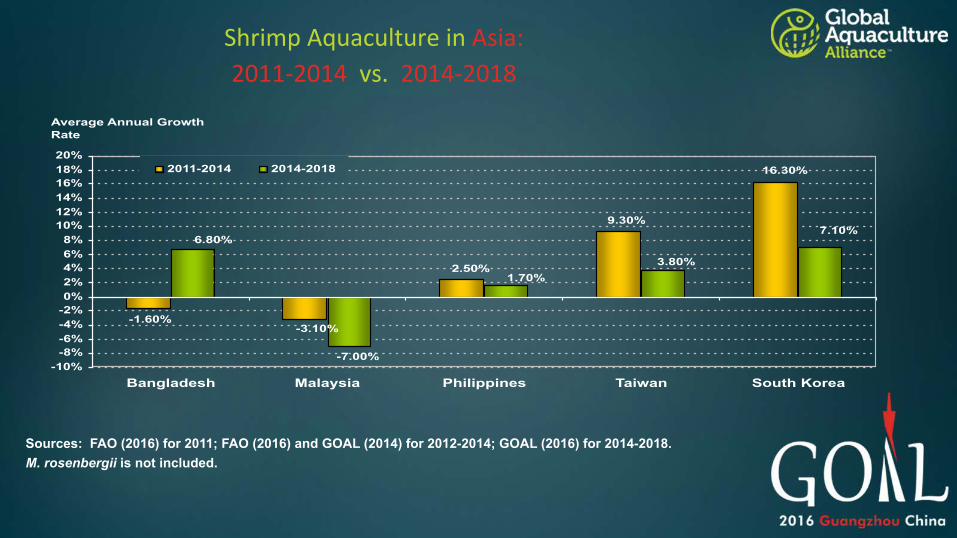
Shrimp Aquaculture in Asia: 2011-‐2014 vs. 2014-‐2018
-1.60%
2.50%
9.30%
16.30%
-3.10%
1.70%
7.10%
3.80%
6.80%
-7.00%-10%
-8%-6%-4%-2%0%2%4%6%8%
10%12%14%16%18%20%
Bangladesh Malaysia Philippines Taiwan South Korea
Average Annual Growth Rate
2011-2014 2014-2018
Sources: FAO (2016) for 2011; FAO (2016) and GOAL (2014) for 2012-2014; GOAL (2016) for 2014-2018. M. rosenbergii is not included.

Composi3on of Shrimp Aquaculture Produc3on by Size Categories –
Comparison of Survey Data for Asia
7% 6% 7% 7% 5% 5%6%
5% 6%18% 16% 14% 17%
9% 9%
8%
10% 9%
29% 30% 30% 23%
15% 16%13%
15% 16%
22% 19% 20% 21%
19% 25% 18%17%
21%
10% 12% 10% 15%
19%18%
15% 21%19%
6% 7% 7%7%
15% 11% 14% 16% 13%
7% 5% 8%5%
12% 12% 13% 11% 10%
0%
20%
40%
60%
80%
100%
GOAL2008
GOAL2009
GOAL2010
GOAL2011
GOAL2012
GOAL2013
GOAL2014
GOAL2015
GOAL2016
>70
61-70
51-60
41-50
31-40
26-30
21-25
15-20
<15
69%
27%
46% 42%
39%
Disease problems in Asia led to the harvesting of smaller sizes since 2011.
42%
48%
65% 64% 61% 43% 50%
41% 42%
46%
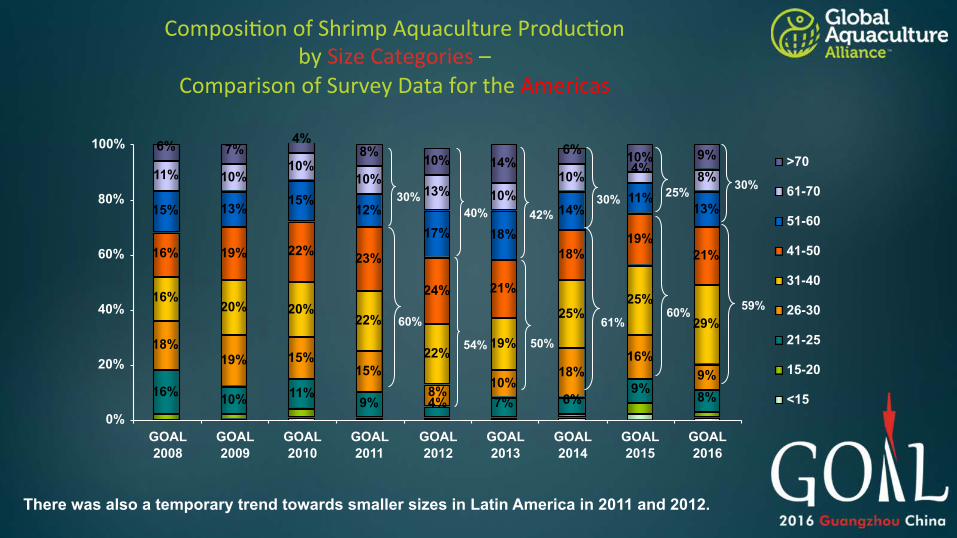
Composi3on of Shrimp Aquaculture Produc3on by Size Categories –
Comparison of Survey Data for the Americas
16% 10% 11%9% 4% 7% 6%
9% 8%
18%19% 15%
15%8% 10%
18%16%
9%
16%20% 20%
22%
22%19%
25%25%
29%
16% 19% 22% 23%
24% 21%
18%19%
21%
15% 13% 15%12%
17% 18%
14%11%
13%
11% 10%10%
10%13% 10%
10% 4% 8%
6% 7%4%
8% 10% 14%6% 10% 9%
0%
20%
40%
60%
80%
100%
GOAL2008
GOAL2009
GOAL2010
GOAL2011
GOAL2012
GOAL2013
GOAL2014
GOAL2015
GOAL2016
>70
61-70
51-60
41-50
31-40
26-30
21-25
15-20
<15
54%
60%
30% 40%
50%
42%
There was also a temporary trend towards smaller sizes in Latin America in 2011 and 2012.
30%
61%
25%
60%
30%
59%
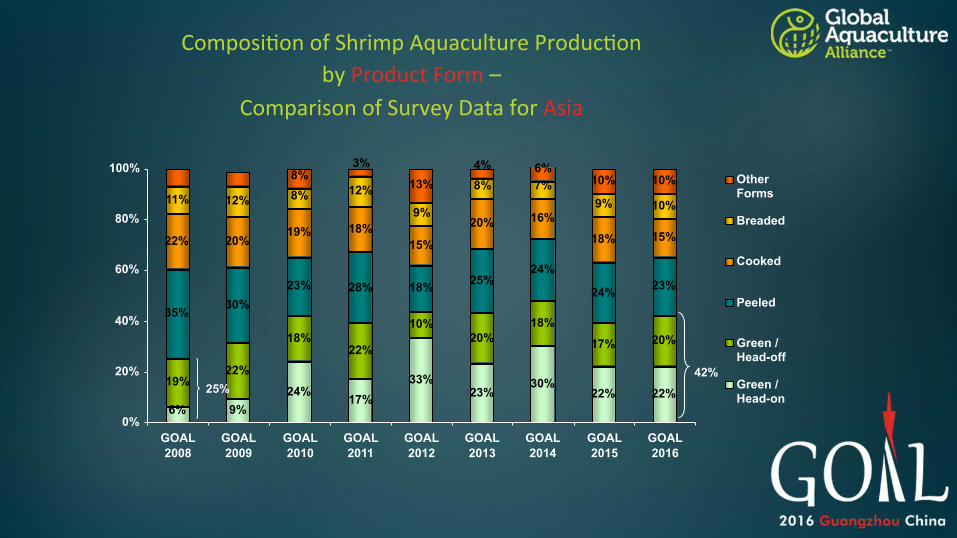
Composi3on of Shrimp Aquaculture Produc3on by Product Form –
Comparison of Survey Data for Asia
23%30%
22% 22%
20%18%
17% 20%
35% 30%23% 28% 25%
24%
24% 23%
22% 20%19% 18% 20% 16%
18% 15%
11% 12% 8% 12% 8% 7%9% 10%
8%3% 4% 6%
10% 10%
33%
6%17%24%
9%
10%
19%
22%18%
22%
18%
15%
9%
13%
0%
20%
40%
60%
80%
100%
GOAL2008
GOAL2009
GOAL2010
GOAL2011
GOAL2012
GOAL2013
GOAL2014
GOAL2015
GOAL2016
OtherForms
Breaded
Cooked
Peeled
Green /Head-off
Green /Head-on
25% 42%
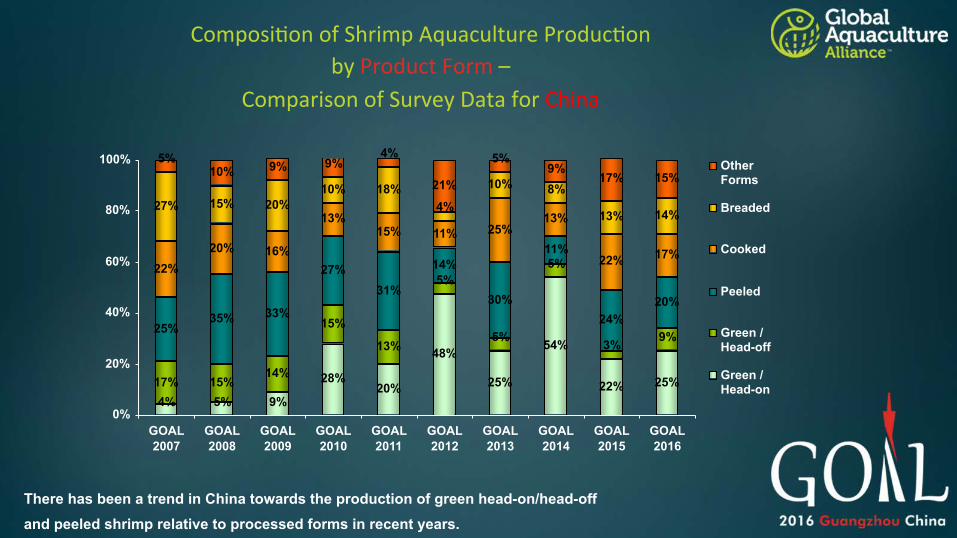
Composi3on of Shrimp Aquaculture Produc3on by Product Form –
Comparison of Survey Data for China
4% 5% 9%
28%20% 25%
54%
22% 25%17% 15%14%
15%
13%5%
5%
3% 9%25%35% 33%
27%31%
30%
11%
24%20%
22%20% 16%
13%15% 25%
13%
22% 17%
27% 15% 20%10% 18% 10% 8%
13% 14%
5%10% 9% 9%
4% 5%9%
17% 15%
48%
5%14%
11%
4%
21%
0%
20%
40%
60%
80%
100%
GOAL2007
GOAL2008
GOAL2009
GOAL2010
GOAL2011
GOAL2012
GOAL2013
GOAL2014
GOAL2015
GOAL2016
OtherForms
Breaded
Cooked
Peeled
Green /Head-off
Green /Head-on
There has been a trend in China towards the production of green head-on/head-off and peeled shrimp relative to processed forms in recent years.
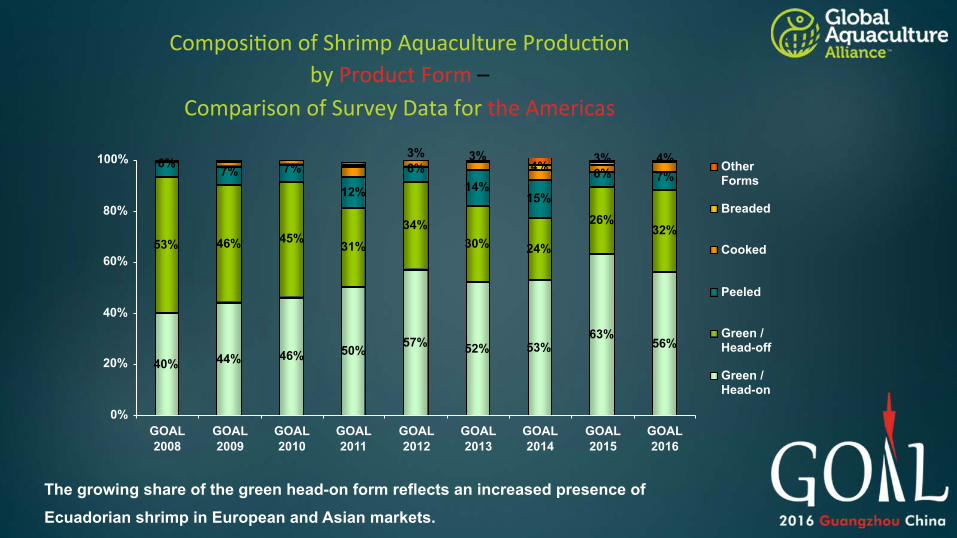
Composi3on of Shrimp Aquaculture Produc3on by Product Form –
Comparison of Survey Data for the Americas
40% 44% 46% 50% 57% 52% 53%63%
56%
53% 46% 45% 31%
34%30% 24%
26%32%
6% 7% 7%
12%
6%14%
15%
6% 7%
3% 3%4% 3% 4%
0%
20%
40%
60%
80%
100%
GOAL2008
GOAL2009
GOAL2010
GOAL2011
GOAL2012
GOAL2013
GOAL2014
GOAL2015
GOAL2016
OtherForms
Breaded
Cooked
Peeled
Green /Head-off
Green /Head-on
The growing share of the green head-on form reflects an increased presence of
Ecuadorian shrimp in European and Asian markets.