should term limits be applied to analytical detection? term limits be applied to...should term...
TRANSCRIPT
Should Term Limits Be
Applied to Analytical
Detection?
Richard R. Rediske, Ph.D.
Annis Water Resources Institute
Grand Valley State University
Presented by Robert Avery,
Chief, MDNRE Laboratory Services
Do we have too many terms
for Detection Limits and
Quantitation Limits?
What the “L” is the problem?
The Year Was 1968
Problems with Detection Limits
Concepts First Discussed in 1968
“The occurrence in the literature of numerous, inconsistent and limited definitions of a detection limit has led to a re-examination of the questions of signal detection and signal extraction in analytical chemistry and nuclear chemistry. “
• Currie, L. A. (1968), “Limits for Qualitative Detection and Quantitative Determination,” Analytical Chemistry, 40, 586–593.
Detection Limit Problems are
compounded due to Regulatory Issues
“There is a urgent need for answers…a
growing number of regulations and
recommendations of the European
Community concerning limits for trace
constituents in food, water, air, and soil…
have methods that lack reliable
background information on detection
limits.”
(E. Hartmann, 1989. Detection capability of analytical
methods, Fresenius Z. Anal. Chem., 335: 954-959)
Detection Limits still are a problem
in the late 90s“The meaning of 'detection limits' is perhaps clear to all, in
a qualitative sense. That is, the detection limit is commonly accepted as the smallest amount or concentration of a particular substance that can be reliably detected in a given type of sample or medium by a specific measurement process. Within such a general definition, however, lurk many pitfalls in terminology, understanding, and formulation, that have led to several decades of miscommunication among scientists and between scientists and the public.”(Currie 1997. Detection: International update, and some emerging di-lemmas involving calibration, the blank, and multiple detection decisions Chemometrics and Intelligent Laboratory Systems, 37 (1) 151-181)
Standard Methods 1997
Detection Limit Assistance ChartCRDL Minimum level of detection acceptable under the contract Statement of Work (SOW). The inorganic SOW for
the Contract Laboratory Program gives CRDLs, but laboratory-derived IDLs (adjusted for sample size, dilution and moisture) are used for reporting limits.
CRQL Minimum level of reliable quantitation acceptable under the contract Statement of Work (SOW). The organic SOW for the Contract Laboratory Program gives CRQLs, and they are used for reporting limits (after adjustment for %moisture and dilution).
EDL Minimum concentration required to produce a specified signal-to-noise (S/N) ratio. The SW-846 Method 8290 for dioxins/furans by GCMS requires that EDLs be used for reporting limits. The EDLs are explicitly determined by the laboratory for each analyte in each sample. The noise in the vicinity of the absent analyte is measured then multiplied by a S/N ratio of 2.5. This labor-intensive procedure is used in order to obtain the lowest possible reporting limits for these highly toxic compounds.
EQL Lowest concentration that can be reliably achieved within specified limits of precision and accuracy during routine laboratory operating conditions. EQLs normally are arbitrarily set rather than explicitly determined. Most organic SW-846 methods give EQLs. The SW-846 EQLs are arbitrarily set at some multiple of typical MDLs for reagent water. Multiplying factors are given for various matrices such as groundwater, wastewater, soil and sludge, etc. Generally, laboratories use the SW-846 EQLs (adjusted for sample size, dilution, and %moisture) for reporting limits, but they may use EQLs that they have generated.
IDL Lowest concentration that can be detected by an instrument without correction for the effects of sample matrix or method-specific parameters such as sample preparation. IDLs are explicitly determined and generally defined as three times the standard deviation of the mean noise level. This represents 99% confidence that the signal is not random noise. The inorganic methods in CLP, SW-846, EPA 200 series, and Standard Methods all give typical IDLs, but laboratory-derived IDLs (adjusted for sample size, dilution, and %moisture) are used for reporting limits. The IDL does not include the upward correction necessary to account for the effects of sample matrix or handling/ preparation (minimal for inorganic water analyses).
LLD Generally the same as IDL
LLQ Generally the same as EQL
LOD Generally the same as IDL
LOL Concentration at or above the upper end of the calibration curve at which the relationship between the quantity present and the instrument response ceases to be linear.
LOQ Generally the same as EQL
MDC Generally the same as MDL
MDL Lowest concentration that can be detected by an instrument with correction for the effects of sample matrix and method-specific parameters such as sample preparation. MDLs are explicitly determined as set forth in 40 CFR Part 136. They are defined as three times the standard deviation of replicate spiked analyses. This represents 99% confidence that the analyte concentration is greater than zero. The organic methods in the EPA 500 series, EPA 600 series, and Standard Methods all give typical MDLs for clean water samples. Generally these clean-water MDLs (corrected for %moisture, sample size, and dilution) are used for reporting limits, but the laboratory may use MDLs that they have generated. MDLs generated by the laboratory using the sample matrix of interest are the most reliable. If the clean-water MDLs are used, remember that they do not include all of the upward correction necessary to account for the effects of sample matrix.
MQL Generally the same as EQL
PQL Generally the same as EQL. This term was used in SW-846 prior to 1994.
SDL The MDL adjusted to reflect sample-specific actions such as dilution or use of smaller aliquot sizes, or to report results on a dry-weight basis.
SQL The EQL adjusted to reflect sample-specific actions such as dilution or use of smaller aliquot sizes, or to report results on a dry-weight basis. One exception applies for the TRRP (Texas Risk Reduction Program) Guidelines for Review and Reporting of COC Concentration Data (TRRP-13). The term SQL, as defined in this document and the relevant rule, is analogous to the Sample Detection Limit (SDL).
UCL Highest concentration that can be reliably measured within specified limits of precision and accuracy during routine laboratory operating conditions. Specifically defined as the concentration of the highest calibration standard in the laboratory's initial calibration curve adjusted for initial sample volume or weight.
Published in Environmental
Protection Magazine, 10,
37-41, (May, 1999)
The more you
read, the more
confused you
get!
The authors
invented the new
term - HMACTTO
(HOW MANY
ACRONYMS CAN
THEY THINK OF)
What has happened in the last 10
years?
• Over 700 peer reviewed articles on
detection limits in environmental, medical,
forensic, statistical, and quality assurance
journals.
• Dozens of new terms such as
Characteristic Limit (the concentration
where the variances of background noise
and analytical error are equal; Berthouex
and Gan 1993) were proposed.
What has happened in the last 10
years?
• At least 100 new statistical treatments for
determining detection limits have been
proposed (eg. Traldi 2006: quadratic
calibration curves with inverse
regressions; Parker 2002”: root mean
square method with multiple calibration
curves; Yang et al. 2005: multipoint fitting
of RSD at different concentrations; Daniels
and Yin 2006: Bayesian statistics)
Detection Limit Procedure Development
Detection Limit Procedures rely on Models that:
• Are Based on Statistical Assumptions (normality, constant variance, sample size, etc)
• Are often developed and calibrated to specific data sets selected by the developer
You only need one or two data sets to publish a paper
Find a data set that does not fit, develop a new a new procedure for the data that works, publish another paper
The possibilities are endless!

Recent News on Models
• Models of volcanic ash from the eruption in Iceland grounded air travel. Model data proven false by actual measurements.
• Hacked emails show that leading climate scientists “adjusted” temperature data to fit the model.
• New supercomputer studies suggest it is "very likely" ocean currents will carry oil from the Deepwater Horizon spill in the Gulf of Mexico around the tip of Florida and thousands of miles up the U.S. East Coast researchers announced Thursday. Using a $100 million computer model of the world's ocean-circulation patterns, the simulations show a strong Loop Current almost inevitably will pull the oil into the powerful Gulf Stream. It would then travel up the Atlantic coast at a speed of about 100 miles a day
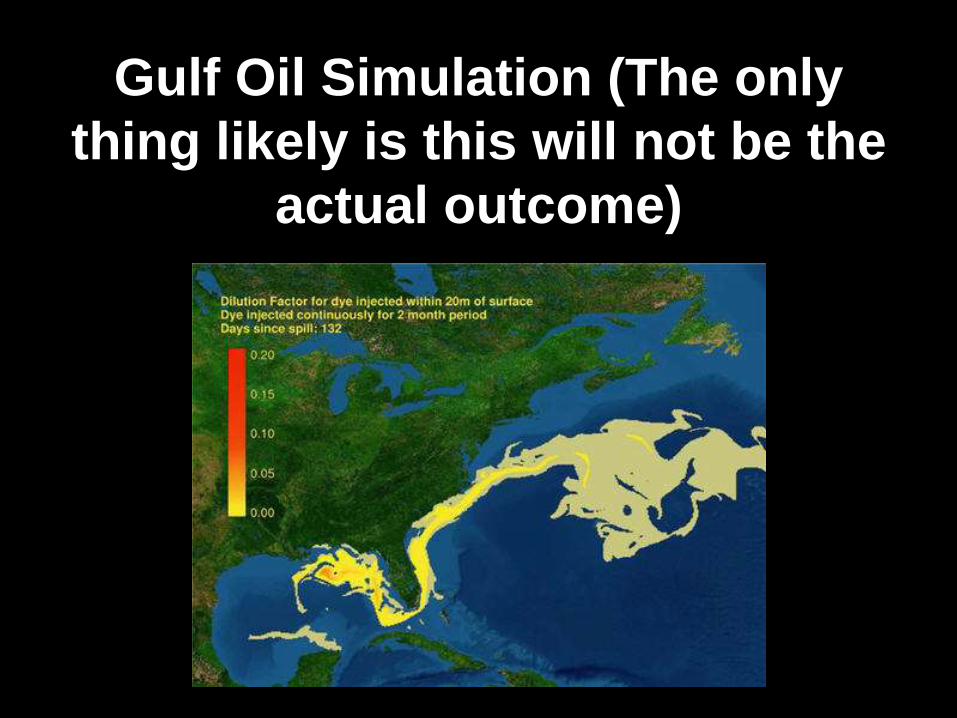
Gulf Oil Simulation (The only
thing likely is this will not be the
actual outcome)
Moral of the Story
• Even the best and most advanced
models are only as good as the
assumptions made and the data
used!
How do deal with the information
overload on detection limits?
A Better Approach
(One small bite at a time)
Why are detection limits a big deal?
• CWA, SDWA, and RCRA compliance decisions are based on the presence/absence of pollutants
• High costs associated with non compliance
• High costs to labs trying to comply with multiple programs with different detection limits
• No uniform statistical approach between regulatory programs
What makes detection limits a
really big deal?
• Parameters with low Water Quality Based Effluent Limits (eg PCBs and Hg) where no discharge is permitted (0).
• “In many cases the lay public believes, given sufficient effort or funding, that a concentration of zero may be detected and/or achieved. Not unlike the third law of thermodynamics, however, neither is possible, even in concept.”
• Currie 1998
What makes detection limits a
really big deal?
• Censored results < DL are problematic in the
analysis of data in the fields of medicine,
astronomy, occupational health, and
environmental science
• The link between asbestos in brake linings
and lung cancer in mechanics was missed
because of censored detection limits.
(Helsel D. 2010. Much ado about next to nothing: incorporating
nondetects in science. Ann Occup Hyg 54:257–62.)
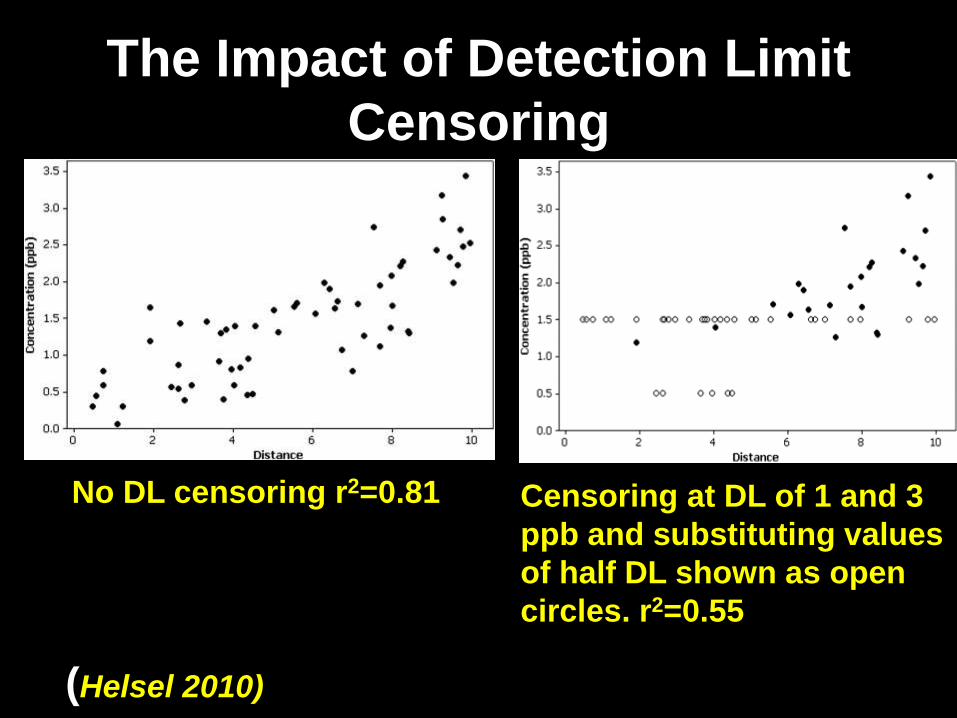
The Impact of Detection Limit
Censoring
(Helsel 2010)
No DL censoring r2=0.81 Censoring at DL of 1 and 3
ppb and substituting values
of half DL shown as open
circles. r2=0.55
What should be Done
• Let science be science and continue the discovery process. (Most academics need 2 publications per year to justify their existence)
• If and when a useful procedure is developed, it will need to go through many hoops to impact the analyst.
• Learn some basic statistics to understand the assumptions and uncertainties inherent in models.
• Focus on improvements to methods and QA/QC that enhance data quality,
Regulatory and Bench Level Actions
Get rid of the 0 discharge expectation• Recognize that a detection limit estimation
procedure will not get you a lower reporting limit
• In fact most procedures that properly address statistical concerns and variability over time yield higher DLs than the MDL
• Invalid data between DL and QL serves no scientific purpose
• Labs should be reporting at a verifiable LOQ and not an annual MDL
Look to methods to provide
lower DLs
• Improvements to analytical methods such as cleanups, extraction and concentration techniques will get you part way
• Extracting acids first and/or using continuous L/L extraction greatly improves the recovery of phenols
• New technology will get you closer (Hg by Cold Vapor Atomic Absorption vs Atomic Fluorescence
Replace PCB aroclor based methods
with congener specific ones
• Pattern recognition adds considerable complexity to detection limits
• PCBs are old compounds (banned for 40 years) and degradation/partitioning process continue to alter the aroclor pattern
• Congener specific ECD, GC/MS-NCI, and GC/MS-high resolution have been in existence for 40 years and used worldwide in over 1000 peer reviewed journal articles
Get rid of poor performing compounds
that do not work with the method with
which they are paired with
The Federal Advisory Committee
recommended minimum Measurement
Quality Objectives
• Precision ≤ 30% RSD
• Accuracy (measured as recovery for
single determination) = 20-180%
• False Negative rate ≤ 10%
• Ratio of Accuracy to Precision must be no
less than 1.0
• EPA casted the only no vote???
MDL Needs to be Replaced
Assumes constant variance which often is not the case.
• Spike at a higher level with less variability, get a low MDL
• Spike at a low level with more variability and get high MDL.
• MDL studies can be artificially optimized using instrument conditions and spiking and preparation factors to provide very low MDLs.
• Just like calibration curves, they will vary over time.
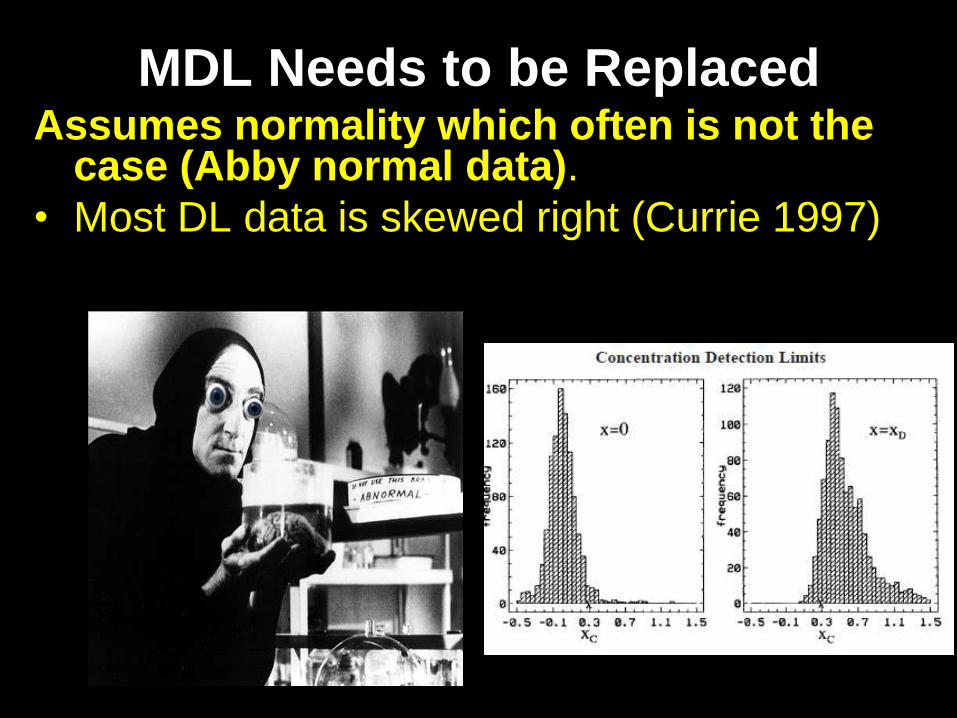
MDL Needs to be ReplacedAssumes normality which often is not the
case (Abby normal data).
• Most DL data is skewed right (Currie 1997)
MDL Needs to be Replaced
• Can vary by instrument, analyst, lab, and over time
• Short term standard deviation is the same as long term standard deviation
• There is no blank contamination
• Performed in DI water and does not consider matrix effects
• Costly event that produces little meaningful data over
Key Issues
• The MDL does not incorporate and apply
Data Quality Objectives for bias, precision,
representativeness, and comparability for
lab and method performance at the
detection and quantitation limits used in
CWA programs, at all levels and
frequencies of operations that can
influence data use and interpretation
relative to detection and quantitation limits.
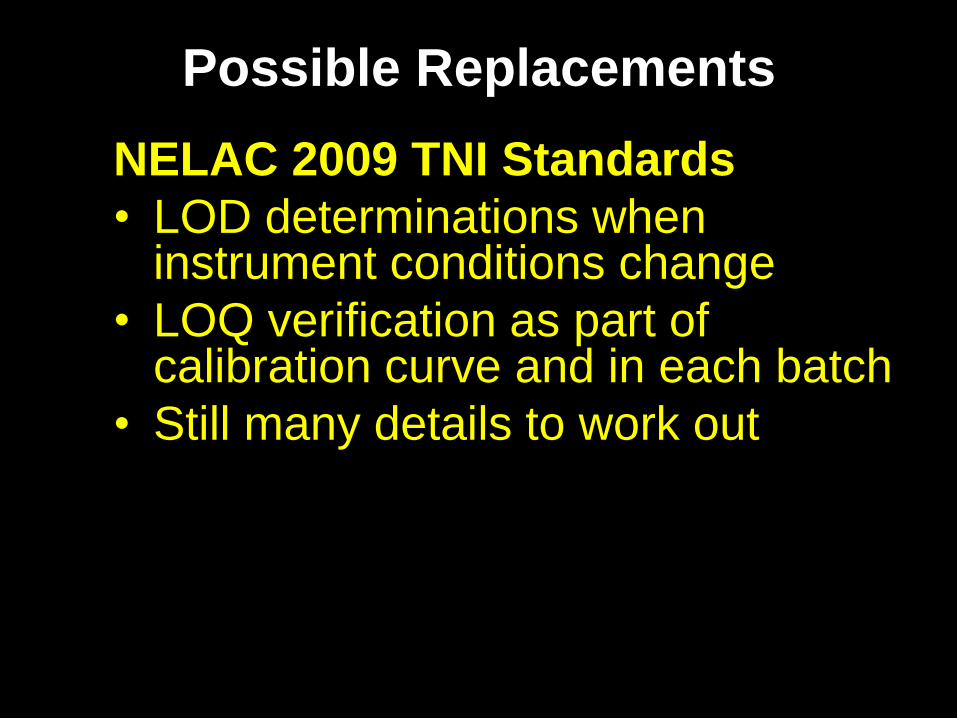
Possible Replacements
NELAC 2009 TNI Standards
• LOD determinations when instrument conditions change
• LOQ verification as part of calibration curve and in each batch
• Still many details to work out
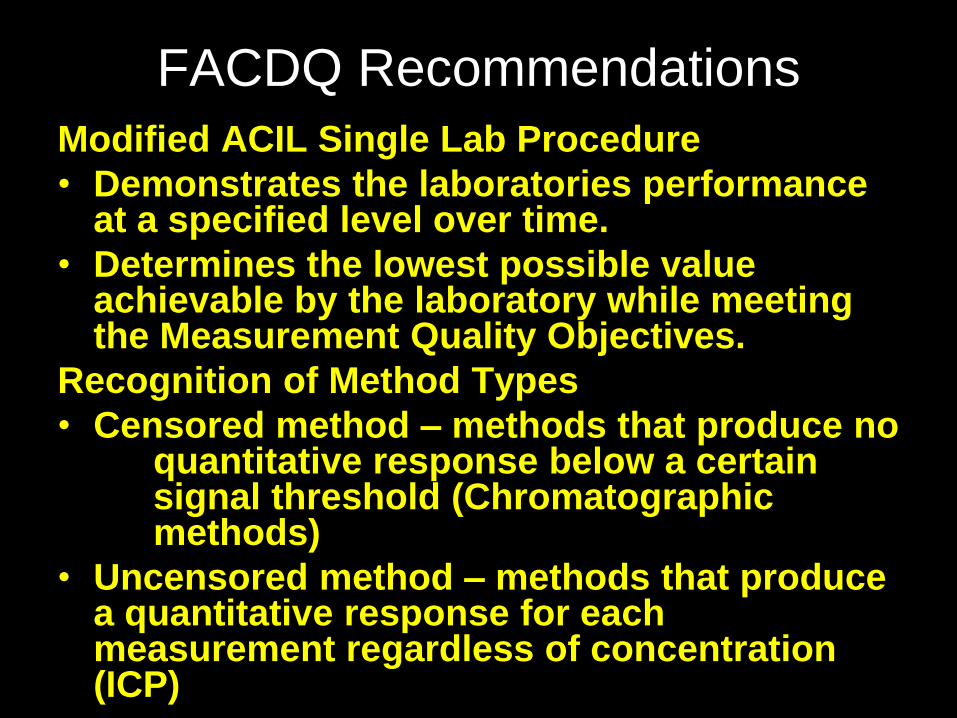
FACDQ Recommendations
Modified ACIL Single Lab Procedure
• Demonstrates the laboratories performance at a specified level over time.
• Determines the lowest possible value achievable by the laboratory while meeting the Measurement Quality Objectives.
Recognition of Method Types
• Censored method – methods that produce no quantitative response below a certain signal threshold (Chromatographic methods)
• Uncensored method – methods that produce a quantitative response for each measurement regardless of concentration (ICP)

We must chose wisely!