short-period variations in the distribution of incomes
TRANSCRIPT

Short-Period Variations in the Distribution of IncomesAuthor(s): Hans StaehleSource: The Review of Economics and Statistics, Vol. 19, No. 3 (Aug., 1937), pp. 133-143Published by: The MIT PressStable URL: http://www.jstor.org/stable/1927344 .
Accessed: 28/06/2014 10:14
Your use of the JSTOR archive indicates your acceptance of the Terms & Conditions of Use, available at .http://www.jstor.org/page/info/about/policies/terms.jsp
.JSTOR is a not-for-profit service that helps scholars, researchers, and students discover, use, and build upon a wide range ofcontent in a trusted digital archive. We use information technology and tools to increase productivity and facilitate new formsof scholarship. For more information about JSTOR, please contact [email protected].
.
The MIT Press is collaborating with JSTOR to digitize, preserve and extend access to The Review ofEconomics and Statistics.
http://www.jstor.org
This content downloaded from 193.142.30.37 on Sat, 28 Jun 2014 10:14:12 AMAll use subject to JSTOR Terms and Conditions
SHORT PERIOD VARIATIONS IN THE DISTRIBUTION OF INCOMES
INDIVIDUAL AND MARKET FUNCTIONS
M ANY fundamental economic "laws" are usually established, not with direct refer-
ence to the phenomena of the market-though in most cases they could be without serious loss-but with reference to small individual units. Thus, the "law of demand" is obtained, e.g., by Marshall,' from the consideration of the. decreasing marginal utility curves of individ- uals; Divisia2 derives the law of supply from the cost functions of individual enterprises; and Keynes3 obtains the "propensity to consume" from the "fundamental psychological law" that "men are disposed, as a rule and on the aver- age, to increase their consumption as their in- come increases, but not by as much as the in- crease in their income"-where "men" are again individuals.
Once these functions have been established for small individual units, to which they gen- erally apply with a high degree of plausibility, the market curves are obtained from the indi- vidual functions by a process of summation. And it is these "compounded" curves which supply the basis for the rest of the reasoning.
Most writers insist that the factors which rule the functions of the individuals are relatively stable and deep-rooted enough to assume that they do not vary in the short period.4 They take this as a sufficient justification to use their mar- ket curves as if the characteristics of the indi- vidual curves (e.g., elasticity or slope) applied without modification to the curve of the market. It is not always realized that the summation process involved in obtaining the market curves is not so simple and free from special assump- tions as it looks at first.
THE IMPLICATIONS OF THE COMPOUNDING PROCESS
Let us first consider the case of demand curves. Here it is easy to show that the elastic- ity of the market curve is a weighted average of the elasticities of the individual demand curves out of which it is "compounded," where the weighting must be done according to the share which each individual accounts for in the quan- tity taken by the market.5 Therefore, unless the individual elasticities are all identical and con- stant all along the individual demand curves- which is, of course, very different from assuming them constant in time-a changed distribution in the quantities consumed by the different in- dividuals will in principle, even if the total quantity taken by the market and the price do not vary, cause a change in the elasticity of the market curve. Obviously, then, the market curve can be constant only if the distribution of the individual units in the market with respect
I Alfred Marshall, Principles of Economics, 8th ed. (London, 1925), pp. 92 et seq.
2 Frangois Divisia, Economique rationnelle (Paris, 1928), pp. I26-37.
The General Theory of Employment, Interest, and Money (London, I936), p. 96.
.4See, for instance, Divisia, op. cit., p. 128, and Keynes, op. cit., p. 97. Marshall derives his demand curves under the explicit assumption that other things remain equal, and that "we do not suppose time to be allowed for any alteration in the character or tastes of the man himself" (op. cit., p. 94).
The proof is simple. I have given it in Econometrica, n (1934), pp. 357-58: Let the quantities qo and q, of a given article consumed by two individuals 0 and I depend on any independent variable x (say, price, or income) and
qo = fo(x); q, = f1(x) be-the functions describing this dependence, and write
fo(x) +fi(x) = F(x)
for the resulting market curve when they are compounded. The individual curves will have the elasticities:
dfo(x) x dfi(x) x 70 dx - and 1 dx fi(x)
The elasticity of the market curve then is dF(x) x
dx F(x) d [fo(x) + fi(x)] x
dx F(x) dfo(x) x dfi(x) x
dx F(x) dx F(x)
which becomes by factoring dfo(x) x fo(x) dfi(x) x fi(x)
dx fo(x) F(x) dx f(x) F(.x)
= [no *fo(x) + 7f1 fi(x)] 1
F(x)
This is a weighted average of no and no, the weights being the quantities consumed at any given value of x. The proof holds for any number of individual curves.
[ I33 1
This content downloaded from 193.142.30.37 on Sat, 28 Jun 2014 10:14:12 AMAll use subject to JSTOR Terms and Conditions
I34 THE REVIEW OF ECONOMIC STATISTICS
to the quantities consumed by them remains the same. And since individual income is the main and no doubt the most variable factor which may be responsible for a change in the individ- ual quantity consumed, when price remains un- changed, this implication practically amounts to the assumption that the frequency distribu- tion of incomes according to size remains un- altered over the period for which the market curve is considered constant.
Among the writers who have realized this, we must first mention Cournot who, though not de- riving his demand curves from the demand functions of individuals, said in I838 that the law of demand evidently depends, among other things, "on the average wealth and on the scale on which wealth is distributed,"1 a statement which he repeated in i863.2 In this latter year, H. v. Mangoldt, commenting on his graphical analysis of demand and supply curves, drew at- tention to the influence of the distribution of wealth upon the shape of demand curves: with an equal distribution of wealth, he said, demand curves would ceteris paribus be more convex up- ward than in the case where wealth was concen- trated in a few hands.3 As to Marshall, he derives his general rule of variation of the elas- ticity of demand (i.e., along the curve) by con- sidering one class of society at a time, by which in fact, however, he means not different social, but different income, classes.4 He also recognizes that it is the large share of working class con- sumption in the total quantity consumed which makes the aggregate demand very elastic, if the workers' demand is such.' Nevertheless, he does not make it clear to the reader that, among the other things which are assumed equal when one reasons in terms of the elasticity of demand, the distribution of incomes occupies an important place. Pareto, the author of the earliest attempt at describing the frequency-distribution of in- comes by an analytical formula, significantly enough presented his "courbe des revenus" for
the first time in an article on 'the law of de- mand";6 and in I897 he wrote that "the dis- tribution of incomes is one of the principal circumstances which must be taken into ac- count in order to know the laws which really govern supply and demand."7
More recent writers have been more explicit. Lenoir, for instance, says and proves with great detail that the shape of the market demand curve depends both on the shape of each indi- vidual curve and on the way in which the total consumption is distributed among the individ- ual consumers.8 And Marschak, whose problem was the combination into a market curve of indi- vidual functions connecting quantity and in- comne, also explicitly shows that each individual curve must, for this purpose, be weighted ac- cording to the relative frequency of the income of the individual in question.9
REASONS FOR NEGLECTING CHANGES IN THE DISTRIBUTION OF
INCOMES This brief review does not pretend to be com-
plete. It does show, however, that the influence of the income distribution upon the fundamen- tal market curve of demand, one of the princi- pal tools of economic reasoning, has been recognized by some of the best authors. How, then, must it be explained that in the vast literature dealing with the statistical measure- ment of demand curves-not to speak of their theoretical treatment-there is practically no attempt to take account of the distribution of incomes?'0
The explanation is simple. Pareto, whose "courbe des revenus" is no doubt the most popular device for describing income distribu- tions, has himself drawn the well-known con- clusion from the application of his tool to various materials that the inequality in the size-distribution of incomes is independent of
I Recherches sur les Principes MatWhematiques de la Theorie des Richesses (Paris, I838), p. 5o.
2 Principes de la Thtorie des Richesses (Paris, I863), p. I03: "(La loi de la demande) ... tient essentiellement ... au mode de repartition de la richesse, a I'aisance,... (etc.)."
3 Grundriss der Volkswirtschaftslehre (Stuttgart, I863), p. 49. In later editions, the graphical treatment of demand and supply no more appears. It was suppressed by Klein- wachter, who edited them.
4 Op. Csit., p. I03. ' Ibid., p. I05.
6 "La legge della domanda", Giornale degli Economisti, xxxv (i895), pp. 59-68.
7Cours d'Economie Politique (Lausanne, I897), Vol. II, P. 33I.
8 Marcel Lenoir, Etudes sur la Formation et le Mouvement des Prix (Paris, I913), pp. 34 et seq., and similarly, as regards the market supply function, pp. 47 et seq.
9 Die Elastizitit der Nachfrage (Tiubingen, 193I), especially pp. 82 et seq.
10 The only exception, I am sorry to say, seems to be my own Die Analyse von Nachfragekurven in ihrer Bedeutung filr die Konjunkturforschung (Bonn, 1929).
This content downloaded from 193.142.30.37 on Sat, 28 Jun 2014 10:14:12 AMAll use subject to JSTOR Terms and Conditions
SHORT-PERIOD VARIATIONS IN THE DISTRIBUTION OF INCOMES I35
time and place.' Furthermore, statistical in- vestigation has shown that the distribution of incomes as between the different factors of pro- duction is practically stable over long periods of time; such statements, for instance, as Bow- ley's that "the constancy of so many of the proportions and rates of movement found in the investigation" (of "The Change in the Distribu- tion of the National Income, I880-i9I3") "seems to point to a fixed system of causa- tion and has an appearance of inevitableness"2 may easily be understood as a confirmation of Pareto's conclusion that the size-distribution of incomes must also be very stable.
It is thus not surprising that even those writers who clearly saw the importance of the income-distribution as a determining factor of market demand have not made any effort to deal with its influence in any way: they took it among the "other things" which must be made to remain "the same" in order to discover the correct elasticity-indeed, to be one of those which could quite safely be relied upon as fulfilling this condition.3
Unfortunately, however, Pareto's contention is not acceptable. He had based his statement on the fact that the values of a (the slope of his famous line) which he had obtained for a wide variety of cases showed what he considered to be only small and negligible variations.4 Against this it must be held that the a-values which he himself shows do as a matter of fact fluctuate in quite considerable proportions, and that even very small variations of a correspond to very important changes in the income-distribution, as has been shown by Corrado Gini.5
If this paper were intended merely to offer some "literary" remarks, it would at this place be necessary to go into a detailed consider- ation-in terms of Gini's a-of the question to what extent Pareto's a efficiently serves the pur- pose of describing what is essential in income- distributions from the point of view of their influence upon demand or other market curves; and then to go on accusing this author or that of having neglected important things. It is, however, thought more constructive and at the same time more convincing now to pass on to a statistical investigation-which also relates more closely than the above considerations to the special field of this REVIEW, the problems of the business cycle.
THE GERMAN STATISTICS OF THE DISTRIBUTION OF LABOR
INCOME This statistical investigation will show two
things: (i) that the distribution of incomes for a large section of an industrial community was found not to be constant in the short period, and (2) that its fluctuations are an important, and even an indispensable, element in explain- ing the short-period changes in the "propensity to consume."
For this purpose, statistics are required which give the distribution of incomes for a series of dates as closely adjacent as possible. The usual material employed for measurements of the in- come-distribution, i.e., income-tax figures, are available at yearly intervals only. Furthermore, the period to which they actually relate is not identical for all incomes included in the records, and it can only be given approximately. Finally, this -type of statistics excludes all tax-exempt persons, so that large sections of the community are left out of account. For this reason, recourse has been had to a series of distributions which, though also including only a part of the popula- tion, relate to a sufficient number of consecu- tive shorter time intervals, and which further for each such time interval combine incomes that have actually been received, and most probably also been spent, during the specified time intervals only.
These statistics are available as a by-product of the German invalidity-insurance scheme. The amount of the weekly contributions to this insurance (which incidentally is compulsory for
1 Cours d'Economie Politique, Vol. II, p. 3I2. 2 Arthur L. Bowley, The Change in the Distribution of the
National Income, x88o-z913 (Oxford, 1920), P. 20. In an article on "Individual Shares in the National Income" (this REVIEW, XVII, November, 1935, PP. II6-30), W. L. Crum found that, although the degree of inequality in the distribution of wage and salary incomes and of dividend in- comes showed only small or even negligible variations, there was a strong presumption that significant cyclical changes oc- curred in the combined income of individuals.
8 See, e.g., Marschak, op. cit., p. 84, footnote: "Pareto's formula is nevertheless interesting, because it shows that a considerable amount of stability of the income distribution can be counted upon even when other conditions are changing strongly."
4 Cours d'Economie Politique, Vol. I, p. 3I2. 5 Corrado Gini, "Indici di concentrazione e di dipqndenza,"
Biblioteca dell'Economista, sa serie, xx (1922), pp. 39-40. See also V. Furlan, "Neue Literatur zur Einkommensvertei- lung in Italien," Jahrbilcherfilr Nationalokonomie und Statistik, XCVII (I9I I), PP. 247-88.
This content downloaded from 193.142.30.37 on Sat, 28 Jun 2014 10:14:12 AMAll use subject to JSTOR Terms and Conditions
I36 THE REVIEW OF ECONOMIC STATISTICS
all wage earners) depends for each insured per- son on his weekly gross earnings. For this pur- pose, several classes are distinguished. It is possible, therefore, to calculate from the fre- quency of the weekly contributions in each class the number of insured persons having incomes that fall within specified size-limits. The dis- tribution of the contributions was published for every month of the years I927-29, but it is available only for every quarter since I930. In I927, however, a change was introduced in the contribution rates, and a general revision of past contributions took place, which entirely upset the figures for that year. Thus the material can be used only' since 1928, by quarters.'
The total number of persons covered was in I928 about i8 millions.2 This includes the un- employed, for whom contributions must be paid, though' not for each week, by the unem- ployment insurance funds; and the class in which these contributions must be made roughly corresponds to the actual incomes (benefits) of the unemployed.3 The persons included in the statistics in I928 accounted for almost 6o per cent of the total number of recipients of private incomes;4 and their income in I929, for about one-third of the total amount of private in- comes.5
Though it only relates to a section of the Ger- man economy, this material offers a unique op- portunity to test whether Pareto's conclusion, that the size-distribution of incomes is very stable, is true for the short period. If measure- ment should reveal a considerable variability of the essential characteristics of the income- distribution among wage earners, then it is very likely that a measurement covering all income-
recipients would show the total distribution to be at least as variable.
A NEW MEASURE OF THE, INEQUALITY OF INCOME
DISTRIBUTIONS The next question to be solved is what meas-
ure should be used in order to describe our dis- tributions. The very nature of the figures would make it impossible, apart from the grave theoretical objections to which it is open, to use Pareto's "courbe des revenus." In fact, the fre- quency-distributions for the earlier years have more than one mode, which fact at -the same time discards all measures that are derived as the parameters of some simple analytical for- mula (like, e.g., Gibrat's).6 For this reason, only such measures of concentration or "inequality" could be considered which are independent of any interpolation formula, and which do not raise the question of the goodness of fit.
After careful consideration not only of the theoretical value of various formulae but also of the material to which they had to be applied and of the labor involved in their calculation, a measure proposed to the present writer by H. Mendershausen (Geneva) was adopted. This measure is the ratio of (i) the difference be- tween (a) the median income in the cumula- tion7-for brevity, the cumulative median-and (b) the ordinary median income to (2) the cu- mulative median income.8
This measure which has been baptized d may vary from zero to unity. When it is zero, the two medians coincide, i.e., all incomes are neces- sarily of the same size; when it becomes unity, the ordinary median must be zero, i.e., at least half of the incomes must be of amount naught. ,B is thus a measure which increases when the
The data are published currently in the "Amtllche Nach- richten fur Reichsversicherung" (Reichsarbeitsblatt, Teil iv). The quarterly figures since the first quarter of I93I are con- veniently reproduced in Konjunkturstatistisches Handbuch I936 (Berlin, I935), p. 97.
2 "Die Sozialversicherung im Jahre 1928," Beilage zum Reischsarbeitsblatt, I929, Nr. I2, p. 69.
3 I have dealt with this and other aspects of the invalidity- insurance figures in an article shortly to appear in the Inter- national Labour Review.
4 c"Das deutsche Volkseinkommen vor und nach dem Kriege," Einzelschriften zur Statistik des Deutschen Reicks, Nr. 24 (Berlin, I932), p. 113.
6 The total income of persons in the invalidity-insurance scheme is given in Vierteljahrshefte zusr Statistik des Deutschen Reicks, XLIII (I934), p. m. 7I, as 23,339 miffion RM. The total of private incomes was given in Konjunkturstatistisches Handbuckh I933 (Berlin, I933), p. 8o, as 73,827 million RM.
6 The theoretical significance of this case of plurimodality is discussed in great detail in my forthcoming article mentioned in footnote 3 above.
7 The cumulative median income is obtained by putting all incomes in the order of increasing size, and cumulating them from the first (i.e., the lowest) income upwards to the point where the cumulated sum just reaches half the total amount of all incomes. The size of the last income which must just be added to the cumulated sum in order to reach this amount is the cumulative median income.
8 The numerator of ,B, i.e., the difference between the cumu- lative and the ordinary medians, was proposed by G. K. Holmes in I892-93. G. P. Watkins in I904-05 and Bortkiewicz in I930 suggested that this should be divided by the average income. See on this matter Bortkiewicz, Die Disparitatsmasse der Einkommensstatistik (La Haye, I930), XIX8 Session de l'Institut International de Statistique, pp. 96-98.
This content downloaded from 193.142.30.37 on Sat, 28 Jun 2014 10:14:12 AMAll use subject to JSTOR Terms and Conditions
SHORT-PERIOD VARIATIONS IN THE DISTRIBUTION OF INCOMES I37
"inequality" of the distribution increases, i.e., when (relatively) more income is concentrated in the hands of income-recipients in the upper ranges of the income scale. It is obvious, how- ever, that ,B is a very rough and incomplete measure of inequality, since it only reflects such changes in the distribution as affect either or both medians.
MEASUREMENT OF THE INEQUALITY OF THE DISTRIBUTION OF
LABOR INCOME IN GERMANY
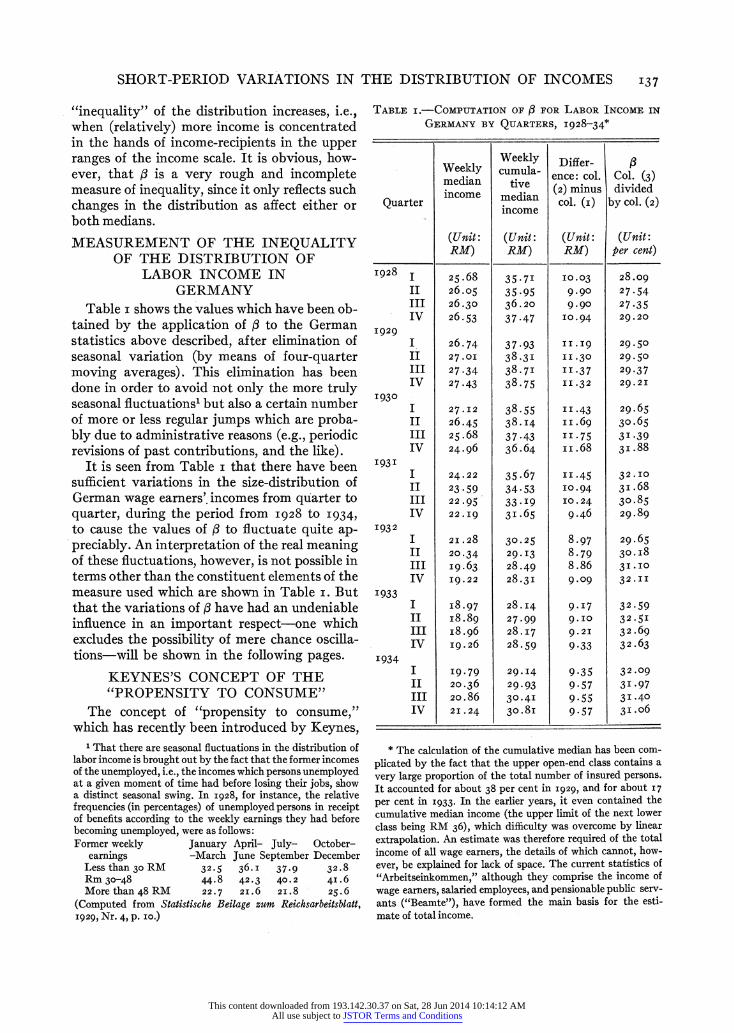
Table i shows the values which have been ob- tained by the application of : to the German statistics above described, after elimination of seasonal variation (by means of four-quarter moving averages). This elimination has been done in order to avoid not only the more truly seasonal fluctuations' but also a certain number of more or less regular jumps which are proba- bly due to administrative reasons (e.g., periodic revisions of past contributions, and the like).
It is seen from Table i that there have been sufficient variations in the size-distribution of German wage earners' incomes from quarter to quarter, during the period from I928 to I934, to cause the values of : to fluctuate quite ap- preciably. An interpretation of the real meaning of these fluctuations, however, is not possible in terms other than the constituent elements of the measure used which are shown in Table i. But that the variations of ( have had an undeniable influence in an important respect-one which excludes the possibility of mere chance oscilla- tions-will be shown in the following pages.
KEYNES'S CONCEPT OF THE "PROPENSITY TO CONSUME"
The concept of "propensity to consume," which has recently been introduced by Keynes,
TABLE I.-COMPUTATION OF : FOR LABOR INCOME IN
GERMANY BY QUARTERS, I928-34*
Weekly Weekly Differ-
media utiv ence: col. Col. (3) medan tvedi (2) mirnus divided
Quarter income mediae col. (i) by col. (2)
(Unit: (Unit: (Unit: (Unit: RM) RM) RM) per cent)
I928 I 25.68 35.7I IO.03 28.o9
II 26.05 35 .95 9. 90 27.54
III 26.30 36.20 9.90 27.35
IV 26.53 37.47 IO .94 29.20
I929
I 26.74 37.93 II.I9 29.50
II 27.OI 38.3I II .30 29.50
III 27.34 38.7I II .37 29.37
IV 27.43 38-75 II .32 29.2I
I930
I 27.I2 38.55 II.43 29.65
II 26.45 38.I4 II.69 30.65
III 25.68 37-43 II.75 3I.39
IV 24.96 36.64 ii.68 3I.88
I93I I 24.22 35.67 II.45 32.IO
II 23.59 34.53 IO.94 3I.68
III 22.95 33.I9 IO.24 30.85
IV 22.I9 3I.65 9.46 29.89
I932
I 2I.28 30.25 8.97 29.65
II 20.34 29.I3 8.79 30.I8
III I9.63 28.49 8.86 3I.IO
IV I9.22 28.3I 9.09 32.II
I933 I I8.97 28.I4 9.I7 32.59
II I8.89 27.99 9.IO 32.5I
III I8.96 28.I7 9.2I 32.69
IV I9.26 28.59 9.33 32.63
I934 I I9.79 29.I4 9.35 32.09
II 20.36 29.93 9.57 3I.97
III 20.86 30.4I 9.55 3I.40
IV 2I.24 30.8I 9.57 3I.o6
* The calculation of the cumulative median has been com- plicated by the fact that the upper open-end class contains a very large proportion of the total number of insured persons. It accounted for about 38 per cent in I929, and for about I7
per cent in I933. In the earlier years, it even contained the cumulative median income (the upper limit of the next lower class being RM 36), which difficulty was overcome by linear extrapolation. An estimate was therefore required of the total income of all wage earners, the details of which cannot, how- ever, be explained for lack of space. The current statistics of "Arbeitseinkommen," although they comprise the income of wage earners, salaried employees, and pensionable public serv- ants ("Beamte"), have formed the main basis for the esti- mate of total income.
1 That there are seasonal fluctuations in the distribution of labor income is brought out by the fact that the former incomes of the unemployed, i.e., the incomes which persons unemployed at a given moment of time had before losing their jobs, show a distinct seasonal swing. In I928, for instance, the relative frequencies (in percentages) of unemployed persons in receipt of benefits according to the weekly earnings they had before becoming unemployed, were as follows: Former weekly January April- July- October-
earnings -March June September December Less than 3o RM 32.5 36.I 37.9 32.8 Rm 3o-48 44.8 42.3 40.2 4I.6 More than 48 RM 22.7 2I.6 2I.8 25.6
(Computed from Statistische Beilage zum Reicksarbeitsblatt, I929, Nr. 4, p. IO.)
This content downloaded from 193.142.30.37 on Sat, 28 Jun 2014 10:14:12 AMAll use subject to JSTOR Terms and Conditions
I38 THE REVIEW OF ECONOMIC STATISTICS
has been the subject of criticism.' It may never- theless be submitted that a function which re- lates consumption expenditure (and therefore saving) to (real) incomes, and especially changes in the one to changes in the other, would be a useful tool in explaining the mechanism of the business cycle, if such a function could be shown to be stable over time.2 This does not mean that the "multiplier" is a particularly commend- able instrument. But just as this latter concept (in the form due to Kahn) has induced Tin- bergen to make a fruitful and important study of an interesting problem3 (which incidentally the concept has merely baptized, without actu- ally solving it), there seems to be no serious ob- jection to taking the "propensity to consume" as a suggestion for studying a relationship which would be important, if it existed.
Keynes presents his "propensity to consume" as a "fundamental psychological law." Doubt- ful though the underlying "psychology" may be, this way of constructing the function at once draws attention to the fact that it has an indi- vidual phenomenon as its base. Family budget figures-which might advantageously have re- placed the "psychology" in the r6le which Keynes attributes to it in explaining the "pro- pensity to consume"-show that for individuals (or families) it actually holds, i.e., that con- sumption expenditure increases with (real) in- come, but not so fast.4 But, as with demand curves, the-market curve can be obtained only by the summation of these individual curves; and it can again easily be shown that this proc- ess involves the size-distribution of incomes, even if the individual functions are assumed all identical in shape.5 In fact, the derivative of the market function, or "marginal propensity to
consume," is a weighted average of the marginal propensities of the individuals, where the weighting must be in proportion to the share that the change in each individual income has in the change of total income. It follows therefore that, if this share changes for any in- dividual, and unless the individual marginal propensities are all identical and constant all along the individual curves (which they cer- tainly are not), the derivative of the market curve will be affected, even if total income re- mains unaltered. On the other hand, it is obvi- ous that any modification in the distribution of incomes entails a modification of just these shares, so that the marginal propensity curve of the market can be derived from the individ- ual curves-however stable these may be-only on the assumption that the size-distribution of incomes is constant.
Keynes has entirely overlooked this implica- tion. He takes it that the derivative of the mar- ket function will have the same characteristics as that of any individual curve, i.e., that it is positive and smaller than unity. Among the factors capable of shifting the market curve, he does not list changes in the size-distribution of incomes, but only mentions changes in the in- come-distribution as between entrepreneurs and rentiers.6 But even this Keynes does not con- sider to be an important factor. The only other reference to the income-distribution in connec- tion with the propensity to consume is in the chapter on the trade cycle, where the "redis- tribution" of incomes is spoken of as a measure by which the propensity to consume might be
1 E.g., J. A. Schumpeter: " . . . such a 'propensity' is again nothing but a deus ex machina, valueless if we do not under- stand the mechanism of the changing situations, in which con- sumers' expenditure alternatively increases and contracts, and redundant if we do." Journal of the American Statistical Associ- ation, XXXI (I936), p. 794.
2 Harrod has in fact made the "propensity to consume" one of the main pillars of his recent trade-cycle theory.
3 "Ueber die Sekundarwirkungen zusatzlicher Investi- tionen," Weltwirtschaftliches Archiv, xLv (I937), pp. 39 et. seq.
4 See, for instance, the striking diagrams in America's Capacity to Consume, by Maurice Leven, Harold G. Moulton, and Clark Warburton (Washington, I934), opposite p. 8o.
5 Let the "propensity to consume" be the same function for each individual, say y=f(x), where y is expenditure on con- sumption, and x income. Take two individuals, 0 and I, with incomes xo and x1, and consumption expenditures yo and Yi,
respectively. Then, sincef cannot be assumed to be linear, the "marginal propensities" of 0 and I, i.e., the derivatives of their "propensity"-functions, will be different, as follows:
d[f(xo)] , and d[f(xi)I dxo dxl
The "market function" for these two individuals will be
Y = F(X) = f(xo) + f(xi)
and its derivative, or "marginal propensity," becomes
F'(X) = d[f(xo)]/dX + d[f(xi)]/dX
which may also be written as follows:
F'(X) = d[f(xo)] dxo+d[f(xi)] dx dxo dX dxl dX
6 General Tkeory of Employment, Interest, and Money, pp. 92, 290.
This content downloaded from 193.142.30.37 on Sat, 28 Jun 2014 10:14:12 AMAll use subject to JSTOR Terms and Conditions
SHORT-PERIOD VARIATIONS IN THE DISTRIBUTION OF INCOMES I39
stimulated;' but what type of "redistribution" Keynes here has in mind is not clear; at any rate, there is no proof that he meant a modifica- tion of incomes according to size.
Mrs. Robinson seems to be alone in Cam- bridge in mentioning the size-distribution of in- comes in this connection. She writes: "The rate of saving corresponding to a given total output depends, if the propensities of individuals to save are given upon the distribution of total income between classes." This difficulty she overcomes by postulating "that the degree of monopoly in the economic system is given, that the institutional factors governing the distribu- tion of wealth are stereotyped and that fiscal policy is unaltered. Then to each level of output will correspond a given system of distribution of real income between classes." Although this does not seem very satisfactory, it at least shows that the income distribution according to size has been recognized as an influencing factor.2
STATISTICAL ANALYSIS OF THE PROPENSITY TO CONSUME FOR
GERMAN WAGE EARNERS For the limited section of the German popu-
lation which is covered by the above measure- ments of ,B, the influence of changes in the in- come distribution upon the "propensity to consume" can be verified approximately by using the index of the value of retail sales and the figures for the absolute (money) amount of labor income ("Arbeitseinkommen"). Keynes himself only maintains that the absolute in- creases of consumption expenditure are smaller than the absolute increases of income to which they correspond. His theory does not require that the proportion of income spent on consump- tion should be decreasing with increasing in- come.3 It has nevertheless been preferred to construct, for use as the dependent variable in
the correlation shown below, an index of this proportion,4 by dividing the quarterly averages of the index of retail sales (I928 = ioo)5 by an index of labor income constructed with the same year as base.6 As regards income, it must for use as an independent variable, of course, be taken in real terms, and for this' purpose, Keynes's suggestion to use "wage-units" has been adopted, i.e., the index of labor income (in money) has been divided by a general index of wage rates.7 To characterize the distribution of incomes, the valu'es of j as given in Table i
have been used as a second independent vari- able. Seasonal variation has been eliminated from all the variables used, by means of four- quarter moving averages.
None of these variables exactly fits the scope of the others. The index of retail sales includes sales to persons other than wage earners; in ad- dition, it does not include expenditure on serv- ices, rents, and many miscellaneous items. The index of labor income includes the earnings of salaried employees and the salaries of public servants. The wage index, finally, only covers industrial workers.
Nevertheless, the errors committed are not likely to be very large, and probably concern the amplitude of the changes, without affecting their direction. It may, indeed, be assumed that the retail purchases of persons other than wage earners varied less than those of wage earners who, on account of the lower general level of their incomes, have a smaller margin of current resources by which they might counterbalance the influence of income changes upon their standard of comfort. As regards the omission of rents, it may during the period considered have had a trend-like influence; but since the movement of rents has been gradual, their in- clusion would not have affected the short move- ments of the index used. On the other hand, the income of persons other than wage earners, which is included in "labor income," is also' moving less quickly than the income of workers, so that the index used may perhaps show too
I Ibid., p. 321. 2 The quotations are from Zeitschriftfilr Nationahdkonomie,
VII (1936), pp. 75-76. To the last sentence quoted, Mrs. Robinson adds in a footnote: "This would not necessarily follow if the distribution of income corresponding to a smaller total were more unequal than the distribution corresponding to a larger total. . . ." It will be shown later on that there is in fact no correlation between , and the total of labor income, so that Mrs. Robinson seems to be right that "this cannot be supposed to occur, unless some very unnatural assumption is made about fiscal policy."
General Theory of Employment, Interest, and Money, p. 97.
4If desired, the absolute changes in consumption expendi- ture might be estimated with the help of the regression equa- tion given below.
6 Konjunkturstatistiches Handbuch I936, p. 78. f Ibid., p. 95. 7 Konjunkturstatistiches Handbuch I933, p. 82, and Statis-
tisches Jahrbuch fur das Deutsche Reich, I935 (Berlin, I935),
p. 288.
This content downloaded from 193.142.30.37 on Sat, 28 Jun 2014 10:14:12 AMAll use subject to JSTOR Terms and Conditions
I40 THE REVIEW OF ECONOMIC STATISTICS
small an amplitude; its changes, however, cer- tainly are in the main determined by the in- comes of wage earners. The same can finally be said of the exclusion of non-industrial wages from the index of wage rates. In spite of the deviations in their respective scopes, the varia-
bles used for discovering the "propensity to con- sume" among German wage earners would, therefore, seem to permit of a good, and at any rate a sufficient, approximation to the phe- nomenon which Keynes had in mind.
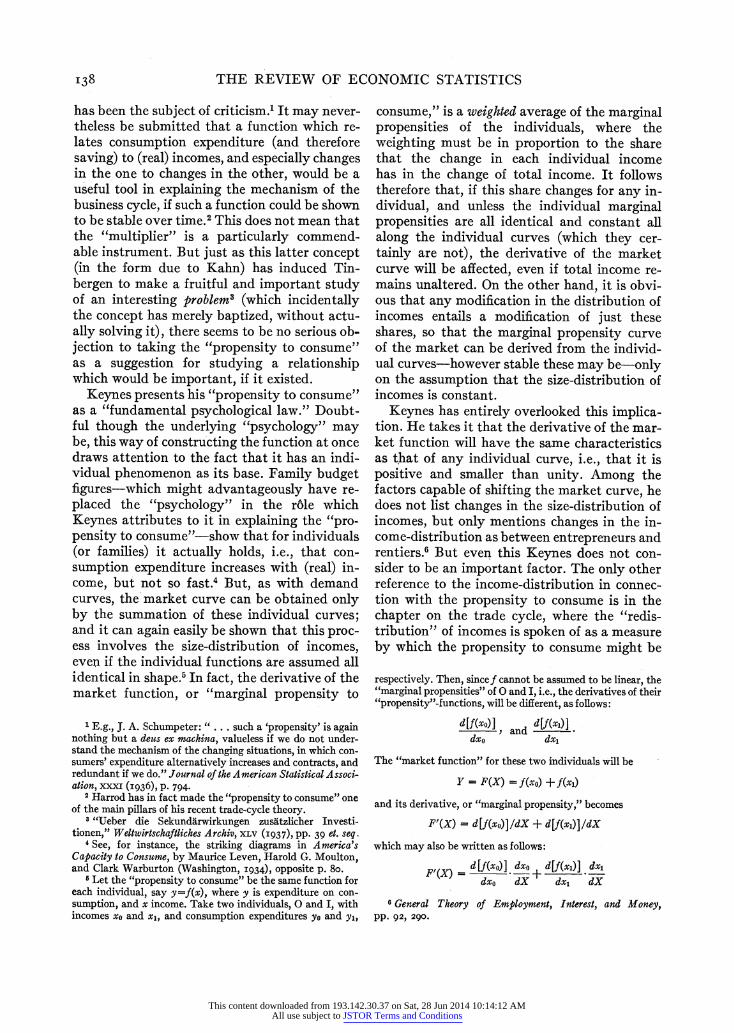
Table 2 gives the values of the three varia- bles, together with the computed values of the dependent, as obtained by the linear multiple regression equation which turned out to be:
X1= +I97.4-o.33 X2-2.3I X23
where X1 stands for the index of the proportion of retail sales to labor income, X2 for labor in- come in terms of wage units, and X3 for A.
Before any attempt is made to suggest the economic meaning of this equation, it will be well to illustrate by a few diagrams the degree of fit that it offers. Chart i shows the scatter
of the dependent variable X1 (taken as ordi- nate) with the independent X2 (taken as ab- scissa). The points in the scatter are numbered chronologically for each of the quarters from I928 to I934. According to Keynes, this scatter ought to have shown a clear relationship be- tween the two variables, close enough to permit reliable estimates of the one from the value of the other. The graph, however, makes it clear that there is practically no correlation between X1 and X2;1 furthermore, the sequence of the
TABLE 2.-VALUES OF VARIABLES USED IN STATISTICAL CONSTRUCTION OF "PROPENSITY TO CONSUME" FOR LABOR INCOME IN GERMANY
Propor- Lao tion of income X'S Computedo
Quarter retail sales in wage- XI valuesof to labor units income
(1928 (I928
-IOO)* - IOO)* (per cent)
I928
I IO01.1I 99.9 28.09 99.6 II .IOO 2 IOO. 2 27 .54 I00. 8 II IOO.4 99.I 27.35 ioi.6 IV 1 00. I 98.3 29.20 97.5
I929
I 98 .8 98.4 29.50 96.8 II 97.6 98.4 29.50 96.8 III 96.2 97.9 29.37 97.3 IV 95.8 96.3 29.2I 98.2
I930
I 96.5 93.6 29.65 98.I II 96.2 90.5 30.65 96.8 III 96.8 87.2 31.39 96.2 IV 98.I 84.2 3I.88 96.0
193I
I 99.9 8I.4 32.IO 96.4 II IOI.2 78.3 3I.68 98.5 III I02.8 75.6 30.85 IOI. 2
IV I05.0 73.2 29.89 I04.2
I932
I I05.6 7I.2 29.65 105.8
II I04.5 70.5 30.I8 I04.5
III I0I.8 70.6 3I.IO I02.3
IV 99.8 70.9 32.II 99.9 I933
I 98.7 7I.7 32-59 98.5 II 97.7 72.8 32.5I 98.4 III 97.0 74.6 32.69 97.4 IV 96.0 77.3 32.63 96.6
I934 I 95.0 79.6 32.09 97.I II 95.5 8i.6 31.97 96.7 III 95.4 83.0 31.40 97.6 IV 95.I 83.9 3I.o6 98.0
* Strictly speaking, it is only the unadjusted original in- dices which are on the base I928=IOO. The averages of the adjusted figures given in the table show slight deviations from this value in the base year, since they are four-quarter moving averages of the original indices.
CHART I.-SCATTER OF THE "PROPENSITY TO CONSUME" AND OF LABOR INCOME MEASURED IN WAGE UNITS,
GERMANY, I928-34, BY QUARTERS
(I928-IOo)
17
105 1 6
P1 I
40 75 0 85 9 95412 100 20 1
M12 2~~~~~~~~~~~~~ 23 1
24 26 78
95 - ~~~25 28
70 75 80 85 90 95 100
1 r212 has the value of o.ioi only.
This content downloaded from 193.142.30.37 on Sat, 28 Jun 2014 10:14:12 AMAll use subject to JSTOR Terms and Conditions
SHORT-PERIOD VARIATIONS IN THE DISTRIBUTION OF INCOMES I4I
points in the course of time strongly suggests that there must have been strong shifts in the relationship, if any, connecting the two varia- bles, whether that relationship be assumed posi- tively or negatively sloping. At any rate, the scatter is such that, whatever relationship be estimated from it, this function would be prac- tically useless as a basis for expectations of future points of coincidence.
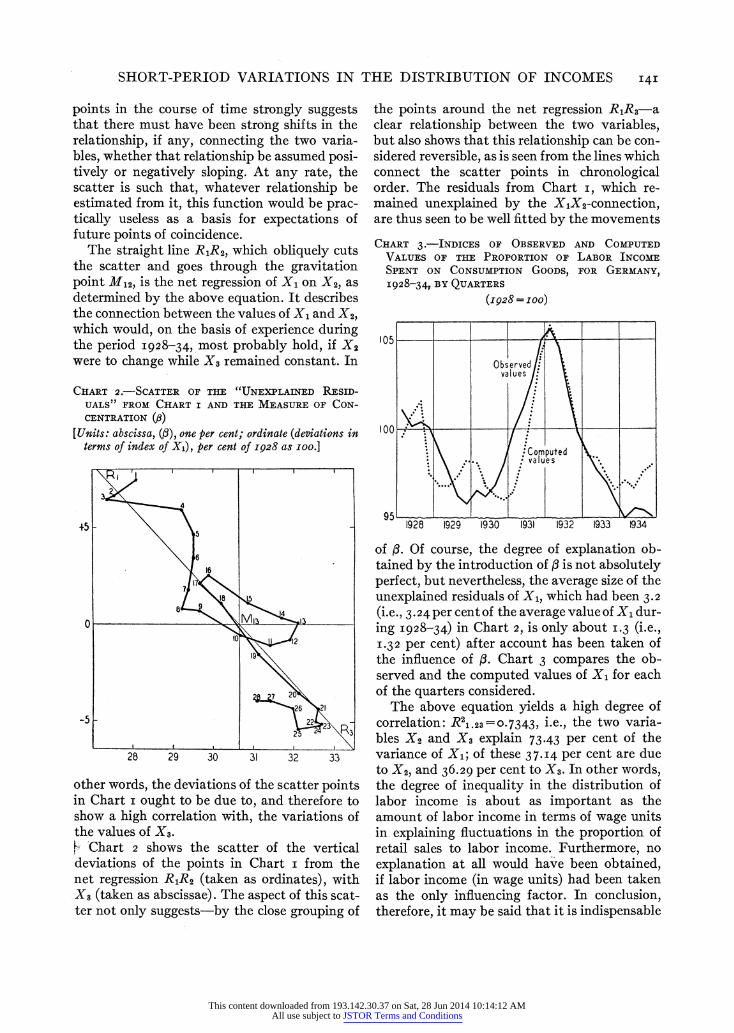
The straight line R1R2, which obliquely cuts the scatter and goes through the gravitation point M12, is the net regression of X1 on X2, as determined by the above equation. It describes the connection between the values of X1 and X2, which would, on the basis of experience during the period I928-34, most probably hold, if X2 were to change while X3 remained constant. In
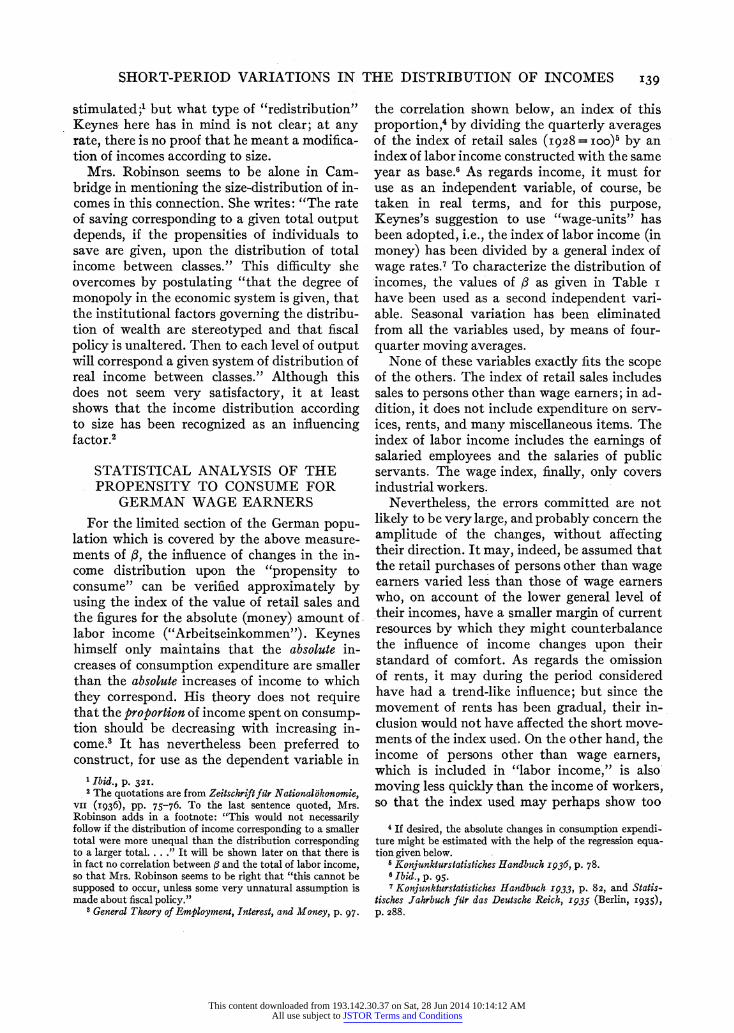
other words, the deviations of the scatter points in Chart i ought to be due to, and therefore to show a high correlation with, the variations of the values of X3. F 'Chart 2 shows the scatter of the vertical deviations of the points in Chart i from the net regression R1R2 (taken as ordinates), with X3 (taken as abscissae). The aspect of this scat- ter not only suggests-by the close grouping of
the points around the net regression R1R3-a clear relationship between the two variables, but also shows that this relationship can be con- sidered reversible, as is seen from the lines which connect the scatter points in chronological order. The residuals from Chart i, which re- mained unexplained by the XlX2-connection, are thus seen to be well fitted by the movements
of (. Of course, the degree of explanation ob- tained by the introduction of a is not absolutely perfect, but nevertheless, the average size of the unexplained residuals of X1, which had been 3.2
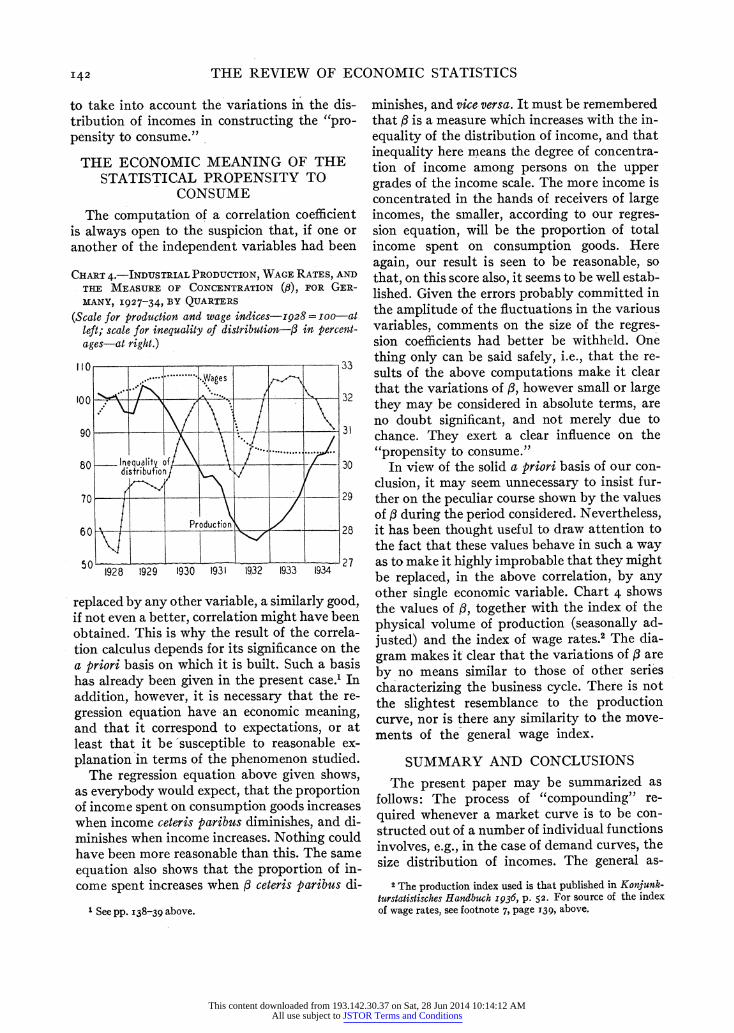
(i.e., 3.24 per cent of the average value of X1 dur- ing I928-34) in Chart 2, is only about I.3 (i.e., I .32 per cent) after account has been taken of the influence of (. Chart 3 compares the ob- served and the computed values of X1 for each of the quarters considered.
The above equation yields a high degree of correlation: R21.23=0.7343, i.e., the two varia- bles X2 and X3 explain 73.43 per cent of the variance of X1; of these 37.I4 per cent are due to X2, and 36.29 per cent to X3. In other words, the degree of inequality in the distribution of labor income is about as important as the amount of labor income in terms of wage units in explaining fluctuations in the proportion of retail sales to labor income. Furthermore, no explanation at all would have been obtained, if labor income (in wage units) had been taken as the only influencing factor. In conclusion, therefore, it may be said that it is indispensable
CHART 2.-SCATTER OF THE "UNEXPLAINED RESID- UALS" FROM CHART I AND THE MEASURE OF CON- CENTRATION (,B)
[Units: abscissa, (1), one per cent; ordinate (deviations in terms of index of X1), per cent of I928 as ioo.]
32
+5 5
16
6~~~~~
O 18 15
10 I 2
f 20
26 21
-5 -2?
28 29 30 31 32 33
CHART 3.-INDICES OF OBSERVED AND COMPUTED
VALUES OF THE PROPORTION OF LABOR INCOME
SPENT ON CONSUMPTION GOODS, FOR GERMANY,
I928-34, BY QUARTERS
(I928 =IOO)
105
Observed values
Computed values
1928 1929 1930 1931 1932 1933 1934
This content downloaded from 193.142.30.37 on Sat, 28 Jun 2014 10:14:12 AMAll use subject to JSTOR Terms and Conditions
I42 THE REVIEW OF ECONOMIC STATISTICS
to take into account the variations in the dis- tribution of incomes in constructing the "pro- pensity to consume."
THE ECONOMIC MEANING OF THE STATISTICAL PROPENSITY TO
CONSUME
The computation of a correlation coefficient is always open to the suspicion that, if one or another of the independent variables had been
replaced by any other variable, a similarly good, if not even a better, correlation might have been obtained. This is why the result of the correla- tion calculus depends for its significance on the a priori basis on which it is built. Such a basis has already been given in the present case.' In addition, however, it is necessary that the re- gression equation have an economic meaning, and that it correspond to expectations, or at least that it be -susceptible to reasonable ex- planation in terms of the phenomenon studied.
The regression equation above given shows, as everybody would expect, that the proportion of income spent on consumption goods increases when income ceteris paribus diminishes, and di- minishes when income increases. Nothing could have been more reasonable than this. The same equation also shows that the proportion of in- come spent increases when A ceteris paribus di-
minishes, and vice versa. It must be remembered that ,B is a measure which increases with the in- equality of the distribution of income, and that inequality here means the degree of concentra- tion of income among persons on the upper grades of the income scale. The more income is concentrated in the hands of receivers of large incomes, the smaller, according to our regres- sion equation, will be the proportion of total income spent on consumption goods. Here again, our result is seen to be reasonable, so that, on this score also, it seems to be well estab- lished. Given the errors probably committed in the amplitude of the fluctuations in the various variables, comments on the size of the regres- sion coefficients had better be withheld. One thing only can be said safely, i.e., that the re- sults of the above computations make it clear that the variations of ,B, however small or large they may be considered in absolute terms, are no doubt significant, and not merely due to chance. They exert a clear influence on the ''propensity to consume."
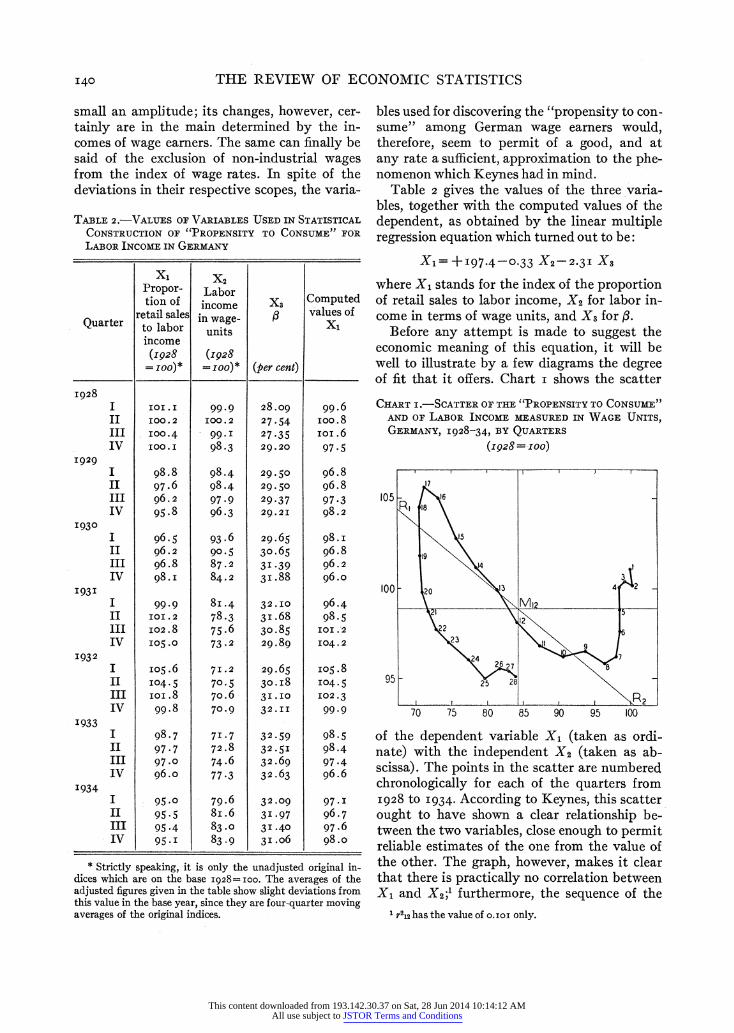
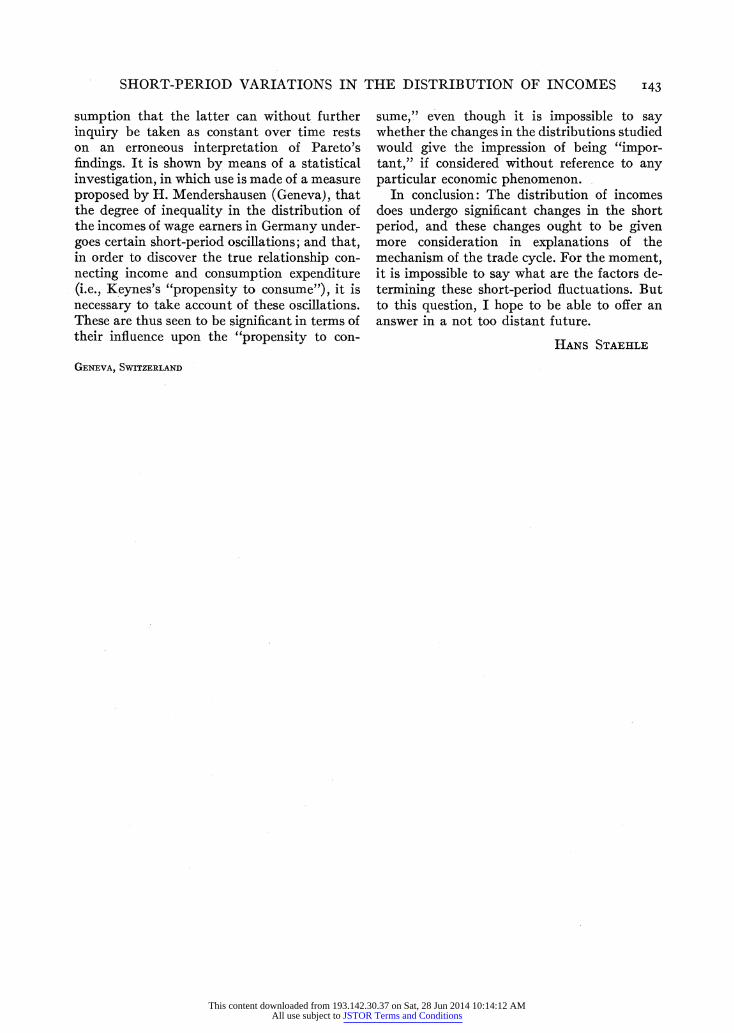
In view of the solid a priori basis of our con- clusion, it may seem unnecessary to insist fur- ther on the peculiar course shown by the values of ,B during the period considered. Nevertheless, it has been thought useful to draw attention to the fact that these values behave in such a way as to make it highly improbable that they might be replaced, in the above correlation, by any other single economic variable. Chart 4 shows the values of f3, together with the index of the physical volume of production (seasonally ad- justed) and the index of wage rates.2 The dia- gram makes it clear that the variations of I are by no means similar to those of other series characterizing the business cycle. There is not the slightest resemblance to the production curve, nor is there any similarity to the move- ments of the general wage index.
SUMMARY AND CONCLUSIONS
The present paper may be summarized as follows: The process of "compounding" re- quired whenever a market curve is to be con- structed out of a number of individual functions involves, e.g., in the case of demand curves, the size distribution of incomes. The general as-
CHART 4.-INDUSTRIAL PRODUCTION, WAGE RATES, AND
THE MEASURE OF CONCENTRATION (,B), FOR GER-
MANY, I927-34, BY QUARTERS
(Scale for production and wage indices-1928 = Ioo-at left; scale for inequality of distribution-f in percent- ages-at right.)
110 33 ...... . .Wages
100 . , - 32
90 -1_ A n 3
80 ..Inequality of 30 diSTribut ion
70 29
60 Productio 8
50 2 9 27 1928 1929 1930 1931 1932 1933 1934
1 See pp. I38-39 above.
2 The production index used is that published in Konjunk- turstatistisches Handbuch 1936, p. 52. For source of the index of wage rates, see footnote 7, page 139, above.
This content downloaded from 193.142.30.37 on Sat, 28 Jun 2014 10:14:12 AMAll use subject to JSTOR Terms and Conditions
SHORT-PERIOD VARIATIONS IN THE DISTRIBUTION OF INCOMES I43
sumption that the latter can without further inquiry be taken as constant over time rests on an erroneous interpretation of Pareto's findings. It is shown by means of a statistical investigation, in which use is made of a measure proposed by H. Mendershausen (Geneva), that the degree of inequality in the distribution of the incomes of wage earners in Germany under- goes certain short-period oscillations; and that, in order to discover the true relationship con- necting income and consumption expenditure (i.e., Keynes's "propensity to consume"), it is necessary to take account of these oscillations. These are thus seen to be significant in terms of their influence upon the "propensity to con-
sume," even though it is impossible to say whether the changes in the distributions studied would give the impression of being "impor- tant," if considered without reference to any particular economic phenomenon.
In conclusion: The distribution of incomes does undergo significant changes in the short period, and these changes ought to be given more consideration in explanations of the mechanism of the trade cycle. For the moment, it is impossible to say what are the factors de- termining these short-period fluctuations. But to this question, I hope to be able to offer an answer in a not too distant future.
GENEVA, SWITZERLAND
HANS STAEHLE
This content downloaded from 193.142.30.37 on Sat, 28 Jun 2014 10:14:12 AMAll use subject to JSTOR Terms and Conditions