short-period line profile and light variations in the herbig ae star v351 orionis
TRANSCRIPT
Short-period line profile and light variations in the Herbig Ae star V351Orionis
L. A. Balona,P C. Koen and F. van WykSouth African Astronomical Observatory, PO Box 9, Observatory 7935, Cape Town, South Africa
Accepted 2002 March 4. Received 2002 March 4; in original form 2001 January 30
A B S T R A C T
We present 318 high-dispersion echelle spectra and 450 UBVRCIC observations of the pre-
main-sequence star V351 Orionis. These data were obtained simultaneously over a two-week
period. The star is unusual in that it no longer shows the frequent sharp fadings that occurred
prior to 1986. We find features characteristic of Herbig Ae stars: Ha emission, sharp and
broad Na II absorption components and weak He I absorption. The Ha profile is strongly
variable with a time-scale of 1 d and normally is an inverse P Cygni profile, but on occasions
overt emission disappears altogether. The equivalent widths of the sharp Na II absorption lines
have decreased quite markedly since 1995, indicating a decrease in the column density of gas
in the line of sight. We also detect very weak forbidden [O I] emission. There is no evidence
for veiling of the star, but a possible 1.0-d or 0.5-d period in the equivalent widths of the lines
could indicate the presence of an accretion hotspot.
The star is of particular interest because it is pulsating. We detect at least two periods in the
light variation and a further period from the radial velocity variations. Attempts at
photometric mode identification were not successful, but from the morphology of the line
profiles we can identify one mode as non-radial. In addition, we see on some nights several
residual absorption subfeatures moving across the line profile from blue to red. These are
almost certainly caused by one or more modes of high degree ð‘ < 8Þ.
Key words: line: profiles – stars: individual: V351 Ori – stars: oscillations – stars: pre-main-
sequence – d Scuti.
1 I N T R O D U C T I O N
V351 Orionis (HD 38238) is listed as a Herbig Ae star by
Kovalchuk (1985) and also by Zajtseva (1986), who classified the
star as A7 III. Van den Ancker, The & de Winter (1996)
investigated the light variations of V351 Ori and found that the
behaviour of the star changed drastically over 14 yr. Before 1985
the star showed light variations exceeding 2 mag in V. A study of
the colour variation during this period suggests that the large light
variations were probably due to variable extinction caused by
circumstellar dust particles. Since 1985, however, the star has
remained near its maximum brightness with little variability. Van
den Ancker et al. (1996) suggest that this behaviour may play a key
role in understanding the pre-main-sequence (PMS) evolution of
an intermediate-mass star. It appears that around 1986 some event
occurred which either destroyed the dust clouds or removed them
from the line of sight.
During its contraction towards the main sequence, a star with a
mass .1.5 M( will cross the region of pulsational instability.
Marconi & Palla (1998) used non-linear models to map the
instability strip for the first three radial modes. Although the time
spent within the instability strip is only 5–10 per cent of the PMS
phase, a number of known Herbig Ae stars, including V351 Ori, lie
within the instability strip. Subsequently, Marconi et al. (2000)
discovered short-period light variations in V351 Ori and in another
Herbig Ae star, HD 35929. Other Herbig Ae stars known to pulsate
are V588 Mon and V599 Mon in the young cluster NGC 2264
(Breger 1972), the bright well-known star HR 5999 (Kurtz &
Marang 1995) and HD 104237 (Donati et al. 1997; Kurtz & Muller
1999). Pigulski, Kolaczkowski & Kopacki (2000) have found two
stars, BL 50 and HP 57, in the young cluster NGC 6823 which may
be pulsating PMS stars.
The importance of pulsation in a PMS star lies in the possibility
of deducing the basic stellar parameters from its pulsational
properties (asteroseismology). Marconi et al. (2001) obtained
additional photometric observations of V351 Ori and claimed that
the star pulsates in at least four radial modes. They obtained
constraints on the mass and luminosity of the star from these data.
However, only three nights of data were obtained and their six-
frequency solution should be viewed with caution. We thereforePE-mail: [email protected]
Mon. Not. R. Astron. Soc. 333, 923–931 (2002)
q 2002 RAS
decided to observe V351 Ori simultaneously using UBVRCIC
photometry and high-resolution echelle spectroscopy over a two-
week period in 2001 November/December. In this paper we present
these results and consider the nature of V351 Ori.
2 O B S E RVAT I O N S
Spectroscopic observations at SAAO were obtained using the
GIRAFFE echelle fibre-fed spectrograph attached to the
Cassegrain focus of the 1.9-m telescope. The GIRAFFE spectro-
graph has a resolving power of about 32 000. The 1024 £ 1024
TEK charge-coupled device (CCD) chip gives a dispersion of
0:06–0:09 �A per pixel. ATh–Ar arc lamp was used for wavelength
calibration with arc spectra taken at regular intervals to calibrate
possible drifts. Flat-fielding was accomplished by illuminating the
camera with uniform light using a tungsten filament lamp and a
diffusing screen. The blaze correction was determined by
measuring the response across each order when the fibre was
illuminated by a tungsten lamp. The wavelength range was
4400–6680 �A spread over 45 orders. Exposure times were
7–10 min for a signal-to-noise ratio (S/N) of about 15. A total of
318 spectra of V351 Ori was obtained on 10 nights over a two-
week period from 2001 November 28 to December 11 (Table 1).
Johnson UBV and Cousins RCIC photometry was obtained using
the Modular Photometer attached to the 0.5-m reflector of the
SAAO. Observations were made simultaneously with the
spectroscopy. We used two local comparison stars, HD 38866
(A5) and HD 38155 (A5), for which we obtain the values shown in
Table 2 using E-region standards. These values have errors less
than 1 mmag; the rms error per observation is 5 mmag.
Periodograms of these two comparison stars show that they are
constant to within the observational errors, though there is a
statistically insignificant peak at a frequency of 13.67 cycle d21
with an amplitude of 3 mmag in all colours. One of these stars may
be a very small-amplitude d Scuti variable. All three stars were
observed in the sequence C1, V, C2, V, C1, V, . . .. A total of 450
five-colour observations were obtained for V351 Ori on 10 nights
from 2001 November 27 to December 10. Between 21 and 64 data
points were obtained on each night (Table 1).
3 T H E S P E C T R A L E N E R G Y D I S T R I B U T I O N
Van den Ancker et al. (1996) were able to match the extinction-free
spectral energy distribution (SED) of V351 Ori by means of three
dust shell components radiating as blackbodies at 1700, 430 and
80 K. The observations on which this analysis was based were
made at the time when the star still showed large photometric
variations. In order to compare this SED with the SED today, when
the photometric variations have ceased, David Laney kindly
observed the star in the near-infrared using the SAAO infrared
photometer attached to the 1.9-m telescope at Sutherland. These
observations were obtained two months after the visual
observations, but since the star is nearly constant in light, they
can be treated as if they are simultaneous. Results are shown in
Table 3.
From Table 3, it is apparent that there is not much difference in
colour in the visual region, but the star is significantly bluer in the
near-IR during 2001/2002 compared to 1982. This indicates that
the amount of dust has decreased since 1982.
4 T H E S P E C T R U M O F V 3 5 1 O R I
In order to study the line profile variations, the continuum needs to
be determined. Placing the continuum by hand is not an easy
process. We preferred to rectify the spectra with the aid of a
synthetic spectrum calculated using the SPECTRUM code (Gray &
Corbally 1994) using a Kurucz solar-abundance model atmosphere
appropriate to an A7 III star ðTeff ¼ 7500, log g ¼ 3:00Þ and
broadened with v sin i ¼ 100 km s21.
In order to study the average properties of the line spectrum, it is
convenient to use the correlation function. The correlation function
is obtained by cross-correlating the observed spectrum with a
synthetic spectrum that closely resembles the spectrum of the star.
It can be shown that the correlation function is, in effect, a
weighted average of the line spectrum and has, of course, a much
Table 1. Observing log for the spectro-scopy and photometry at SAAO. The firstcolumn is the starting Julian day withrespect to JD 245 2200. The secondcolumn is the duration, DT, in hours ofobserving, and this is followed by thenumber of observations, N.
Start DT N Start DT N
Spectroscopy42.42 4.3 30 49.34 6.5 4243.39 5.5 37 50.34 6.5 4645.38 4.8 27 51.35 3.8 2846.36 2.9 19 53.35 5.5 3948.36 5.3 22 54.35 6.0 28
Photometry41.39 4.9 21 48.48 2.5 2842.45 2.3 35 49.34 5.8 6443.36 5.5 56 50.42 4.0 4645.35 5.4 53 51.36 5.2 5846.36 3.1 28 53.34 5.6 61
Table 2. Magnitudes of the two local comparison starsand mean values for V351 Ori as obtained by comparisonwith E-region standards.
Star U B V RC IC
HD 38866 7.528 7.442 7.160 6.994 6.825V351 Ori 9.554 9.293 8.925 8.707 8.470HD 38155 9.242 9.149 8.863 8.700 8.527
Table 3. Near-IR and visualcolour indices of V351 Oriobtained in 2001 Decemberand 2002 January and thosefrom Kilkenny et al. (1985)in 1982 January.
Index 1982 2001/02
B 2 V 0.37 0.37U 2 B 0.27 0.26V 2 RC 0.23 0.22V 2 IC 0.45 0.46J 2 H 0.52 0.49H 2 K 0.69 0.58K 2 L 0.89 0.92
924 L. A. Balona, C. Koen and F. van Wyk
q 2002 RAS, MNRAS 333, 923–931
higher S/N than an individual line profile. We calculated the
correlation profiles by cross-correlating each spectrum of V351 Ori
with an unbroadened synthetic spectrum with Teff ¼ 7500,
log g ¼ 3:00. From the mean correlation profile, we estimated
the projected rotational velocity by a non-linear least-squares fit to
a series of models of a rotating star. We used the mean intrinsic line
profile calculated from the synthetic spectrum. We find v sin i ¼
102 km s21: The mean radial velocity is 13:3 ^ 0:7 km s21. In
Fig. 1 we show the mean line profile of Fe I 5616 and the fit for
v sin i ¼ 102 km s21.
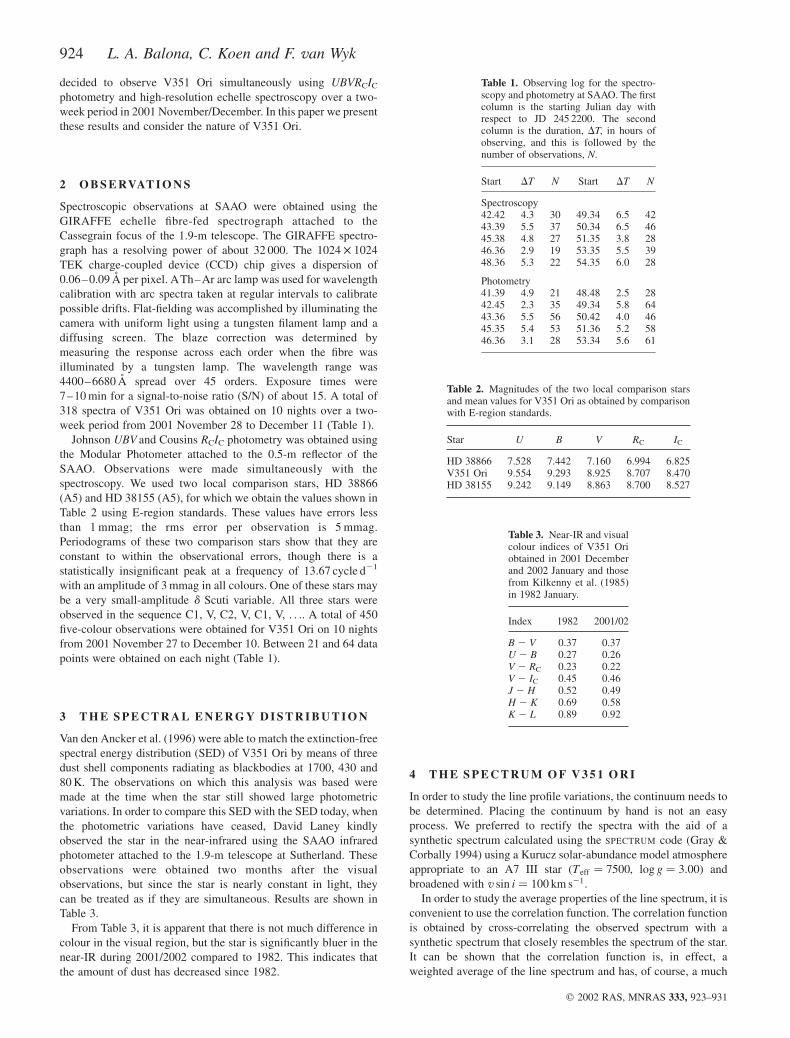
In Figs 1 and 2 we show a selection of mean line profiles in the
spectrum of V351 Ori. The line spectrum is a close match to a
normal A7 III star except for emission in Ha, the presence of some
He I lines in absorption and strong Na II absorption. All these
features are typical of Herbig Ae stars. There is a very narrow
emission line of [O I] 6300 at a velocity of þ7.5 km s21 (equivalent
width EW ¼ 10 m �A, full width at half-maximum FWHM ¼
12 km s21Þ which is slightly blueshifted with respect to the star
itself. It is not visible on spectra of other stars taken during the
same night, so we believe it is not telluric in origin. This forbidden
line is formed in the outer rarefied region of the gaseous envelope
and is an important diagnostic for the presence or absence of a
circumstellar disc. The presence of broad, asymmetric, blueshifted
[O I] emission in T Tauri stars is attributed to occultation of the
receding redshifted flow by an optically thick disc. In most Herbig
Ae or Be stars (henceforth HAeBe stars), the [O I] emission line is
symmetric and unshifted, which suggests that, unlike T Tauri stars,
the HAeBe stars do not, in general, have optically thick accretion
discs (Bohm & Catala 1994; but see Corcoran & Ray 1997). The
presence of narrow, essentially unshifted forbidden [O I] emission
in V351 Ori likewise suggests the absence of an optically thick
disc. We did not detect any Fe I, Fe II or any other metal lines in
emission. The spectrum is clearly not veiled, a point emphasized
by the fact that the photospheric pulsations are visible in the light
curve and spectrum.
In Fig. 2 we also show the overall mean profiles and mean
nightly profiles of Na II. The sharp absorption lines are
superimposed on much broader absorption. The sharp absorption
lines have radial velocities of þ23:5 ^ 0:2 and therefore redshifted
by about 10 km s21 with respect to the star itself. The EWs of these
lines are 0.22 A for the 5890 A line and 0.17 A for the 5896 A line.
This is much less than the values of 0.67 A and 0.71 A reported by
Van den Ancker et al. (1996). As a consequence, the depths of the
two lines (0.51 and 0.38 continuum units) are also smaller than
found by Van den Ancker et al. (1996). This confirms their
supposition that the narrow components must consist of a blend of
interstellar and circumstellar lines. The narrow circumstellar lines
are presumably formed in the cool outer parts of the accretion disc
around V351 Ori. In many HAeBe stars, the broad circumstellar
components of Na II are variable and show high-velocity
absorption components. Since Na II does not survive for more
than a few seconds near an A-type star, the origin of this absorption
is thought to come from the continuous and complete evaporation
of metre-sized bodies (Grinin, Natta & Tambovtseva 1996; Sorelli,
Grinin & Natta 1996).
The mean Ha profile shown in Fig. 2 is very similar to that in
Van den Ancker et al. (1996), which was also taken after 1986. It
shows an inverse P Cygni profile, which can be interpreted as due
to infalling gas. By subtracting the pure absorption Ha profile
calculated from a synthetic spectrum from the observed Ha profile,
we can determine the infall velocity. There are large night-to-night
differences in the infall velocity, and the value determined from the
residual absorption red edge is always smaller than from the
emission blue edge. The mean profile gives an emission blue edge
at 2270 km s21 and an absorption red edge at þ190 km s21
relative to the star. This suggests that the distribution of
circumstellar material lacks axial symmetry. Fig. 2 shows that
Figure 1. Mean line profiles in V351 Ori. The mean Hb line profile (solid
line) is compared to the profile on JD 245246 (dashed line). The Si II
6357, 6371 lines are shown in the middle panel and forbidden [O I] 6300
emission in the top panel (the absorption lines here are of telluric origin).
On the right are mean profiles of He I 6678, 5876 and Fe I 5616. The thick
curve in the top panel is the fit to the Fe I 5616 line assuming
v sin i ¼ 102 km s21.
Figure 2. Nightly mean profiles of the Na II 5890/5896 doublet (left panels)
and Ha (right panels).
Variations in the Herbig Ae star V351 Ori 925
q 2002 RAS, MNRAS 333, 923–931
the Ha line profile is highly variable on a time-scale of 1 d; the
emission is even absent on some nights. Hb is also variable, but to a
smaller extent. Fig. 1 shows the profile of Hb on the first night
compared to the mean profile from the whole run. The strong blue
asymmetry seen here corresponds to the strong blue emission peak
in Ha on the same night.
A common feature of HAeBe stars is the presence of weak He I
absorption, particularly He I 5876. In V351 Ori, there are weak
absorption lines of He I 6678 ðEW ¼ 0:11 ^ 0:01 �AÞ and He I 5876
ðEW ¼ 0:11 ^ 0:01 �AÞ. Van den Ancker et al. (1996) did not detect
these in their spectrum. The presence of helium lines in such a cool
star is an unsolved problem. It has been suggested that they arise
from collisionally ionized gas caused by the interaction of infalling
matter with inner disc material (Grinin et al. 1994; de Winter et al.
1994), or else they are formed at the base of a stellar wind (Bouret
& Catala 2000).
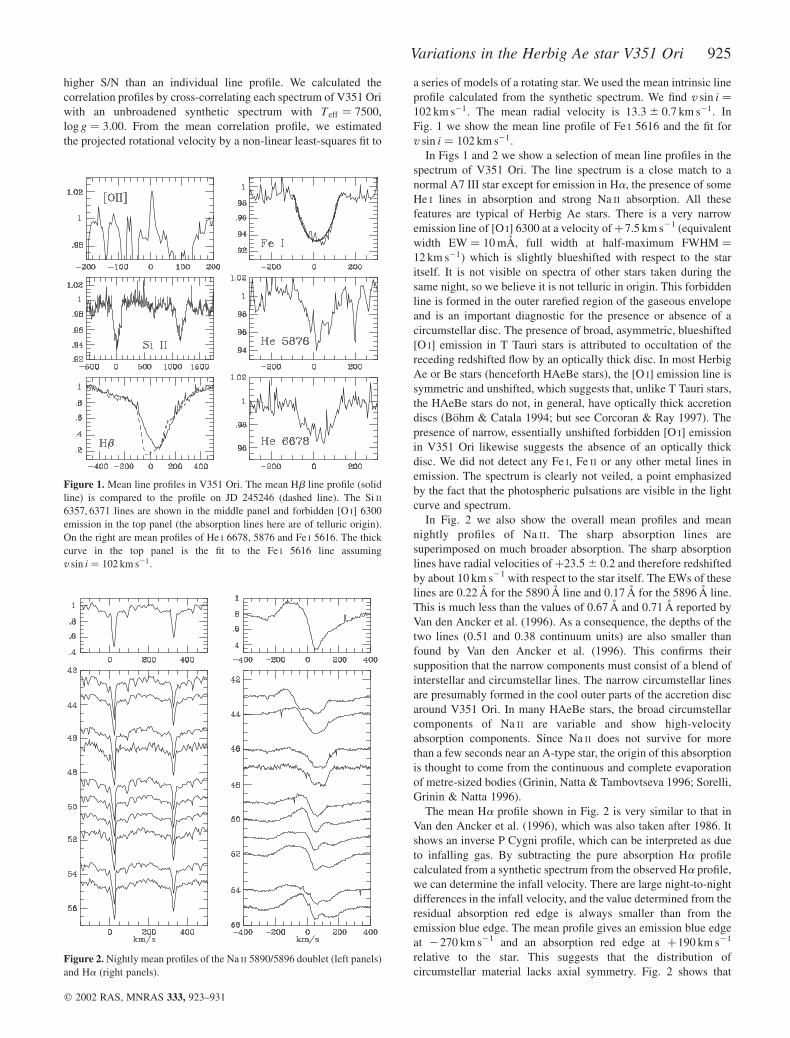
In Fig. 3 we show the nightly variation in EW for the
circumstellar lines. There appears to be a sinusoidal variation in the
EW of residual Ha absorption and a similar variation in the EW of
the broad component of the Na II doublet, but in antiphase. There is
no significant variation in the EW of the helium absorption. It is
interesting to note that an increase in Ha emission correlates with
an increase in brightness while the star gets bluer.
5 P E R I O D I C L I G H T VA R I AT I O N S
As already mentioned, V351 Ori is unusual in the dramatic
reduction of its light variation over the past few years. As can be
seen in Fig. 3, the long-term variability is slight and correlates well
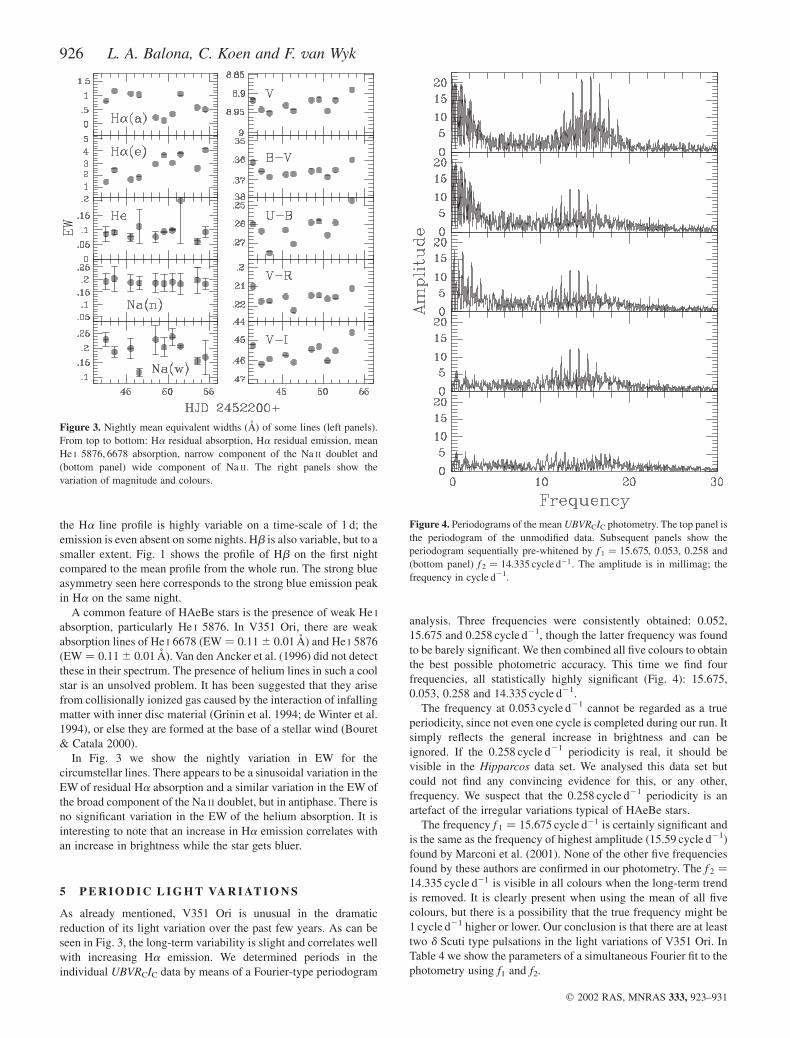
with increasing Ha emission. We determined periods in the
individual UBVRCIC data by means of a Fourier-type periodogram
analysis. Three frequencies were consistently obtained: 0.052,
15.675 and 0.258 cycle d21, though the latter frequency was found
to be barely significant. We then combined all five colours to obtain
the best possible photometric accuracy. This time we find four
frequencies, all statistically highly significant (Fig. 4): 15.675,
0.053, 0.258 and 14.335 cycle d21.
The frequency at 0.053 cycle d21 cannot be regarded as a true
periodicity, since not even one cycle is completed during our run. It
simply reflects the general increase in brightness and can be
ignored. If the 0.258 cycle d21 periodicity is real, it should be
visible in the Hipparcos data set. We analysed this data set but
could not find any convincing evidence for this, or any other,
frequency. We suspect that the 0.258 cycle d21 periodicity is an
artefact of the irregular variations typical of HAeBe stars.
The frequency f 1 ¼ 15:675 cycle d21 is certainly significant and
is the same as the frequency of highest amplitude (15.59 cycle d21)
found by Marconi et al. (2001). None of the other five frequencies
found by these authors are confirmed in our photometry. The f 2 ¼
14:335 cycle d21 is visible in all colours when the long-term trend
is removed. It is clearly present when using the mean of all five
colours, but there is a possibility that the true frequency might be
1 cycle d21 higher or lower. Our conclusion is that there are at least
two d Scuti type pulsations in the light variations of V351 Ori. In
Table 4 we show the parameters of a simultaneous Fourier fit to the
photometry using f1 and f2.
Figure 3. Nightly mean equivalent widths (A) of some lines (left panels).
From top to bottom: Ha residual absorption, Ha residual emission, mean
He I 5876, 6678 absorption, narrow component of the Na II doublet and
(bottom panel) wide component of Na II. The right panels show the
variation of magnitude and colours.
Figure 4. Periodograms of the mean UBVRCIC photometry. The top panel is
the periodogram of the unmodified data. Subsequent panels show the
periodogram sequentially pre-whitened by f 1 ¼ 15:675, 0.053, 0.258 and
(bottom panel) f 2 ¼ 14:335 cycle d21. The amplitude is in millimag; the
frequency in cycle d21.
926 L. A. Balona, C. Koen and F. van Wyk
q 2002 RAS, MNRAS 333, 923–931
6 P E R I O D I C L I N E P R O F I L E VA R I AT I O N S
The radial velocity, as defined by the position of maximum line
absorption, does not directly measure the pulsational velocity of
the star, but can be used for period finding. Since it only samples a
small portion of the line profile, it is by no means capable of
detecting all pulsational modes. Modes of high degree may give
discontinuous radial velocities as successive moving bumps pass
the line centre and may give the wrong period. Nevertheless, it is
the simplest means of detecting periodicities in the spectrum.
We used the correlation profile as a good approximation to the
mean line profile. The radial velocity was obtained by finding the
maximum of a quadratic fitted to the points around maximum
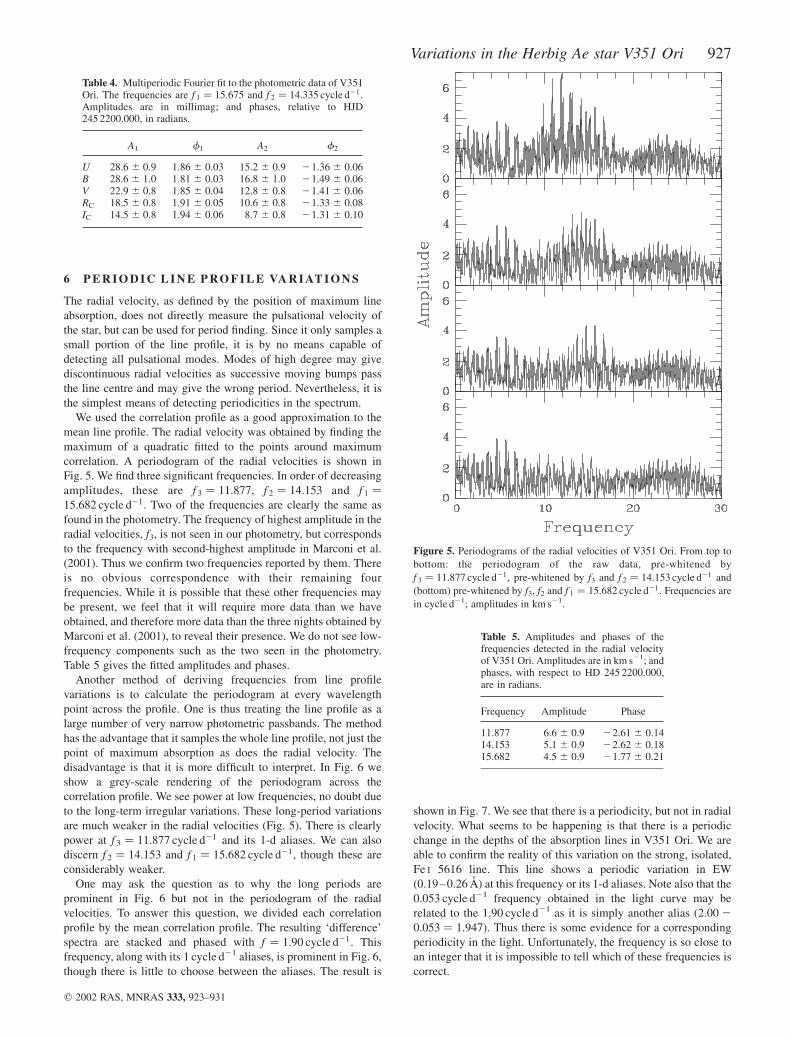
correlation. A periodogram of the radial velocities is shown in
Fig. 5. We find three significant frequencies. In order of decreasing
amplitudes, these are f 3 ¼ 11:877, f 2 ¼ 14:153 and f 1 ¼
15:682 cycle d21: Two of the frequencies are clearly the same as
found in the photometry. The frequency of highest amplitude in the
radial velocities, f3, is not seen in our photometry, but corresponds
to the frequency with second-highest amplitude in Marconi et al.
(2001). Thus we confirm two frequencies reported by them. There
is no obvious correspondence with their remaining four
frequencies. While it is possible that these other frequencies may
be present, we feel that it will require more data than we have
obtained, and therefore more data than the three nights obtained by
Marconi et al. (2001), to reveal their presence. We do not see low-
frequency components such as the two seen in the photometry.
Table 5 gives the fitted amplitudes and phases.
Another method of deriving frequencies from line profile
variations is to calculate the periodogram at every wavelength
point across the profile. One is thus treating the line profile as a
large number of very narrow photometric passbands. The method
has the advantage that it samples the whole line profile, not just the
point of maximum absorption as does the radial velocity. The
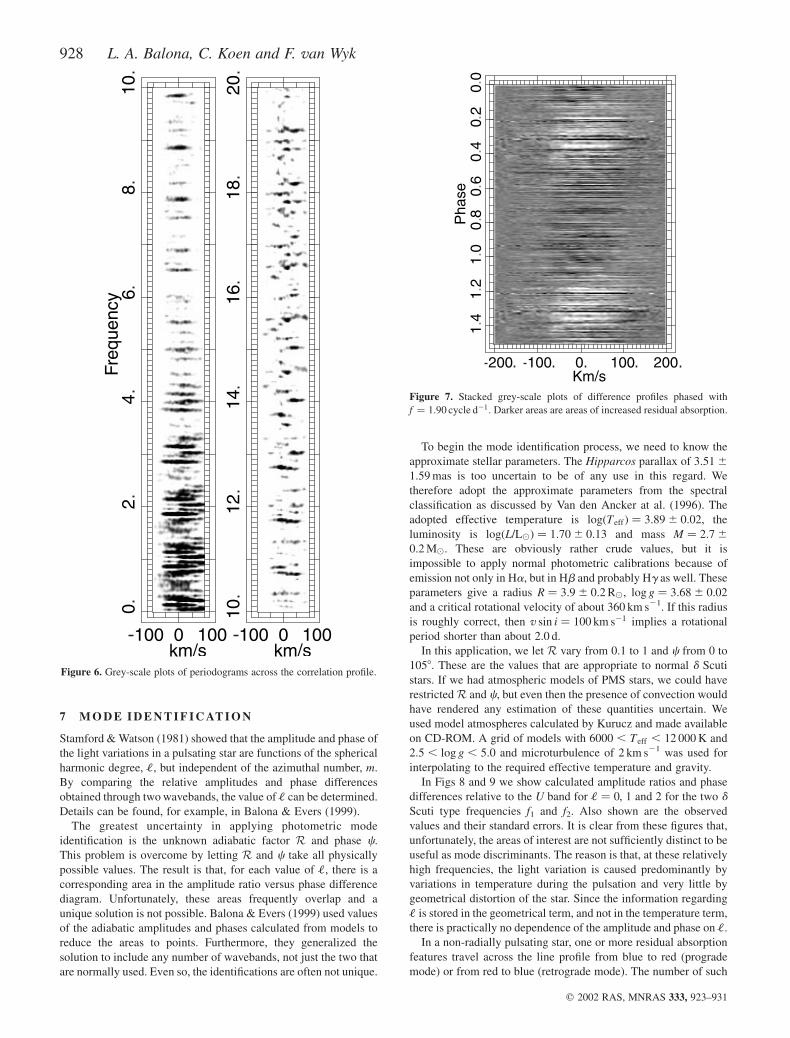
disadvantage is that it is more difficult to interpret. In Fig. 6 we
show a grey-scale rendering of the periodogram across the
correlation profile. We see power at low frequencies, no doubt due
to the long-term irregular variations. These long-period variations
are much weaker in the radial velocities (Fig. 5). There is clearly
power at f 3 ¼ 11:877 cycle d21 and its 1-d aliases. We can also
discern f 2 ¼ 14:153 and f 1 ¼ 15:682 cycle d21, though these are
considerably weaker.
One may ask the question as to why the long periods are
prominent in Fig. 6 but not in the periodogram of the radial
velocities. To answer this question, we divided each correlation
profile by the mean correlation profile. The resulting ‘difference’
spectra are stacked and phased with f ¼ 1:90 cycle d21. This
frequency, along with its 1 cycle d21 aliases, is prominent in Fig. 6,
though there is little to choose between the aliases. The result is
shown in Fig. 7. We see that there is a periodicity, but not in radial
velocity. What seems to be happening is that there is a periodic
change in the depths of the absorption lines in V351 Ori. We are
able to confirm the reality of this variation on the strong, isolated,
Fe I 5616 line. This line shows a periodic variation in EW
ð0:19–0:26 �AÞ at this frequency or its 1-d aliases. Note also that the
0.053 cycle d21 frequency obtained in the light curve may be
related to the 1.90 cycle d21 as it is simply another alias ð2:00 2
0:053 ¼ 1:947Þ: Thus there is some evidence for a corresponding
periodicity in the light. Unfortunately, the frequency is so close to
an integer that it is impossible to tell which of these frequencies is
correct.
Figure 5. Periodograms of the radial velocities of V351 Ori. From top to
bottom: the periodogram of the raw data, pre-whitened by
f 3 ¼ 11:877 cycle d21, pre-whitened by f3 and f 2 ¼ 14:153 cycle d21 and
(bottom) pre-whitened by f3, f2 and f 1 ¼ 15:682 cycle d21. Frequencies are
in cycle d21; amplitudes in km s21.
Table 5. Amplitudes and phases of thefrequencies detected in the radial velocityof V351 Ori. Amplitudes are in km s21; andphases, with respect to HD 245 2200.000,are in radians.
Frequency Amplitude Phase
11.877 6.6 ^ 0.9 22.61 ^ 0.1414.153 5.1 ^ 0.9 22.62 ^ 0.1815.682 4.5 ^ 0.9 21.77 ^ 0.21
Table 4. Multiperiodic Fourier fit to the photometric data of V351Ori. The frequencies are f 1 ¼ 15:675 and f 2 ¼ 14:335 cycle d21.Amplitudes are in millimag; and phases, relative to HJD245 2200.000, in radians.
A1 f1 A2 f2
U 28.6 ^ 0.9 1.86 ^ 0.03 15.2 ^ 0.9 21.36 ^ 0.06B 28.6 ^ 1.0 1.81 ^ 0.03 16.8 ^ 1.0 21.49 ^ 0.06V 22.9 ^ 0.8 1.85 ^ 0.04 12.8 ^ 0.8 21.41 ^ 0.06RC 18.5 ^ 0.8 1.91 ^ 0.05 10.6 ^ 0.8 21.33 ^ 0.08IC 14.5 ^ 0.8 1.94 ^ 0.06 8.7 ^ 0.8 21.31 ^ 0.10
Variations in the Herbig Ae star V351 Ori 927
q 2002 RAS, MNRAS 333, 923–931
7 M O D E I D E N T I F I C AT I O N
Stamford & Watson (1981) showed that the amplitude and phase of
the light variations in a pulsating star are functions of the spherical
harmonic degree, ‘, but independent of the azimuthal number, m.
By comparing the relative amplitudes and phase differences
obtained through two wavebands, the value of ‘ can be determined.
Details can be found, for example, in Balona & Evers (1999).
The greatest uncertainty in applying photometric mode
identification is the unknown adiabatic factor R and phase c.
This problem is overcome by letting R and c take all physically
possible values. The result is that, for each value of ‘, there is a
corresponding area in the amplitude ratio versus phase difference
diagram. Unfortunately, these areas frequently overlap and a
unique solution is not possible. Balona & Evers (1999) used values
of the adiabatic amplitudes and phases calculated from models to
reduce the areas to points. Furthermore, they generalized the
solution to include any number of wavebands, not just the two that
are normally used. Even so, the identifications are often not unique.
To begin the mode identification process, we need to know the
approximate stellar parameters. The Hipparcos parallax of 3:51 ^
1:59 mas is too uncertain to be of any use in this regard. We
therefore adopt the approximate parameters from the spectral
classification as discussed by Van den Ancker at al. (1996). The
adopted effective temperature is logðTeffÞ ¼ 3:89 ^ 0:02, the
luminosity is logðL/L(Þ ¼ 1:70 ^ 0:13 and mass M ¼ 2:7 ^
0:2 M(: These are obviously rather crude values, but it is
impossible to apply normal photometric calibrations because of
emission not only in Ha, but in Hb and probably Hg as well. These
parameters give a radius R ¼ 3:9 ^ 0:2 R(, log g ¼ 3:68 ^ 0:02
and a critical rotational velocity of about 360 km s21. If this radius
is roughly correct, then v sin i ¼ 100 km s21 implies a rotational
period shorter than about 2.0 d.
In this application, we let R vary from 0.1 to 1 and c from 0 to
1058. These are the values that are appropriate to normal d Scuti
stars. If we had atmospheric models of PMS stars, we could have
restricted R and c, but even then the presence of convection would
have rendered any estimation of these quantities uncertain. We
used model atmospheres calculated by Kurucz and made available
on CD-ROM. A grid of models with 6000 , Teff , 12 000 K and
2:5 , log g , 5:0 and microturbulence of 2 km s21 was used for
interpolating to the required effective temperature and gravity.
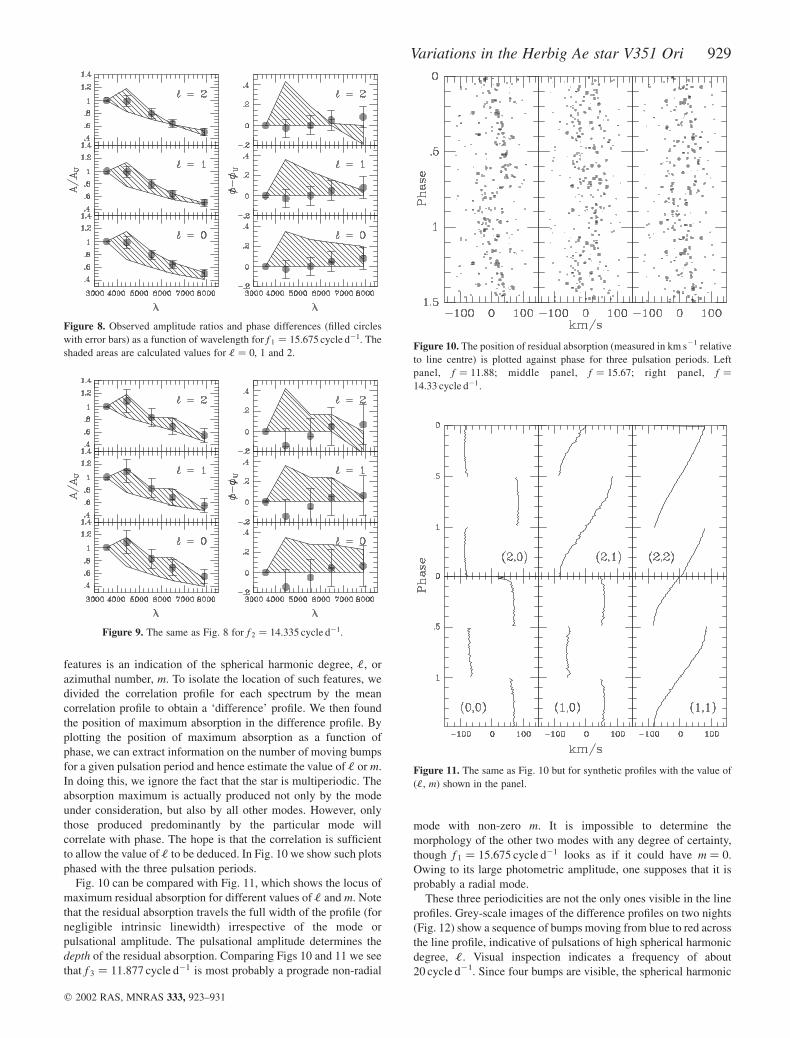
In Figs 8 and 9 we show calculated amplitude ratios and phase
differences relative to the U band for ‘ ¼ 0, 1 and 2 for the two d
Scuti type frequencies f1 and f2. Also shown are the observed
values and their standard errors. It is clear from these figures that,
unfortunately, the areas of interest are not sufficiently distinct to be
useful as mode discriminants. The reason is that, at these relatively
high frequencies, the light variation is caused predominantly by
variations in temperature during the pulsation and very little by
geometrical distortion of the star. Since the information regarding
‘ is stored in the geometrical term, and not in the temperature term,
there is practically no dependence of the amplitude and phase on ‘.
In a non-radially pulsating star, one or more residual absorption
features travel across the line profile from blue to red (prograde
mode) or from red to blue (retrograde mode). The number of such
Figure 7. Stacked grey-scale plots of difference profiles phased with
f ¼ 1:90 cycle d21. Darker areas are areas of increased residual absorption.
Figure 6. Grey-scale plots of periodograms across the correlation profile.
928 L. A. Balona, C. Koen and F. van Wyk
q 2002 RAS, MNRAS 333, 923–931
features is an indication of the spherical harmonic degree, ‘, or
azimuthal number, m. To isolate the location of such features, we
divided the correlation profile for each spectrum by the mean
correlation profile to obtain a ‘difference’ profile. We then found
the position of maximum absorption in the difference profile. By
plotting the position of maximum absorption as a function of
phase, we can extract information on the number of moving bumps
for a given pulsation period and hence estimate the value of ‘ or m.
In doing this, we ignore the fact that the star is multiperiodic. The
absorption maximum is actually produced not only by the mode
under consideration, but also by all other modes. However, only
those produced predominantly by the particular mode will
correlate with phase. The hope is that the correlation is sufficient
to allow the value of ‘ to be deduced. In Fig. 10 we show such plots
phased with the three pulsation periods.
Fig. 10 can be compared with Fig. 11, which shows the locus of
maximum residual absorption for different values of ‘ and m. Note
that the residual absorption travels the full width of the profile (for
negligible intrinsic linewidth) irrespective of the mode or
pulsational amplitude. The pulsational amplitude determines the
depth of the residual absorption. Comparing Figs 10 and 11 we see
that f 3 ¼ 11:877 cycle d21 is most probably a prograde non-radial
mode with non-zero m. It is impossible to determine the
morphology of the other two modes with any degree of certainty,
though f 1 ¼ 15:675 cycle d21 looks as if it could have m ¼ 0.
Owing to its large photometric amplitude, one supposes that it is
probably a radial mode.
These three periodicities are not the only ones visible in the line
profiles. Grey-scale images of the difference profiles on two nights
(Fig. 12) show a sequence of bumps moving from blue to red across
the line profile, indicative of pulsations of high spherical harmonic
degree, ‘. Visual inspection indicates a frequency of about
20 cycle d21. Since four bumps are visible, the spherical harmonic
Figure 9. The same as Fig. 8 for f 2 ¼ 14:335 cycle d21.
Figure 10. The position of residual absorption (measured in km s21 relative
to line centre) is plotted against phase for three pulsation periods. Left
panel, f ¼ 11:88; middle panel, f ¼ 15:67; right panel, f ¼
14:33 cycle d21:
Figure 11. The same as Fig. 10 but for synthetic profiles with the value of
(‘, m) shown in the panel.
Figure 8. Observed amplitude ratios and phase differences (filled circles
with error bars) as a function of wavelength for f 1 ¼ 15:675 cycle d21. The
shaded areas are calculated values for ‘ ¼ 0, 1 and 2.
Variations in the Herbig Ae star V351 Ori 929
q 2002 RAS, MNRAS 333, 923–931
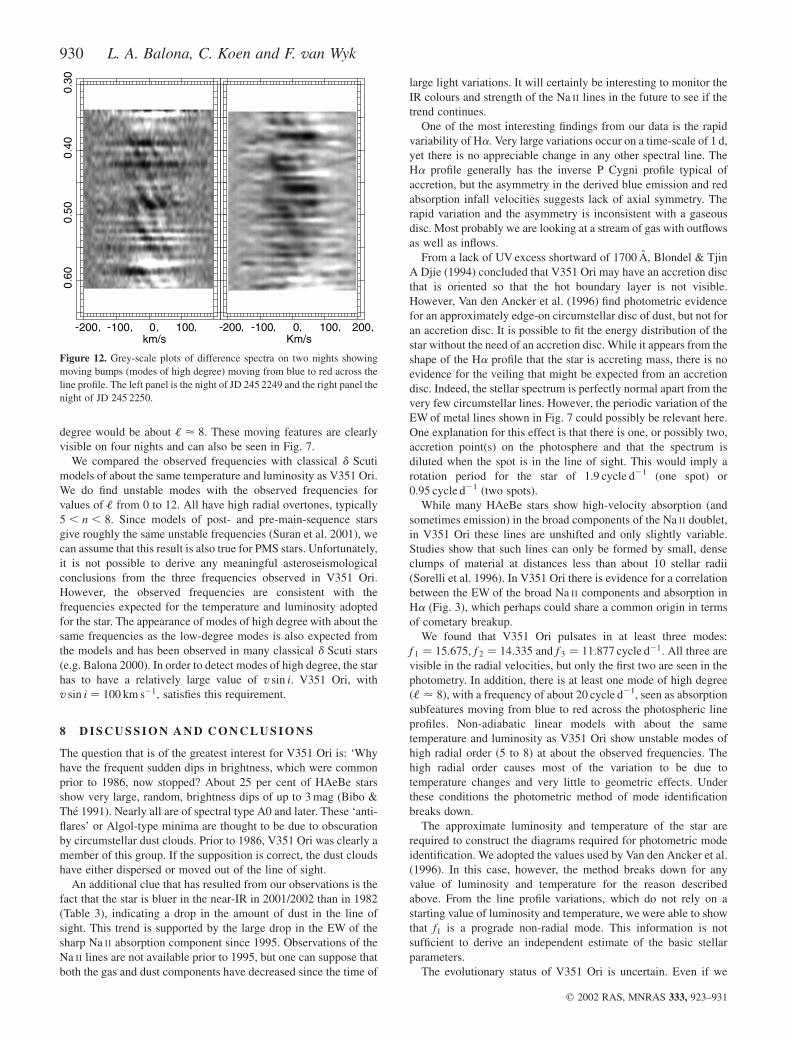
degree would be about ‘ < 8. These moving features are clearly
visible on four nights and can also be seen in Fig. 7.
We compared the observed frequencies with classical d Scuti
models of about the same temperature and luminosity as V351 Ori.
We do find unstable modes with the observed frequencies for
values of ‘ from 0 to 12. All have high radial overtones, typically
5 , n , 8. Since models of post- and pre-main-sequence stars
give roughly the same unstable frequencies (Suran et al. 2001), we
can assume that this result is also true for PMS stars. Unfortunately,
it is not possible to derive any meaningful asteroseismological
conclusions from the three frequencies observed in V351 Ori.
However, the observed frequencies are consistent with the
frequencies expected for the temperature and luminosity adopted
for the star. The appearance of modes of high degree with about the
same frequencies as the low-degree modes is also expected from
the models and has been observed in many classical d Scuti stars
(e.g. Balona 2000). In order to detect modes of high degree, the star
has to have a relatively large value of v sin i. V351 Ori, with
v sin i ¼ 100 km s21, satisfies this requirement.
8 D I S C U S S I O N A N D C O N C L U S I O N S
The question that is of the greatest interest for V351 Ori is: ‘Why
have the frequent sudden dips in brightness, which were common
prior to 1986, now stopped? About 25 per cent of HAeBe stars
show very large, random, brightness dips of up to 3 mag (Bibo &
The 1991). Nearly all are of spectral type A0 and later. These ‘anti-
flares’ or Algol-type minima are thought to be due to obscuration
by circumstellar dust clouds. Prior to 1986, V351 Ori was clearly a
member of this group. If the supposition is correct, the dust clouds
have either dispersed or moved out of the line of sight.
An additional clue that has resulted from our observations is the
fact that the star is bluer in the near-IR in 2001/2002 than in 1982
(Table 3), indicating a drop in the amount of dust in the line of
sight. This trend is supported by the large drop in the EW of the
sharp Na II absorption component since 1995. Observations of the
Na II lines are not available prior to 1995, but one can suppose that
both the gas and dust components have decreased since the time of
large light variations. It will certainly be interesting to monitor the
IR colours and strength of the Na II lines in the future to see if the
trend continues.
One of the most interesting findings from our data is the rapid
variability of Ha. Very large variations occur on a time-scale of 1 d,
yet there is no appreciable change in any other spectral line. The
Ha profile generally has the inverse P Cygni profile typical of
accretion, but the asymmetry in the derived blue emission and red
absorption infall velocities suggests lack of axial symmetry. The
rapid variation and the asymmetry is inconsistent with a gaseous
disc. Most probably we are looking at a stream of gas with outflows
as well as inflows.
From a lack of UV excess shortward of 1700 A, Blondel & Tjin
A Djie (1994) concluded that V351 Ori may have an accretion disc
that is oriented so that the hot boundary layer is not visible.
However, Van den Ancker et al. (1996) find photometric evidence
for an approximately edge-on circumstellar disc of dust, but not for
an accretion disc. It is possible to fit the energy distribution of the
star without the need of an accretion disc. While it appears from the
shape of the Ha profile that the star is accreting mass, there is no
evidence for the veiling that might be expected from an accretion
disc. Indeed, the stellar spectrum is perfectly normal apart from the
very few circumstellar lines. However, the periodic variation of the
EW of metal lines shown in Fig. 7 could possibly be relevant here.
One explanation for this effect is that there is one, or possibly two,
accretion point(s) on the photosphere and that the spectrum is
diluted when the spot is in the line of sight. This would imply a
rotation period for the star of 1.9 cycle d21 (one spot) or
0.95 cycle d21 (two spots).
While many HAeBe stars show high-velocity absorption (and
sometimes emission) in the broad components of the Na II doublet,
in V351 Ori these lines are unshifted and only slightly variable.
Studies show that such lines can only be formed by small, dense
clumps of material at distances less than about 10 stellar radii
(Sorelli et al. 1996). In V351 Ori there is evidence for a correlation
between the EW of the broad Na II components and absorption in
Ha (Fig. 3), which perhaps could share a common origin in terms
of cometary breakup.
We found that V351 Ori pulsates in at least three modes:
f 1 ¼ 15:675, f 2 ¼ 14:335 and f 3 ¼ 11:877 cycle d21. All three are
visible in the radial velocities, but only the first two are seen in the
photometry. In addition, there is at least one mode of high degree
ð‘ < 8Þ, with a frequency of about 20 cycle d21, seen as absorption
subfeatures moving from blue to red across the photospheric line
profiles. Non-adiabatic linear models with about the same
temperature and luminosity as V351 Ori show unstable modes of
high radial order (5 to 8) at about the observed frequencies. The
high radial order causes most of the variation to be due to
temperature changes and very little to geometric effects. Under
these conditions the photometric method of mode identification
breaks down.
The approximate luminosity and temperature of the star are
required to construct the diagrams required for photometric mode
identification. We adopted the values used by Van den Ancker et al.
(1996). In this case, however, the method breaks down for any
value of luminosity and temperature for the reason described
above. From the line profile variations, which do not rely on a
starting value of luminosity and temperature, we were able to show
that f1 is a prograde non-radial mode. This information is not
sufficient to derive an independent estimate of the basic stellar
parameters.
The evolutionary status of V351 Ori is uncertain. Even if we
Figure 12. Grey-scale plots of difference spectra on two nights showing
moving bumps (modes of high degree) moving from blue to red across the
line profile. The left panel is the night of JD 245 2249 and the right panel the
night of JD 245 2250.
930 L. A. Balona, C. Koen and F. van Wyk
q 2002 RAS, MNRAS 333, 923–931
knew the exact luminosity and temperature, we could still not
discriminate between a PMS stage of evolution or the equivalent
post-main-sequence stage. Nor is the star a clear member of any
cluster or association. The range of periods seen in the star is
consistent with the adopted luminosity and suggests that the star is
either evolved or still contracting towards the main sequence. Non-
adiabatic models indicate that a star close to the main sequence
would be expected to show shorter periods and also a wider range
of periods. The assumption that the star is in the PMS stage of
evolution is, however, indicated by the presence of a dust shell and
the fact that the Ha emission-line profile suggests accretion of
circumstellar material.
AC K N OW L E D G M E N T S
We would like to thank Dr David Laney (SAAO) for kindly
observing the star in the near infrared.
R E F E R E N C E S
Balona L. A., 2000, MNRAS, 318, 289
Balona L. A., Evers E. A., 1999, MNRAS, 302, 349
Bibo E., The P. S., 1991, A&AS, 89, 319
Blondel P. F. C., Tjin A Djie H. R. E., 1994, in The P. S., Perez M. R., Van
den Heuvel E. P. J., eds, ASP Conf. Ser. Vol. 62, Proc. First Conf. on the
Nature and Evolutionary Status of Herbig Ae/Be Stars. Astron. Soc.
Pac., San Francisco, p. 211
Bohm T., Catala C., 1994, A&A, 290, 167
Bouret J.-C., Catala C., 2000, A&A, 359, 1011
Breger M., 1972, ApJ, 171, 539
Corcoran M., Ray T. P., 1997, A&A, 321, 189
de Winter D. et al., 1994, in Ferlet R., Vidal-Madjar A., eds, Proc. 10th ASP
Meeting: Circumstellar Dust Disks and Planet Formation. Editions
Frontieres, Gif-sur-Yvette, p. 171
Donati J.-F., Semel M., Carter B. D., Rees D. E., Cameron A. C., 1997,
MNRAS, 291, 658
Gray R. O., Corbally C. J., 1994, AJ, 107, 742
Grinin V. P. et al., 1994, A&A, 292, 165
Grinin V. P., Natta A., Tambovtseva L., 1996, A&A, 313, 857
Kilkenny D., Whittet D. C. B., Davies J. K., Evans A., Bode M. F., Robson
E. I., Banfield R. M., 1985, SAAO Circ., 9, 55
Kovalchuk G. U., 1985, Kinemat. Fiz. Nebesn. Tel., 1, 30
Kurtz D. W., Marang F., 1995, MNRAS, 276, 191
Kurtz D. W., Muller M., 1999, MNRAS, 310, 1071
Marconi M., Palla F., 1998, ApJ, 507, L141
Marconi M., Ripepi V., Alcala E., Covino E., Palla F., Terranegra L., 2000,
A&A, 355, L35
Marconi M., Ripepi V., Bernabei S., Palla F., Alcala E., Covino E.,
Terranegra L., 2001, A&A, 372, L21
Pigulski A., Kolaczkowski Z., Kopacki G., 2000, Acta Astron., 50, 113
Sorelli C., Grinin V. P., Natta A., 1996, A&A, 309, 155
Stamford P. A., Watson R. D., 1981, ApSS, 77, 131
Suran M., Goupil M., Baglin A., Lebreton Y., Catala C., 2001, A&A, 372,
233
Van den Ancker M. E., The P. S., de Winter D., 1996, A&A, 309, 809
Zajtseva G. V., 1986, Astrofizika, 25, 471
This paper has been typeset from a TEX/LATEX file prepared by the author.
Variations in the Herbig Ae star V351 Ori 931
q 2002 RAS, MNRAS 333, 923–931