shorebird–prey interactions in south carolina coastal soft sediments
TRANSCRIPT
Shorebird - prey interactions in South Carolina coastal soft sediments
Louise M. Weber and Susan M. Haig
Abstract: We investigated the simultaneous influence of benthic prey (primarily insect larvae, oligochaetes, and polychaetes) on spring-migrating shorebirds (Charadriiformes) and shorebirds on prey in brackish managed wetlands of South Carolina. We proposed that positive correlations between shorebird and prey densities and between prey reduction and shorebird density might result in a negative feedback loop. The loop would be characterized by shorebird redistribution over time and equalization of shorebird and prey densities (and biomass) across the site. In support of the feedback loop (i) there were positive correlations between shorebird and prey densities (and biomass) early in migration; (ii) shorebird predation was responsible for declines of 49% in prey density and 50% in prey biomass in a shorebird exclosure experiment, with shorebird density positively correlated with prey decline in open plots; (iii) there was equalization of prey biomass across the site, and relative prey species abundance appeared to become more equal. Contrary to predictions, shorebirds did not redistribute after prey reduction, and patchiness of shorebird and prey densities persisted across the site. This failure was attributed to high prey density, even at the season's end, and high water depths. There were no confounding indirect trophic-level effects.
R6sum6 : Nous avons Ctudie l'influence simultanke de proies benthiques (surtout des larves d'insectes, des oligochktes et des polychktes) sur les oiseaux de rivage (Charadriiformes) au cours de leur migration de printemps, et des oiseaux de rivage sur leurs proies, dans des terres saumitres humides amhagees, en Caroline du Sud. Nous croyons que les correlations positives entre la densite des oiseaux et la densite des proies et entre la reduction des proies et la densite des oiseaux peuvent resulter en un cercle de retroaction negative. Ce cercle serait caracterise par une redistribution des oiseaux dans le temps et par une parite entre la densite des oiseaux et celle des proies (et leur biomasse) sur tout le site. Certains phenomknes appuient I'hypothkse du cercle de rktroaction : (i) i l existe dkja des correlations positives entre la densite des oiseaux et la densite des proies (et leur biomasse) t8t au cours de la migration; (ii) la predation par les oiseaux de rivage s'est averee responsable de 49% de la diminution de la densite des proies et de 50% de la diminution de la biomasse des proies au cours d'une expkrience en arkne fermke, alors que la densite des oiseaux etait en correlation positive avec la diminution des proies dans des parcelles de terrain ouvert; (iii) il s'est crie une parite de la biomasse de proies dans tout le site et I'abondance relative des espkces de proies a semble devenir plus egale. Contrairement aux predictions, les oiseaux ne se sont pas repartis autrement aprks la reduction des proies et la contagion a persist6 dans tout le site, et chez les oiseaux, et chez les proies, ce qui s'explique sans doute par la presence d'une grande densite de proies mtme en fin de saison et mtme en eau profonde. Aucun facteur relie aux effets indirects des niveaux trophiques n'est venu apporter de la confusion. [Traduit par la Redaction]
Introduction found a positive relationship between shorebird density and prey biomass (Goss-Custard 1970, 1977a; Helmers 199 1 ; Invertebrate prey resources play a central role in determining Kalejta and Hockey 1994) or shorebird density and inverte- shorebird distribution and abundance during the nonbreeding brate prey density (Wolff 1969; Goss-Custard 1970; Prater season (reviews by Evans and Dugan 1984; Goss-Custard 1972; Goss-Custard 1977b; Goss-Custard et al. 1977; 1984; Puttick 1984; Piersma 1987). Numerous studies have O.Connor and Brown 1977; Bryant 1979; Rands and Bark- ham 1981; Hicklin and Smith 19-84; Meire and Kuyken 1984;
Received May 23, 1996. Accepted September 30, 1996. Wilson 1990; Goss-Custard et al. 1991; Helmers 1991;
I L.M. Weber' and S.M. Haig.2 South Carolina Cooperative Colwell and Landrum 1993; Yates et al. 1993; Kalejta and
Fish and Wildlife Research Unit and Department of Hockey 1994; Mercier and McNeil 1994). While inverte- Biological Sciences, Clemson University, Clemson, brate density may determine shorebird density, shorebird SC 29634, U.S.A. predation may simultaneously alter characteristics of the ' Author to whom correspondence should be sent to the
following address: Human and Natural Ecology Program, 625 Rollins Way, Emory University, Atlanta, GA, 30322, U.S.A. (e-mail: lweber@biology .emory .edu). * Present address: Forest and Rangeland Ecosystem Science Center, Biological Resources Division, U.S. Geological Survey, Oregon State University, Corvallis, OR 9733 1, U.S.A.
invertebrate prey population. Results of shorebird exclosure experiments show that shorebird predation can reduce prey abundance or biomass (Schneider and Harrington 198 1 ; Kent and Day 1983; Quammen 1984; Szekely and Bamberger 1992; Mercier and McNeil 1994), reduce mean prey size (Kent and Day 1983; Raffaelli and Milne 1987; Wilson 1989), and alter adult-recruit interactions (Kent and Day 1983; Wilson 1989). The effects of shorebird predation are
Can. J. Zool. 75: 245-252 (1997). O 1997 NRC Canada
Can
. J. Z
ool.
Dow
nloa
ded
from
ww
w.n
rcre
sear
chpr
ess.
com
by
Uni
vers
ity o
f L
aval
on
07/0
9/14
For
pers
onal
use
onl
y.
Can. J. Zool. Vol. 75. 1997
not limited to direct interactions. Shorebirds can exert indirect trophic-level effects on invertebrate species by feeding on the predator of the invertebrate species (Kent and Day 1983; Wilson 1989; Daborn et al. 1993).
Despite this extensive literature, few studies have inves- tigated the simultaneous effects of prey abundance on shore- birds and shorebird predation on prey and described the resulting dynamics. We proposed that positive correlations between shorebird and prey densities and between prey reduction and shorebird density may result in a negative feedback loop. The loop would be characterized by shorebird redistribution over time and more equalization of shorebird and prey densities (or biomass), i.e., shorebirds would spread out across a site after reducing prey in high-density patches, and prey density and biomass would become more equal across the site after patches with high prey density were reduced. The idea was addressed by Schneider (1978), who found equalization of relative species abundance of invertebrates, but he did not compare invertebrate densities from one patch to another or shorebird variables. Duffy et al. (1981) found that coefficients of variation (CV) decreased for two shorebird species but increased for six species. Thus, the results were contrary to predictions because most species fed in a more confined area over time. However, restrictions were attributed to a change in environ- ment that was not due to shorebird interactions. Schneider (1985, 1992) investigated changes in prey patchiness due to migratory shorebird predation and found decreases in prey patchiness; however, he did not consider shorebird patchiness.
We used field data from managed coastal wetlands to test four hypotheses, the results of which would determine if a negative feedback loop occurred at our site. We first deter- mined whether shorebird density was positively correlated with prey density (or biomass) when measured across the study site at one time. Correlations were measured twice throughout the 1993 spring migration within water depths tolerated by shorebirds. We expected there to be a positive correlation early in the season and equalization of variables after that. We also investigated whether there was higher invertebrate density (or greater biomass or size) in shorebird exclosures than in control areas open to shorebirds. In con- junction with this we determined whether reduction of prey density or biomass in plots open to shorebirds was correlated with shorebird density in these open plots. A positive corre- lation would support the hypothesis that shorebirds were responsible for declines in prey density (or biomass). We also investigated whether there was redistribution of shore- birds as prey density and biomass were reduced. We tested this by examining the correlation between shorebird density in early May (3 - 16) and late May (17 - 25). We expected a negative correlation if shorebirds redistributed. Finally, we determined whether shorebird density and prey densities and biomass become more equal across the site by the end of migration season. We tested this by comparing CVs of shore- bird density, prey density, prey biomass, and chironomid density between early and late sampling dates. We predicted that final CVs would be significantly smaller if there was a trend towards equalization across the study site.
We also examined the possibility of indirect effects of shorebirds on invertebrate species that could confound our feedback-loop prediction of a decrease in invertebrate
density. Only one indirect effect due to shorebirds was expected because most of the common infaunal invertebrates were detritivores (Weber 1994). The sea anemone Nemato- stella vectensis was the only known predator among the most common invertebrates and is known to consume larvae of the spionid polychaete Streblospio benedicti (Kneib 1988; Posey and Hines 1991). Densities of N. vectensis and S. benedicti were high in preliminary studies in 1991 and 1992 (Weber 1994). If shorebirds preferentially preyed upon N. vectensis, they might indirectly increase the density of S. benedicti. We examined correlations between invertebrate species inside and outside shorebird exclosures to investigate this indirect effect.
Methods and materials
Fieldwork was conducted on South Island (79" 15 'W, 33" 10'N) at the Tom Yawkey Wildlife Center in Georgetown County located on the South Carolina coast, U.S.A. The Yawkey Center is managed by the South Carolina Department of Natural Resources as a wild- life refuge and research area and encompasses 940 ha of impound- ments surrounded by 6800 ha of tidal marsh, forest openings, ocean beach, pineland, and maritime forest. Twelve nontidal brackish1 salty (salinity 9 -35 ppt) impoundments located within 4 km of the front beach range in size from 4 to 98 ha. Impoundments consist of central flat or slightly sloped muddy-bottomed areas surrounded by perimeter ditches. Water levels are regulated by wooden trunks with sliding flapgates and flashboard risers (Williams 1987). Depths are kept highest (35 -45 cm) in fall to accommodate water- fowl food plants. Gradual drawdown of water depths throughout the winter allows waterfowl to feed. Sheet water and temporary dry bed in spring encourage germination of waterfowl foods and provide mud-flat and shallow-water habitat for shorebirds. More complete management details are given in Weber and Haig (1996).
About 3000 shorebirds overwintered each year from 1991 to 1993 (Weber and Haig 1996). Shorebird numbers increased through- out the spring and peaked in late May at 15 000 - 19 000 migrants. Semipalmated sandpipers (Calidris pusilla) made up 83% of all shorebirds at our site from 3 to 16 May and 95 % from 17 to 25 May. Dowitchers (Limnodromus griseus and L. scolopaceus), dunlin (Calidris alpina), yellowlegs (Tringaflavipes and T. melano- leuca) , willets (Catoptrophorus semipalmatus), semipalmated plovers (Charadrius semipalmatus), black-bellied plovers (Pluvialis squatarola), and black-necked stilts (Himantopus mexicanus) were also present. The diet of semipalmated sandpipers was examined by Wenner (1987) in wetlands within 10 km of our site. The benthic invertebrate community was similar to ours and the diet consisted of ostracods, chironomid larvae, nereid polychaetes, nematodes, foraminiferans, Scirpus seeds, gastropods, and other insect larvae. Diets of short-billed dowitchers, dunlin, and yellowlegs on South Island consisted of polychaetes, insect larvae, and ostracods (Weber and Haig 1997).
Shorebird - prey correlations and exclosure experiments In 1993, plots (30 x 30 m) open to shorebirds were set up in impoundments to determine if there were correlations between shorebird density and prey density (or biomass). Five open plots were placed randomly on the east side of Wheeler Basin (48.1 ha), the impoundment most widely used by shorebirds, and five were placed randomly on the west side. Five open plots were placed on the west side of Gibson Pond (19.8 ha), another highly used site, for a total of 15 replicates. Open plots were marked by four wooden stakes 120 cm long (5 x 5 cm). Water depth was determined from one stake in each plot marked with nails at heights of 5, 10, 15, and 30 cm.
O 1997 NRC Canada
Can
. J. Z
ool.
Dow
nloa
ded
from
ww
w.n
rcre
sear
chpr
ess.
com
by
Uni
vers
ity o
f L
aval
on
07/0
9/14
For
pers
onal
use
onl
y.
Weber and Haig
Table 1. Densities of feeding shorebirds (per 100 mZ; mean + 1 SE) during 1993 on South Island, South Carolina.
Semipalmated All sandpiper Dunlin Semipalmated plover Dowitchers
shorebirds (Calidris pusilla) (C. alpina) (Charadrius .semipalmatus) (Limnodromus spp.)
May 2 0 .6f 0.2 0.2f 0.1 0.2 k0.08 0.0 May 16 3 .9f0.7 3.7+0.7 0.1 k0 .04 0.1 k0 .03 May 25 2.3 f 0.6 2.3 f 0 . 5 0 .0 0 .0
Shorebird effects on prey characteristics (density, biomass, and size) over time were determined within these plots via exclosure experiments. Treatments included open plots, exclosures, and cage controls. Cage controls were used because the presence of corner stakes can result in aggregation of invertebrates or sediment altera- tion (Virnstein 1978). Sediment effects were assumed to be minimal because all exclosures were in nontidal impoundments and rela- tively protected from wind by surrounding dikes and vegetation. One exclosure and cage control were systematically placed within each open plot. The exclosure was always at center-left within the plot when the plot was viewed from the shore. The cage control was at center-right 10 m from the exclosure. Each exclosure consisted of a 1.2 x 1.2 m roof made of lightweight plastic netting (Bird-X, 1.75 cm webbing, Dalen Products, Knoxville, Tennessee, U. S. A .) attached to the top of four vertical wooden stakes (2.5 x 2.5 x 50 cm long) pushed into the sediment. A fifth stake was placed in the center of each exclosure to prevent roof sagging. The stakes were sharpened to a point at the top to prevent tern and gull roost- ing. The height of the exclosure roof was periodically adjusted to be as close to the water surface as possible. This successfully excluded most shorebirds but allowed underwater access for blue crabs (Cullinectes sapidus), which also preyed on invertebrates. Because exclosures were open at the sides and support stakes were narrow, they provided no hiding places for blue crabs. Cage con- trols were identical with exclosures but did not include a roof. Shorebirds were observed readily entering and foraging in control areas. Occasionally, shorebirds were seen walking through exclos- ures, but foot tracks within the inner 1 mZ were minimal compared with tracks in cage controls and open plots.
Shorebird density in open plots was determined by scan sam- pling (Altmann 1974). Numbers of feeding birds of each species and water depths were recorded by open plot. Scans were taken on 4 days during the week before invertebrate sampling. Two scans were taken at each open plot approximately 1 h apart on each day. Both scans were taken within 2 h of high tide, which corresponded to peak shorebird density in impoundments. Densities of feeding shorebirds per open plot were averaged first by day, then over the 1-week scan-sampling period. No counts from an open plot with water depth exceeding 10 cm were included in the analysis because shorebirds almost never occurred at depths greater than 10 cm (Weber and Haig 1996). Before 2 May, shorebird densities in open plots were low ( T < 1.01100 m2; Table l ) , therefore we did not include these data in correlation analyses. Because many of the shorebirds at our site were semipalmated sandpipers, data were segregated at two depths, < 2.5 and 2.5 - 10 cm. Previous work at our site indicated that most semipalmated sandpipers occurred at water depths < 2.5 cm ( T = 0.9, SD = 1.5, n = 676; Weber and Haig 1996).
To estimate invertebrate density and biomass for each plot, invertebrate core samples were taken in March, when exclosures were placed, and again three times in May. From each treatment replicate on each sampling date, two sediment cores (later com- bined) were taken, using a beveled-edge PVC pipe (5 cm diameter) to a depth of 10 cm. Ten centimetres corresponded approximately to the bill length of long-billed dowitchers, the species with the
longest bill among probing shorebirds at our site. The combined pair of cores constituted the invertebrate sampling unit used in statistical analysis. Cores from exclosures and cage controls were taken from the inner 1 x 1 m areas at approximately 0.5-m inter- vals. Cores from open plots were taken approximately 1 m apart. The earliest cores were taken from the back of the open plot, exclosure, or cage control, and subsequent samples were taken closer to the front. Cores in all treatments were taken systematically rather than at random because crossing the open plot or maneuver- ing around exclosures or cage controls caused extensive sediment disturbance. Access to open plots was gained by mudshoe (Amark, Merrimack, New Hampshire, U.S.A.) if the water was too shallow for a canoe. Within 4 -5 h of being taken (occasionally 12 h, but in such cases samples were kept cool) each core sample was washed through a 0.5 mm mesh sieve and preserved in buffered 10% for- malin stained with Rose Bengal. We assumed that all prey in core samples were available to shorebirds because examination of gut contents at our site revealed that shorebirds ate ostracods as small as 1.0 mm long. Thus, anything that remained on our 0.5-mm sieve was considered available to shorebirds. Invertebrates were sorted, counted, and identified using a stereomicroscope at 30 x . Biomass of invertebrates (all species combined) in each core was measured after drying at 105°C for 24 h.
The size of the large nereid polychaete Laeonereis culveri was determined because it was the largest common prey specimen avail- able and the most conspicuous constituent of shorebird gut samples when these were analyzed in 1992 (Weber and Haig 1997). All uninjured L. culveri were measured at the widest part of the pro- stomium using an ocular micrometer at 30 X . Average head width was calculated first by sample then by treatment. Head width was positively correlated with body length for L. culveri (rZ = 0.68, n = 114, P < 0.05, length = 4.3(width) - 0.7). However, head width was thought to be a more accurate measure of size than length because of variable longitudinal contractions by polychaetes.
Correlations between shorebird density and prey variables in open plots were analyzed by linear regression ( P < 0.05) after transformation when necessary to meet homogeneous variance and normality assumptions of ANOVA. For comparing means of prey variables among treatments in the exclosure experiment, statistical analysis was generally confined to the last sampling date of each year to avoid pseudoreplication. For each prey variable, an ANOVA was employed with treatment (cage control, exclosure, or open plot) as main effect and treatment set (one exclosure and control in an open plot) as a blocking factor. Values were ln- transformed (variable + 1) when necessary. Hartley's test (Ott 1988), an extension of the F test for more than two treatments, was used to determine whether variances among treatments were equal. When there was a significant result in the overall ANOVA, we used a Games and Howell (GH) test to compare pairs of means. The GH test is appropriate when sample sizes are unequal and variances are unequal even after transformation (Day and Quinn 1989). Some samples were missing from each analysis as a result of collapsed exclosures, spilled or spoiled samples, or, in the case of head width, finding no specimens of L. culveri in the sample. We determined the power of the analysis (Cohen 1988) in which we failed to reject
O 1997 NRC Canada
Can
. J. Z
ool.
Dow
nloa
ded
from
ww
w.n
rcre
sear
chpr
ess.
com
by
Uni
vers
ity o
f L
aval
on
07/0
9/14
For
pers
onal
use
onl
y.
Can. J. Zool. Vol. 75, 1997
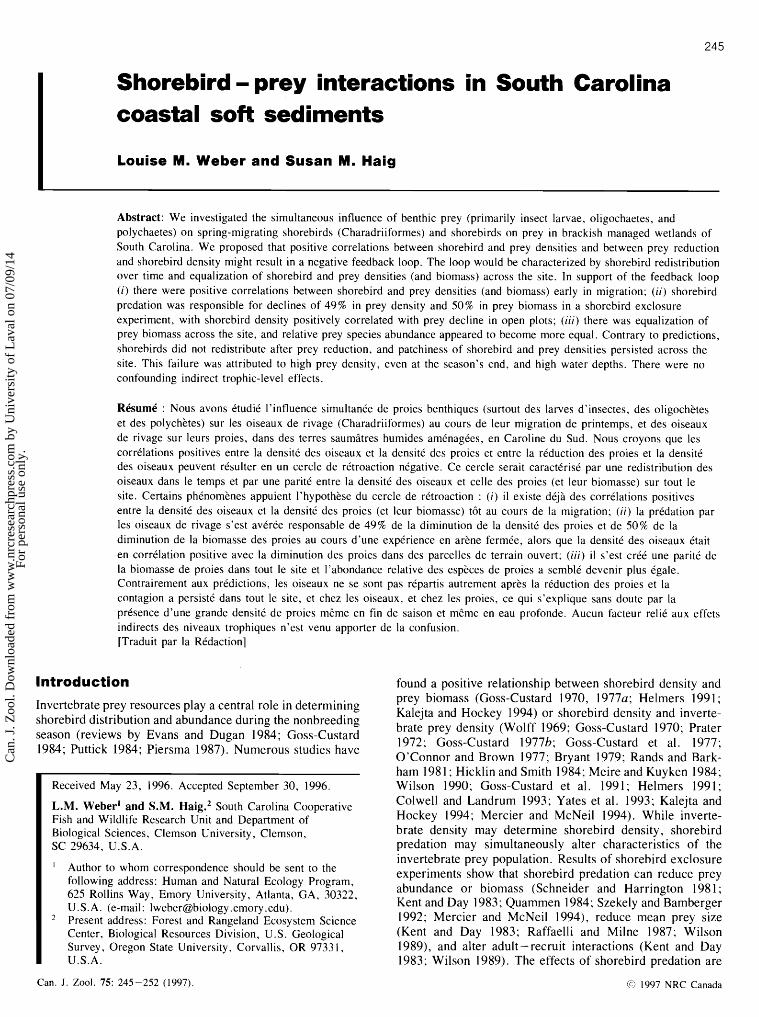
Fig. 1. Relationship between mean density of feeding shorebirds per day and prey density and biomass in South Island open plots. Core sample size was 392 cm? * and **, statistically significant at P < 0.05 and P < 0.01, respectively.
May 16
May 25
No. of prey Prey biomass per core per core (mg)
the null hypothesis. For the power analyses, f was the effect size index for cases with more than two treatments, u was the numerator degrees of freedom in the F ratio, and n ' was an adjusted mean Sam- ple size for experiments in which a blocking factor had been used (Cohen 1988, p. 365). To determine whether shorebird densities and prey variables tended to become more equal across the study site over time, the CVs (standard deviationlmean of all open plots) were compared between the first and last sampling dates (penulti- mate and last for shorebird density). A t test was used to determine the significance of the difference according to the recommendations of Sokal and Braumann (1980). Values were In-transformed (varia- ble + 1).
Results
Shorebird density - prey density (and biomass) correlations
Shorebird density was significantly correlated with prey den- sity at depths from 2.5 to 10 cm for the 3 - 16 May sampling period and at depths < 2.5 cm for the 17 -25 May sampling period (Fig. 1). For correlations that were not significant, data followed the same positive linear pattern as in the sig- nificant cases, but sample sizes were smaller. Thus, there appears to have been an aggregative response between shore- birds and prey for both sampling dates. Shorebird density was significantly correlated with prey biomass only during the 3 - 16 May sampling period and only at depths from 2.5 to 10 cm (Fig. 1). The lack of a significant correlation at
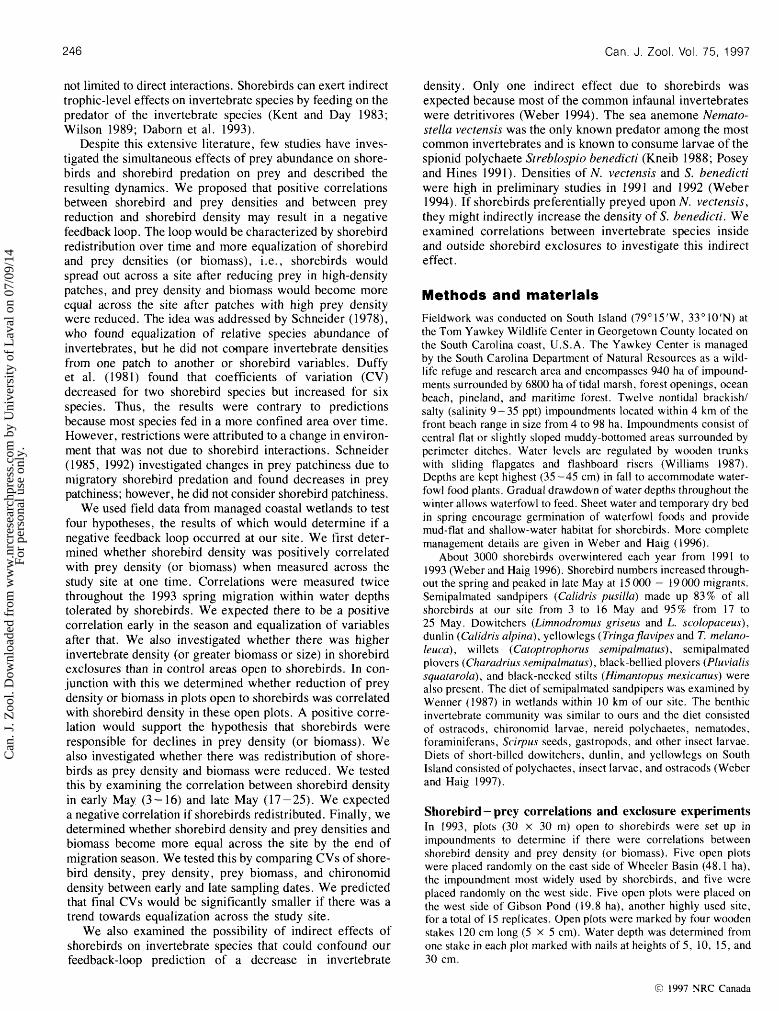
Fig. 2. Relationship between change in prey density (and biomass) from 16 to 25 May, 1993, and mean densities of feeding shorebirds in open plots during that period. A change less than zero indicates a gain. Core sample size was 392 cm3.
Shorebird density
depths <2.5 cm may be explained by little variance in prey biomass among plots (Fig. 1).
Shorebird exclosure experiments Reductions in prey density over time appeared to be a func- tion of shorebird density for two reasons. First, changes in prey density within individual open plots from 16 to 25 May were correlated with shorebird density in those plots during that period, indicating that loss was proportional to shorebird density (Fig. 2). Second, the results of the exclosure experi- ments indicate that shorebird predation reduced prey density (Fig. 3). There were significant differences between exclos- ures and cage controls (GH c r i t i ~ a l ~ , ~ ~ = 8 1.7, df = 17) and between exclosures and open plots (GH c r i t i ~ a l ~ , ~ ~ =
78.8, df = 17). There was no difference between cage con- trols and open plots (GH c r i t i ~ a l ~ , ~ ~ = 41.0, df = 20), which was expected because shorebirds had access to both areas. When cage controls were compared with exclosures, the mean reduction in prey density due to shorebirds was 49 % (SE = 1 1 % , n = 13). The standard error for the latter analysis was high mainly because of one plot in which the control contained more invertebrates than the exclosure. For the control sample, 48/53 invertebrates were small oligo-
O 1997 NRC Canada
Can
. J. Z
ool.
Dow
nloa
ded
from
ww
w.n
rcre
sear
chpr
ess.
com
by
Uni
vers
ity o
f L
aval
on
07/0
9/14
For
pers
onal
use
onl
y.
Weber and Haig
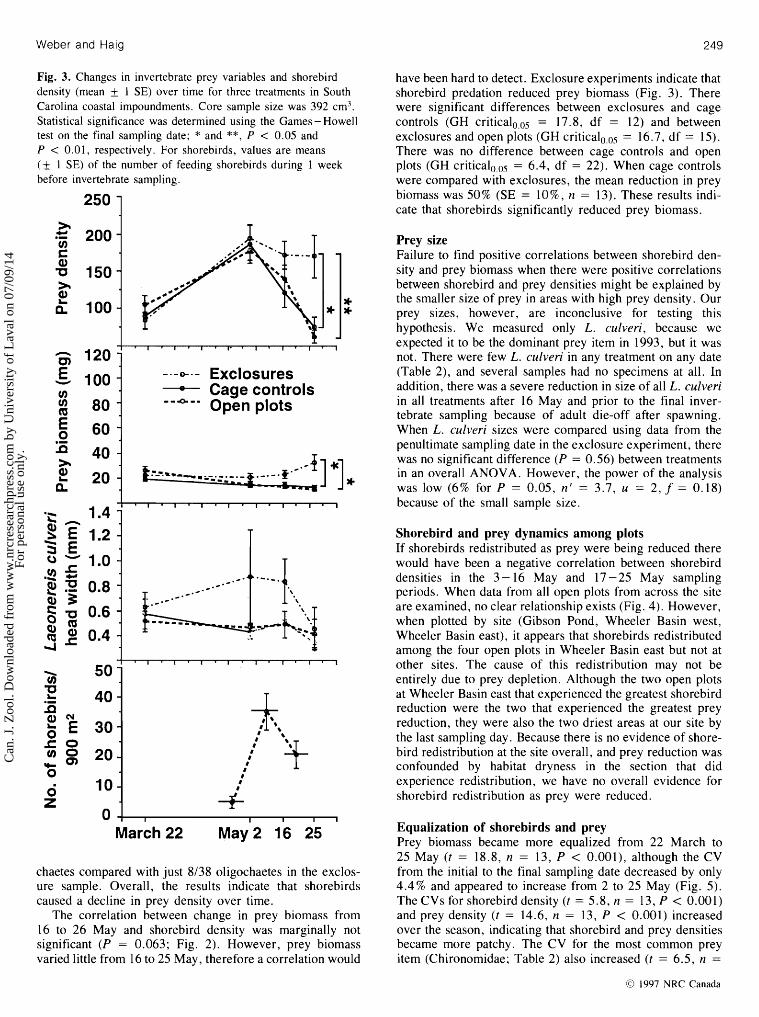
Fig. 3. Changes in invertebrate prey variables and shorebird density (mean $ 1 SE) over time for three treatments in South Carolina coastal impoundments. Core sample size was 392 cm3. Statistical significance was determined using the Games - Howell test on the final sampling date; * and **, P < 0.05 and P < 0.01, respectively. For shorebirds, values are means ($ 1 SE) of the number of feeding shorebirds during 1 week before invertebrate sampling.
March 22
>r .I - 200 - V) C Q)
150- >r
g 100:
- 120- E' - 100- V)
80 - 6 0 \ 0 .-
May 2 16 25
/. -. -. ,-/**
+** *+** #\]j; . 4' .
I ~ I - I ~ I - . I . I . I . ~
-. - *-- Exclosures - Cage controls ....&... Open plots
chaetes compared with just 8/38 oligochaetes in the exclos- ure sample. Overall, the results indicate that shorebirds caused a decline in prey density over time.
The correlation between change in prey biomass from 16 to 26 May and shorebird density was marginally not significant (P = 0.063; Fig. 2). However, prey biomass varied little from 16 to 25 May, therefore a correlation would
have been hard to detect. Exclosure experiments indicate that shorebird predation reduced prey biomass (Fig. 3). There were significant differences between exclosures and cage controls (GH c r i t i ~ a l ~ , ~ ~ = 17.8, df = 12) and between exclosures and open plots (GH criticalo,os = 16.7, df = 15). There was no difference between cage controls and open plots (GH c r i t i ~ a l ~ ~ ~ ~ = 6.4, df = 22). When cage controls were compared with exclosures, the mean reduction in prey biomass was 50% (SE = l o%, n = 13). These results indi- cate that shorebirds significantly reduced prey biomass.
Prey size Failure to find positive correlations between shorebird den- sity and prey biomass when there were positive correlations between shorebird and prey densities might be explained by the smaller size of prey in areas with high prey density. Our prey sizes, however, are inconclusive for testing this hypothesis. We measured only L. culveri, because we expected it to be the dominant prey item in 1993, but it was not. There were few L. culveri in any treatment on any date (Table 2), and several samples had no specimens at all. In addition, there was a severe reduction in size of all L. culveri in all treatments after 16 May and prior to the final inver- tebrate sampling because of adult die-off after spawning. When L. culveri sizes were compared using data from the penultimate sampling date in the exclosure experiment, there was no significant difference (P = 0.56) between treatments in an overall ANOVA. However, the power of the analysis was low (6% for P = 0.05, n' = 3.7, u = 2, f = 0.18) because of the small sample size.
Shorebird and prey dynamics among plots If shorebirds redistributed as prey were being reduced there would have been a negative correlation between shorebird densities in the 3- 16 May and 17-25 May sampling periods. When data from all open plots from across the site are examined, no clear relationship exists (Fig. 4). However, when plotted by site (Gibson Pond, Wheeler Basin west, Wheeler Basin east), it appears that shorebirds redistributed among the four open plots in Wheeler Basin east but not at other sites. The cause of this redistribution may not be entirely due to prey depletion. Although ,the two open plots at Wheeler Basin east that experienced the greatest shorebird reduction were ,the two that experienced the greatest prey reduction, they were also the two driest areas at our site by the last sampling day. Because there is no evidence of shore- bird redistribution at the site overall, and prey reduction was confounded by habitat dryness in the section that did experience redistribution, we have no overall evidence for shorebird redistribution as prey were reduced.
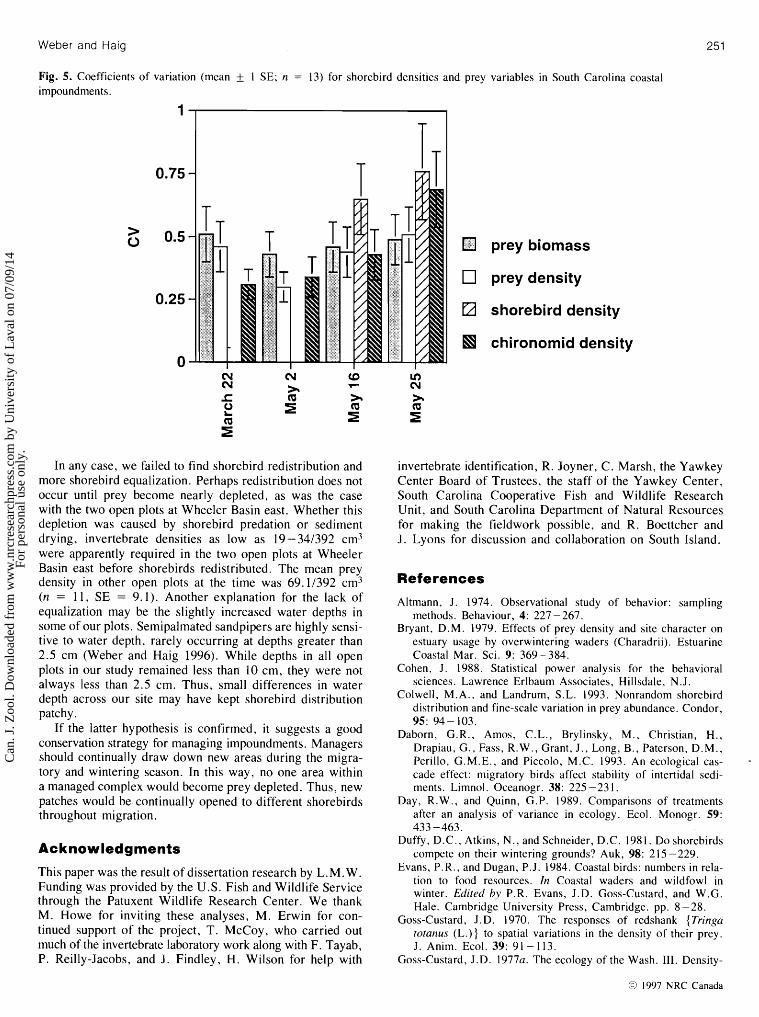
Equalization of shorebirds and prey Prey biomass became more equalized from 22 March to 25 May (t = 18.8, n = 13, P < 0.001), although the CV from the initial to the final sampling date decreased by only 4.4% and appeared to increase from 2 to 25 May (Fig. 5). The CVs for shorebird density (t = 5.8, n = 13, P < 0.001) and prey density (t = 14.6, n = 13, P < 0.001) increased over the season, indicating that shorebird and prey densities became more patchy. The CV for the most common prey item (Chironomidae; Table 2) also increased (t = 6.5, n =
O 1997 NRC Canada
Can
. J. Z
ool.
Dow
nloa
ded
from
ww
w.n
rcre
sear
chpr
ess.
com
by
Uni
vers
ity o
f L
aval
on
07/0
9/14
For
pers
onal
use
onl
y.
Can. J. Zool. Vol. 75, 1997
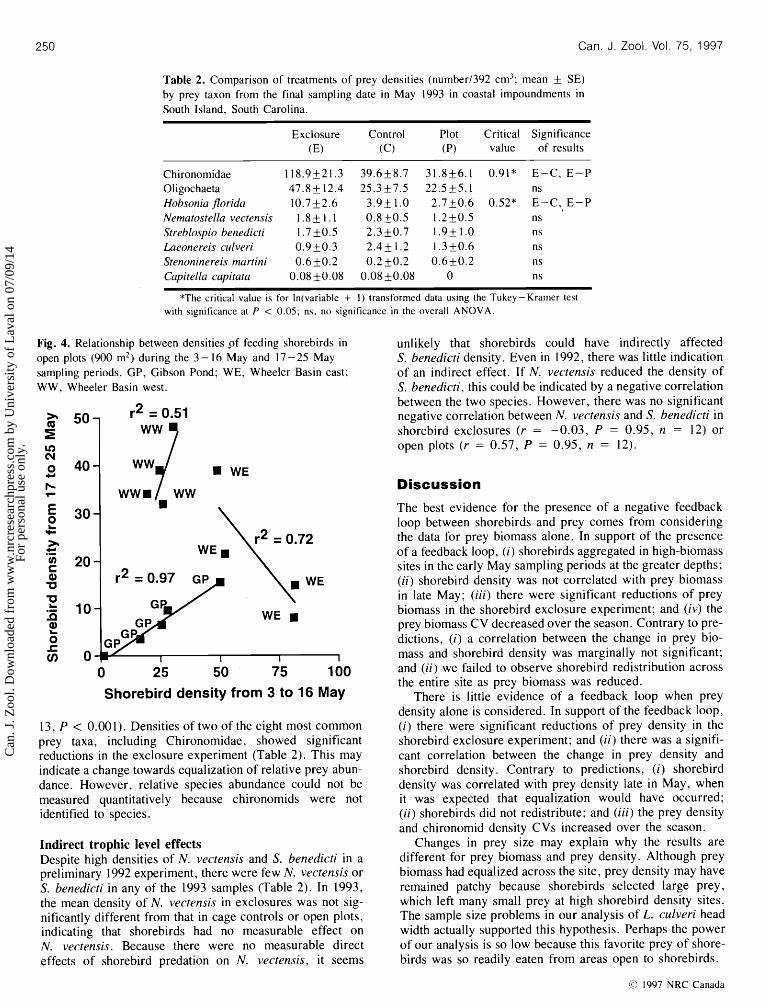
Table 2. Comparison of treatments of prey densities (number1392 cm3; mean + SE) by prey taxon from the final sampling date in May 1993 in coastal impoundments in South Island, South Carolina.
Exclosure Control Plot Critical Significance (E) (c) (P) value of results
Chironomidae 118.9k21.3 39.6k8.7 31.8f 6.1 0.91* E-C, E-P Oligochaeta 47.8k 12.4 25.3k7.5 22.515.1 ns Hobsonia j7orida 10.7k2.6 3.9k1.0 2.7k0.6 0.52* E-C, E-P Nematostellavectensis 1 . 8 f l . l 0 .8k0.5 1.2k0.5 ns Streblospiobenedicti 1.7k0.5 2.3k0.7 1.9k1.0 n s Laeonereis culveri 0.9k0.3 2 .4k 1.2 1.3f 0.6 ns Stenoninereismartini 0.6k0.2 0.2k0.2 0.6k0.2 ns Capitella capitata 0.08 k0.08 0.08 k0.08 0 ns
*The critical value is for In(variable + 1) transformed data using the Tukey-Kramer test with significance at P < 0.05; ns, no significance in the overall ANOVA.
Fig. 4. Relationship between densities pf feeding shorebirds in unlikely that shorebirds could have indirectly affected open plots (900 m2) during the 3 - 16 May and 17 - 25 May S. benedicti density. Even in 1992, there was little indication sampling periods. GP, Gibson Pond; WE, Wheeler Basin east; of an indirect effect. If N. vectensis reduced the density of WW, Wheeler Basin west. S. benedicti, this could be indicated by a negative correlation
between the two species. However, there was no significant negative correlation between N. vectensis and S. benedicti in shorebird exclosures (r = -0.03, P = 0.95, n = 12) or open plots (r = 0.57, P = 0.95, n = 12).
Discussion
The best evidence for the presence of a negative feedback loop between shorebirds and prey comes from considering the data for prey biomass alone. In support of the presence of a feedback loop, (i) shorebirds aggregated in high-biomass
20 - sites in the early May sampling periods at the greater depths; (ii) shorebird density was not correlated with prey biomass in late May; (iii) there were significant reductions of prey biomass in the shorebird exclosure experiment; and (iv) the prey biomass CV decreased over the season. Contrary to pre- dictions, (i) a correlation between the change in prey bio-
I mass and shorebird density was marginally not significant;
0 25 50 75 100 and (ii) we failed to observe shorebird redistribution across the entire site as prey biomass was reduced.
Shorebird density from 3 to 16 May There is little evidence of a feedback loop when prey
13, P < 0.001). Densities of two of the eight most common prey taxa, including Chironomidae, showed significant reductions in the exclosure experiment (Table 2). This may indicate a change towards equalization of relative prey abun- dance. However, relative species abundance could not be measured quantitatively because chironomids were not identified to species.
Indirect trophic level effects Despite high densities of N. vectensis and S. benedicti in a preliminary 1992 experiment, there were few N. vectensis or S. benedicti in any of the 1993 samples (Table 2). In 1993, the mean density of N. vectensis in exclosures was not sig- nificantly different from that in cage controls or open plots, indicating that shorebirds had no measurable effect on N. vectensis. Because there were no measurable direct effects of shorebird predation on N. vectensis, it seems
density alone is considered. In support of the feedback loop, (i) there were significant reductions of prey density in the shorebird exclosure experiment; and (ii) there was a signifi- cant correlation between the change in prey density and shorebird density. Contrary to predictions, (i) shorebird density was correlated with prey density late in May, when it was expected that equalization would have occurred; (ii) shorebirds did not redistribute; and (iii) the prey density and chironomid density CVs increased over the season.
Changes in prey size may explain why the results are different for prey biomass and prey density. Although prey biomass had equalized across the site, prey density may have remained patchy because shorebirds selected large prey, which left many small prey at high shorebird density sites. The sample size problems in our analysis of L. culveri head width actually supported this hypothesis. Perhaps the power of our analysis is so low because this favorite prey of shore- birds was so readily eaten from areas open to shorebirds.
O 1997 NRC Canada
Can
. J. Z
ool.
Dow
nloa
ded
from
ww
w.n
rcre
sear
chpr
ess.
com
by
Uni
vers
ity o
f L
aval
on
07/0
9/14
For
pers
onal
use
onl
y.
Weber and Haig
Fig. 5. Coefficients of variation (mean f 1 SE; n = 13) for shorebird densities and prey variables in South Carolina coastal impoundments.
1
In any case, w e failed to find shorebird redistribution and more shorebird equalization. Perhaps redistribution does not occur until prey become nearly depleted, as was the case with the two open plots at Wheeler Basin east. Whether this depletion was caused by shorebird predation o r sediment drying, invertebrate densities as low as 19-341392 cm3 were apparently required in the two open plots at Wheeler Basin east before shorebirds redistributed. The mean prey density in other open plots at the time was 69.11392 cm3 (n = 1 1 , S E = 9.1). Another explanation for the lack of equalization may be the slightly increased water depths in some of our plots. Semipalmated sandpipers are highly sensi- tive to water depth, rarely occurring at depths greater than 2.5 cm (Weber and Haig 1996). While depths in all open plots in our study remained less than 10 c m , they were not always less than 2.5 cm. Thus, small differences in water depth across our site may have kept shorebird distribution patchy.
If the latter hypothesis is confirmed, it suggests a good conservation strategy for managing impoundments. Managers should continually draw down new areas during the migra- tory and wintering season. In this way, no one area within a managed complex would become prey depleted. Thus, new patches would be continually opened to different shorebirds throughout migration.
Acknowledgments
This paper was the result of dissertation research by L .M.W. Funding was provided by the U.S. Fish and Wildlife Service through the Patuxent Wildlife Research Center. W e thank M . Howe for inviting these analyses, M . Erwin for con- tinued support of the project, T . McCoy, who carried out much of the invertebrate laboratory work along with F. Tayab, P. Reilly-Jacobs, and J . Findley, H . Wilson for help with
prey biomass
prey density
shorebird density
chironomid density
invertebrate identification, R. Joyner, C . Marsh, the Yawkey Center Board of Trustees, the staff of the Yawkey Center, South Carolina Cooperative Fish and Wildlife Research Unit, and South Carolina Department of Natural Resources for making the fieldwork possible, and R. Boettcher and J . Lyons for discussion and collaboration on South Island.
References
Altmann, J. 1974. Observational study of behavior: sampling methods. Behaviour, 4: 227 -267.
Bryant, D.M. 1979. Effects of prey density and site character on estuary usage by overwintering waders (Charadrii). Estuarine Coastal Mar. Sci. 9: 369-384.
Cohen, J. 1988. Statistical power analysis for the behavioral sciences. Lawrence Erlbaum Associates, Hillsdale, N.J.
Colwell, M. A., and Landrum, S.L. 1993. Nonrandom shorebird distribution and fine-scale variation in prey abundance. Condor, 95: 94-103.
Daborn, G.R., Amos, C.L., Brylinsky, M., Christian, H., Drapiau, G., Fass, R.W., Grant, J . , Long, B., Paterson, D.M., Perillo, G.M.E., and Piccolo, M.C. 1993. An ecological cas- - cade effect: migratory birds affect stability of intertidal sedi- ments. Limnol. Oceanogr. 38: 225 -23 1.
Day, R.W., and Quinn, G.P. 1989. Comparisons of treatments after an analysis of variance in ecology. Ecol. Monogr. 59: 433 -463.
Duffy, D.C., Atkins, N., and Schneider, D.C. 1981. Do shorebirds compete on their wintering grounds? Auk, 98: 215-229.
Evans, P.R., and Dugan, P.J. 1984. Coastal birds: numbers in rela- tion to food resources. In Coastal waders and wildfowl in winter. Edited by P.R. Evans, J.D. Goss-Custard, and W.G. Hale. Cambridge University Press, Cambridge. pp. 8-28.
Goss-Custard, J.D. 1970. The responses of redshank {Tringa totanus (L.)) to spatial variations in the density of their prey. J. Anim. Ecol. 39: 91 - 113.
Goss-Custard, J.D. 1977a. The ecology of the Wash. 111. Density-
O 1997 NRC Canada
Can
. J. Z
ool.
Dow
nloa
ded
from
ww
w.n
rcre
sear
chpr
ess.
com
by
Uni
vers
ity o
f L
aval
on
07/0
9/14
For
pers
onal
use
onl
y.
Can. J. Zool. Vol. 75, 1997
related behavior and the possible effects of a loss of feeding grounds on wading birds (Charadrii). J. Appl. Ecol. 14: 72 1 - 739.
Goss-Custard, J. D. 1977b. Predator responses and prey mortality in redshank, Tringa totanus (L.), and a preferred prey, Corophium volutator (Pallas). J. Anim. Ecol. 46: 2 1 - 35.
Goss-Custard, J.D. 1984. Intake rates and food supply in migrating and wintering shorebirds. In Shorebirds: migration and foraging behavior. Edited by J. Burger and B.L. Olla. Plenum Publishing Corp., New York. pp. 233-271.
Goss-Custard, J.D., Kay, D.G., and Blindell, R.M. 1977. The den- sity of migratory and overwintering redshank, Tringa totanus (L.) and curlew, Numenius arquata (L.) in relation to the density of their prey in south-east England. Estuarine Coastal Mar. Sci. 5: 497-510.
Goss-Custard, J.D., Warwick, R.M., Kirby, R., McGrorty, S., Clarke, R.T., Pearson, B., Rispin, W.E., le V. dit Durell, S.E.A., and Rose, R.J. 1991. Towards predicting wading bird densities from predicted prey densities in a post-barrage Severn estuary. J. Appl. Ecol. 28: 1004- 1026.
Helmers, D.L. 1991. Habitat use by migrant shorebirds and inver- tebrate availability in a managed wetland complex. M.S. thesis, University of Missouri, Columbia.
Hicklin, P.W., and Smith, P.C. 1984. Selection of foraging sites and invertebrate prey by migrant Semipalmated Sandpipers, Calidris pusilla (Pallas), in Minas Basin, Bay of Fundy . Can. J. Zool. 62: 2201 -2210.
Kalejta, B., and Hockey, P.A.R. 1994. Distribution of shorebirds at the Berg River estuary, South Africa, in relation to foraging mode, food supply and environmental features. Ibis, 136: 233 - 239.
Kent, A.C., and Day, R.W. 1983. Population dynamics of an infaunal polychaete: the effect of predators and an adult - recruit interaction. J. Exp. Mar. Biol. Ecol. 73: 185 -203.
Kneib, R.T. 1988. Testing for indirect effects of predation in an intertidal soft-bottom community. Ecology, 69: 1795 - 1805.
Meire, P., and Kuyken, E. 1984. Relations between the distribution of waders and the intertidal benthic fauna of the Oosterschelde, Netherlands. In Coastal waders and wildfowl in winter. Edited by P.R. Evans, J.D. Goss-Custard, and W .G. Hale. Cambridge University Press, Cambridge. pp. 57 - 68.
Mercier, F., and McNeil, R. 1994. Seasonal variations in intertidal density of invertebrate prey in a tropical lagoon and effects of shorebird predation. Can. J. Zool. 72: 1755 - 1763.
O'Connor, R.J., and Brown, R.A. 1977. Prey depletion and forag- ing strategy in the oystercatcher Haematopus ostralegus. Oecologia, 27: 75 -92.
Ott, L. 1988. An introduction to statistical methods and data analy- sis. PWS-Kent Publishing Co., Boston, Mass.
Piersma, T. 1987. Production by intertidal benthic animals and limits to their predation by shorebirds: a heuristic model. Mar. Ecol. Prog. Ser. 38: 187-196.
Posey , M .H., and Hines, A.H. 199 1. Complex predator - prey interactions within an estuarine benthic community. Ecology, 72: 2155-2169.
Prater, A.J. 1972. The ecology of Morecambe Bay. 111. The food and feeding habits of knot Calidris canutus (L.) in Morecambe Bay. J. Appl. Ecol. 9: 179-194.
Puttick, G.M. 1984. Foraging and activity patterns in wintering shorebirds. In Shorebirds: migration and foraging behavior. Edited by J. Burger and B.L. Olla. Plenum Publishing Corp., New York. pp. 203 -233.
Quammen, M.L. 1984. Invertebrates in intertidal mudflats: an experimental test. Ecology, 65: 529 - 537.
Raffaelli, D., and Milne, H. 1987. An experimental investigation of the effects of shorebird and flatfish predation on estuarine invertebrates. Estuarine Coastal Shelf Sci. 24: 1 - 13.
Rands, M.R.W., and Barkham, J.P. 198 1. Factors controlling within-flock feeding densities in three species of wading bird. Ornis Scand. 12: 28-36.
Schneider, D. 1978. Equalisation of prey numbers by migratory birds. Nature (London), 271: 353 -354.
Schneider, D. 1985. Predation on the urchin Echinometra lucunter (Linnaeus) by migratory shorebirds on a tropical reef flat. J. Exp. Mar. Biol. Ecol. 92: 19-27.
Schneider, D. 1992. Thinning and clearing of prey by predators. Am. Nat. 139: 148- 160.
Schneider, D.C., and Harrington, B.A. 1981. Timing of shorebird migration in relation to prey depletion. Auk, 98: 801 - 8 1 1.
Sokal, R.R., and Braumann, C.A. 1980. Significance tests for coefficients of variation and variability profiles. Syst. Zool. 29: 50 -66.
Szekely, T., and Bamberger, Z. 1992. Predation of waders (Charadrii) on prey populations: an exclosure experiment. J. Anim. Ecol. 61: 447-456.
Virnstein, R.W. 1978. Predator caging experiments in soft sedi- ments: caution advised. In Estuarine interactions. Edited by M.L. Wiley. Academic Press, New York. pp. 261 -273.
Weber, L.M. 1994. Foraging ecology and conservation of shore- birds in South Carolina coastal wetlands. Ph. D. thesis, Clemson University, Clemson, S.C.
Weber, L.M., and Haig, S.M. 1996. Shorebird use of South Caro- lina managed and natural coastal wetlands. J . W ildl. Manage. 60: 73-82.
Weber, L.M., and Haig, S.M. 1997. Shorebird diet and size selec- tion of nereid polychaetes in South Carolina coastal diked wet- lands. J. Field Ornithol. In press.
Wenner, E.L. 1987. Benthic macrofauna. In South Carolina coastal wetland impoundments. Vol. 11. Technical Synthesis. Edited by M.R. DeVoe and D.S. Baughman. Publ. No. SC-SC-TR-86-2, South Carolina Sea Grant Consortium, Charleston. pp. 255 - 293.
Williams, K.R. 1987. Construction, maintenance and water control structures of tidal impoundments in South Carolina. In Proceed- ings of a Symposium on Waterfowl and Wetlands Management in the Coastal Zone of the Atlantic Flyway, Wilmington, Del., 16- 19 September 1986. Edited by W.R. Whitman and W.H. Meredith. Delaware Department of Natural Resources and Environmental Control, Dover, pp. 139 - 166.
Wilson, W.H. 1989. Predation and the mediation of intraspecific competition in an infaunal community in the Bay of Fundy. J . Exp. Mar. Biol. Ecol. 132: 22 1 - 245.
Wilson, W .H. 1990. Relationship between prey abundance and foraging site selection by semipalmated sandpipers on a Bay of Fundy mudflat. J. Field Ornithol. 6: 9 - 19.
Wolff, W.J. 1969. Distribution of non-breeding waders in an estua- rine area in relation to the distribution of their food organisms. Ardea, 57: 1 -?8.
Yates, M.G., Goss-Custard, J.D., McGrorty, S . , Lakhani, K.H., Le V. Dit Durell, S.E.A., Clarke, R.T., Rispin, W .E., Moy, I., Yates, T. , Plant, R.A., and Frost, A.J. 1993. Sediment characteristics, invertebrate densities and shorebird densities on the inner banks of the Wash. J. Appl. Ecol. 30: 599-614.
O 1997 NRC Canada
Can
. J. Z
ool.
Dow
nloa
ded
from
ww
w.n
rcre
sear
chpr
ess.
com
by
Uni
vers
ity o
f L
aval
on
07/0
9/14
For
pers
onal
use
onl
y.