shopp project prioritization - caltrans · totality of caltrans actions than by the ... stewardship...
TRANSCRIPT
DRAFT FINAL
SHOPP ProjectPrioritization
Application of a Project
Prioritization Framework to the
2016 SHOPP
March 3, 2016

DRAFT FINAL
(This page is intentionally blank.)
DRAFT FINAL
TableofContents1. INTRODUCTION ......................................................................................................................................... 1
2. THE DECISION ANALYSIS FRAMEWORK ...................................................................................................... 3
2.1. MULTI‐OBJECTIVE DECISION ANALYSIS FOR PROJECT PRIORITIZATION ......................................................................... 3
2.2. OBJECTIVES HIERARCHY ...................................................................................................................................... 4
2.3. CALCULATION FRAMEWORK ................................................................................................................................ 8
3. ANALYSIS OF THE 2016 SHOPP PROJECT PORTFOLIO ................................................................................. 11
3.1. OVERVIEW OF THE NEW 2016 SHOPP PROJECTS ................................................................................................. 11
3.2. ANALYSIS OF THE PORTFOLIO ............................................................................................................................. 12
3.3. OBSERVATIONS ON PRIORITIZATION OUTCOMES ................................................................................................... 19
4. LIMITATIONS OF THE ANALYSIS AND METHOD .......................................................................................... 23
4.1. DATA AVAILABILITY AND ACCURACY .................................................................................................................... 23
4.2. OVER‐SIMPLIFICATION OF COMPLEX CORRELATIONS .............................................................................................. 23
5. RECOMMENDATIONS................................................................................................................................ 25
APPENDIX A – DESCRIPTION OF CALCULATIONS ................................................................................................ 27
A.1 – MINIMIZE INJURIES AND FATALITIES OF WORKERS ..................................................................................................... 27
A.2 – MINIMIZE INJURIES AND FATALITIES OF USERS .......................................................................................................... 30
A.3 – MAXIMIZE COMMUNITY HEALTH THROUGH ACTIVE TRANSPORTATION .......................................................................... 32
A.4 – MINIMIZE COST OF MAINTAINING TRANSPORTATION INFRASTRUCTURE ......................................................................... 34
A.5 – MINIMIZE COSTS TO USERS ................................................................................................................................... 38
A.6 – MINIMIZE TRAVEL DELAY TIME FOR USERS ............................................................................................................... 40
A.7 – MAXIMIZE TRAVEL TIME RELIABILITY FOR USERS ....................................................................................................... 42
A.8 – MAXIMIZE MULTIMODAL TRANSPORTATION OPTIONS ................................................................................................. 44
A.9 – MINIMIZE DISRUPTION OF THE ECONOMY ................................................................................................................ 45
A.10 – MINIMIZE DAMAGE TO ENVIRONMENT .................................................................................................................. 47
A.11 – MAXIMIZE RESILIENCE OF INFRASTRUCTURE ............................................................................................................ 49
APPENDIX B – 2016 SHOPP PROJECT SCORES AND PRIORITIES ........................................................................... 51

DRAFT FINAL
(This page is intentionally blank.)
DRAFT FINAL
2016 SHOPP Project Prioritization 1
1. IntroductionThis report documents the analysis and prioritization of a portfolio of 384 newly proposed projects for
the 2016 State Highway Operation and Protection Program (SHOPP), having a multi‐year funding of
approximately $4.6 million. The project prioritization approach used in this analysis builds upon a
methodology developed for the 2014 SHOPP, documented in the June 2015 report, “SHOPP Pilot Project
Phase 1, A Framework for Project Prioritization.”1 This prior work demonstrated the application and
benefits of a Multi‐Objective Decision Analysis (MODA) framework to aid decision‐makers in identifying
a project portfolio delivering the greatest value to stakeholders. The approach was shown to bring
transparency to the project prioritization process, providing a quantitative basis for decision making and
a mechanism to communicate the alignment of project priorities with strategic objectives. Furthermore,
in contrast to past prioritization processes, the new approach breaks down funding “silos” by ranking
projects based on objective, data‐derived value and direct consideration of the project’s cost.
A number of changes were made in the 2016 SHOPP analysis, based on experience from the prior 2014
SHOPP analysis and the more recent work through the 2016 SHOPP Asset Management Pilot Program2.
Although still evolving, the calculation framework for the 2016 SHOPP incorporates more relevant
transportation data and considers a broader range of factors in determining project value. The
spreadsheet‐based tool, initially developed for the 2014 SHOPP, was updated to include these
improvements. New and revised report products have been added to more effectively present
prioritization outcomes.
1 http://www.dot.ca.gov/tam/shopp/index.html 2 http://www.dot.ca.gov/tam/shopp/ampp.html

DRAFT FINAL
2 2016 SHOPP Project Prioritization
(This page is intentionally blank.)
DRAFT FINAL
2016 SHOPP Project Prioritization 3
2. TheDecisionAnalysisFrameworkDecision Analysis3 encompasses the methods and tools to systematically consider key aspects of a
decision‐making problem, guides the selection of the best alternative, and establishes a logical and
transparent framework that provides insight on how decisions are made. Decision analysis is a discipline
that combines elements of operations research, management science, and systems analysis. The goal of
the decision‐making process is to provide the decision maker with a logical and defensible framework
that can help articulate how choices and priorities were made. Project prioritization is a specific
implementation of decision analysis based on the same fundamental principles. Where in decision
analysis the goal is to determine the single best alternative, project prioritization aims to identify an
optimized portfolio of projects from a pool of projects.
The decision analysis framework is comprised of an Objectives Hierarchy, a Value Function and its sub‐
models, and scoring and weighting procedures. Collectively, these components are used to calculate the
Project Value. The Project Value‐to‐Cost Ratio is then used to determine its priority relative to other
projects. The definitions of these terms and this calculation framework are described in this section.
2.1. Multi‐ObjectiveDecisionAnalysisforProjectPrioritizationA Multi‐Objective Decision Analysis (MODA) approach is implemented for the prioritization of SHOPP
projects. Specifically, a Multi‐Attribute Value Theory (MAVT) process, a sub‐type of MODA, is used to
carry out a number of key steps, as shown in Figure 2‐1.
Figure 2‐1‐ MODA/MAVT Process
In this process, an Objectives Hierarchy (Figure 2‐2) is developed that ties the decision maker’s high level
goals to lower level criteria that can be measured. The objectives hierarchy provides a means to
deconstruct organizational goals into fundamental objectives. Weights are determined for objectives,
and a linear‐additive, multi‐attribute value function is then used to combine the products of the
weighted values to determine the overall value that a project delivers. Portfolios of projects are
analyzed for sensitivity to changes in the weighting assignment, which provides insight to the decision‐
making process.
3 http://web.stanford.edu/class/cee115/wiki/uploads/Main/Schedule/OverviewDA.pdf
Objectives HierarchyValue
Functions
Data Compilation and Analysis
Scoring WeightingSensitivity Analysis
DRAFT FINAL
4 2016 SHOPP Project Prioritization
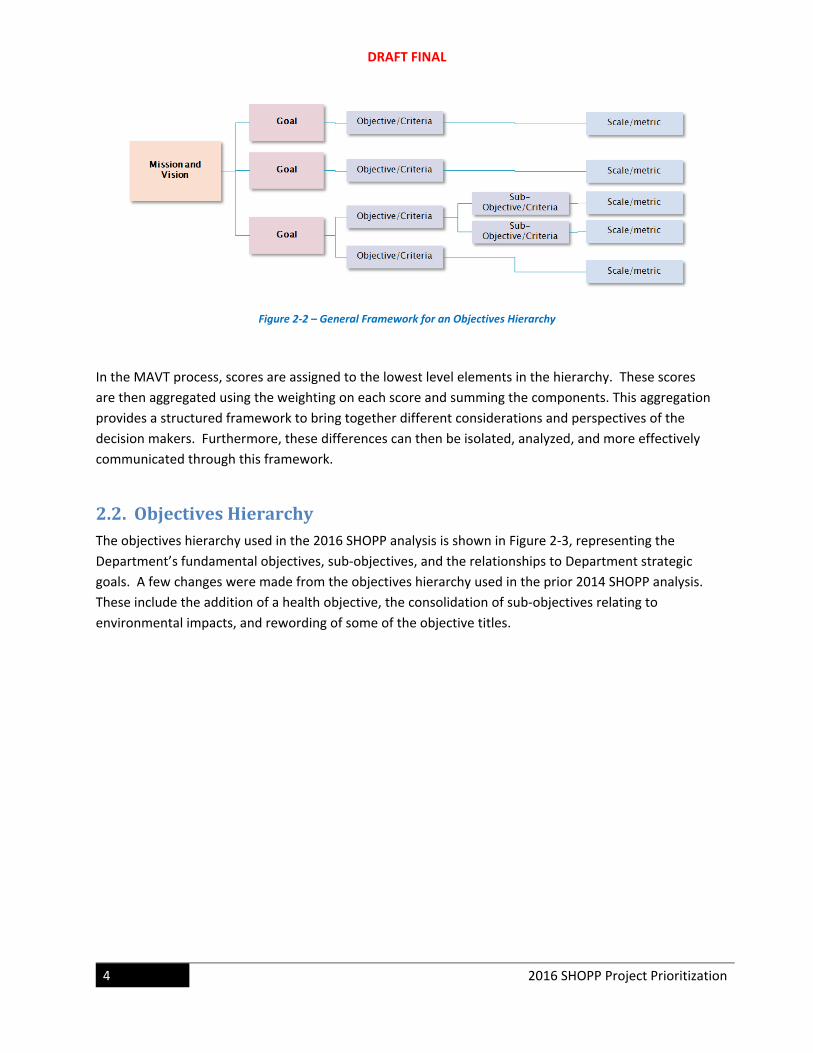
Figure 2‐2 – General Framework for an Objectives Hierarchy
In the MAVT process, scores are assigned to the lowest level elements in the hierarchy. These scores
are then aggregated using the weighting on each score and summing the components. This aggregation
provides a structured framework to bring together different considerations and perspectives of the
decision makers. Furthermore, these differences can then be isolated, analyzed, and more effectively
communicated through this framework.
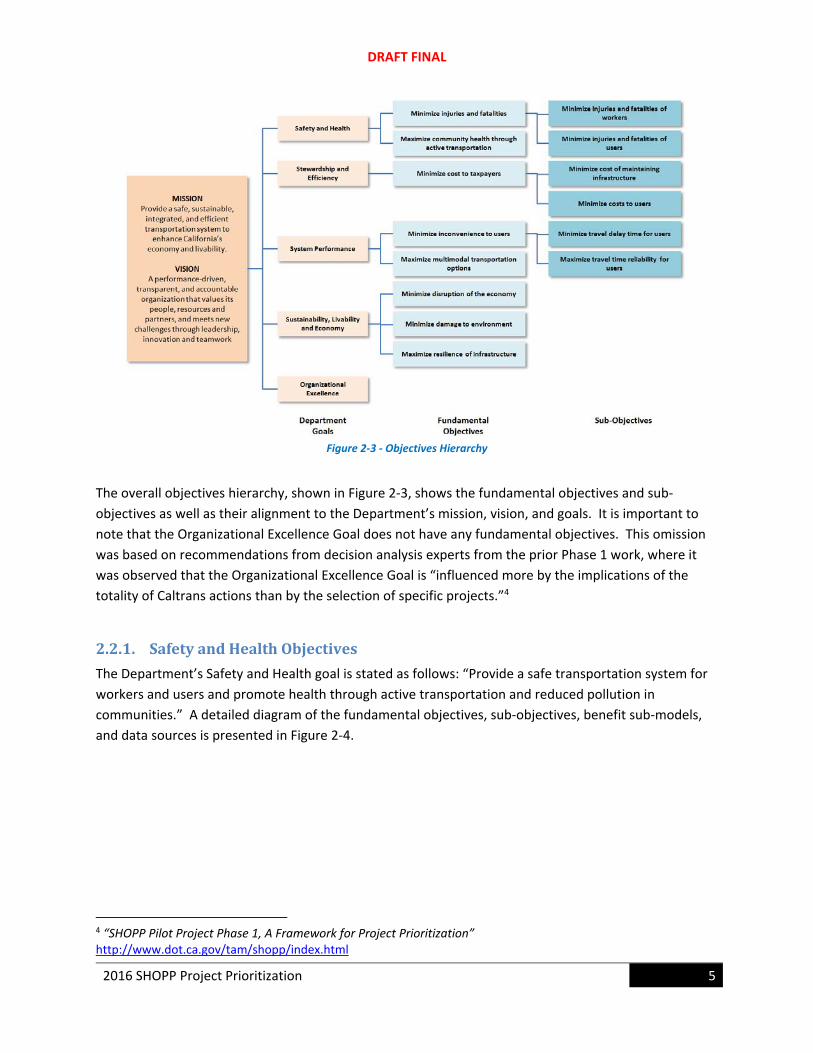
2.2. ObjectivesHierarchyThe objectives hierarchy used in the 2016 SHOPP analysis is shown in Figure 2‐3, representing the
Department’s fundamental objectives, sub‐objectives, and the relationships to Department strategic
goals. A few changes were made from the objectives hierarchy used in the prior 2014 SHOPP analysis.
These include the addition of a health objective, the consolidation of sub‐objectives relating to
environmental impacts, and rewording of some of the objective titles.
DRAFT FINAL
2016 SHOPP Project Prioritization 5
Figure 2‐3 ‐ Objectives Hierarchy
The overall objectives hierarchy, shown in Figure 2‐3, shows the fundamental objectives and sub‐
objectives as well as their alignment to the Department’s mission, vision, and goals. It is important to
note that the Organizational Excellence Goal does not have any fundamental objectives. This omission
was based on recommendations from decision analysis experts from the prior Phase 1 work, where it
was observed that the Organizational Excellence Goal is “influenced more by the implications of the
totality of Caltrans actions than by the selection of specific projects.”4
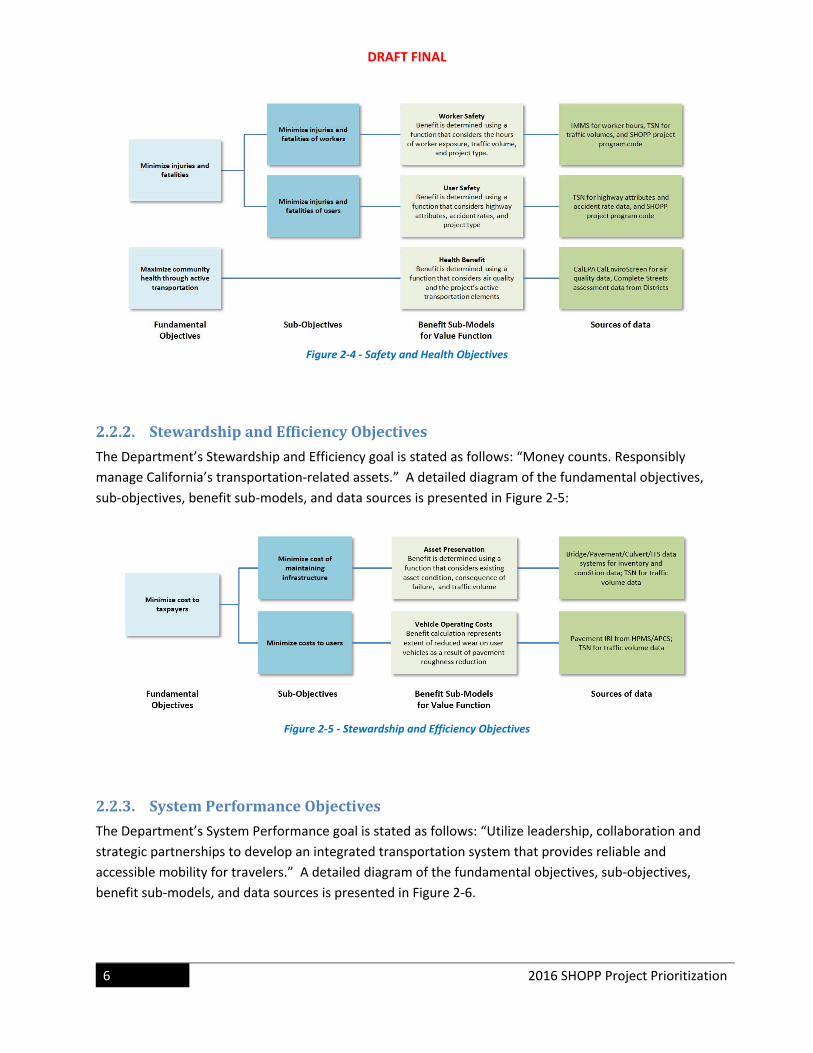
2.2.1. SafetyandHealthObjectives
The Department’s Safety and Health goal is stated as follows: “Provide a safe transportation system for
workers and users and promote health through active transportation and reduced pollution in
communities.” A detailed diagram of the fundamental objectives, sub‐objectives, benefit sub‐models,
and data sources is presented in Figure 2‐4.
4 “SHOPP Pilot Project Phase 1, A Framework for Project Prioritization” http://www.dot.ca.gov/tam/shopp/index.html
DRAFT FINAL
6 2016 SHOPP Project Prioritization
Figure 2‐4 ‐ Safety and Health Objectives
2.2.2. StewardshipandEfficiencyObjectives
The Department’s Stewardship and Efficiency goal is stated as follows: “Money counts. Responsibly
manage California’s transportation‐related assets.” A detailed diagram of the fundamental objectives,
sub‐objectives, benefit sub‐models, and data sources is presented in Figure 2‐5:
Figure 2‐5 ‐ Stewardship and Efficiency Objectives
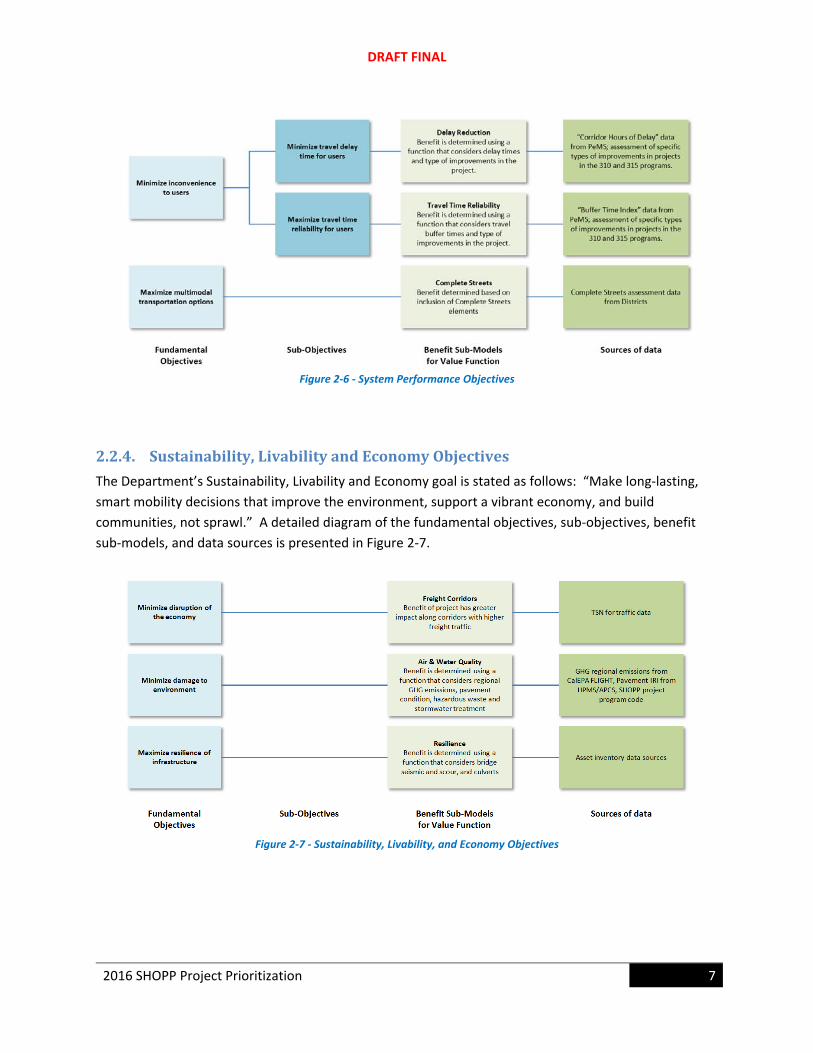
2.2.3. SystemPerformanceObjectives
The Department’s System Performance goal is stated as follows: “Utilize leadership, collaboration and
strategic partnerships to develop an integrated transportation system that provides reliable and
accessible mobility for travelers.” A detailed diagram of the fundamental objectives, sub‐objectives,
benefit sub‐models, and data sources is presented in Figure 2‐6.
DRAFT FINAL
2016 SHOPP Project Prioritization 7
Figure 2‐6 ‐ System Performance Objectives
2.2.4. Sustainability,LivabilityandEconomyObjectives
The Department’s Sustainability, Livability and Economy goal is stated as follows: “Make long‐lasting,
smart mobility decisions that improve the environment, support a vibrant economy, and build
communities, not sprawl.” A detailed diagram of the fundamental objectives, sub‐objectives, benefit
sub‐models, and data sources is presented in Figure 2‐7.
Figure 2‐7 ‐ Sustainability, Livability, and Economy Objectives
DRAFT FINAL
8 2016 SHOPP Project Prioritization
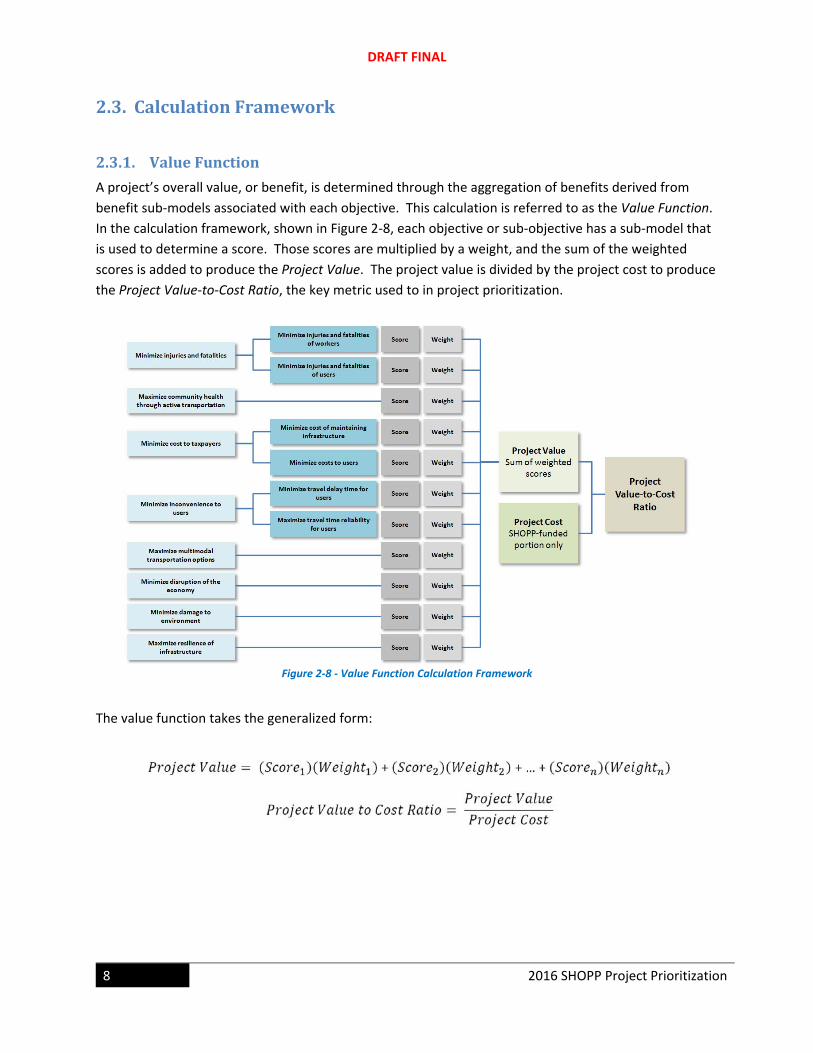
2.3. CalculationFramework
2.3.1. ValueFunction
A project’s overall value, or benefit, is determined through the aggregation of benefits derived from
benefit sub‐models associated with each objective. This calculation is referred to as the Value Function.
In the calculation framework, shown in Figure 2‐8, each objective or sub‐objective has a sub‐model that
is used to determine a score. Those scores are multiplied by a weight, and the sum of the weighted
scores is added to produce the Project Value. The project value is divided by the project cost to produce
the Project Value‐to‐Cost Ratio, the key metric used to in project prioritization.
Figure 2‐8 ‐ Value Function Calculation Framework
The value function takes the generalized form:
DRAFT FINAL
2016 SHOPP Project Prioritization 9
2.3.2. ScalingProjectValuewithMagnitudeofProjectWork
In all of the sub‐model calculations, the value associated with each objective is determined on a 0‐100
scale. As designed, the score is intended to reflect the magnitude of benefit from a particular work
activity as it scales up or down depending on the size of the project. For example, one would need to
differentiate the relative benefit from a five‐mile pavement project compared to a 50‐mile pavement
project. In this example, the larger project might be expected to produce up to ten times the benefit.
In the earlier 2014 SHOPP project prioritization work, a Project Magnitude Scaling Factor (SFproject magnitude)
was introduced into calculations in order to scale the relative benefit of a particular objective to the
overall size of the project using the dollar worth of the asset as the basis. This approach considered the
replacement cost of the primary infrastructure asset as a basis for scaling project values.
The 2016 SHOPP project prioritization approach retains a similar approach for one sub‐model
calculation, asset preservation under the Stewardship goal (see Appendix A.4 – Minimize Cost of
Maintaining Transportation Infrastructure). In other sub‐model calculations, scaling for project
magnitude is accounted for less rigorously. Eliminating the Project Magnitude Scaling Factor was
adopted in order to better align this prioritization approach with the concurrent 2016 SHOPP Asset
Management Pilot Program5. Additional work is needed to determine how best to account for scaling of
project value.
5 http://www.dot.ca.gov/tam/shopp/ampp.html

DRAFT FINAL
10 2016 SHOPP Project Prioritization
(This page is intentionally blank.)
DRAFT FINAL
2016 SHOPP Project Prioritization 11
3. Analysisofthe2016SHOPPProjectPortfolio
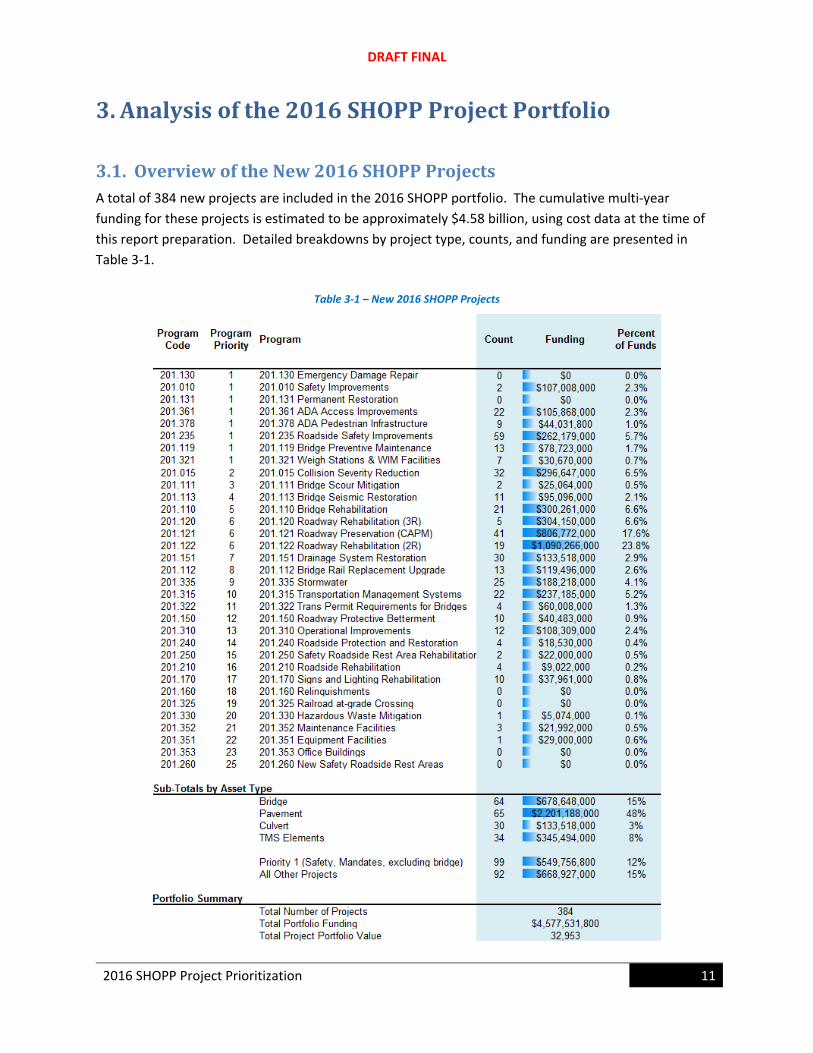
3.1. OverviewoftheNew2016SHOPPProjectsA total of 384 new projects are included in the 2016 SHOPP portfolio. The cumulative multi‐year
funding for these projects is estimated to be approximately $4.58 billion, using cost data at the time of
this report preparation. Detailed breakdowns by project type, counts, and funding are presented in
Table 3‐1.
Table 3‐1 – New 2016 SHOPP Projects
DRAFT FINAL
12 2016 SHOPP Project Prioritization
3.2. AnalysisofthePortfolioTo arrive at a final prioritization, several major activities were carried out. This included the compilation
of project‐specific and regional transportation data, a geo‐spatial analysis to associate regional data to
specific projects, the calculation of project scores, and the weighting and ranking of projects.
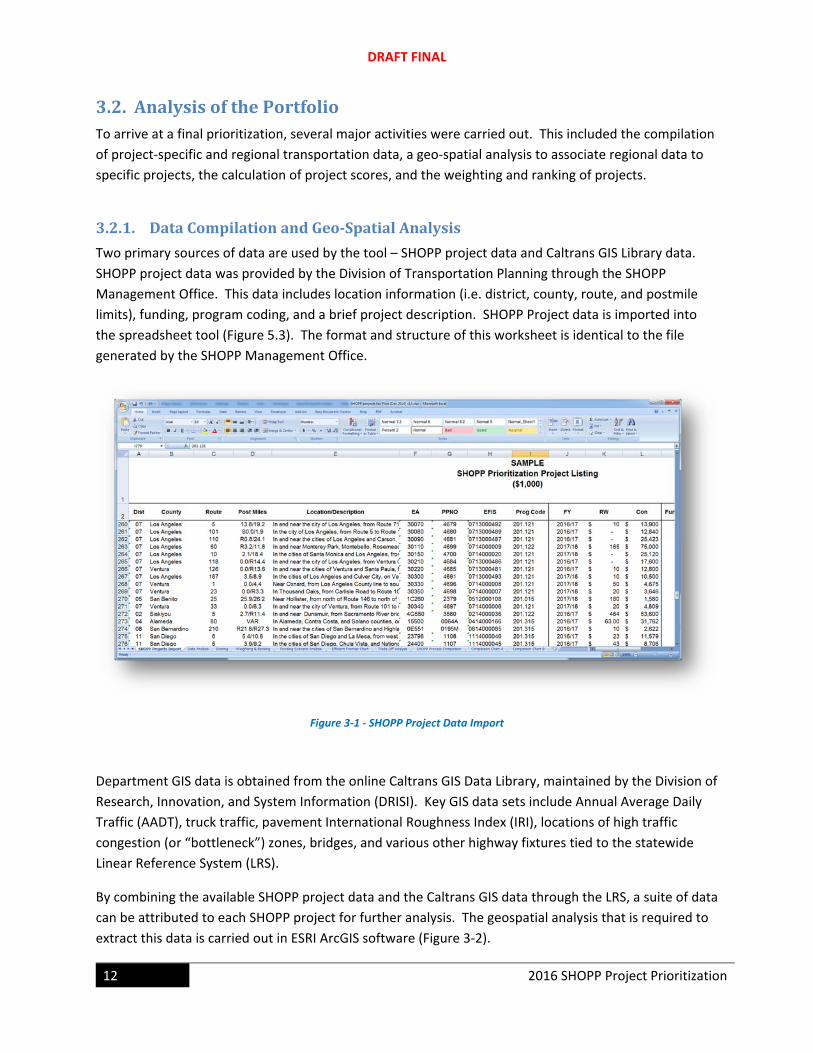
3.2.1. DataCompilationandGeo‐SpatialAnalysis
Two primary sources of data are used by the tool – SHOPP project data and Caltrans GIS Library data.
SHOPP project data was provided by the Division of Transportation Planning through the SHOPP
Management Office. This data includes location information (i.e. district, county, route, and postmile
limits), funding, program coding, and a brief project description. SHOPP Project data is imported into
the spreadsheet tool (Figure 5.3). The format and structure of this worksheet is identical to the file
generated by the SHOPP Management Office.
Figure 3‐1 ‐ SHOPP Project Data Import
Department GIS data is obtained from the online Caltrans GIS Data Library, maintained by the Division of
Research, Innovation, and System Information (DRISI). Key GIS data sets include Annual Average Daily
Traffic (AADT), truck traffic, pavement International Roughness Index (IRI), locations of high traffic
congestion (or “bottleneck”) zones, bridges, and various other highway fixtures tied to the statewide
Linear Reference System (LRS).
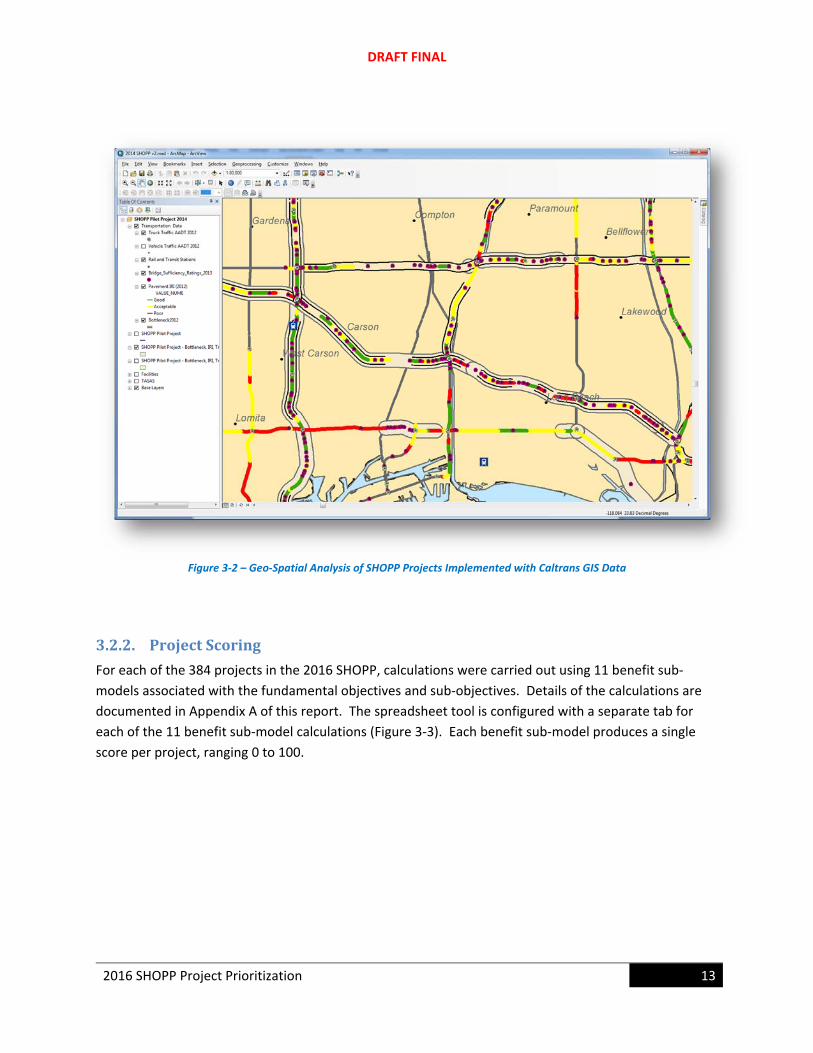
By combining the available SHOPP project data and the Caltrans GIS data through the LRS, a suite of data
can be attributed to each SHOPP project for further analysis. The geospatial analysis that is required to
extract this data is carried out in ESRI ArcGIS software (Figure 3‐2).
DRAFT FINAL
2016 SHOPP Project Prioritization 13
Figure 3‐2 – Geo‐Spatial Analysis of SHOPP Projects Implemented with Caltrans GIS Data
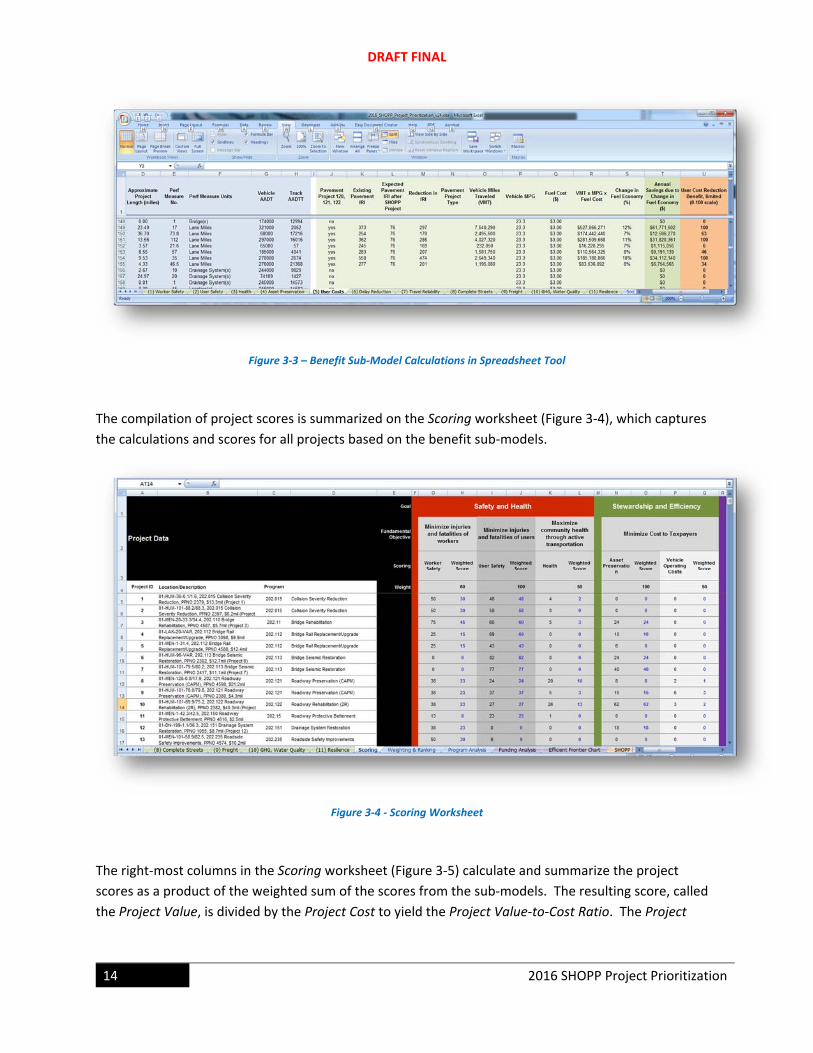
3.2.2. ProjectScoring
For each of the 384 projects in the 2016 SHOPP, calculations were carried out using 11 benefit sub‐
models associated with the fundamental objectives and sub‐objectives. Details of the calculations are
documented in Appendix A of this report. The spreadsheet tool is configured with a separate tab for
each of the 11 benefit sub‐model calculations (Figure 3‐3). Each benefit sub‐model produces a single
score per project, ranging 0 to 100.
DRAFT FINAL
14 2016 SHOPP Project Prioritization
Figure 3‐3 – Benefit Sub‐Model Calculations in Spreadsheet Tool
The compilation of project scores is summarized on the Scoring worksheet (Figure 3‐4), which captures
the calculations and scores for all projects based on the benefit sub‐models.
Figure 3‐4 ‐ Scoring Worksheet
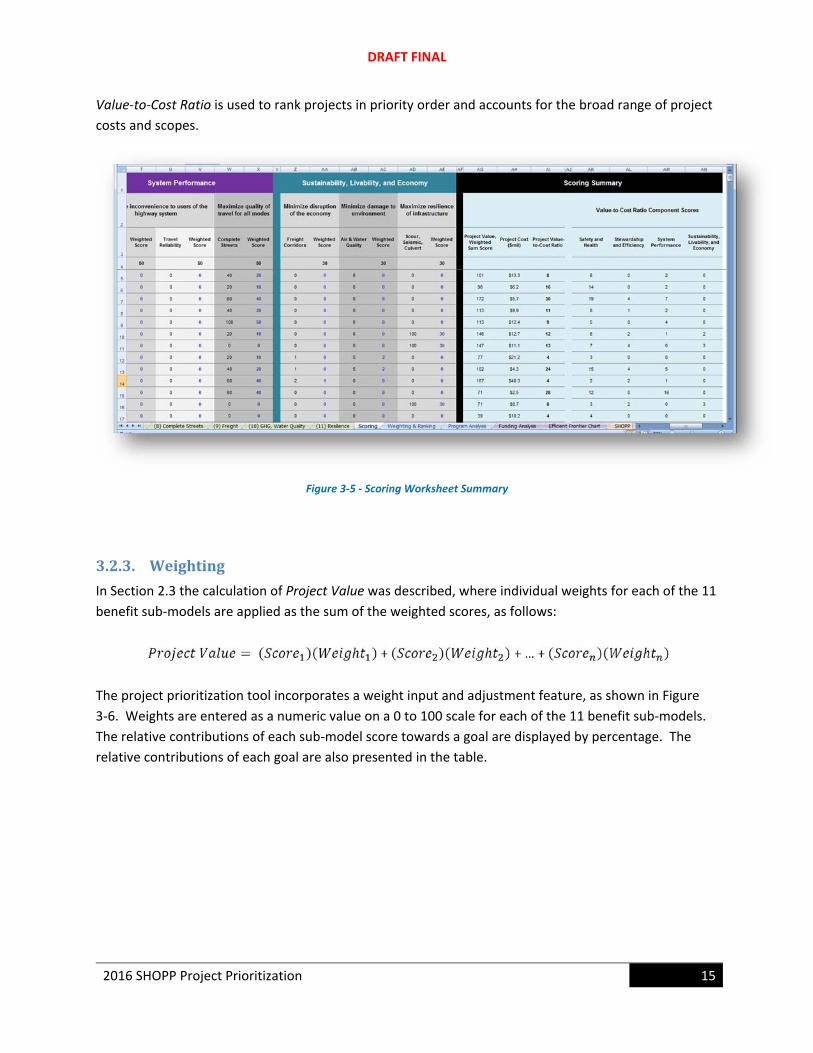
The right‐most columns in the Scoring worksheet (Figure 3‐5) calculate and summarize the project
scores as a product of the weighted sum of the scores from the sub‐models. The resulting score, called
the Project Value, is divided by the Project Cost to yield the Project Value‐to‐Cost Ratio. The Project
DRAFT FINAL
2016 SHOPP Project Prioritization 15
Value‐to‐Cost Ratio is used to rank projects in priority order and accounts for the broad range of project
costs and scopes.
Figure 3‐5 ‐ Scoring Worksheet Summary
3.2.3. Weighting
In Section 2.3 the calculation of Project Value was described, where individual weights for each of the 11
benefit sub‐models are applied as the sum of the weighted scores, as follows:
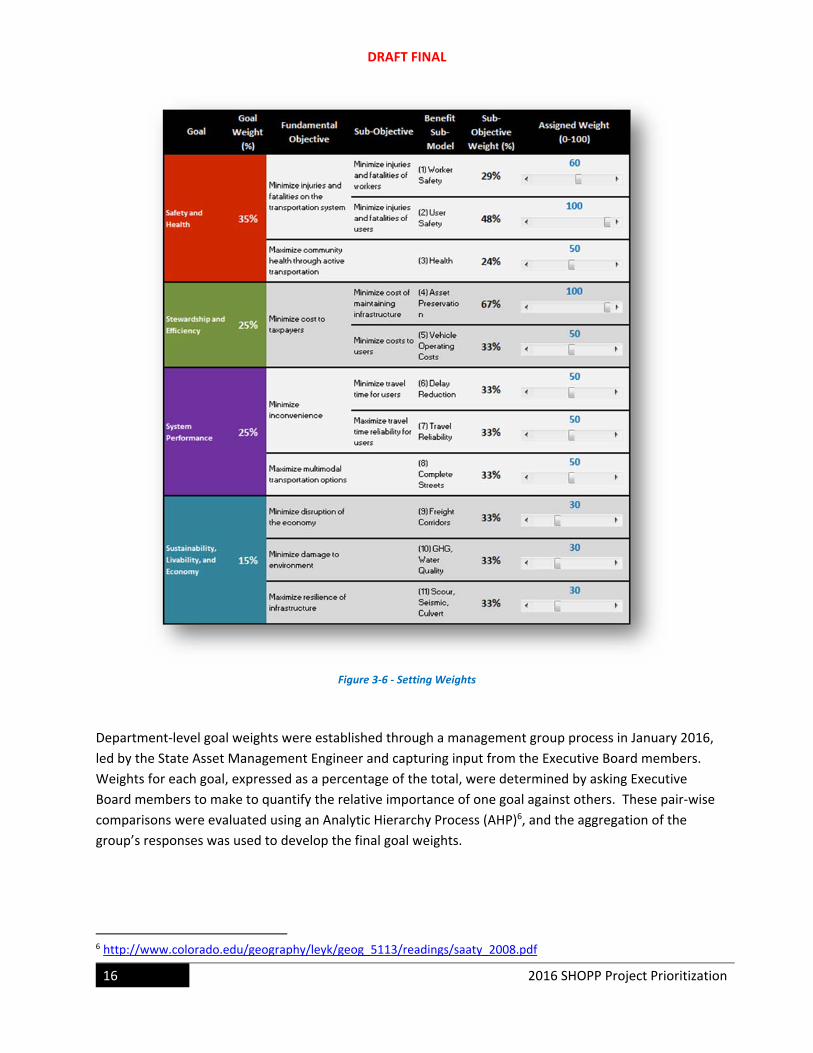
The project prioritization tool incorporates a weight input and adjustment feature, as shown in Figure
3‐6. Weights are entered as a numeric value on a 0 to 100 scale for each of the 11 benefit sub‐models.
The relative contributions of each sub‐model score towards a goal are displayed by percentage. The
relative contributions of each goal are also presented in the table.
DRAFT FINAL
16 2016 SHOPP Project Prioritization
Figure 3‐6 ‐ Setting Weights
Department‐level goal weights were established through a management group process in January 2016,
led by the State Asset Management Engineer and capturing input from the Executive Board members.
Weights for each goal, expressed as a percentage of the total, were determined by asking Executive
Board members to make to quantify the relative importance of one goal against others. These pair‐wise
comparisons were evaluated using an Analytic Hierarchy Process (AHP)6, and the aggregation of the
group’s responses was used to develop the final goal weights.
6 http://www.colorado.edu/geography/leyk/geog_5113/readings/saaty_2008.pdf
DRAFT FINAL
2016 SHOPP Project Prioritization 17
Since the 2016 SHOPP does not consider Organizational Excellence in the calculations, the percentage
weights from the five goals were redistributed across four goals, rounding off to the nearest 5%. The
final goal weights used for the 2016 SHOPP are presented in Table 3‐2.
Table 3‐2 ‐ Goal Weights
Notes Safety and Health
Stewardship and Efficiency
Sustainability, Livability, and Economy
System Performance
Organizational Excellence
Weights Resulting from Executive Board Process
32% 23% 15% 22% 8%
Weights Applied in the 2016 SHOPP Analysis
35% 25% 15% 25% N/A
Note that the target goal weights shown in Figure 3‐6 are consistent with the goal weights established
those presented in Table 3‐2.
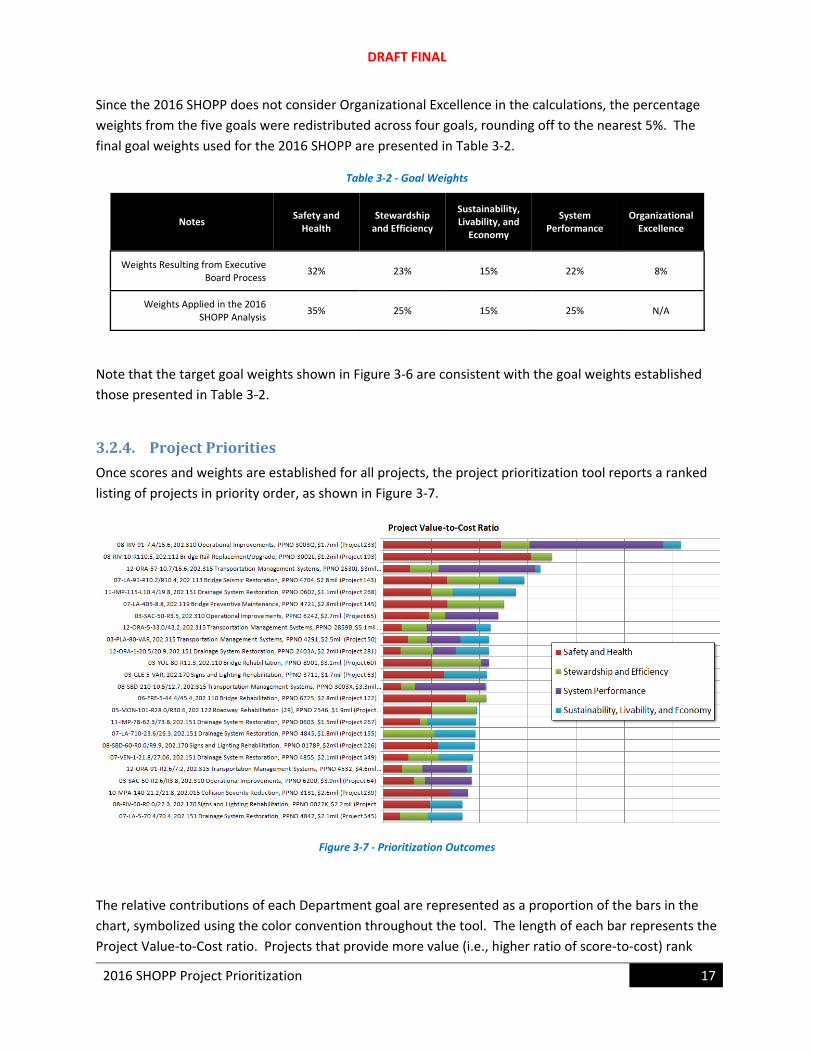
3.2.4. ProjectPriorities
Once scores and weights are established for all projects, the project prioritization tool reports a ranked
listing of projects in priority order, as shown in Figure 3‐7.
Figure 3‐7 ‐ Prioritization Outcomes
The relative contributions of each Department goal are represented as a proportion of the bars in the
chart, symbolized using the color convention throughout the tool. The length of each bar represents the
Project Value‐to‐Cost ratio. Projects that provide more value (i.e., higher ratio of score‐to‐cost) rank
DRAFT FINAL
18 2016 SHOPP Project Prioritization
higher. Also, a notable feature in the tool is that the rank order of projects changes dynamically as the
weights are adjusted.
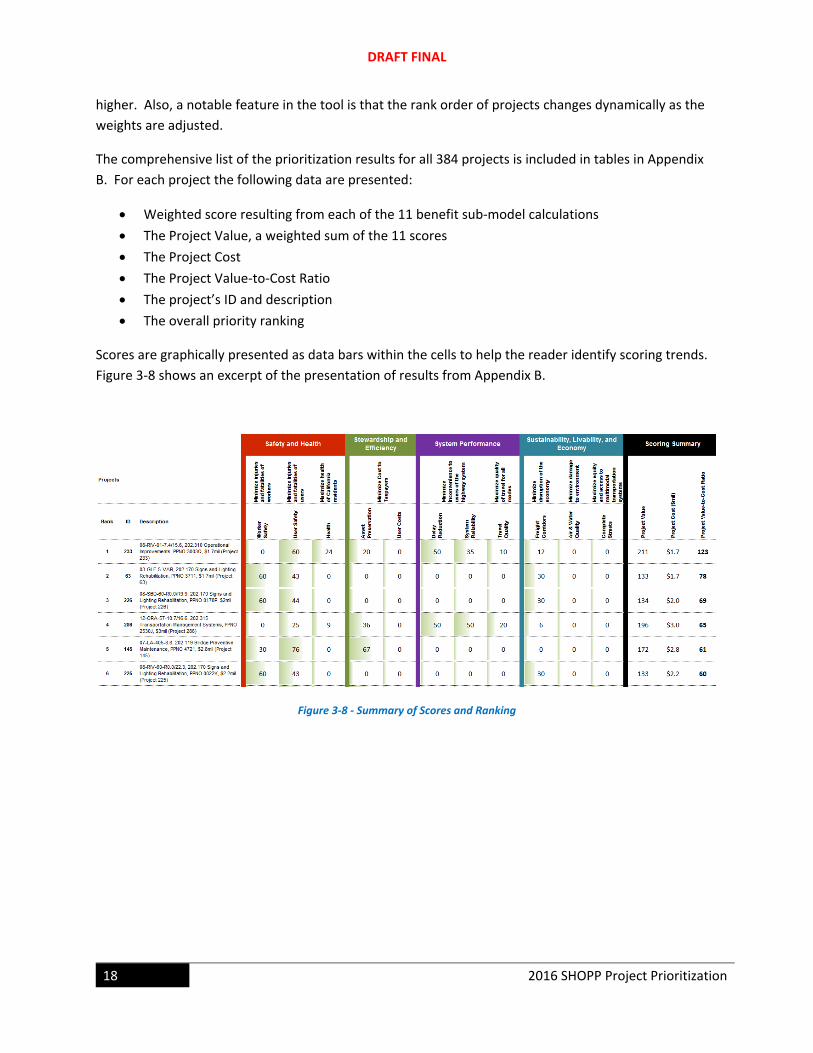
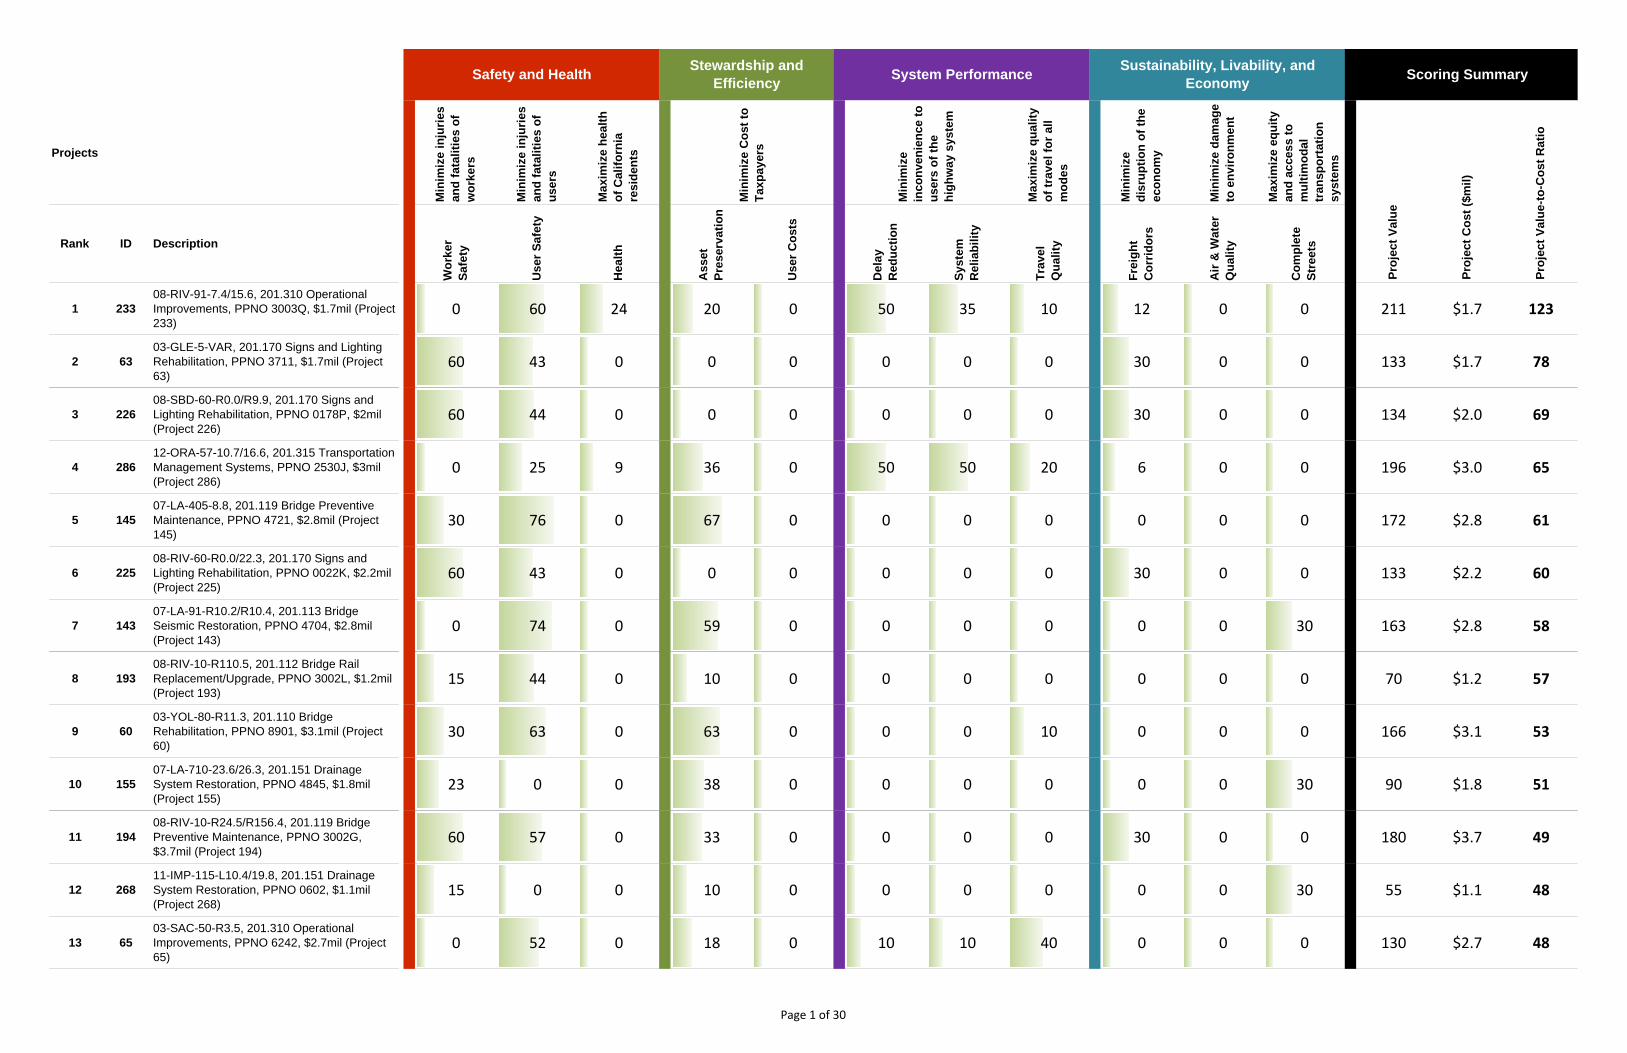
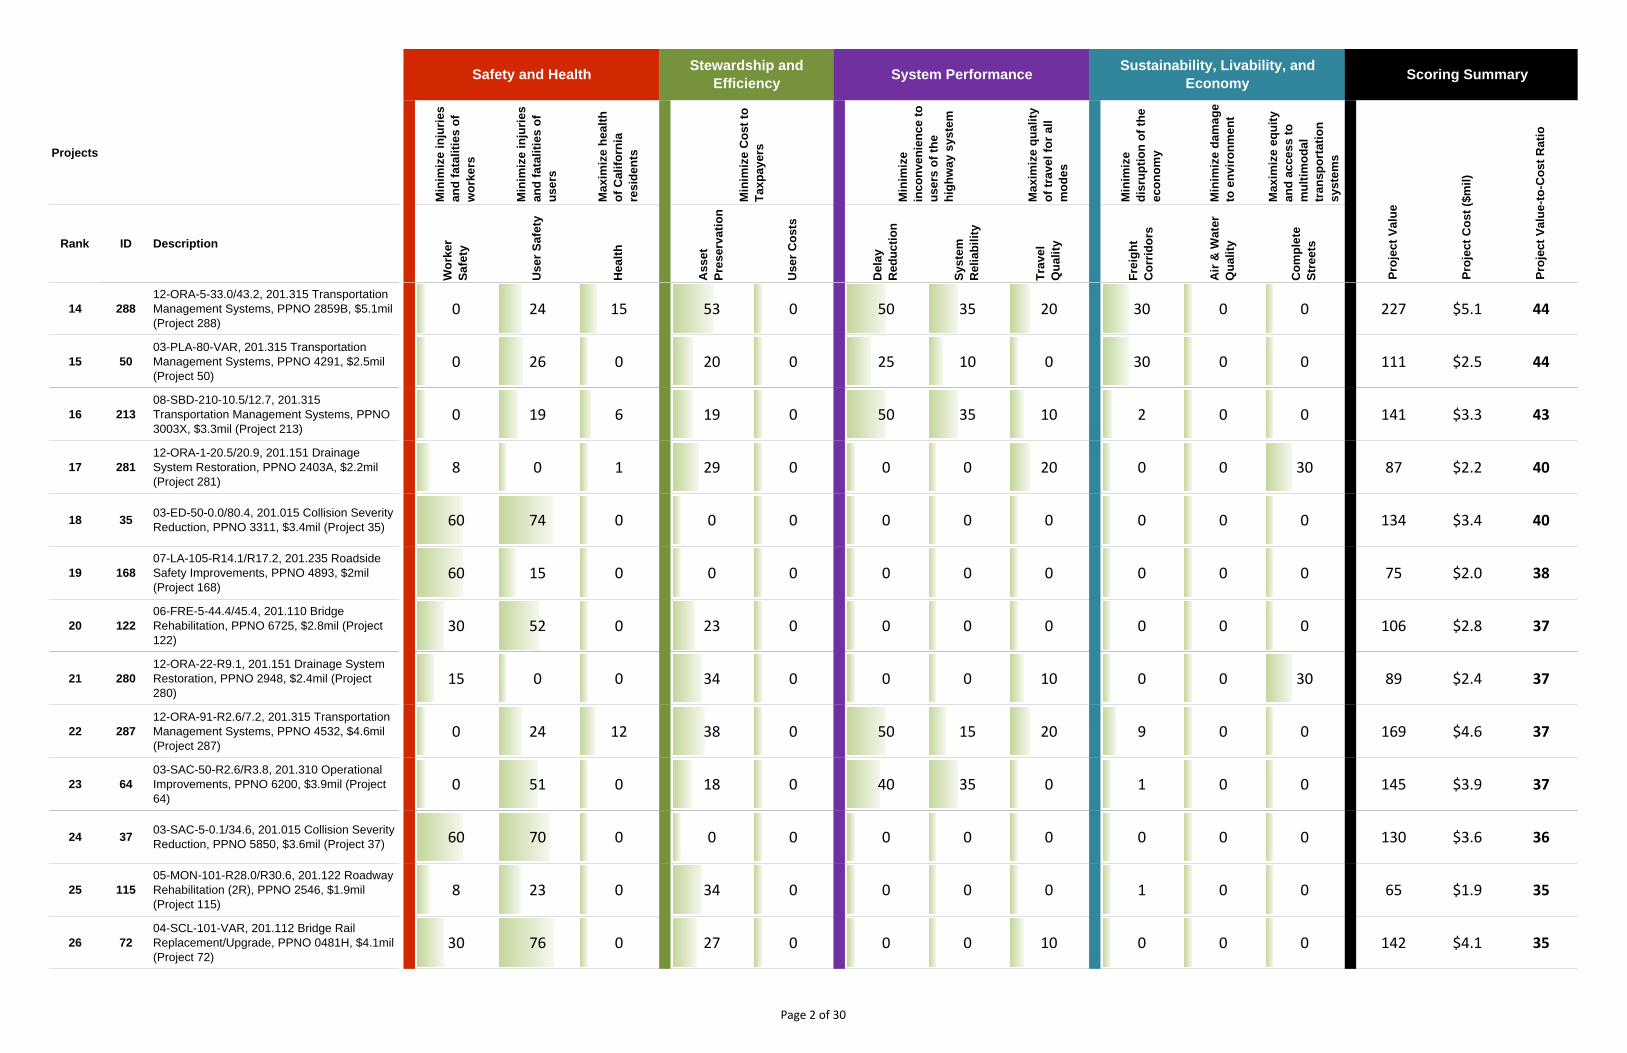
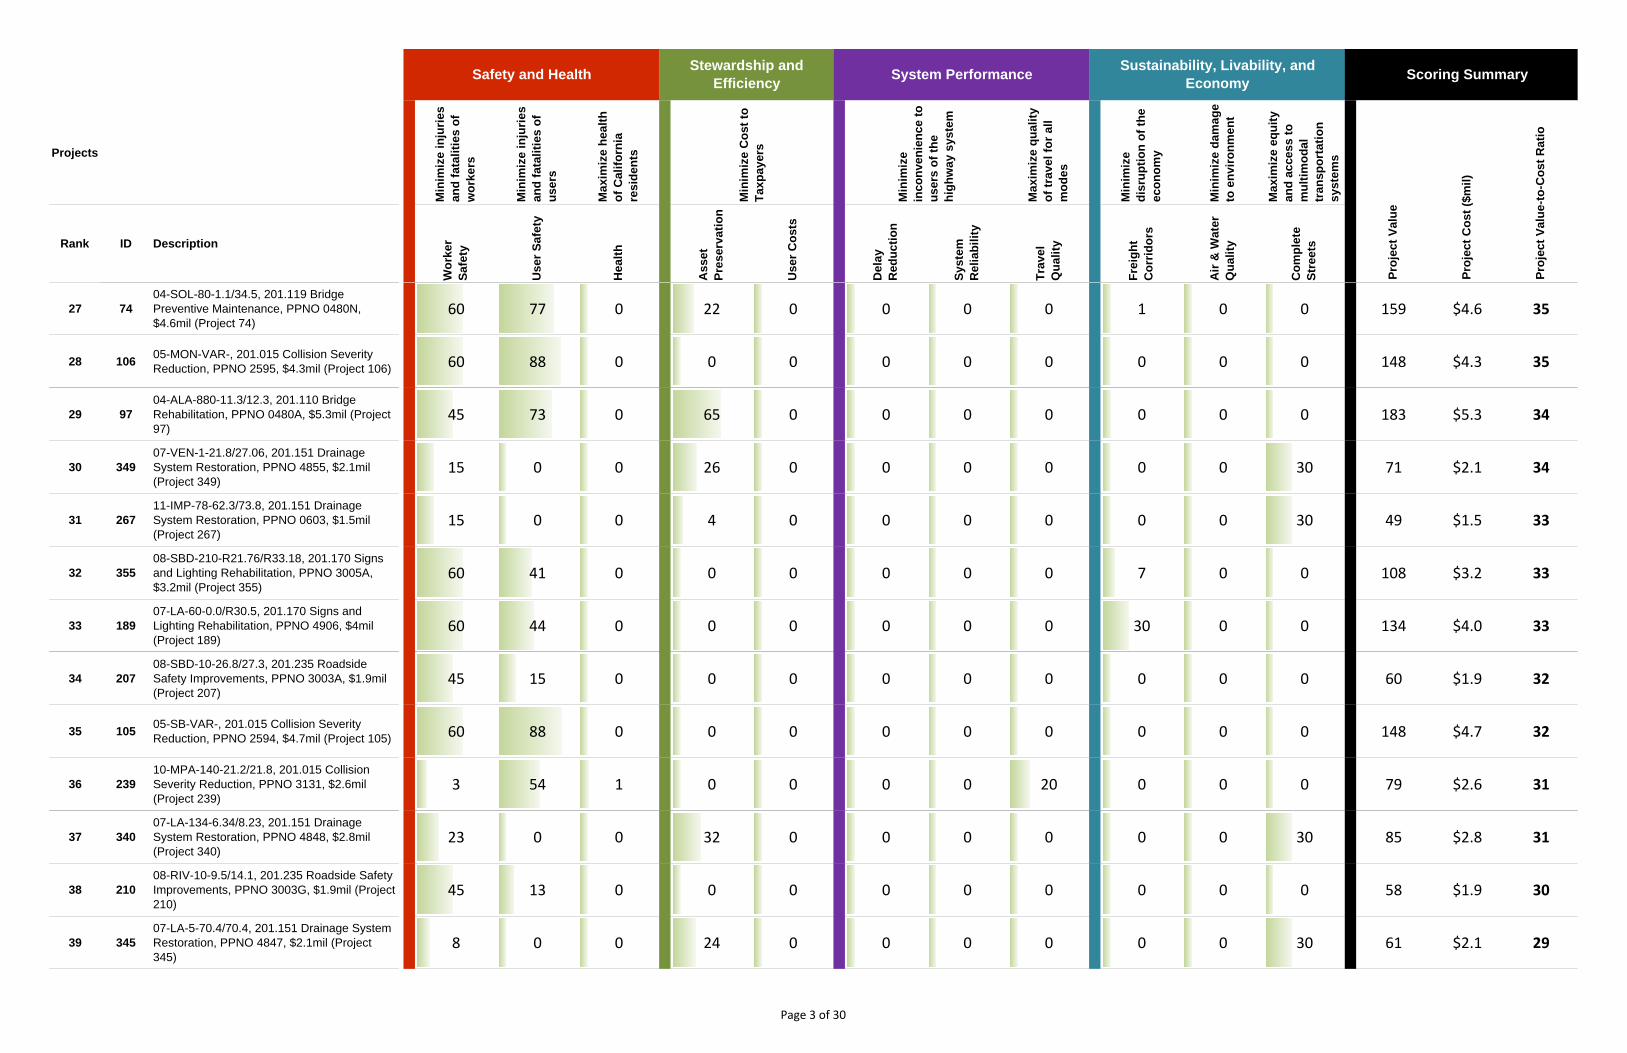
The comprehensive list of the prioritization results for all 384 projects is included in tables in Appendix
B. For each project the following data are presented:
Weighted score resulting from each of the 11 benefit sub‐model calculations
The Project Value, a weighted sum of the 11 scores
The Project Cost
The Project Value‐to‐Cost Ratio
The project’s ID and description
The overall priority ranking
Scores are graphically presented as data bars within the cells to help the reader identify scoring trends.
Figure 3‐8 shows an excerpt of the presentation of results from Appendix B.
Figure 3‐8 ‐ Summary of Scores and Ranking
DRAFT FINAL
2016 SHOPP Project Prioritization 19
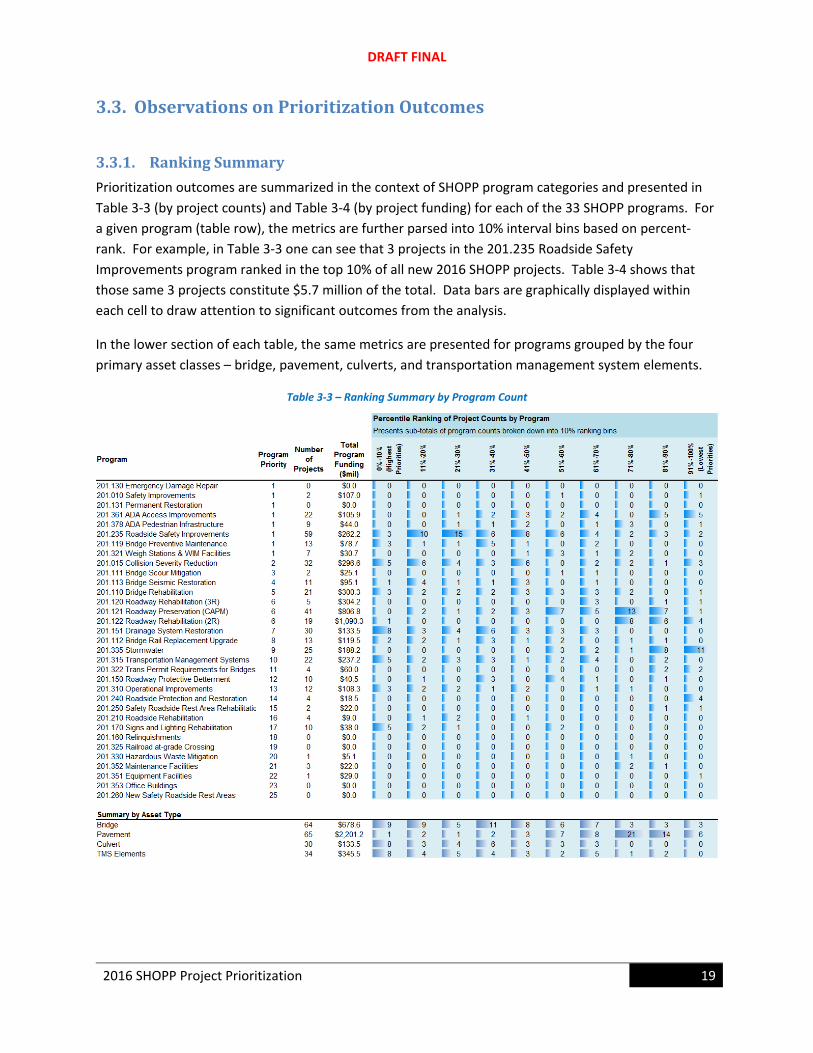
3.3. ObservationsonPrioritizationOutcomes
3.3.1. RankingSummary
Prioritization outcomes are summarized in the context of SHOPP program categories and presented in
Table 3‐3 (by project counts) and Table 3‐4 (by project funding) for each of the 33 SHOPP programs. For
a given program (table row), the metrics are further parsed into 10% interval bins based on percent‐
rank. For example, in Table 3‐3 one can see that 3 projects in the 201.235 Roadside Safety
Improvements program ranked in the top 10% of all new 2016 SHOPP projects. Table 3‐4 shows that
those same 3 projects constitute $5.7 million of the total. Data bars are graphically displayed within
each cell to draw attention to significant outcomes from the analysis.
In the lower section of each table, the same metrics are presented for programs grouped by the four
primary asset classes – bridge, pavement, culverts, and transportation management system elements.
Table 3‐3 – Ranking Summary by Program Count
DRAFT FINAL
20 2016 SHOPP Project Prioritization
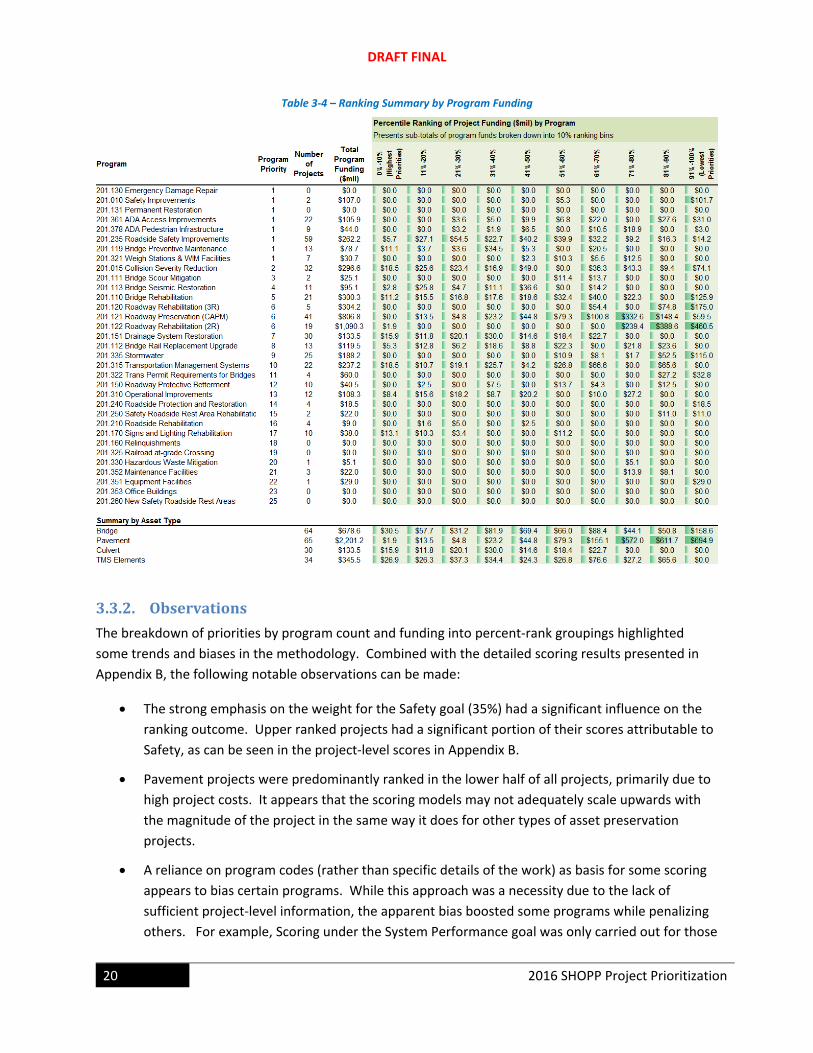
Table 3‐4 – Ranking Summary by Program Funding
3.3.2. Observations
The breakdown of priorities by program count and funding into percent‐rank groupings highlighted
some trends and biases in the methodology. Combined with the detailed scoring results presented in
Appendix B, the following notable observations can be made:
The strong emphasis on the weight for the Safety goal (35%) had a significant influence on the
ranking outcome. Upper ranked projects had a significant portion of their scores attributable to
Safety, as can be seen in the project‐level scores in Appendix B.
Pavement projects were predominantly ranked in the lower half of all projects, primarily due to
high project costs. It appears that the scoring models may not adequately scale upwards with
the magnitude of the project in the same way it does for other types of asset preservation
projects.
A reliance on program codes (rather than specific details of the work) as basis for some scoring
appears to bias certain programs. While this approach was a necessity due to the lack of
sufficient project‐level information, the apparent bias boosted some programs while penalizing
others. For example, Scoring under the System Performance goal was only carried out for those
DRAFT FINAL
2016 SHOPP Project Prioritization 21
projects in the 201.310 (Operational Improvements) and 201.315 (Transportation Management
Systems) programs.
Projects in 201.240 (Roadside Protection and Restoration) program scored low or did not score
at all, as benefits from these projects were not considered in many of the calculations that relied
on program codes as a filter.
A couple of projects at the bottom rank could not be scored due to the lack of specific location
information. These were typically described as having “various” locations. As these projects
could not be processed in the geo‐spatial analysis stage, key data parameters could not be
extracted to support scoring.
Project location information influenced scoring. Some projects with discreet locations (e.g.
traffic camera installation locations along a corridor) were described by the full postmile extent,
while other projects with similar work were described by specific locations. The geo‐spatial
analysis used the “footprint” of the project (either a collection of points or a bounded line) to
associate other types of data to a project (e.g. traffic volume). The inconsistency in handling
project limits, in some instances, may have introduced a bias in the scoring.
DRAFT FINAL
22 2016 SHOPP Project Prioritization
(This page is intentionally blank.)
DRAFT FINAL
2016 SHOPP Project Prioritization 23
4. LimitationsoftheAnalysisandMethod
4.1. DataAvailabilityandAccuracyAs with the 2014 SHOPP analysis framework, a data‐driven approach was carried over in the
development of the 2016 SHOPP analysis framework. This was an intentional design decision to
eliminate subjectivity from the scoring process to the extent possible. The data sets used were typically
in the form of spreadsheets, databases, and the Department’s geospatial data libraries.
Although the combination of data sets provided a sound basis to carry out many of the calculations, a
number of errors, omissions, and misrepresentations were likely introduced into the project
prioritization outcomes. For example, project specific data from Project Initiation Documents (PIDs)
were not used, as the files were in a format (i.e. scanned PDF files) that could not be systematically
parsed. In the geo‐spatial analysis, the project’s spatial limits, defined by begin and end postmiles, were
used in many calculations to infer key parameters, such as traffic volumes, roadway attributes, and
regional air quality metrics. Some projects cited limits encompassing broad regions where key
parameters varied widely, while other projects cited specific spot locations where more representative
key parameters could be assigned. These data‐related issues could be reasonably addressed in the
future with more time and a carefully constructed process to parse data from PIDs at the time of
submission.
4.2. Over‐SimplificationofComplexCorrelationsThe project prioritization framework likely over‐simplifies many complex correlations. In some instances
the simplifications were applied due to the lack of availability of data. For example, program codes were
used in many calculations as a proxy to infer benefit provided by a particular type of project. In other
instances the simplifications were necessary in order to reduce the complexity of a more rigorous
benefit calculation based on multiple factors. The approach applied to scaling project value to the size
of the project, in particular, is a key issue that warrants more study. The choices made in the calculation
framework likely have an impact on the overall determination of project value and rankings. However,
the specific influence of these tradeoffs on the resulting project priorities was not studied.

DRAFT FINAL
24 2016 SHOPP Project Prioritization
(This page is intentionally blank.)
DRAFT FINAL
2016 SHOPP Project Prioritization 25
5. RecommendationsRecommendations for the future SHOPP development process are as follows:
Engage experts in the field of decision analysis and project prioritization to review the work
carried out to date on the 2014 and 2016 SHOPP prioritization efforts and guide the
development of an improved framework for the 2018 SHOPP process.
Develop and implement web‐based tools and business processes to more effectively capture
SHOPP project‐specific data necessary to drive the prioritization process.
Using the spreadsheet‐based prioritization tool as an example prototype, develop an
operational web‐based tool (or extend functionality in existing SHOPP tools) that facilitates the
calculation of values and project prioritization.
Identify changes in the SHOPP programming workflow, such that project prioritization occurs
earlier in the planning phases, prior to PID development.
DRAFT FINAL
26 2016 SHOPP Project Prioritization
(This page is intentionally blank.)
DRAFT FINAL
2016 SHOPP Project Prioritization 27
AppendixA–DescriptionofCalculationsThis appendix documents the calculations used for the benefit sub‐models in determining Project Value.
The calculations used in the 2016 SHOPP analysis differ from those applied in the 2014 SHOPP analysis.
As part of the Department's ongoing asset management implementation, a new Asset Management
Pilot Program7 was initiated as part of the 2016 SHOPP. Through efforts led by the State Asset
Management Engineer, project nominations were reviewed by Strategic Plan goal teams that evaluated
the projects' contributions toward each of the department's five strategic goals relative to the proposed
cost of the projects. These calculation methods employed by the goal teams were used directly or
adapted, where feasible, in the 2016 SHOPP prioritization described in this report.
A.1–MinimizeInjuriesandFatalitiesofWorkers
Step1–EstimatetheHoursofWorkerExposurewithinProjectLimits
For the projects in the 235 Roadside Safety Improvements program, actual annual worker hours were
compiled from Caltrans’ Integrated Maintenance Management System (IMMS)8 using a 3‐year average.
IMMS captures the detailed time charges by Caltrans staff for maintenance work performed on roadway
elements by postmile. This level of data compilation was not practical to carry out for non‐235 projects
due to the time required to query data from the system. As an alternative, a statewide annual average
was calculated on a per‐mile basis using data on worker hours associated with all highway maintenance
activities. The result of both approaches was the number of Caltrans worker hours associated within a
project’s limit.
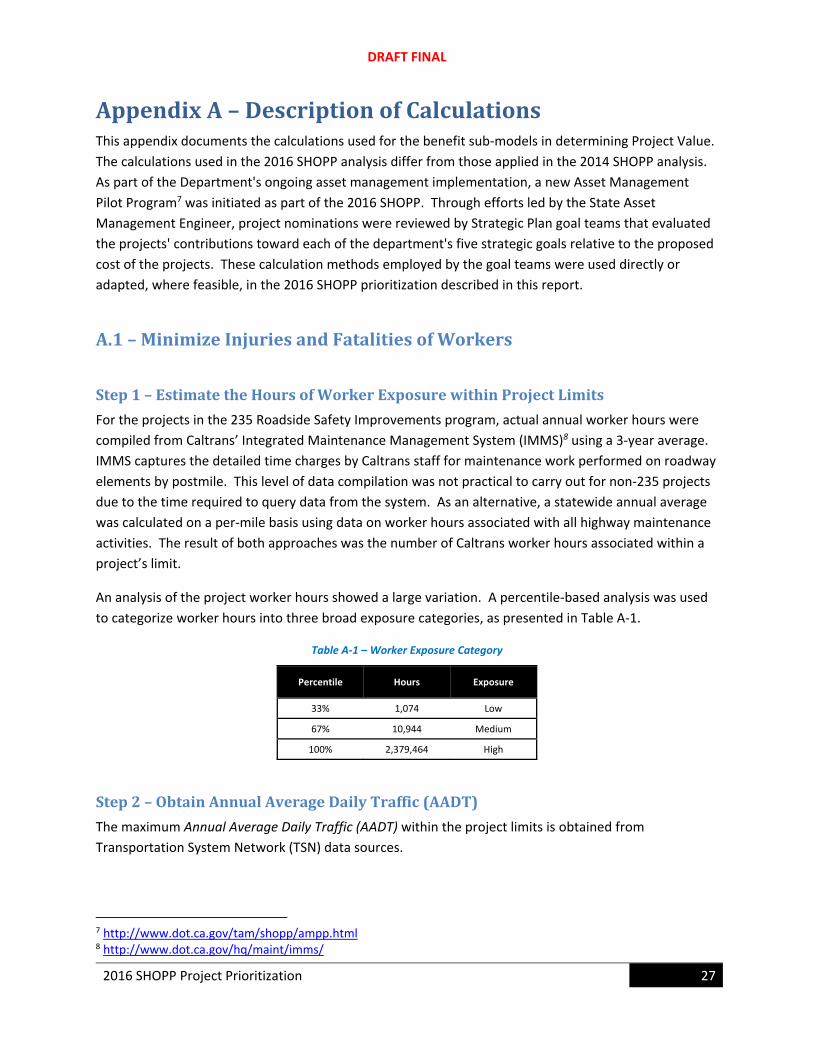
An analysis of the project worker hours showed a large variation. A percentile‐based analysis was used
to categorize worker hours into three broad exposure categories, as presented in Table A‐1.
Table A‐1 – Worker Exposure Category
Percentile Hours Exposure
33% 1,074 Low
67% 10,944 Medium
100% 2,379,464 High
Step2–ObtainAnnualAverageDailyTraffic(AADT)
The maximum Annual Average Daily Traffic (AADT) within the project limits is obtained from
Transportation System Network (TSN) data sources.
7 http://www.dot.ca.gov/tam/shopp/ampp.html 8 http://www.dot.ca.gov/hq/maint/imms/
DRAFT FINAL
28 2016 SHOPP Project Prioritization
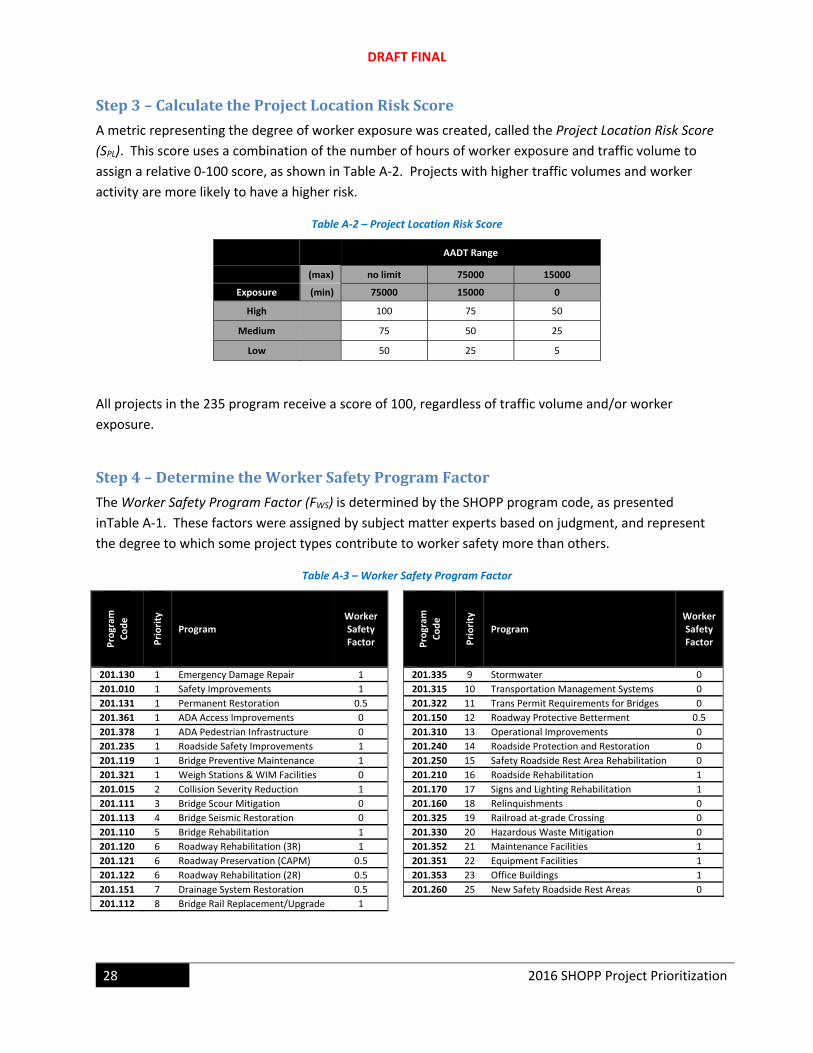
Step3–CalculatetheProjectLocationRiskScore
A metric representing the degree of worker exposure was created, called the Project Location Risk Score
(SPL). This score uses a combination of the number of hours of worker exposure and traffic volume to
assign a relative 0‐100 score, as shown in Table A‐2. Projects with higher traffic volumes and worker
activity are more likely to have a higher risk.
Table A‐2 – Project Location Risk Score
AADT Range
(max) no limit 75000 15000
Exposure (min) 75000 15000 0
High 100 75 50
Medium 75 50 25
Low 50 25 5
All projects in the 235 program receive a score of 100, regardless of traffic volume and/or worker
exposure.
Step4–DeterminetheWorkerSafetyProgramFactor
The Worker Safety Program Factor (FWS) is determined by the SHOPP program code, as presented
inTable A‐1. These factors were assigned by subject matter experts based on judgment, and represent
the degree to which some project types contribute to worker safety more than others.
Table A‐3 – Worker Safety Program Factor
Program
Code
Priority
Program Worker Safety Factor P
rogram
Code
Priority
Program Worker Safety Factor
201.130 1 Emergency Damage Repair 1 201.335 9 Stormwater 0
201.010 1 Safety Improvements 1 201.315 10 Transportation Management Systems 0
201.131 1 Permanent Restoration 0.5 201.322 11 Trans Permit Requirements for Bridges 0
201.361 1 ADA Access Improvements 0 201.150 12 Roadway Protective Betterment 0.5
201.378 1 ADA Pedestrian Infrastructure 0 201.310 13 Operational Improvements 0
201.235 1 Roadside Safety Improvements 1 201.240 14 Roadside Protection and Restoration 0
201.119 1 Bridge Preventive Maintenance 1 201.250 15 Safety Roadside Rest Area Rehabilitation 0
201.321 1 Weigh Stations & WIM Facilities 0 201.210 16 Roadside Rehabilitation 1
201.015 2 Collision Severity Reduction 1 201.170 17 Signs and Lighting Rehabilitation 1
201.111 3 Bridge Scour Mitigation 0 201.160 18 Relinquishments 0
201.113 4 Bridge Seismic Restoration 0 201.325 19 Railroad at‐grade Crossing 0
201.110 5 Bridge Rehabilitation 1 201.330 20 Hazardous Waste Mitigation 0
201.120 6 Roadway Rehabilitation (3R) 1 201.352 21 Maintenance Facilities 1
201.121 6 Roadway Preservation (CAPM) 0.5 201.351 22 Equipment Facilities 1
201.122 6 Roadway Rehabilitation (2R) 0.5 201.353 23 Office Buildings 1
201.151 7 Drainage System Restoration 0.5 201.260 25 New Safety Roadside Rest Areas 0
201.112 8 Bridge Rail Replacement/Upgrade 1
DRAFT FINAL
2016 SHOPP Project Prioritization 29
Step5–CalculatetheWorkerSafetyBenefitScore
The Worker Safety Benefit Score (BWS) is calculated using the Project Location Risk Score (SPL) and the
Worker Safety Program Factor (FWS) as follows:
BWS = (FWS) x (SPL)
The resulting benefit score ranges from 0‐100.
DRAFT FINAL
30 2016 SHOPP Project Prioritization
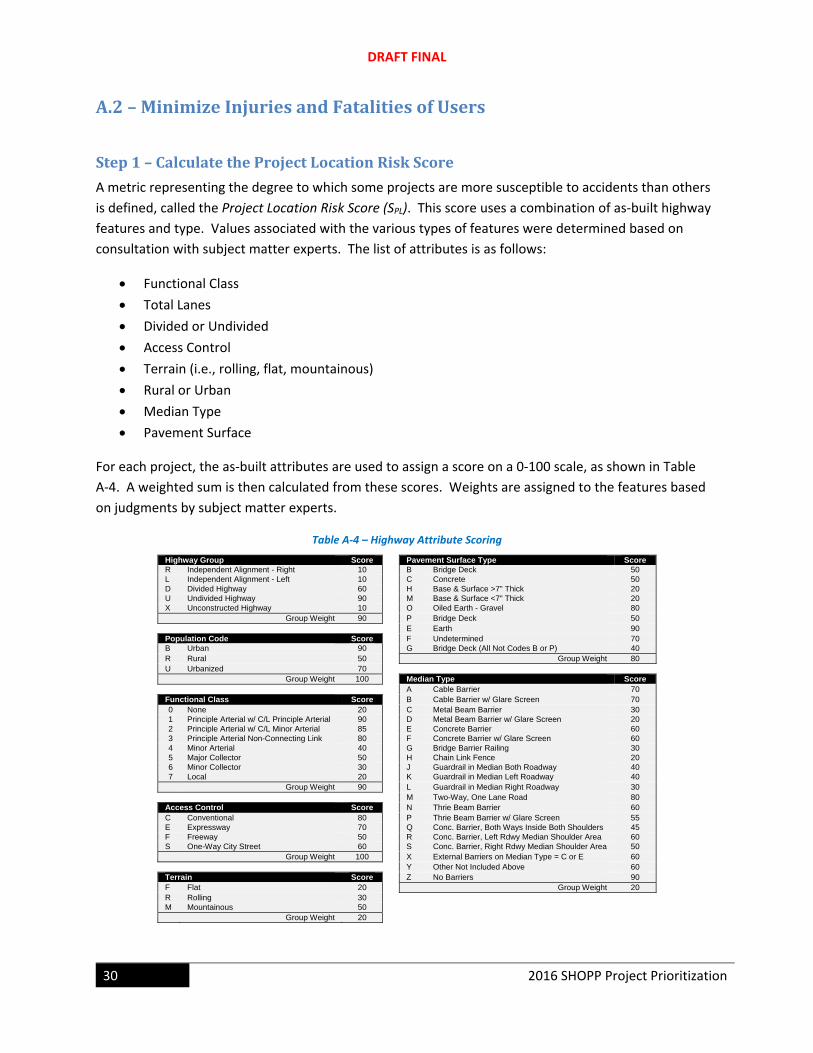
A.2–MinimizeInjuriesandFatalitiesofUsers
Step1–CalculatetheProjectLocationRiskScore
A metric representing the degree to which some projects are more susceptible to accidents than others
is defined, called the Project Location Risk Score (SPL). This score uses a combination of as‐built highway
features and type. Values associated with the various types of features were determined based on
consultation with subject matter experts. The list of attributes is as follows:
Functional Class
Total Lanes
Divided or Undivided
Access Control
Terrain (i.e., rolling, flat, mountainous)
Rural or Urban
Median Type
Pavement Surface
For each project, the as‐built attributes are used to assign a score on a 0‐100 scale, as shown in Table
A‐4. A weighted sum is then calculated from these scores. Weights are assigned to the features based
on judgments by subject matter experts.
Table A‐4 – Highway Attribute Scoring
Highway Group Score Pavement Surface Type Score R Independent Alignment - Right 10 B Bridge Deck 50 L Independent Alignment - Left 10 C Concrete 50 D Divided Highway 60 H Base & Surface >7" Thick 20 U Undivided Highway 90 M Base & Surface <7" Thick 20 X Unconstructed Highway 10 O Oiled Earth - Gravel 80 Group Weight 90 P Bridge Deck 50 E Earth 90 Population Code Score F Undetermined 70 B Urban 90 G Bridge Deck (All Not Codes B or P) 40 R Rural 50 Group Weight 80 U Urbanized 70 Group Weight 100 Median Type Score A Cable Barrier 70 Functional Class Score B Cable Barrier w/ Glare Screen 70 0 None 20 C Metal Beam Barrier 30 1 Principle Arterial w/ C/L Principle Arterial 90 D Metal Beam Barrier w/ Glare Screen 20 2 Principle Arterial w/ C/L Minor Arterial 85 E Concrete Barrier 60 3 Principle Arterial Non-Connecting Link 80 F Concrete Barrier w/ Glare Screen 60 4 Minor Arterial 40 G Bridge Barrier Railing 30 5 Major Collector 50 H Chain Link Fence 20 6 Minor Collector 30 J Guardrail in Median Both Roadway 40 7 Local 20 K Guardrail in Median Left Roadway 40
Group Weight 90 L Guardrail in Median Right Roadway 30 M Two-Way, One Lane Road 80 Access Control Score N Thrie Beam Barrier 60 C Conventional 80 P Thrie Beam Barrier w/ Glare Screen 55 E Expressway 70 Q Conc. Barrier, Both Ways Inside Both Shoulders 45 F Freeway 50 R Conc. Barrier, Left Rdwy Median Shoulder Area 60 S One-Way City Street 60 S Conc. Barrier, Right Rdwy Median Shoulder Area 50 Group Weight 100 X External Barriers on Median Type = C or E 60 Y Other Not Included Above 60 Terrain Score Z No Barriers 90 F Flat 20 Group Weight 20 R Rolling 30 M Mountainous 50 Group Weight 20
DRAFT FINAL
2016 SHOPP Project Prioritization 31
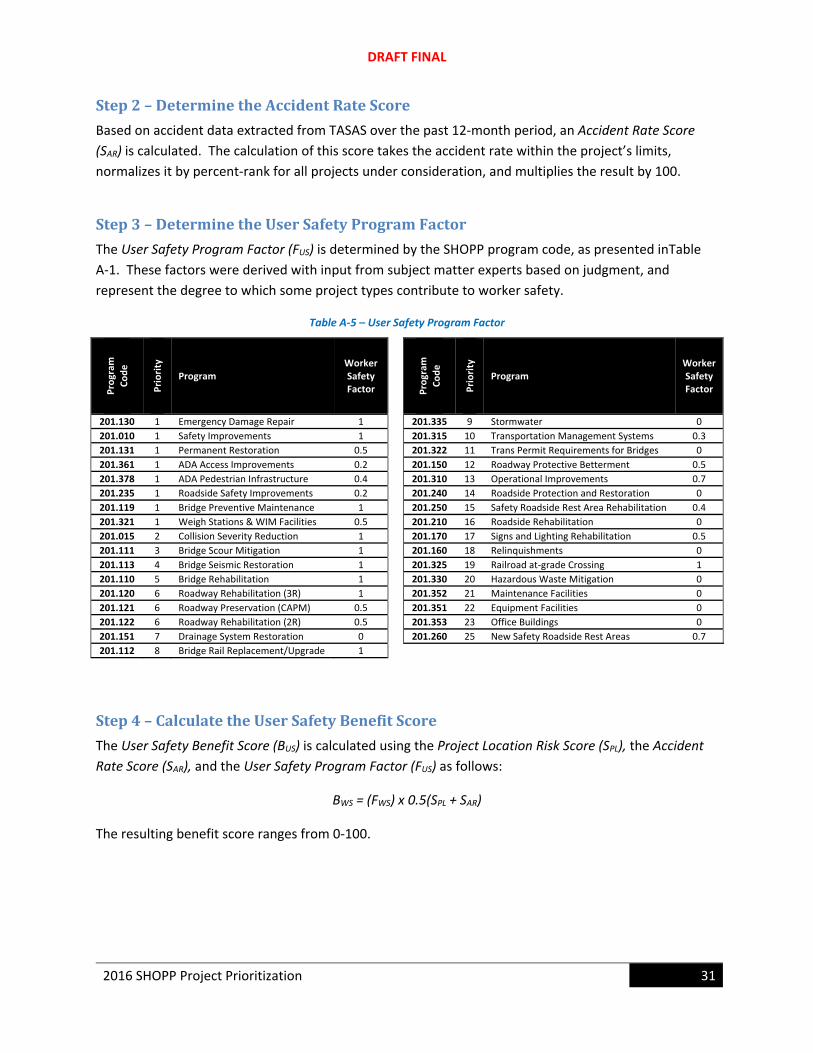
Step2–DeterminetheAccidentRateScore
Based on accident data extracted from TASAS over the past 12‐month period, an Accident Rate Score
(SAR) is calculated. The calculation of this score takes the accident rate within the project’s limits,
normalizes it by percent‐rank for all projects under consideration, and multiplies the result by 100.
Step3–DeterminetheUserSafetyProgramFactor
The User Safety Program Factor (FUS) is determined by the SHOPP program code, as presented inTable
A‐1. These factors were derived with input from subject matter experts based on judgment, and
represent the degree to which some project types contribute to worker safety.
Table A‐5 – User Safety Program Factor
Program
Code
Priority
Program Worker Safety Factor P
rogram
Code
Priority
Program Worker Safety Factor
201.130 1 Emergency Damage Repair 1 201.335 9 Stormwater 0
201.010 1 Safety Improvements 1 201.315 10 Transportation Management Systems 0.3
201.131 1 Permanent Restoration 0.5 201.322 11 Trans Permit Requirements for Bridges 0
201.361 1 ADA Access Improvements 0.2 201.150 12 Roadway Protective Betterment 0.5
201.378 1 ADA Pedestrian Infrastructure 0.4 201.310 13 Operational Improvements 0.7
201.235 1 Roadside Safety Improvements 0.2 201.240 14 Roadside Protection and Restoration 0
201.119 1 Bridge Preventive Maintenance 1 201.250 15 Safety Roadside Rest Area Rehabilitation 0.4
201.321 1 Weigh Stations & WIM Facilities 0.5 201.210 16 Roadside Rehabilitation 0
201.015 2 Collision Severity Reduction 1 201.170 17 Signs and Lighting Rehabilitation 0.5
201.111 3 Bridge Scour Mitigation 1 201.160 18 Relinquishments 0
201.113 4 Bridge Seismic Restoration 1 201.325 19 Railroad at‐grade Crossing 1
201.110 5 Bridge Rehabilitation 1 201.330 20 Hazardous Waste Mitigation 0
201.120 6 Roadway Rehabilitation (3R) 1 201.352 21 Maintenance Facilities 0
201.121 6 Roadway Preservation (CAPM) 0.5 201.351 22 Equipment Facilities 0
201.122 6 Roadway Rehabilitation (2R) 0.5 201.353 23 Office Buildings 0
201.151 7 Drainage System Restoration 0 201.260 25 New Safety Roadside Rest Areas 0.7
201.112 8 Bridge Rail Replacement/Upgrade 1
Step4–CalculatetheUserSafetyBenefitScore
The User Safety Benefit Score (BUS) is calculated using the Project Location Risk Score (SPL), the Accident
Rate Score (SAR), and the User Safety Program Factor (FUS) as follows:
BWS = (FWS) x 0.5(SPL + SAR)
The resulting benefit score ranges from 0‐100.
DRAFT FINAL
32 2016 SHOPP Project Prioritization
A.3–MaximizeCommunityHealththroughActiveTransportation
Step1–DeterminetheAirQualityattheProjectSite
The existing air quality in the region of the proposed project is determined by county‐wide maximum
ozone levels, measured in parts‐per‐million (ppm). The source for ozone data is the CalEnviroScreen
Version 2.0 website9, developed by the Office of Environmental Health Hazard Assessment (OEHHA), on
behalf of the California Environmental Protection Agency (CalEPA). The data is made available through
their website as an ArcGIS point shapefile. Data points are aggregated by county within ArcGIS, and the
resulting maximum ozone levels are associated to SHOPP projects.
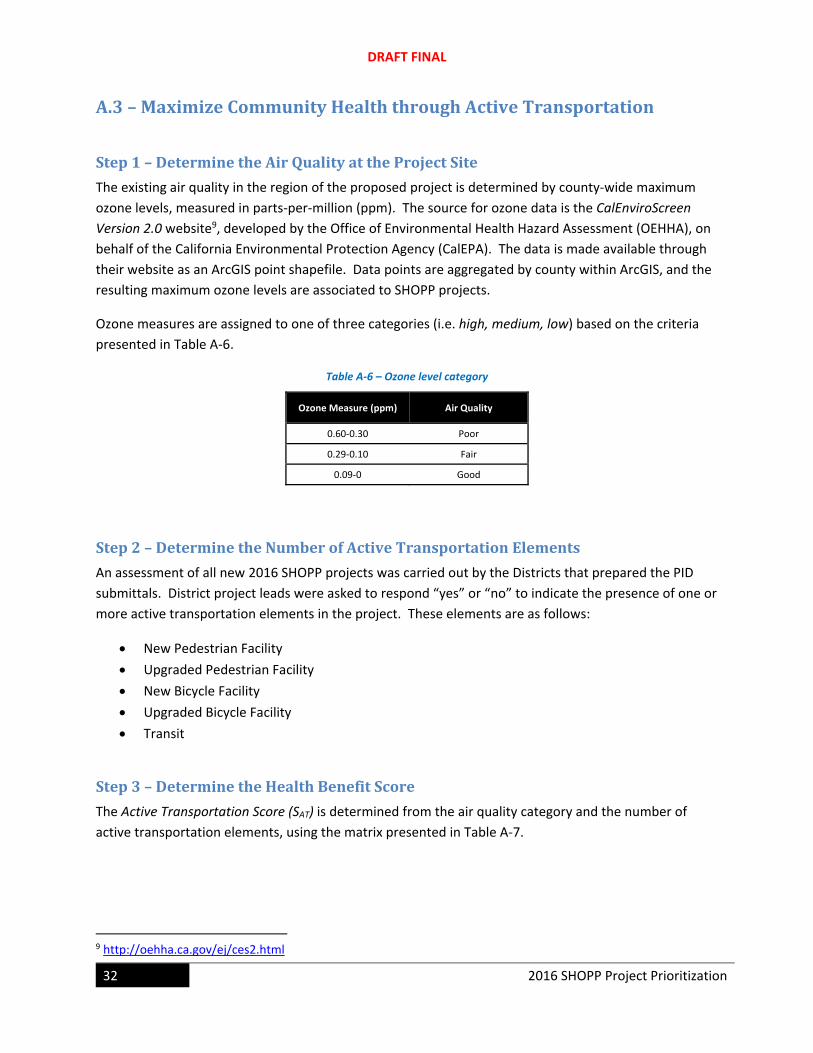
Ozone measures are assigned to one of three categories (i.e. high, medium, low) based on the criteria
presented in Table A‐6.
Table A‐6 – Ozone level category
Ozone Measure (ppm) Air Quality
0.60‐0.30 Poor
0.29‐0.10 Fair
0.09‐0 Good
Step2–DeterminetheNumberofActiveTransportationElements
An assessment of all new 2016 SHOPP projects was carried out by the Districts that prepared the PID
submittals. District project leads were asked to respond “yes” or “no” to indicate the presence of one or
more active transportation elements in the project. These elements are as follows:
New Pedestrian Facility
Upgraded Pedestrian Facility
New Bicycle Facility
Upgraded Bicycle Facility
Transit
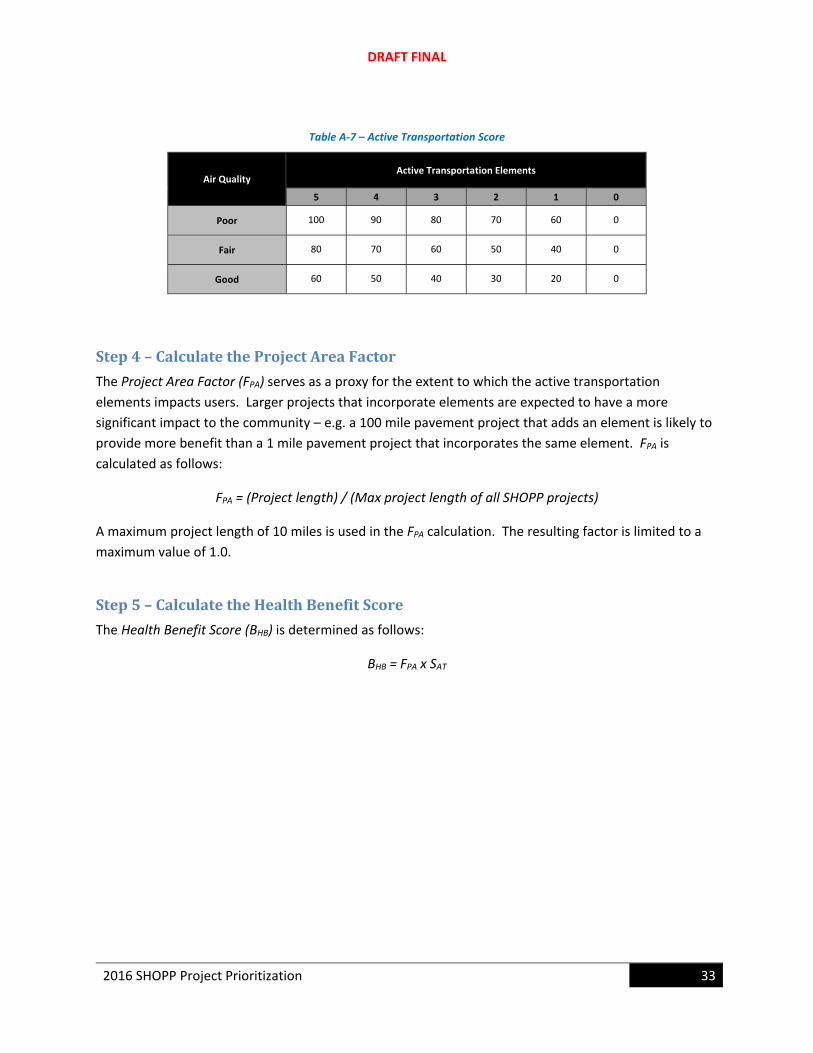
Step3–DeterminetheHealthBenefitScore
The Active Transportation Score (SAT) is determined from the air quality category and the number of
active transportation elements, using the matrix presented in Table A‐7.
9 http://oehha.ca.gov/ej/ces2.html
DRAFT FINAL
2016 SHOPP Project Prioritization 33
Table A‐7 – Active Transportation Score
Air Quality Active Transportation Elements
5 4 3 2 1 0
Poor 100 90 80 70 60 0
Fair 80 70 60 50 40 0
Good 60 50 40 30 20 0
Step4–CalculatetheProjectAreaFactor
The Project Area Factor (FPA) serves as a proxy for the extent to which the active transportation
elements impacts users. Larger projects that incorporate elements are expected to have a more
significant impact to the community – e.g. a 100 mile pavement project that adds an element is likely to
provide more benefit than a 1 mile pavement project that incorporates the same element. FPA is
calculated as follows:
FPA = (Project length) / (Max project length of all SHOPP projects)
A maximum project length of 10 miles is used in the FPA calculation. The resulting factor is limited to a
maximum value of 1.0.
Step5–CalculatetheHealthBenefitScore
The Health Benefit Score (BHB) is determined as follows:
BHB = FPA x SAT
DRAFT FINAL
34 2016 SHOPP Project Prioritization
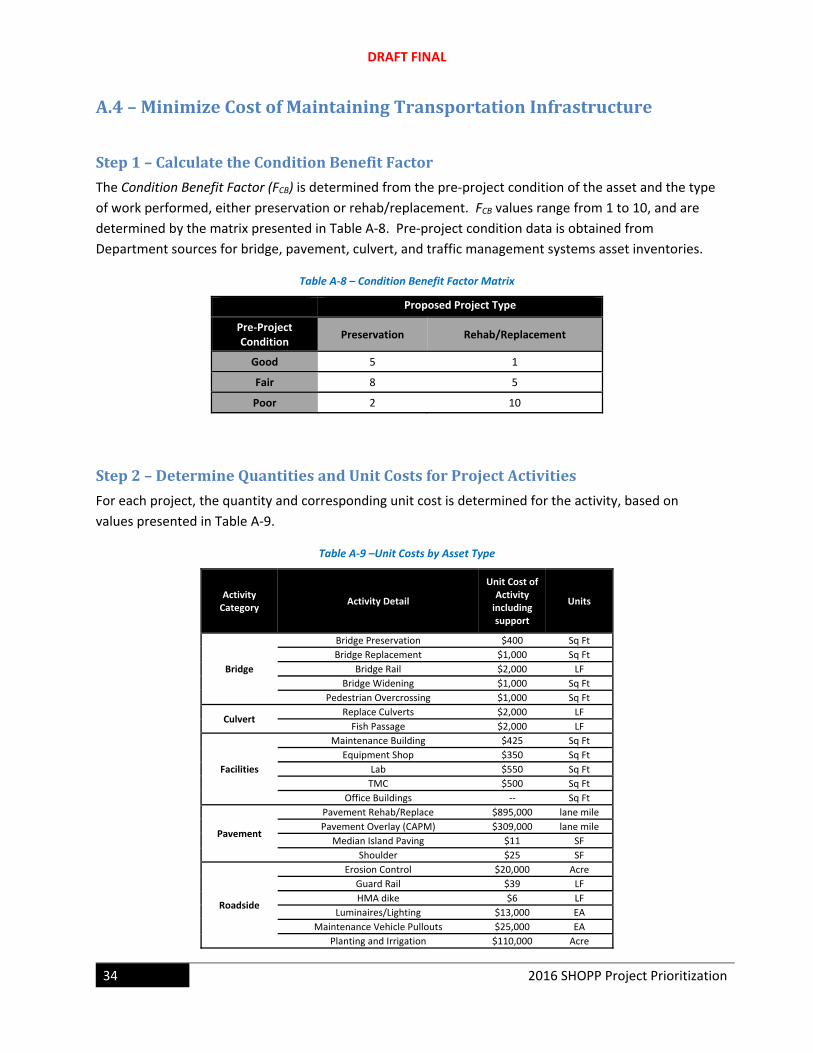
A.4–MinimizeCostofMaintainingTransportationInfrastructure
Step1–CalculatetheConditionBenefitFactor
The Condition Benefit Factor (FCB) is determined from the pre‐project condition of the asset and the type
of work performed, either preservation or rehab/replacement. FCB values range from 1 to 10, and are
determined by the matrix presented in Table A‐8. Pre‐project condition data is obtained from
Department sources for bridge, pavement, culvert, and traffic management systems asset inventories.
Table A‐8 – Condition Benefit Factor Matrix
Proposed Project Type
Pre‐Project Condition
Preservation Rehab/Replacement
Good 5 1
Fair 8 5
Poor 2 10
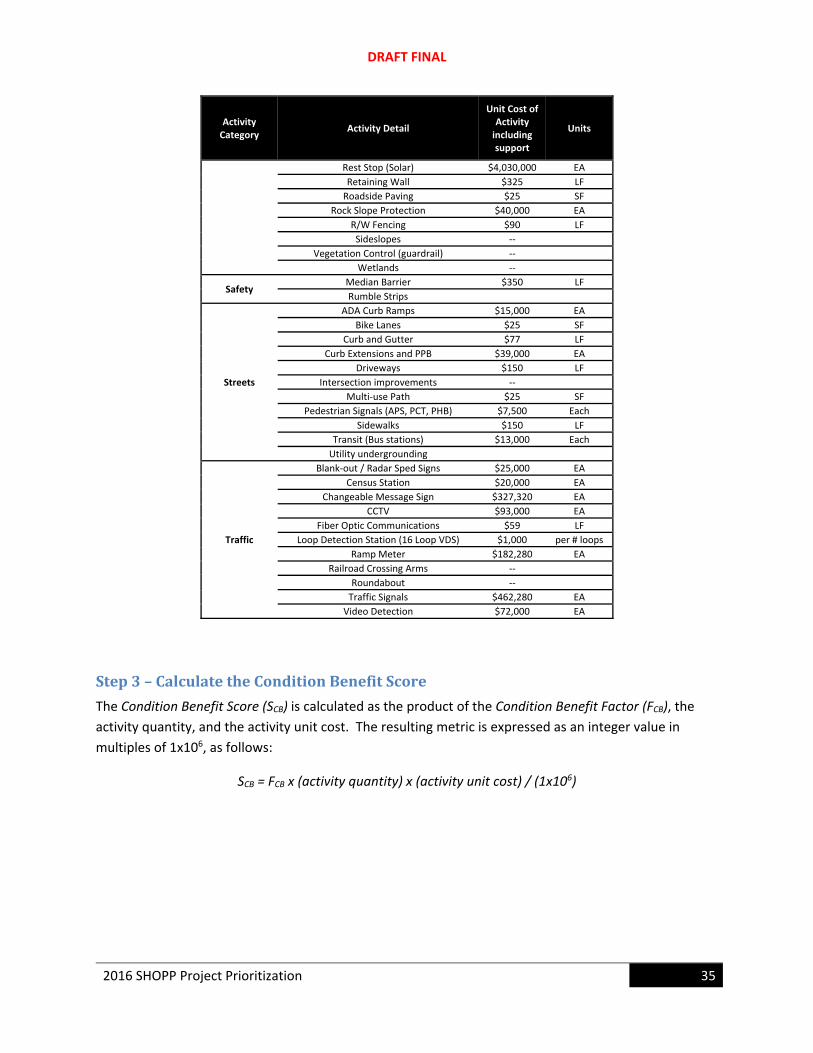
Step2–DetermineQuantitiesandUnitCostsforProjectActivities
For each project, the quantity and corresponding unit cost is determined for the activity, based on
values presented in Table A‐9.
Table A‐9 –Unit Costs by Asset Type
Activity Category
Activity Detail
Unit Cost of Activity including support
Units
Bridge
Bridge Preservation $400 Sq Ft
Bridge Replacement $1,000 Sq Ft
Bridge Rail $2,000 LF
Bridge Widening $1,000 Sq Ft
Pedestrian Overcrossing $1,000 Sq Ft
Culvert Replace Culverts $2,000 LF
Fish Passage $2,000 LF
Facilities
Maintenance Building $425 Sq Ft
Equipment Shop $350 Sq Ft
Lab $550 Sq Ft
TMC $500 Sq Ft
Office Buildings ‐‐ Sq Ft
Pavement
Pavement Rehab/Replace $895,000 lane mile
Pavement Overlay (CAPM) $309,000 lane mile
Median Island Paving $11 SF
Shoulder $25 SF
Roadside
Erosion Control $20,000 Acre
Guard Rail $39 LF
HMA dike $6 LF
Luminaires/Lighting $13,000 EA
Maintenance Vehicle Pullouts $25,000 EA
Planting and Irrigation $110,000 Acre
DRAFT FINAL
2016 SHOPP Project Prioritization 35
Activity Category
Activity Detail
Unit Cost of Activity including support
Units
Rest Stop (Solar) $4,030,000 EA
Retaining Wall $325 LF
Roadside Paving $25 SF
Rock Slope Protection $40,000 EA
R/W Fencing $90 LF
Sideslopes ‐‐
Vegetation Control (guardrail) ‐‐
Wetlands ‐‐
Safety Median Barrier $350 LF
Rumble Strips
Streets
ADA Curb Ramps $15,000 EA
Bike Lanes $25 SF
Curb and Gutter $77 LF
Curb Extensions and PPB $39,000 EA
Driveways $150 LF
Intersection improvements ‐‐
Multi‐use Path $25 SF
Pedestrian Signals (APS, PCT, PHB) $7,500 Each
Sidewalks $150 LF
Transit (Bus stations) $13,000 Each
Utility undergrounding
Traffic
Blank‐out / Radar Sped Signs $25,000 EA
Census Station $20,000 EA
Changeable Message Sign $327,320 EA
CCTV $93,000 EA
Fiber Optic Communications $59 LF
Loop Detection Station (16 Loop VDS) $1,000 per # loops
Ramp Meter $182,280 EA
Railroad Crossing Arms ‐‐
Roundabout ‐‐
Traffic Signals $462,280 EA
Video Detection $72,000 EA
Step3–CalculatetheConditionBenefitScore
The Condition Benefit Score (SCB) is calculated as the product of the Condition Benefit Factor (FCB), the
activity quantity, and the activity unit cost. The resulting metric is expressed as an integer value in
multiples of 1x10⁶, as follows:
SCB = FCB x (activity quantity) x (activity unit cost) / (1x10⁶)
DRAFT FINAL
36 2016 SHOPP Project Prioritization
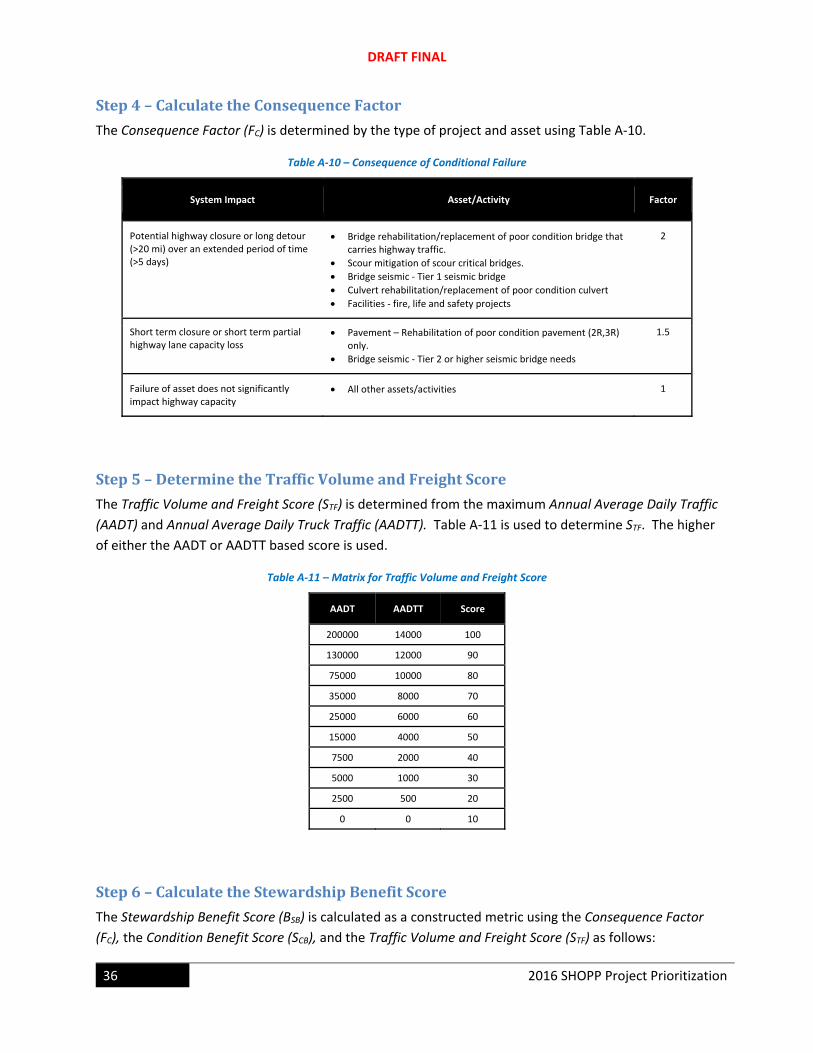
Step4–CalculatetheConsequenceFactor
The Consequence Factor (FC) is determined by the type of project and asset using Table A‐10.
Table A‐10 – Consequence of Conditional Failure
System Impact Asset/Activity Factor
Potential highway closure or long detour (>20 mi) over an extended period of time (>5 days)
Bridge rehabilitation/replacement of poor condition bridge that carries highway traffic.
Scour mitigation of scour critical bridges.
Bridge seismic ‐ Tier 1 seismic bridge
Culvert rehabilitation/replacement of poor condition culvert
Facilities ‐ fire, life and safety projects
2
Short term closure or short term partial highway lane capacity loss
Pavement – Rehabilitation of poor condition pavement (2R,3R) only.
Bridge seismic ‐ Tier 2 or higher seismic bridge needs
1.5
Failure of asset does not significantly impact highway capacity
All other assets/activities 1
Step5–DeterminetheTrafficVolumeandFreightScore
The Traffic Volume and Freight Score (STF) is determined from the maximum Annual Average Daily Traffic
(AADT) and Annual Average Daily Truck Traffic (AADTT). Table A‐11 is used to determine STF. The higher
of either the AADT or AADTT based score is used.
Table A‐11 – Matrix for Traffic Volume and Freight Score
AADT AADTT Score
200000 14000 100
130000 12000 90
75000 10000 80
35000 8000 70
25000 6000 60
15000 4000 50
7500 2000 40
5000 1000 30
2500 500 20
0 0 10
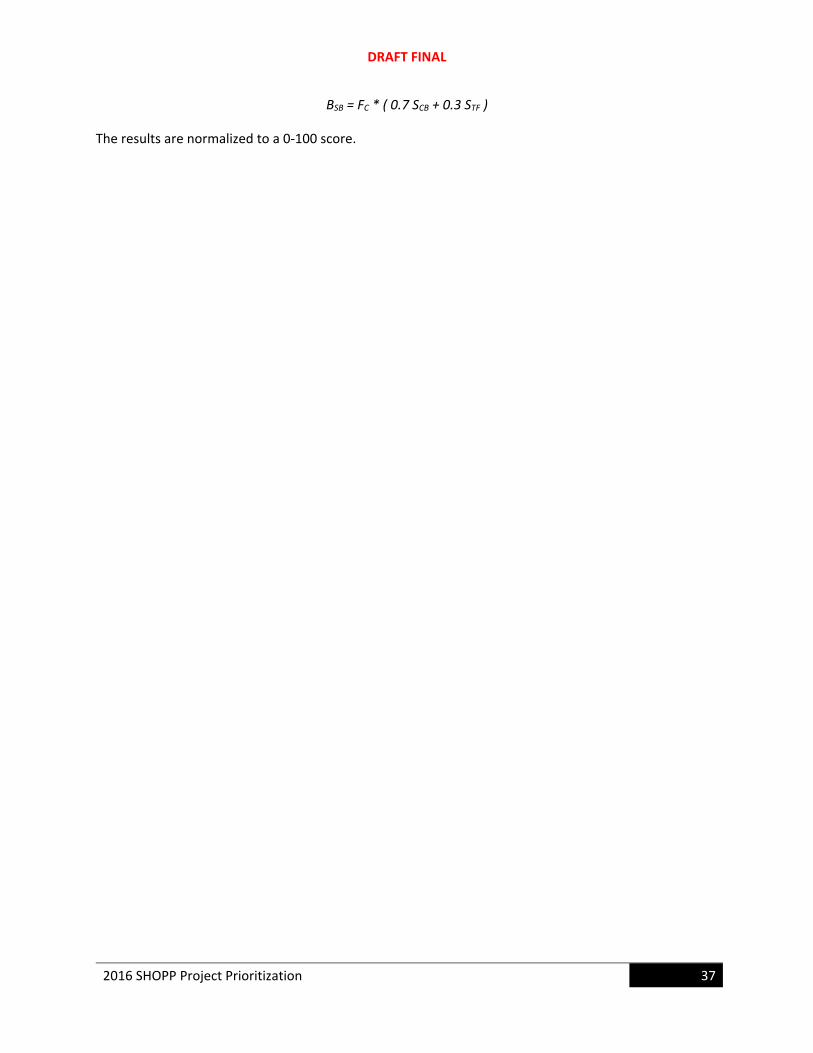
Step6–CalculatetheStewardshipBenefitScore
The Stewardship Benefit Score (BSB) is calculated as a constructed metric using the Consequence Factor
(FC), the Condition Benefit Score (SCB), and the Traffic Volume and Freight Score (STF) as follows:
DRAFT FINAL
2016 SHOPP Project Prioritization 37
BSB = FC * ( 0.7 SCB + 0.3 STF )
The results are normalized to a 0‐100 score.
DRAFT FINAL
38 2016 SHOPP Project Prioritization
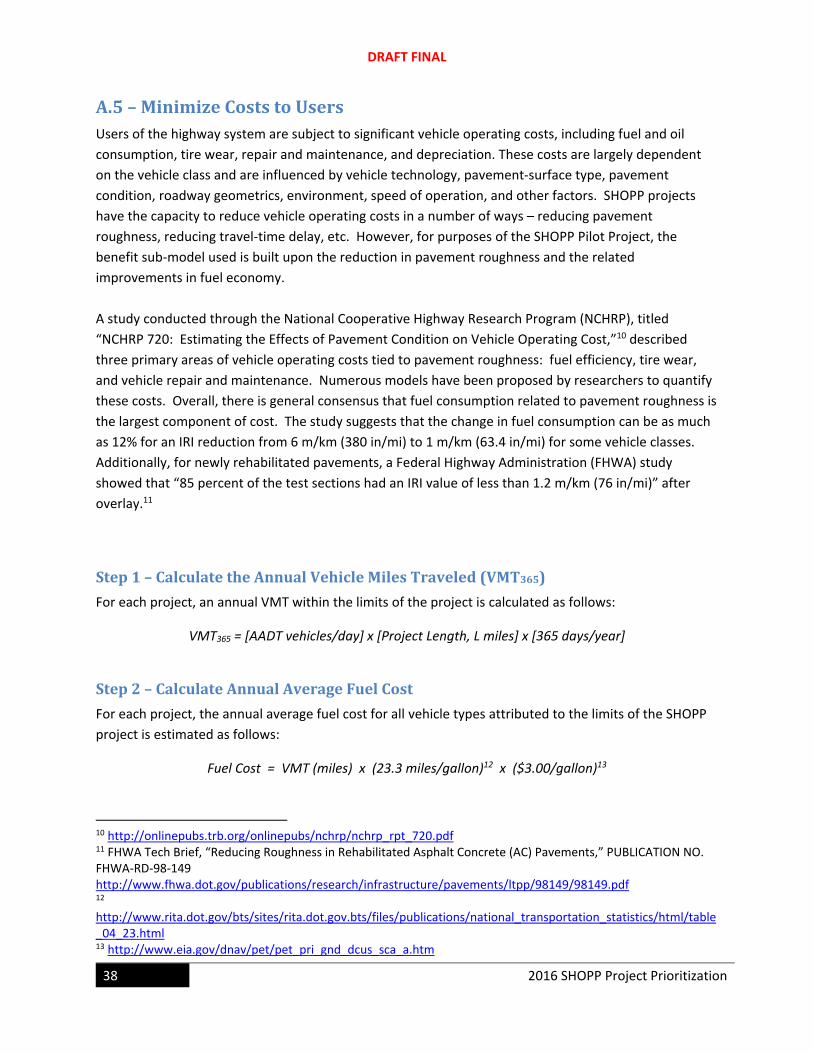
A.5–MinimizeCoststoUsersUsers of the highway system are subject to significant vehicle operating costs, including fuel and oil
consumption, tire wear, repair and maintenance, and depreciation. These costs are largely dependent
on the vehicle class and are influenced by vehicle technology, pavement‐surface type, pavement
condition, roadway geometrics, environment, speed of operation, and other factors. SHOPP projects
have the capacity to reduce vehicle operating costs in a number of ways – reducing pavement
roughness, reducing travel‐time delay, etc. However, for purposes of the SHOPP Pilot Project, the
benefit sub‐model used is built upon the reduction in pavement roughness and the related
improvements in fuel economy.
A study conducted through the National Cooperative Highway Research Program (NCHRP), titled
“NCHRP 720: Estimating the Effects of Pavement Condition on Vehicle Operating Cost,”10 described
three primary areas of vehicle operating costs tied to pavement roughness: fuel efficiency, tire wear,
and vehicle repair and maintenance. Numerous models have been proposed by researchers to quantify
these costs. Overall, there is general consensus that fuel consumption related to pavement roughness is
the largest component of cost. The study suggests that the change in fuel consumption can be as much
as 12% for an IRI reduction from 6 m/km (380 in/mi) to 1 m/km (63.4 in/mi) for some vehicle classes.
Additionally, for newly rehabilitated pavements, a Federal Highway Administration (FHWA) study
showed that “85 percent of the test sections had an IRI value of less than 1.2 m/km (76 in/mi)” after
overlay.11
Step1–CalculatetheAnnualVehicleMilesTraveled(VMT365)
For each project, an annual VMT within the limits of the project is calculated as follows:
VMT365 = [AADT vehicles/day] x [Project Length, L miles] x [365 days/year]
Step2–CalculateAnnualAverageFuelCost
For each project, the annual average fuel cost for all vehicle types attributed to the limits of the SHOPP
project is estimated as follows:
Fuel Cost = VMT (miles) x (23.3 miles/gallon)12 x ($3.00/gallon)13
10 http://onlinepubs.trb.org/onlinepubs/nchrp/nchrp_rpt_720.pdf 11 FHWA Tech Brief, “Reducing Roughness in Rehabilitated Asphalt Concrete (AC) Pavements,” PUBLICATION NO. FHWA‐RD‐98‐149 http://www.fhwa.dot.gov/publications/research/infrastructure/pavements/ltpp/98149/98149.pdf 12 http://www.rita.dot.gov/bts/sites/rita.dot.gov.bts/files/publications/national_transportation_statistics/html/table_04_23.html 13 http://www.eia.gov/dnav/pet/pet_pri_gnd_dcus_sca_a.htm
DRAFT FINAL
2016 SHOPP Project Prioritization 39
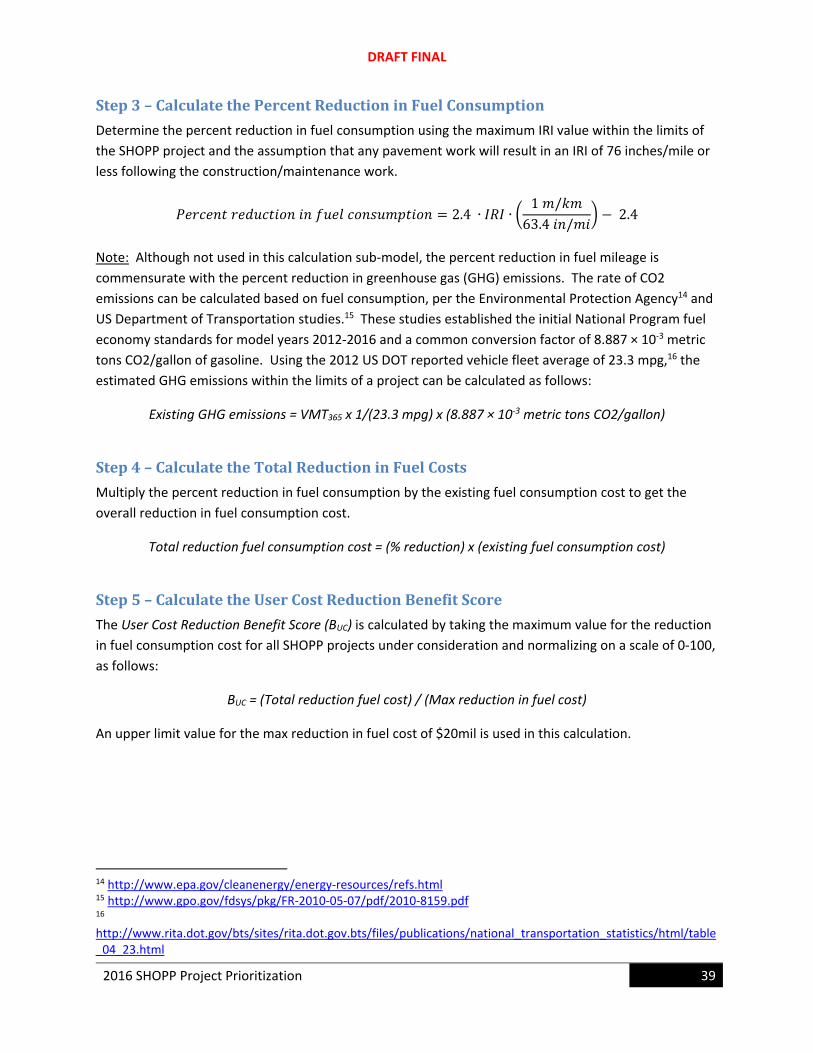
Step3–CalculatethePercentReductioninFuelConsumption
Determine the percent reduction in fuel consumption using the maximum IRI value within the limits of
the SHOPP project and the assumption that any pavement work will result in an IRI of 76 inches/mile or
less following the construction/maintenance work.
2.4 ∙ ∙1 /63.4 /
2.4
Note: Although not used in this calculation sub‐model, the percent reduction in fuel mileage is
commensurate with the percent reduction in greenhouse gas (GHG) emissions. The rate of CO2
emissions can be calculated based on fuel consumption, per the Environmental Protection Agency14 and
US Department of Transportation studies.15 These studies established the initial National Program fuel
economy standards for model years 2012‐2016 and a common conversion factor of 8.887 × 10‐3 metric
tons CO2/gallon of gasoline. Using the 2012 US DOT reported vehicle fleet average of 23.3 mpg,16 the
estimated GHG emissions within the limits of a project can be calculated as follows:
Existing GHG emissions = VMT365 x 1/(23.3 mpg) x (8.887 × 10‐3 metric tons CO2/gallon)
Step4–CalculatetheTotalReductioninFuelCosts
Multiply the percent reduction in fuel consumption by the existing fuel consumption cost to get the
overall reduction in fuel consumption cost.
Total reduction fuel consumption cost = (% reduction) x (existing fuel consumption cost)
Step5–CalculatetheUserCostReductionBenefitScore
The User Cost Reduction Benefit Score (BUC) is calculated by taking the maximum value for the reduction
in fuel consumption cost for all SHOPP projects under consideration and normalizing on a scale of 0‐100,
as follows:
BUC = (Total reduction fuel cost) / (Max reduction in fuel cost)
An upper limit value for the max reduction in fuel cost of $20mil is used in this calculation.
14 http://www.epa.gov/cleanenergy/energy‐resources/refs.html 15 http://www.gpo.gov/fdsys/pkg/FR‐2010‐05‐07/pdf/2010‐8159.pdf 16 http://www.rita.dot.gov/bts/sites/rita.dot.gov.bts/files/publications/national_transportation_statistics/html/table_04_23.html
DRAFT FINAL
40 2016 SHOPP Project Prioritization
A.6–MinimizeTravelDelayTimeforUsersUsers of the highway system can benefit from travel delay reductions. Two categories of SHOPP
projects specifically address this – Program 201.310 Operational Improvements and 201.315
Transportation Management Systems. The benefit sub‐model adopted for the SHOPP Pilot Project uses
these program codes in combination with traffic volumes to determine an overall score.
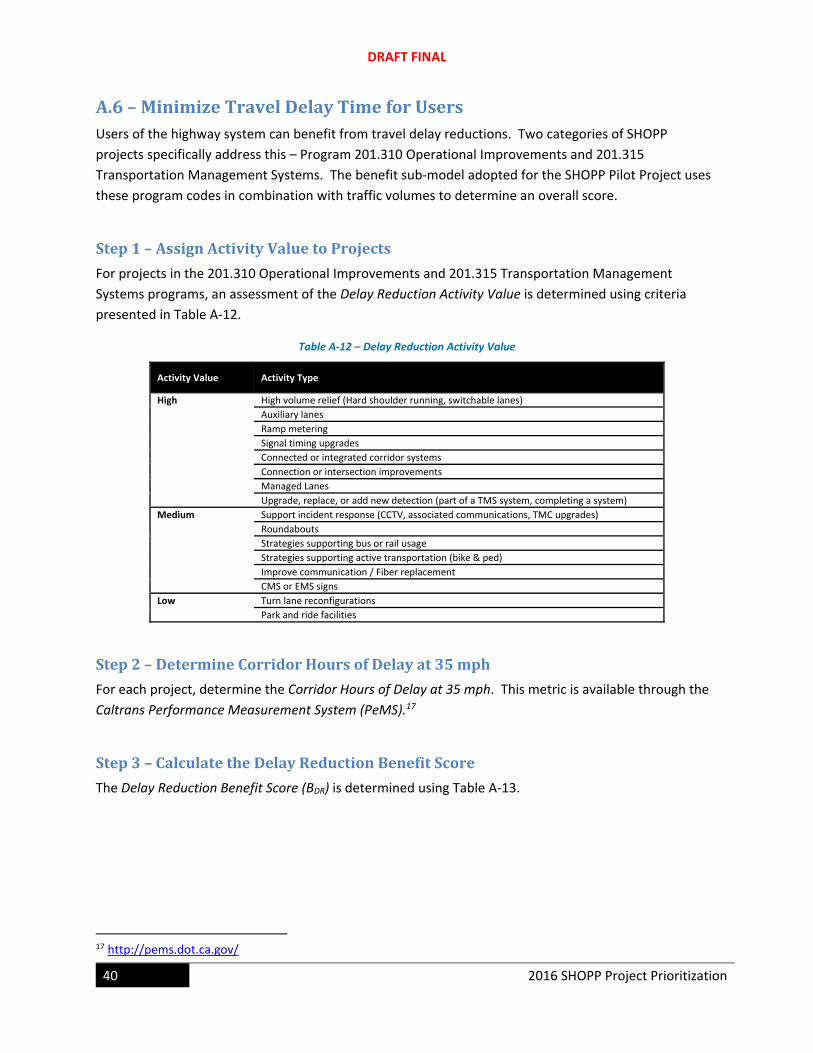
Step1–AssignActivityValuetoProjects
For projects in the 201.310 Operational Improvements and 201.315 Transportation Management
Systems programs, an assessment of the Delay Reduction Activity Value is determined using criteria
presented in Table A‐12.
Table A‐12 – Delay Reduction Activity Value
Activity Value Activity Type
High High volume relief (Hard shoulder running, switchable lanes)
Auxiliary lanes
Ramp metering
Signal timing upgrades
Connected or integrated corridor systems
Connection or intersection improvements
Managed Lanes
Upgrade, replace, or add new detection (part of a TMS system, completing a system)
Medium Support incident response (CCTV, associated communications, TMC upgrades)
Roundabouts
Strategies supporting bus or rail usage
Strategies supporting active transportation (bike & ped)
Improve communication / Fiber replacement
CMS or EMS signs
Low Turn lane reconfigurations
Park and ride facilities
Step2–DetermineCorridorHoursofDelayat35mph
For each project, determine the Corridor Hours of Delay at 35 mph. This metric is available through the
Caltrans Performance Measurement System (PeMS).17
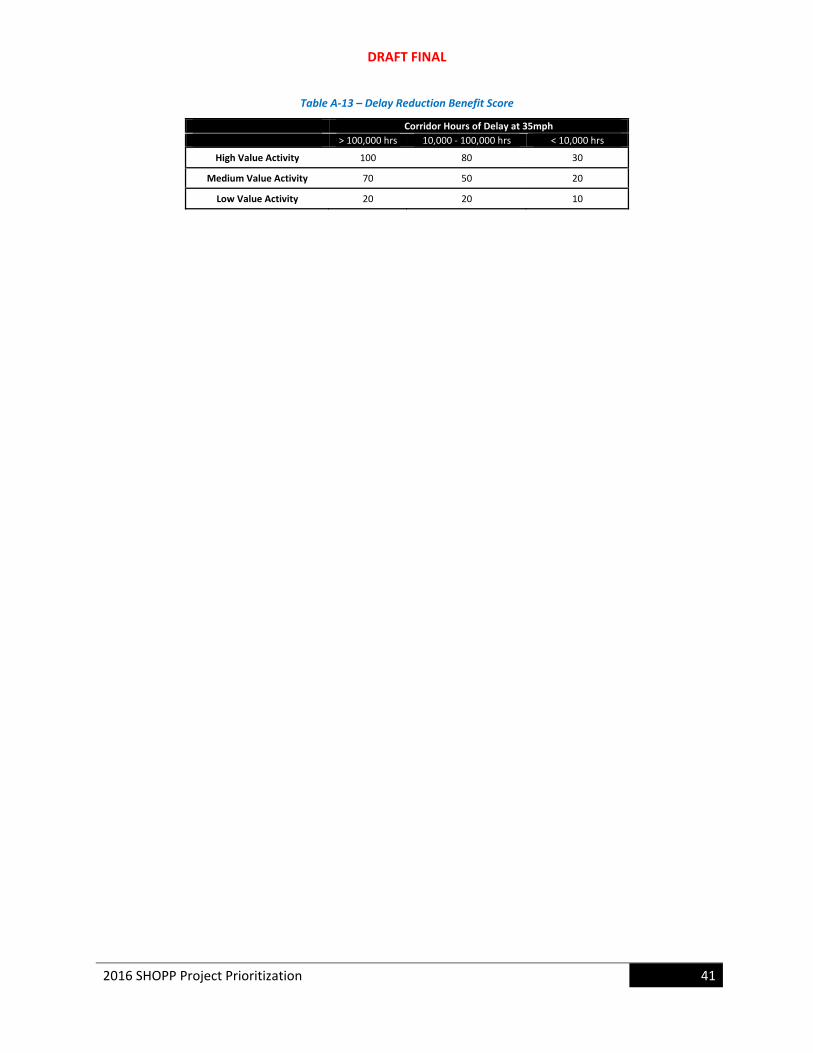
Step3–CalculatetheDelayReductionBenefitScore
The Delay Reduction Benefit Score (BDR) is determined using Table A‐13.
17 http://pems.dot.ca.gov/
DRAFT FINAL
2016 SHOPP Project Prioritization 41
Table A‐13 – Delay Reduction Benefit Score
Corridor Hours of Delay at 35mph
> 100,000 hrs 10,000 ‐ 100,000 hrs < 10,000 hrs
High Value Activity 100 80 30
Medium Value Activity 70 50 20
Low Value Activity 20 20 10
DRAFT FINAL
42 2016 SHOPP Project Prioritization
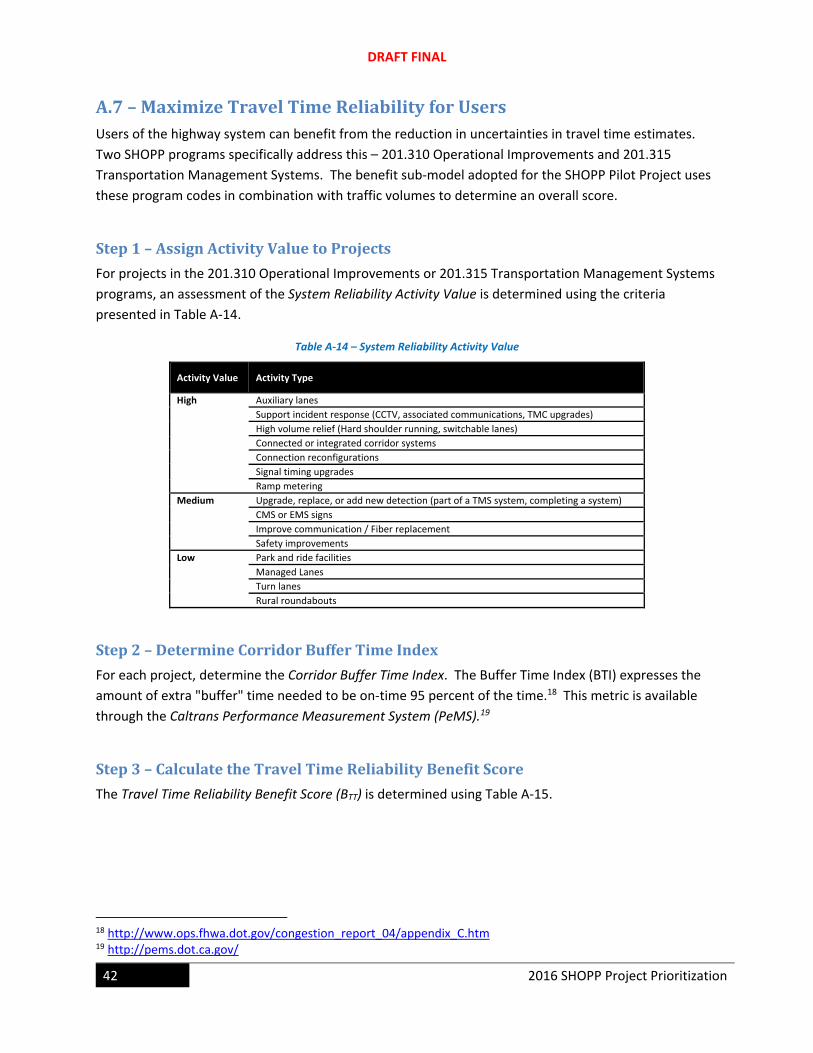
A.7–MaximizeTravelTimeReliabilityforUsersUsers of the highway system can benefit from the reduction in uncertainties in travel time estimates.
Two SHOPP programs specifically address this – 201.310 Operational Improvements and 201.315
Transportation Management Systems. The benefit sub‐model adopted for the SHOPP Pilot Project uses
these program codes in combination with traffic volumes to determine an overall score.
Step1–AssignActivityValuetoProjects
For projects in the 201.310 Operational Improvements or 201.315 Transportation Management Systems
programs, an assessment of the System Reliability Activity Value is determined using the criteria
presented in Table A‐14.
Table A‐14 – System Reliability Activity Value
Activity Value Activity Type
High Auxiliary lanes
Support incident response (CCTV, associated communications, TMC upgrades)
High volume relief (Hard shoulder running, switchable lanes)
Connected or integrated corridor systems
Connection reconfigurations
Signal timing upgrades
Ramp metering
Medium Upgrade, replace, or add new detection (part of a TMS system, completing a system)
CMS or EMS signs
Improve communication / Fiber replacement
Safety improvements
Low Park and ride facilities
Managed Lanes
Turn lanes
Rural roundabouts
Step2–DetermineCorridorBufferTimeIndex
For each project, determine the Corridor Buffer Time Index. The Buffer Time Index (BTI) expresses the
amount of extra "buffer" time needed to be on‐time 95 percent of the time.18 This metric is available
through the Caltrans Performance Measurement System (PeMS).19
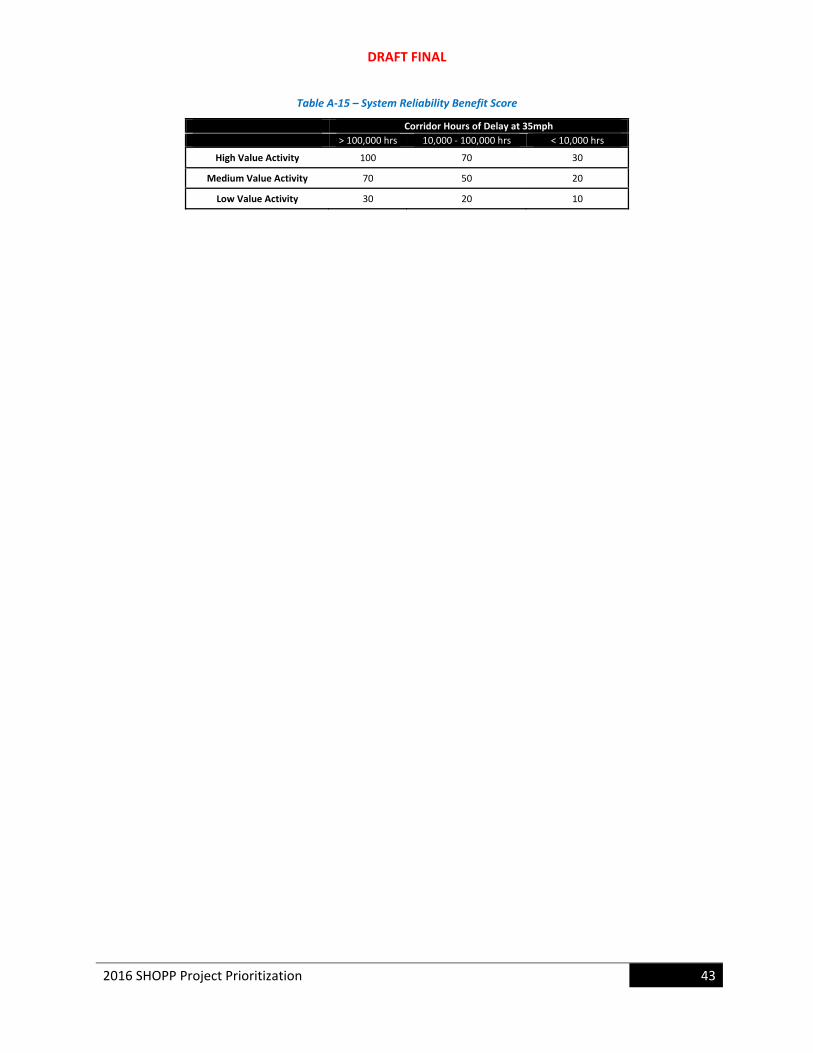
Step3–CalculatetheTravelTimeReliabilityBenefitScore
The Travel Time Reliability Benefit Score (BTT) is determined using Table A‐15.
18 http://www.ops.fhwa.dot.gov/congestion_report_04/appendix_C.htm 19 http://pems.dot.ca.gov/
DRAFT FINAL
2016 SHOPP Project Prioritization 43
Table A‐15 – System Reliability Benefit Score
Corridor Hours of Delay at 35mph
> 100,000 hrs 10,000 ‐ 100,000 hrs < 10,000 hrs
High Value Activity 100 70 30
Medium Value Activity 70 50 20
Low Value Activity 30 20 10
DRAFT FINAL
44 2016 SHOPP Project Prioritization
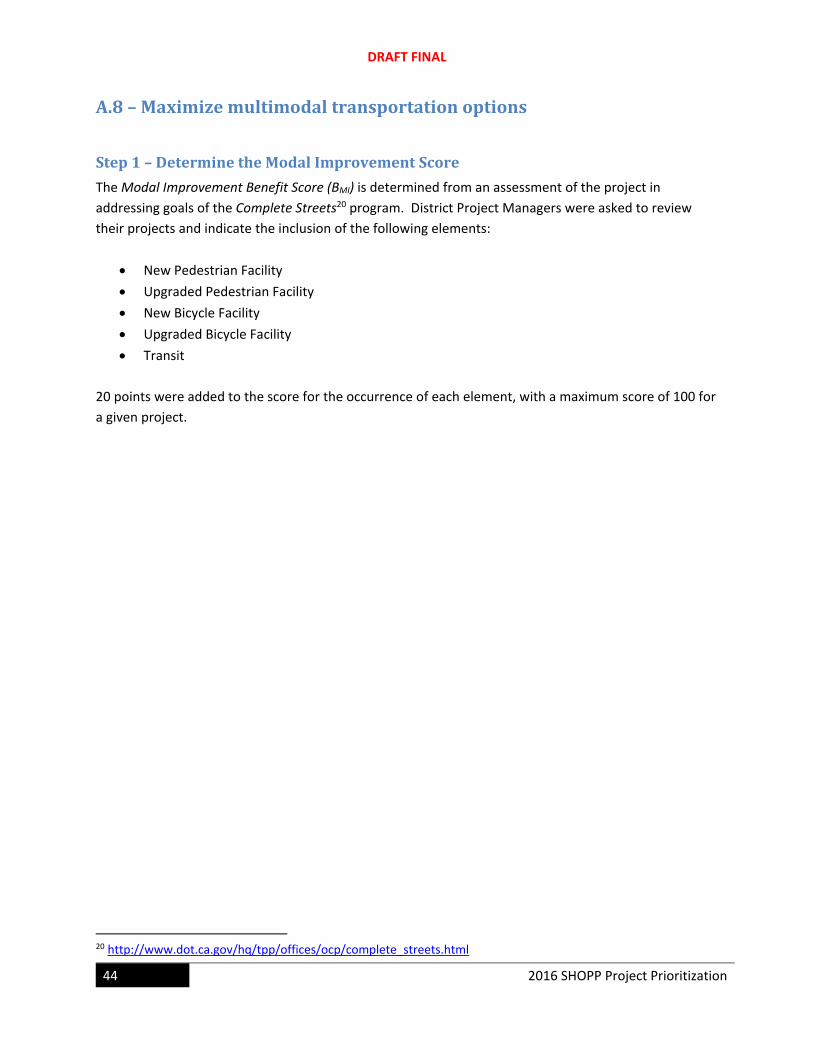
A.8–Maximizemultimodaltransportationoptions
Step1–DeterminetheModalImprovementScore
The Modal Improvement Benefit Score (BMI) is determined from an assessment of the project in
addressing goals of the Complete Streets20 program. District Project Managers were asked to review
their projects and indicate the inclusion of the following elements:
New Pedestrian Facility
Upgraded Pedestrian Facility
New Bicycle Facility
Upgraded Bicycle Facility
Transit
20 points were added to the score for the occurrence of each element, with a maximum score of 100 for
a given project.
20 http://www.dot.ca.gov/hq/tpp/offices/ocp/complete_streets.html
DRAFT FINAL
2016 SHOPP Project Prioritization 45
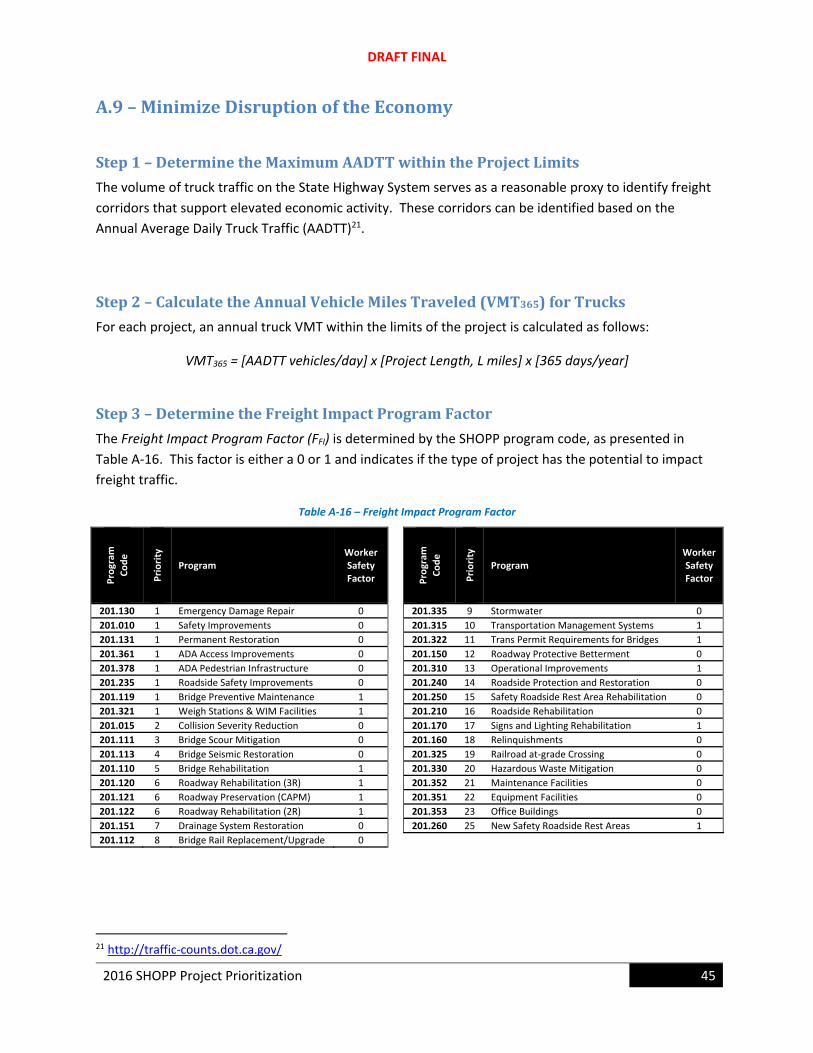
A.9–MinimizeDisruptionoftheEconomy
Step1–DeterminetheMaximumAADTTwithintheProjectLimits
The volume of truck traffic on the State Highway System serves as a reasonable proxy to identify freight
corridors that support elevated economic activity. These corridors can be identified based on the
Annual Average Daily Truck Traffic (AADTT)21.
Step2–CalculatetheAnnualVehicleMilesTraveled(VMT365)forTrucks
For each project, an annual truck VMT within the limits of the project is calculated as follows:
VMT365 = [AADTT vehicles/day] x [Project Length, L miles] x [365 days/year]
Step3–DeterminetheFreightImpactProgramFactor
The Freight Impact Program Factor (FFI) is determined by the SHOPP program code, as presented in
Table A‐16. This factor is either a 0 or 1 and indicates if the type of project has the potential to impact
freight traffic.
Table A‐16 – Freight Impact Program Factor
Program
Code
Priority
Program Worker Safety Factor P
rogram
Code
Priority
Program Worker Safety Factor
201.130 1 Emergency Damage Repair 0 201.335 9 Stormwater 0
201.010 1 Safety Improvements 0 201.315 10 Transportation Management Systems 1
201.131 1 Permanent Restoration 0 201.322 11 Trans Permit Requirements for Bridges 1
201.361 1 ADA Access Improvements 0 201.150 12 Roadway Protective Betterment 0
201.378 1 ADA Pedestrian Infrastructure 0 201.310 13 Operational Improvements 1
201.235 1 Roadside Safety Improvements 0 201.240 14 Roadside Protection and Restoration 0
201.119 1 Bridge Preventive Maintenance 1 201.250 15 Safety Roadside Rest Area Rehabilitation 0
201.321 1 Weigh Stations & WIM Facilities 1 201.210 16 Roadside Rehabilitation 0
201.015 2 Collision Severity Reduction 0 201.170 17 Signs and Lighting Rehabilitation 1
201.111 3 Bridge Scour Mitigation 0 201.160 18 Relinquishments 0
201.113 4 Bridge Seismic Restoration 0 201.325 19 Railroad at‐grade Crossing 0
201.110 5 Bridge Rehabilitation 1 201.330 20 Hazardous Waste Mitigation 0
201.120 6 Roadway Rehabilitation (3R) 1 201.352 21 Maintenance Facilities 0
201.121 6 Roadway Preservation (CAPM) 1 201.351 22 Equipment Facilities 0
201.122 6 Roadway Rehabilitation (2R) 1 201.353 23 Office Buildings 0
201.151 7 Drainage System Restoration 0 201.260 25 New Safety Roadside Rest Areas 1
201.112 8 Bridge Rail Replacement/Upgrade 0
21 http://traffic‐counts.dot.ca.gov/
DRAFT FINAL
46 2016 SHOPP Project Prioritization
Step4–CalculatetheFreightCorridorBenefit
The Freight Corridor Benefit Score (BFC) is calculated as follows:
BFC = (FFI) x (VMT365)
The resulting score is normalized on a 0‐100 scale. A limiting maximum value for VMT of 200,000
vehicle‐miles per year is applied.
DRAFT FINAL
2016 SHOPP Project Prioritization 47
A.10–MinimizeDamagetoEnvironmentMinimizing damage to the environment is achieved through reducing adverse changes to the physical
conditions within the area affected by the project, including land, air, water, minerals, flora, fauna,
ambient noise, and objects of historic or aesthetic significance. Two components of environmental
impacts are addressed: (1) the reduction of greenhouse gas emissions, and (2) impacts on water quality.
Step1–CalculateCounty‐LevelGHGEmissions
The Facility Level Information on Greenhouse Gases Tool (FLIGHT)22 reports greenhouse gas data
reported to Environmental Protection Agency (EPA) by large emitters, facilities that inject CO2
underground, and suppliers of products that result in GHG emissions when used in the United States.
Using this data resource, annual county‐level totals can be calculated. Annual Vehicle Miles of Travel
(VMT) is published by Caltrans through the “California Public Road Data” report 23. Using an EPA default
rate of 423 grams of CO2 per VMT for a passenger car24, county‐level GHG emissions due to vehicle
traffic can be approximated.
Step2–CalculatetheGHGEmissionsScore
The sum of GHG emissions from facilities and vehicles by county is associated to each project.
Pavement projects where the existing IRI exceeds 255 inches per mile are considered most effective in
reducing GHG emissions while improving the asset condition at optimum cost. For pavement projects
where IRI>255, a GHG Emissions Score (SGE) is determined based on county‐level GHG emissions relative
to 10 million metric tons. The calculation is as follows:
SGE = (GHG emissions at project location) / (10 mil metric tons) *100
SGE is limited to a maximum score of 100.
Step3–CalculatetheWaterQualityScore
SHOPP projects in the programs for Stormwater (201.335) and Hazardous Waste Mitigation (201.330)
are assigned a Water Quality Score (SWC). Stormwater projects are quantified by the area of land
treated, in units of acres.
SWC is calculated based on a combination of 330 and 335 projects. The first component, SWC1, is
determined from the area of land treated, in units of acres, relative to 30 acres. The calculation is as
follows:
22 http://ghgdata.epa.gov/ghgp/main.do 23 http://www.dot.ca.gov/hq/tsip/hpms/hpmslibrary/prd/2013prd/2013PRD‐revised.pdf 24 https://www.fhwa.dot.gov/environment/climate_change/mitigation/publications_and_tools/ghg_handbook/chapter05.cfm
DRAFT FINAL
48 2016 SHOPP Project Prioritization
SWC1 = (area of land treated) / (30 acres) * 100
A second component, SWC2, is determined by the number of locations on a 0‐100 scale for Waste
Mitigation projects. The number of locations for a given project relative to the maximum for any SHOPP
project determines the score.
SWC2 = (number of locations) / (max locations) * 100
SWC used in subsequent calculations is the maximum of either SWC1 or SWC2.
Step4–DeterminetheAir&WaterQualityBenefitScore
The Air & Water Quality Benefit Score (BAW) is determined by the maximum of either the GHG Emissions
Score (SGE) or the Water Quality Score (SWC).
DRAFT FINAL
2016 SHOPP Project Prioritization 49
A.11–MaximizeResilienceofInfrastructure
Step1–CalculatetheInfrastructureResilienceScore
The Infrastructure Resilience Score (SIR) is determined by the project type. Projects that address bridge
seismic, bridge scour, or culverts are assigned a score of 100.

DRAFT FINAL
50 2016 SHOPP Project Prioritization
(This page is intentionally blank.)
DRAFT FINAL
2016 SHOPP Project Prioritization 51
AppendixB–2016SHOPPProjectScoresandPrioritiesThis appendix presents the complete list of new 2016 SHOPP projects and the results of the scoring and
prioritization analysis.

DRAFT FINAL
52 2016 SHOPP Project Prioritization
(This page is intentionally blank.)
Projects
Rank ID Description
Wo
rker
S
afet
y
Use
r S
afet
y
Hea
lth
Ass
et
Pre
serv
atio
n
Use
r C
ost
s
Del
ay
Red
uct
ion
Sys
tem
R
elia
bil
ity
Tra
vel
Qu
alit
y
Fre
igh
t C
orr
ido
rs
Air
& W
ater
Q
ual
ity
Co
mp
lete
S
tree
ts
1 23308-RIV-91-7.4/15.6, 201.310 Operational Improvements, PPNO 3003Q, $1.7mil (Project 233)
0 60 24 20 0 50 35 10 12 0 0 211 $1.7 123
2 6303-GLE-5-VAR, 201.170 Signs and Lighting Rehabilitation, PPNO 3711, $1.7mil (Project 63)
60 43 0 0 0 0 0 0 30 0 0 133 $1.7 78
3 22608-SBD-60-R0.0/R9.9, 201.170 Signs and Lighting Rehabilitation, PPNO 0178P, $2mil (Project 226)
60 44 0 0 0 0 0 0 30 0 0 134 $2.0 69
4 28612-ORA-57-10.7/16.6, 201.315 Transportation Management Systems, PPNO 2530J, $3mil (Project 286)
0 25 9 36 0 50 50 20 6 0 0 196 $3.0 65
5 14507-LA-405-8.8, 201.119 Bridge Preventive Maintenance, PPNO 4721, $2.8mil (Project 145)
30 76 0 67 0 0 0 0 0 0 0 172 $2.8 61
6 22508-RIV-60-R0.0/22.3, 201.170 Signs and Lighting Rehabilitation, PPNO 0022K, $2.2mil (Project 225)
60 43 0 0 0 0 0 0 30 0 0 133 $2.2 60
7 14307-LA-91-R10.2/R10.4, 201.113 Bridge Seismic Restoration, PPNO 4704, $2.8mil (Project 143)
0 74 0 59 0 0 0 0 0 0 30 163 $2.8 58
8 19308-RIV-10-R110.5, 201.112 Bridge Rail Replacement/Upgrade, PPNO 3002L, $1.2mil (Project 193)
15 44 0 10 0 0 0 0 0 0 0 70 $1.2 57
9 6003-YOL-80-R11.3, 201.110 Bridge Rehabilitation, PPNO 8901, $3.1mil (Project 60)
30 63 0 63 0 0 0 10 0 0 0 166 $3.1 53
10 15507-LA-710-23.6/26.3, 201.151 Drainage System Restoration, PPNO 4845, $1.8mil (Project 155)
23 0 0 38 0 0 0 0 0 0 30 90 $1.8 51
11 19408-RIV-10-R24.5/R156.4, 201.119 Bridge Preventive Maintenance, PPNO 3002G, $3.7mil (Project 194)
60 57 0 33 0 0 0 0 30 0 0 180 $3.7 49
12 26811-IMP-115-L10.4/19.8, 201.151 Drainage System Restoration, PPNO 0602, $1.1mil (Project 268)
15 0 0 10 0 0 0 0 0 0 30 55 $1.1 48
13 6503-SAC-50-R3.5, 201.310 Operational Improvements, PPNO 6242, $2.7mil (Project 65)
0 52 0 18 0 10 10 40 0 0 0 130 $2.7 48
Min
imiz
e d
amag
e to
en
viro
nm
ent
Max
imiz
e eq
uit
y an
d a
cces
s to
m
ult
imo
dal
tr
ansp
ort
atio
n
syst
ems
Safety and HealthStewardship and
EfficiencySystem Performance
Sustainability, Livability, and Economy
Scoring Summary
Min
imiz
e i
nju
rie
s
and
fat
alit
ies
of
wo
rker
s
Min
imiz
e i
nju
rie
s
and
fat
alit
ies
of
use
rs
Max
imiz
e h
ealt
h
of
Cal
ifo
rnia
re
sid
ents
Min
imiz
e C
ost
to
T
axp
ayer
s
Pro
ject
Val
ue
Pro
ject
Co
st (
$mil
)
Pro
ject
Val
ue-
to-C
ost
Rat
io
Min
imiz
e in
con
ven
ien
ce t
o
use
rs o
f th
e h
igh
way
sys
tem
Max
imiz
e q
ual
ity
of
trav
el f
or
all
mo
des
Min
imiz
e d
isru
pti
on
of
the
eco
no
my
Page 1 of 30
Projects
Rank ID Description
Wo
rker
S
afet
y
Use
r S
afet
y
Hea
lth
Ass
et
Pre
serv
atio
n
Use
r C
ost
s
Del
ay
Red
uct
ion
Sys
tem
R
elia
bil
ity
Tra
vel
Qu
alit
y
Fre
igh
t C
orr
ido
rs
Air
& W
ater
Q
ual
ity
Co
mp
lete
S
tree
ts
Min
imiz
e d
amag
e to
en
viro
nm
ent
Max
imiz
e eq
uit
y an
d a
cces
s to
m
ult
imo
dal
tr
ansp
ort
atio
n
syst
ems
Safety and HealthStewardship and
EfficiencySystem Performance
Sustainability, Livability, and Economy
Scoring Summary
Min
imiz
e i
nju
rie
s
and
fat
alit
ies
of
wo
rker
s
Min
imiz
e i
nju
rie
s
and
fat
alit
ies
of
use
rs
Max
imiz
e h
ealt
h
of
Cal
ifo
rnia
re
sid
ents
Min
imiz
e C
ost
to
T
axp
ayer
s
Pro
ject
Val
ue
Pro
ject
Co
st (
$mil
)
Pro
ject
Val
ue-
to-C
ost
Rat
io
Min
imiz
e in
con
ven
ien
ce t
o
use
rs o
f th
e h
igh
way
sys
tem
Max
imiz
e q
ual
ity
of
trav
el f
or
all
mo
des
Min
imiz
e d
isru
pti
on
of
the
eco
no
my
14 28812-ORA-5-33.0/43.2, 201.315 Transportation Management Systems, PPNO 2859B, $5.1mil (Project 288)
0 24 15 53 0 50 35 20 30 0 0 227 $5.1 44
15 5003-PLA-80-VAR, 201.315 Transportation Management Systems, PPNO 4291, $2.5mil (Project 50)
0 26 0 20 0 25 10 0 30 0 0 111 $2.5 44
16 21308-SBD-210-10.5/12.7, 201.315 Transportation Management Systems, PPNO 3003X, $3.3mil (Project 213)
0 19 6 19 0 50 35 10 2 0 0 141 $3.3 43
17 28112-ORA-1-20.5/20.9, 201.151 Drainage System Restoration, PPNO 2403A, $2.2mil (Project 281)
8 0 1 29 0 0 0 20 0 0 30 87 $2.2 40
18 3503-ED-50-0.0/80.4, 201.015 Collision Severity Reduction, PPNO 3311, $3.4mil (Project 35) 60 74 0 0 0 0 0 0 0 0 0 134 $3.4 40
19 16807-LA-105-R14.1/R17.2, 201.235 Roadside Safety Improvements, PPNO 4893, $2mil (Project 168)
60 15 0 0 0 0 0 0 0 0 0 75 $2.0 38
20 12206-FRE-5-44.4/45.4, 201.110 Bridge Rehabilitation, PPNO 6725, $2.8mil (Project 122)
30 52 0 23 0 0 0 0 0 0 0 106 $2.8 37
21 28012-ORA-22-R9.1, 201.151 Drainage System Restoration, PPNO 2948, $2.4mil (Project 280)
15 0 0 34 0 0 0 10 0 0 30 89 $2.4 37
22 28712-ORA-91-R2.6/7.2, 201.315 Transportation Management Systems, PPNO 4532, $4.6mil (Project 287)
0 24 12 38 0 50 15 20 9 0 0 169 $4.6 37
23 6403-SAC-50-R2.6/R3.8, 201.310 Operational Improvements, PPNO 6200, $3.9mil (Project 64)
0 51 0 18 0 40 35 0 1 0 0 145 $3.9 37
24 3703-SAC-5-0.1/34.6, 201.015 Collision Severity Reduction, PPNO 5850, $3.6mil (Project 37) 60 70 0 0 0 0 0 0 0 0 0 130 $3.6 36
25 11505-MON-101-R28.0/R30.6, 201.122 Roadway Rehabilitation (2R), PPNO 2546, $1.9mil (Project 115)
8 23 0 34 0 0 0 0 1 0 0 65 $1.9 35
26 7204-SCL-101-VAR, 201.112 Bridge Rail Replacement/Upgrade, PPNO 0481H, $4.1mil (Project 72)
30 76 0 27 0 0 0 10 0 0 0 142 $4.1 35
Page 2 of 30
Projects
Rank ID Description
Wo
rker
S
afet
y
Use
r S
afet
y
Hea
lth
Ass
et
Pre
serv
atio
n
Use
r C
ost
s
Del
ay
Red
uct
ion
Sys
tem
R
elia
bil
ity
Tra
vel
Qu
alit
y
Fre
igh
t C
orr
ido
rs
Air
& W
ater
Q
ual
ity
Co
mp
lete
S
tree
ts
Min
imiz
e d
amag
e to
en
viro
nm
ent
Max
imiz
e eq
uit
y an
d a
cces
s to
m
ult
imo
dal
tr
ansp
ort
atio
n
syst
ems
Safety and HealthStewardship and
EfficiencySystem Performance
Sustainability, Livability, and Economy
Scoring Summary
Min
imiz
e i
nju
rie
s
and
fat
alit
ies
of
wo
rker
s
Min
imiz
e i
nju
rie
s
and
fat
alit
ies
of
use
rs
Max
imiz
e h
ealt
h
of
Cal
ifo
rnia
re
sid
ents
Min
imiz
e C
ost
to
T
axp
ayer
s
Pro
ject
Val
ue
Pro
ject
Co
st (
$mil
)
Pro
ject
Val
ue-
to-C
ost
Rat
io
Min
imiz
e in
con
ven
ien
ce t
o
use
rs o
f th
e h
igh
way
sys
tem
Max
imiz
e q
ual
ity
of
trav
el f
or
all
mo
des
Min
imiz
e d
isru
pti
on
of
the
eco
no
my
27 7404-SOL-80-1.1/34.5, 201.119 Bridge Preventive Maintenance, PPNO 0480N, $4.6mil (Project 74)
60 77 0 22 0 0 0 0 1 0 0 159 $4.6 35
28 10605-MON-VAR-, 201.015 Collision Severity Reduction, PPNO 2595, $4.3mil (Project 106) 60 88 0 0 0 0 0 0 0 0 0 148 $4.3 35
29 9704-ALA-880-11.3/12.3, 201.110 Bridge Rehabilitation, PPNO 0480A, $5.3mil (Project 97)
45 73 0 65 0 0 0 0 0 0 0 183 $5.3 34
30 34907-VEN-1-21.8/27.06, 201.151 Drainage System Restoration, PPNO 4855, $2.1mil (Project 349)
15 0 0 26 0 0 0 0 0 0 30 71 $2.1 34
31 26711-IMP-78-62.3/73.8, 201.151 Drainage System Restoration, PPNO 0603, $1.5mil (Project 267)
15 0 0 4 0 0 0 0 0 0 30 49 $1.5 33
32 35508-SBD-210-R21.76/R33.18, 201.170 Signs and Lighting Rehabilitation, PPNO 3005A, $3.2mil (Project 355)
60 41 0 0 0 0 0 0 7 0 0 108 $3.2 33
33 18907-LA-60-0.0/R30.5, 201.170 Signs and Lighting Rehabilitation, PPNO 4906, $4mil (Project 189)
60 44 0 0 0 0 0 0 30 0 0 134 $4.0 33
34 20708-SBD-10-26.8/27.3, 201.235 Roadside Safety Improvements, PPNO 3003A, $1.9mil (Project 207)
45 15 0 0 0 0 0 0 0 0 0 60 $1.9 32
35 10505-SB-VAR-, 201.015 Collision Severity Reduction, PPNO 2594, $4.7mil (Project 105) 60 88 0 0 0 0 0 0 0 0 0 148 $4.7 32
36 23910-MPA-140-21.2/21.8, 201.015 Collision Severity Reduction, PPNO 3131, $2.6mil (Project 239)
3 54 1 0 0 0 0 20 0 0 0 79 $2.6 31
37 34007-LA-134-6.34/8.23, 201.151 Drainage System Restoration, PPNO 4848, $2.8mil (Project 340)
23 0 0 32 0 0 0 0 0 0 30 85 $2.8 31
38 21008-RIV-10-9.5/14.1, 201.235 Roadside Safety Improvements, PPNO 3003G, $1.9mil (Project 210)
45 13 0 0 0 0 0 0 0 0 0 58 $1.9 30
39 34507-LA-5-70.4/70.4, 201.151 Drainage System Restoration, PPNO 4847, $2.1mil (Project 345)
8 0 0 24 0 0 0 0 0 0 30 61 $2.1 29
Page 3 of 30

Projects
Rank ID Description
Wo
rker
S
afet
y
Use
r S
afet
y
Hea
lth
Ass
et
Pre
serv
atio
n
Use
r C
ost
s
Del
ay
Red
uct
ion
Sys
tem
R
elia
bil
ity
Tra
vel
Qu
alit
y
Fre
igh
t C
orr
ido
rs
Air
& W
ater
Q
ual
ity
Co
mp
lete
S
tree
ts
Min
imiz
e d
amag
e to
en
viro
nm
ent
Max
imiz
e eq
uit
y an
d a
cces
s to
m
ult
imo
dal
tr
ansp
ort
atio
n
syst
ems
Safety and HealthStewardship and
EfficiencySystem Performance
Sustainability, Livability, and Economy
Scoring Summary
Min
imiz
e i
nju
rie
s
and
fat
alit
ies
of
wo
rker
s
Min
imiz
e i
nju
rie
s
and
fat
alit
ies
of
use
rs
Max
imiz
e h
ealt
h
of
Cal
ifo
rnia
re
sid
ents
Min
imiz
e C
ost
to
T
axp
ayer
s
Pro
ject
Val
ue
Pro
ject
Co
st (
$mil
)
Pro
ject
Val
ue-
to-C
ost
Rat
io
Min
imiz
e in
con
ven
ien
ce t
o
use
rs o
f th
e h
igh
way
sys
tem
Max
imiz
e q
ual
ity
of
trav
el f
or
all
mo
des
Min
imiz
e d
isru
pti
on
of
the
eco
no
my
40 12806-KER-99-21.6/24.7, 201.210 Roadside Rehabilitation, PPNO 6735, $1.6mil (Project 128)
45 0 0 0 0 0 0 0 0 0 0 45 $1.6 28
41 2202-TEH--VAR, 201.119 Bridge Preventive Maintenance, PPNO 3549, $3.7mil (Project 22)
15 71 0 19 0 0 0 0 0 0 0 104 $3.7 28
42 6904-ALA-13-VAR, 201.015 Collision Severity Reduction, PPNO 1487Q, $6.7mil (Project 69) 60 89 15 0 0 0 0 20 0 0 0 184 $6.7 28
43 301-MEN-20-33.3/34.4, 201.110 Bridge Rehabilitation, PPNO 4587, $5.7mil (Project 3)
30 60 3 24 0 0 0 40 0 0 0 157 $5.7 27
44 3903-SIE-49-0.0/15.9, 201.015 Collision Severity Reduction, PPNO 7778, $2.8mil (Project 39) 30 44 0 0 0 0 0 0 0 0 0 74 $2.8 27
45 3803-SAC-50-L0.3/L2.4, 201.015 Collision Severity Reduction, PPNO 6241, $4.4mil (Project 38)
45 72 0 0 0 0 0 0 0 0 0 117 $4.4 27
46 38312-ORA-5-23.2/30.3, 201.315 Transportation Management Systems, PPNO 2753B, $4.9mil (Project 383)
0 23 0 20 0 35 35 0 16 0 0 129 $4.9 27
47 21108-RIV-10-R12.4/13.1, 201.235 Roadside Safety Improvements, PPNO 3003H, $2.2mil (Project 211)
45 12 0 0 0 0 0 0 0 0 0 57 $2.2 27
48 7304-SCL-280-R2.9/17.8, 201.113 Bridge Seismic Restoration, PPNO 1483K, $5.3mil (Project 73)
0 68 0 40 0 0 0 0 0 0 30 139 $5.3 26
49 28412-ORA-405-7.3/11.8, 201.235 Roadside Safety Improvements, PPNO 4999D, $2.9mil (Project 284)
60 15 0 0 0 0 0 0 0 0 0 75 $2.9 26
50 1101-MEN-1-42.3/42.5, 201.150 Roadway Protective Betterment, PPNO 4616, $2.5mil (Project 11)
2 23 0 0 0 0 0 40 0 0 0 65 $2.5 26
51 20508-SBD-10-3.2/3.9, 201.235 Roadside Safety Improvements, PPNO 3002X, $2.5mil (Project 205)
45 17 0 0 0 0 0 0 0 0 0 62 $2.5 25
52 6804-ALA-185-VAR, 201.015 Collision Severity Reduction, PPNO 1487P, $3.4mil (Project 68) 30 44 1 0 0 0 0 10 0 0 0 85 $3.4 25
Page 4 of 30

Projects
Rank ID Description
Wo
rker
S
afet
y
Use
r S
afet
y
Hea
lth
Ass
et
Pre
serv
atio
n
Use
r C
ost
s
Del
ay
Red
uct
ion
Sys
tem
R
elia
bil
ity
Tra
vel
Qu
alit
y
Fre
igh
t C
orr
ido
rs
Air
& W
ater
Q
ual
ity
Co
mp
lete
S
tree
ts
Min
imiz
e d
amag
e to
en
viro
nm
ent
Max
imiz
e eq
uit
y an
d a
cces
s to
m
ult
imo
dal
tr
ansp
ort
atio
n
syst
ems
Safety and HealthStewardship and
EfficiencySystem Performance
Sustainability, Livability, and Economy
Scoring Summary
Min
imiz
e i
nju
rie
s
and
fat
alit
ies
of
wo
rker
s
Min
imiz
e i
nju
rie
s
and
fat
alit
ies
of
use
rs
Max
imiz
e h
ealt
h
of
Cal
ifo
rnia
re
sid
ents
Min
imiz
e C
ost
to
T
axp
ayer
s
Pro
ject
Val
ue
Pro
ject
Co
st (
$mil
)
Pro
ject
Val
ue-
to-C
ost
Rat
io
Min
imiz
e in
con
ven
ien
ce t
o
use
rs o
f th
e h
igh
way
sys
tem
Max
imiz
e q
ual
ity
of
trav
el f
or
all
mo
des
Min
imiz
e d
isru
pti
on
of
the
eco
no
my
53 28512-ORA-55-13.2/R17.8, 201.235 Roadside Safety Improvements, PPNO 3535, $3.1mil (Project 285)
45 17 5 0 0 0 0 10 0 0 0 76 $3.1 25
54 5803-PLA-80-0.3/R63.5, 201.110 Bridge Rehabilitation, PPNO 5097, $9.8mil (Project 58)
60 62 35 40 0 0 0 40 3 0 0 239 $9.8 25
55 19208-RIV-74-13.2/34.0, 201.112 Bridge Rail Replacement/Upgrade, PPNO 3002C, $4.8mil (Project 192)
60 34 0 23 0 0 0 0 0 0 0 118 $4.8 24
56 20808-SBD-10-31.7/32.9, 201.235 Roadside Safety Improvements, PPNO 3003E, $2.5mil (Project 208)
45 16 0 0 0 0 0 0 0 0 0 61 $2.5 24
57 28212-ORA-55-12.0/13.4, 201.235 Roadside Safety Improvements, PPNO 3573, $2.9mil (Project 282)
45 14 1 0 0 0 0 10 0 0 0 70 $2.9 24
58 35708-SBD-15-VAR, 201.170 Signs and Lighting Rehabilitation, PPNO 0178P, $5.2mil (Project 357)
60 35 0 0 0 0 0 0 30 0 0 125 $5.2 24
59 35108-RIV-10-0/R156.4, 201.170 Signs and Lighting Rehabilitation, PPNO 3005C, $5.1mil (Project 351)
60 31 0 0 0 0 0 0 30 0 0 121 $5.1 24
60 14207-LA-134-R13.1, 201.113 Bridge Seismic Restoration, PPNO 4591, $6.6mil (Project 142)
0 84 0 43 0 0 0 0 0 0 30 157 $6.6 24
61 34207-LA-213-2.7/3.9, 201.151 Drainage System Restoration, PPNO 3734, $2.8mil (Project 342)
15 0 0 20 0 0 0 0 0 0 30 65 $2.8 23
62 20908-SBD-10-30.0/30.9, 201.235 Roadside Safety Improvements, PPNO 3003F, $2.5mil (Project 209)
45 13 0 0 0 0 0 0 0 0 0 58 $2.5 23
63 38412-ORA-55-8/9.2, 201.310 Operational Improvements, PPNO 3483, $7.2mil (Project 384)
0 58 0 20 0 50 35 0 3 0 0 165 $7.2 23
64 4203-SAC-51-VAR, 201.113 Bridge Seismic Restoration, PPNO 6707, $6.7mil (Project 42) 0 87 0 35 0 0 0 0 0 0 30 153 $6.7 23
65 16407-LA-10-18.3/21.1, 201.235 Roadside Safety Improvements, PPNO 4716, $3.5mil (Project 164)
60 18 0 0 0 0 0 0 0 0 0 78 $3.5 22
Page 5 of 30

Projects
Rank ID Description
Wo
rker
S
afet
y
Use
r S
afet
y
Hea
lth
Ass
et
Pre
serv
atio
n
Use
r C
ost
s
Del
ay
Red
uct
ion
Sys
tem
R
elia
bil
ity
Tra
vel
Qu
alit
y
Fre
igh
t C
orr
ido
rs
Air
& W
ater
Q
ual
ity
Co
mp
lete
S
tree
ts
Min
imiz
e d
amag
e to
en
viro
nm
ent
Max
imiz
e eq
uit
y an
d a
cces
s to
m
ult
imo
dal
tr
ansp
ort
atio
n
syst
ems
Safety and HealthStewardship and
EfficiencySystem Performance
Sustainability, Livability, and Economy
Scoring Summary
Min
imiz
e i
nju
rie
s
and
fat
alit
ies
of
wo
rker
s
Min
imiz
e i
nju
rie
s
and
fat
alit
ies
of
use
rs
Max
imiz
e h
ealt
h
of
Cal
ifo
rnia
re
sid
ents
Min
imiz
e C
ost
to
T
axp
ayer
s
Pro
ject
Val
ue
Pro
ject
Co
st (
$mil
)
Pro
ject
Val
ue-
to-C
ost
Rat
io
Min
imiz
e in
con
ven
ien
ce t
o
use
rs o
f th
e h
igh
way
sys
tem
Max
imiz
e q
ual
ity
of
trav
el f
or
all
mo
des
Min
imiz
e d
isru
pti
on
of
the
eco
no
my
66 27912-ORA-91-R9.8/R18.9, 201.121 Roadway Preservation (CAPM), PPNO 5364, $9.2mil (Project 279)
30 39 18 29 45 0 0 10 4 30 0 205 $9.2 22
67 15707-LA-110-11.0, 201.151 Drainage System Restoration, PPNO 4849, $3.4mil (Project 157)
15 0 0 31 0 0 0 0 0 0 30 76 $3.4 22
68 901-HUM-101-78.0/79.8, 201.121 Roadway Preservation (CAPM), PPNO 2380, $4.3mil (Project 9)
15 37 3 15 3 0 0 20 0 2 0 94 $4.3 22
69 4103-BUT-99-13.3/45.9, 201.112 Bridge Rail Replacement/Upgrade, PPNO 2433, $8mil (Project 41)
45 80 15 14 0 0 0 20 0 0 0 174 $8.0 22
70 14407-LA-210-R38.6/R38.9, 201.113 Bridge Seismic Restoration, PPNO 4788, $7.2mil (Project 144)
0 79 0 44 0 0 0 0 0 0 30 153 $7.2 21
71 23208-SBD-60-R8.9/R10.0, 201.310 Operational Improvements, PPNO 3003N, $8.4mil (Project 232)
0 59 3 20 0 50 35 10 3 0 0 179 $8.4 21
72 27211-SD-VAR-, 201.315 Transportation Management Systems, PPNO 1171, $5.9mil (Project 272)
0 22 0 26 0 35 10 0 30 0 0 124 $5.9 21
73 28312-ORA-5-31.0/33.3, 201.235 Roadside Safety Improvements, PPNO 2841, $2.9mil (Project 283)
45 16 0 0 0 0 0 0 0 0 0 61 $2.9 21
74 20608-SBD-10-5.9/6.4, 201.235 Roadside Safety Improvements, PPNO 3002Y, $2.2mil (Project 206)
30 15 0 0 0 0 0 0 0 0 0 45 $2.2 21
75 31603-YOL-16-25.2/28.3, 201.015 Collision Severity Reduction, PPNO 8663, $3.3mil (Project 316)
15 54 0 0 0 0 0 0 0 0 0 69 $3.3 21
76 10305-SLO-101-36.6/55.7, 201.015 Collision Severity Reduction, PPNO 2518, $5.1mil (Project 103)
45 59 0 0 0 0 0 0 0 0 0 104 $5.1 20
77 36910-SJ-4-3.5/48.97, 201.151 Drainage System Restoration, PPNO 3140, $5.6mil (Project 369)
30 0 0 55 0 0 0 0 0 0 30 115 $5.6 20
78 16007-LA-210-R25.0/R32.8, 201.235 Roadside Safety Improvements, PPNO 4708, $3.8mil (Project 160)
60 17 0 0 0 0 0 0 0 0 0 77 $3.8 20
Page 6 of 30

Projects
Rank ID Description
Wo
rker
S
afet
y
Use
r S
afet
y
Hea
lth
Ass
et
Pre
serv
atio
n
Use
r C
ost
s
Del
ay
Red
uct
ion
Sys
tem
R
elia
bil
ity
Tra
vel
Qu
alit
y
Fre
igh
t C
orr
ido
rs
Air
& W
ater
Q
ual
ity
Co
mp
lete
S
tree
ts
Min
imiz
e d
amag
e to
en
viro
nm
ent
Max
imiz
e eq
uit
y an
d a
cces
s to
m
ult
imo
dal
tr
ansp
ort
atio
n
syst
ems
Safety and HealthStewardship and
EfficiencySystem Performance
Sustainability, Livability, and Economy
Scoring Summary
Min
imiz
e i
nju
rie
s
and
fat
alit
ies
of
wo
rker
s
Min
imiz
e i
nju
rie
s
and
fat
alit
ies
of
use
rs
Max
imiz
e h
ealt
h
of
Cal
ifo
rnia
re
sid
ents
Min
imiz
e C
ost
to
T
axp
ayer
s
Pro
ject
Val
ue
Pro
ject
Co
st (
$mil
)
Pro
ject
Val
ue-
to-C
ost
Rat
io
Min
imiz
e in
con
ven
ien
ce t
o
use
rs o
f th
e h
igh
way
sys
tem
Max
imiz
e q
ual
ity
of
trav
el f
or
all
mo
des
Min
imiz
e d
isru
pti
on
of
the
eco
no
my
79 23709-MNO-395-60.0/69.9, 201.015 Collision Severity Reduction, PPNO 0658, $3.6mil (Project 237)
30 42 0 0 0 0 0 0 0 0 0 72 $3.6 20
80 14107-VEN-1-28.2, 201.112 Bridge Rail Replacement/Upgrade, PPNO 4601, $6.2mil (Project 141)
15 86 0 24 0 0 0 0 0 0 0 125 $6.2 20
81 9504-SCL-85-18.0/24.1, 201.361 ADA Access Improvements, PPNO 0434G, $3.6mil (Project 95)
0 16 15 0 0 0 0 40 0 0 0 71 $3.6 20
82 14007-LA-110-18.8/23.8, 201.015 Collision Severity Reduction, PPNO 4785, $6.3mil (Project 140)
45 80 0 0 0 0 0 0 0 0 0 125 $6.3 20
83 35608-SBD-10-27.3/28.3, 201.235 Roadside Safety Improvements, PPNO 3003C, $3.1mil (Project 356)
45 15 0 0 0 0 0 0 0 0 0 60 $3.1 19
84 27311-SD-VAR-, 201.315 Transportation Management Systems, PPNO 1174, $6.4mil (Project 273)
0 23 0 26 0 35 10 0 30 0 0 125 $6.4 19
85 20408-SBD-10-34.2/R39.1, 201.235 Roadside Safety Improvements, PPNO 3001U, $3.1mil (Project 204)
45 14 0 0 0 0 0 0 0 0 0 59 $3.1 19
86 22208-SBD-215-2.4/3.0, 201.110 Bridge Rehabilitation, PPNO 3002S, $8mil (Project 222)
30 79 2 20 0 0 0 20 1 0 0 152 $8.0 19
87 16607-LA-210-R24.6/R25.3, 201.235 Roadside Safety Improvements, PPNO 4810, $4.1mil (Project 166)
60 17 0 0 0 0 0 0 0 0 0 77 $4.1 19
88 26111-SD-52-0.0/14.8, 201.015 Collision Severity Reduction, PPNO 1135, $6.9mil (Project 261) 60 71 0 0 0 0 0 0 0 0 0 131 $6.9 19
89 23609-INY-395-77.4/91.6, 201.121 Roadway Preservation (CAPM), PPNO 0656, $4.8mil (Project 236)
15 27 15 13 0 0 0 20 0 0 0 90 $4.8 19
90 37010-SJ-5-16.059/35.679, 201.235 Roadside Safety Improvements, PPNO 3112, $3.9mil (Project 370)
60 14 0 0 0 0 0 0 0 0 0 74 $3.9 19
91 10405-SLO-101-VAR, 201.015 Collision Severity Reduction, PPNO 2508, $6.5mil (Project 104) 30 92 0 0 0 0 0 0 0 0 0 122 $6.5 19
Page 7 of 30

Projects
Rank ID Description
Wo
rker
S
afet
y
Use
r S
afet
y
Hea
lth
Ass
et
Pre
serv
atio
n
Use
r C
ost
s
Del
ay
Red
uct
ion
Sys
tem
R
elia
bil
ity
Tra
vel
Qu
alit
y
Fre
igh
t C
orr
ido
rs
Air
& W
ater
Q
ual
ity
Co
mp
lete
S
tree
ts
Min
imiz
e d
amag
e to
en
viro
nm
ent
Max
imiz
e eq
uit
y an
d a
cces
s to
m
ult
imo
dal
tr
ansp
ort
atio
n
syst
ems
Safety and HealthStewardship and
EfficiencySystem Performance
Sustainability, Livability, and Economy
Scoring Summary
Min
imiz
e i
nju
rie
s
and
fat
alit
ies
of
wo
rker
s
Min
imiz
e i
nju
rie
s
and
fat
alit
ies
of
use
rs
Max
imiz
e h
ealt
h
of
Cal
ifo
rnia
re
sid
ents
Min
imiz
e C
ost
to
T
axp
ayer
s
Pro
ject
Val
ue
Pro
ject
Co
st (
$mil
)
Pro
ject
Val
ue-
to-C
ost
Rat
io
Min
imiz
e in
con
ven
ien
ce t
o
use
rs o
f th
e h
igh
way
sys
tem
Max
imiz
e q
ual
ity
of
trav
el f
or
all
mo
des
Min
imiz
e d
isru
pti
on
of
the
eco
no
my
92 4803-YOL-5-0.4/R28.9, 201.235 Roadside Safety Improvements, PPNO 8572, $3mil (Project 48)
45 11 0 0 0 0 0 0 0 0 0 56 $3.0 18
93 25810-SJ-5-VAR, 201.170 Signs and Lighting Rehabilitation, PPNO 3129, $3.4mil (Project 258)
30 32 0 0 0 0 0 0 0 0 0 62 $3.4 18
94 4403-PLA-80-31.5/36.9, 201.151 Drainage System Restoration, PPNO 5079, $4.7mil (Project 44)
15 0 0 41 0 0 0 0 0 0 30 86 $4.7 18
95 16207-LA-91-R14.4/R16.6, 201.235 Roadside Safety Improvements, PPNO 4714, $3.2mil (Project 162)
45 14 0 0 0 0 0 0 0 0 0 59 $3.2 18
96 22708-SBD-10-2.9/3.8, 201.210 Roadside Rehabilitation, PPNO 3002M, $2.5mil (Project 227)
45 0 0 0 0 0 0 0 0 0 0 45 $2.5 18
97 22908-SBD-10-R21.6/R23.6, 201.210 Roadside Rehabilitation, PPNO 3002P, $2.5mil (Project 229)
45 0 0 0 0 0 0 0 0 0 0 45 $2.5 18
98 16107-LA-605-R17.0/R19.5, 201.235 Roadside Safety Improvements, PPNO 4713, $3.3mil (Project 161)
45 15 0 0 0 0 0 0 0 0 0 60 $3.3 18
99 31003-NEV-49-7.5/15, 201.151 Drainage System Restoration, PPNO 4123, $5mil (Project 310) 23 0 0 36 0 0 0 0 0 0 30 89 $5.0 18
100 36710-SJ-205-2.3/R9.7, 201.235 Roadside Safety Improvements, PPNO 3111, $4.1mil (Project 367)
60 12 0 0 0 0 0 0 0 0 0 72 $4.1 18
101 4503-PLA-80-25.9/28.5, 201.151 Drainage System Restoration, PPNO 5105, $4.5mil (Project 45)
15 0 0 36 0 0 0 0 0 0 30 81 $4.5 18
102 20308-SBD-10-R21.6/R23.6, 201.235 Roadside Safety Improvements, PPNO 3001T, $3.4mil (Project 203)
45 15 0 0 0 0 0 0 0 0 0 60 $3.4 18
103 9804-ALA-580-R8.0, 201.110 Bridge Rehabilitation, PPNO 0480J, $8.7mil (Project 98)
30 60 0 65 0 0 0 0 0 0 0 155 $8.7 18
104 11105-SB-154-R2.6, 201.119 Bridge Preventive Maintenance, PPNO 2391, $3.6mil (Project 111)
3 50 0 9 0 0 0 0 0 0 0 62 $3.6 18
Page 8 of 30

Projects
Rank ID Description
Wo
rker
S
afet
y
Use
r S
afet
y
Hea
lth
Ass
et
Pre
serv
atio
n
Use
r C
ost
s
Del
ay
Red
uct
ion
Sys
tem
R
elia
bil
ity
Tra
vel
Qu
alit
y
Fre
igh
t C
orr
ido
rs
Air
& W
ater
Q
ual
ity
Co
mp
lete
S
tree
ts
Min
imiz
e d
amag
e to
en
viro
nm
ent
Max
imiz
e eq
uit
y an
d a
cces
s to
m
ult
imo
dal
tr
ansp
ort
atio
n
syst
ems
Safety and HealthStewardship and
EfficiencySystem Performance
Sustainability, Livability, and Economy
Scoring Summary
Min
imiz
e i
nju
rie
s
and
fat
alit
ies
of
wo
rker
s
Min
imiz
e i
nju
rie
s
and
fat
alit
ies
of
use
rs
Max
imiz
e h
ealt
h
of
Cal
ifo
rnia
re
sid
ents
Min
imiz
e C
ost
to
T
axp
ayer
s
Pro
ject
Val
ue
Pro
ject
Co
st (
$mil
)
Pro
ject
Val
ue-
to-C
ost
Rat
io
Min
imiz
e in
con
ven
ien
ce t
o
use
rs o
f th
e h
igh
way
sys
tem
Max
imiz
e q
ual
ity
of
trav
el f
or
all
mo
des
Min
imiz
e d
isru
pti
on
of
the
eco
no
my
105 8304-SON-12-9.5/31.3, 201.235 Roadside Safety Improvements, PPNO 0480E, $3.7mil (Project 83)
45 19 0 0 0 0 0 0 0 0 0 64 $3.7 18
106 15807-LA-57-R7.7/R 11.8, 201.235 Roadside Safety Improvements, PPNO 4706, $3.6mil (Project 158)
45 16 0 0 0 0 0 0 0 0 0 61 $3.6 17
107 11005-SB-135-R7.2, 201.113 Bridge Seismic Restoration, PPNO 2567, $4.7mil (Project 110)
0 43 0 7 0 0 0 0 0 0 30 80 $4.7 17
108 33106-FRE-99-0/14.93, 201.235 Roadside Safety Improvements, PPNO 6738, $4.3mil (Project 331)
60 12 0 0 0 0 0 0 0 0 0 72 $4.3 17
109 8804-ALA-80-1.9/4.0, 201.315 Transportation Management Systems, PPNO 1483H, $8mil (Project 88)
0 26 0 21 0 50 35 0 2 0 0 135 $8.0 17
110 8604-CC-80-0.0/14.1, 201.235 Roadside Safety Improvements, PPNO 1483P, $4.4mil (Project 86)
60 14 0 0 0 0 0 0 0 0 0 74 $4.4 17
111 21208-RIV-10-R3.2/R5.3, 201.315 Transportation Management Systems, PPNO 3002T, $4.7mil (Project 212)
0 19 6 19 0 10 10 10 4 0 0 78 $4.7 17
112 16507-LA-14-R24.8/R31.4, 201.235 Roadside Safety Improvements, PPNO 4809, $3.7mil (Project 165)
45 15 0 0 0 0 0 0 0 0 0 60 $3.7 16
113 9604-ALA-13-10.8/12.1, 201.378 ADA Pedestrian Infrastructure, PPNO 0124M, $3.2mil (Project 96)
0 30 2 0 0 0 0 20 0 0 0 52 $3.2 16
114 31103-PLA-80-2.81/2.81, 201.310 Operational Improvements, PPNO 5113, $8.5mil (Project 311)
0 46 0 18 0 40 35 0 0 0 0 139 $8.5 16
115 26611-SD-VAR-, 201.151 Drainage System Restoration, PPNO 1134, $5.8mil (Project 266)
15 0 15 14 0 0 0 20 0 0 30 94 $5.8 16
116 27711-SD-5-R25.9/R26.8, 201.310 Operational Improvements, PPNO 1137, $9.7mil (Project 277)
0 52 0 18 0 50 35 0 1 0 0 156 $9.7 16
117 34307-LA-5-11/14, 201.151 Drainage System Restoration, PPNO 4910, $5.2mil (Project 343)
23 0 0 30 0 0 0 0 0 0 30 83 $5.2 16
Page 9 of 30

Projects
Rank ID Description
Wo
rker
S
afet
y
Use
r S
afet
y
Hea
lth
Ass
et
Pre
serv
atio
n
Use
r C
ost
s
Del
ay
Red
uct
ion
Sys
tem
R
elia
bil
ity
Tra
vel
Qu
alit
y
Fre
igh
t C
orr
ido
rs
Air
& W
ater
Q
ual
ity
Co
mp
lete
S
tree
ts
Min
imiz
e d
amag
e to
en
viro
nm
ent
Max
imiz
e eq
uit
y an
d a
cces
s to
m
ult
imo
dal
tr
ansp
ort
atio
n
syst
ems
Safety and HealthStewardship and
EfficiencySystem Performance
Sustainability, Livability, and Economy
Scoring Summary
Min
imiz
e i
nju
rie
s
and
fat
alit
ies
of
wo
rker
s
Min
imiz
e i
nju
rie
s
and
fat
alit
ies
of
use
rs
Max
imiz
e h
ealt
h
of
Cal
ifo
rnia
re
sid
ents
Min
imiz
e C
ost
to
T
axp
ayer
s
Pro
ject
Val
ue
Pro
ject
Co
st (
$mil
)
Pro
ject
Val
ue-
to-C
ost
Rat
io
Min
imiz
e in
con
ven
ien
ce t
o
use
rs o
f th
e h
igh
way
sys
tem
Max
imiz
e q
ual
ity
of
trav
el f
or
all
mo
des
Min
imiz
e d
isru
pti
on
of
the
eco
no
my
118 7504-NAP-29-32.1/42.8, 201.119 Bridge Preventive Maintenance, PPNO 1482P, $6mil (Project 75)
30 57 0 8 0 0 0 0 1 0 0 96 $6.0 16
119 33907-LA-118-R9.0/R10.1, 201.235 Roadside Safety Improvements, PPNO 4808, $3.8mil (Project 339)
45 15 0 0 0 0 0 0 0 0 0 60 $3.8 16
120 37410-STA-99-1.1/7.3, 201.235 Roadside Safety Improvements, PPNO 3143, $3.6mil (Project 374)
45 12 0 0 0 0 0 0 0 0 0 57 $3.6 16
121 18607-LA-101-20.0, 201.110 Bridge Rehabilitation, PPNO 4915, $9.2mil (Project 186)
30 82 0 23 0 0 0 10 0 0 0 145 $9.2 16
122 16307-LA-10-R2.1/R11.1, 201.235 Roadside Safety Improvements, PPNO 4715, $4mil (Project 163)
45 17 0 0 0 0 0 0 0 0 0 62 $4.0 15
123 8704-SF-1-R0.7/5.9, 201.315 Transportation Management Systems, PPNO 0481V, $6.6mil (Project 87)
0 24 8 19 0 15 15 20 0 0 0 101 $6.6 15
124 14607-LA-1-9.9, 201.119 Bridge Preventive Maintenance, PPNO 4729, $6mil (Project 146) 15 59 0 16 0 0 0 0 0 0 0 90 $6.0 15
125 22308-RIV-74-11.0, 201.150 Roadway Protective Betterment, PPNO 3002J, $1.9mil (Project 223)
2 27 0 0 0 0 0 0 0 0 0 28 $1.9 15
126 24810-MER-152-VAR, 201.151 Drainage System Restoration, PPNO 3139, $4.2mil (Project 248)
8 0 0 25 0 0 0 0 0 0 30 62 $4.2 15
127 25310-SJ-99-0.9, 201.361 ADA Access Improvements, PPNO 3150, $2.2mil (Project 253)
0 13 0 0 0 0 0 20 0 0 0 33 $2.2 15
128 10805-SCR-1-VAR, 201.112 Bridge Rail Replacement/Upgrade, PPNO 2585, $6.2mil (Project 108)
15 61 0 15 0 0 0 0 0 0 0 91 $6.2 15
129 4303-SAC-80-M1.2/R11.3, 201.121 Roadway Preservation (CAPM), PPNO 6711, $14.3mil (Project 43)
30 42 19 22 40 0 0 10 22 24 0 209 $14.3 15
130 6604-ALA-84-VAR, 201.015 Collision Severity Reduction, PPNO 0448R, $4.5mil (Project 66) 15 41 0 0 0 0 0 10 0 0 0 66 $4.5 14
Page 10 of 30

Projects
Rank ID Description
Wo
rker
S
afet
y
Use
r S
afet
y
Hea
lth
Ass
et
Pre
serv
atio
n
Use
r C
ost
s
Del
ay
Red
uct
ion
Sys
tem
R
elia
bil
ity
Tra
vel
Qu
alit
y
Fre
igh
t C
orr
ido
rs
Air
& W
ater
Q
ual
ity
Co
mp
lete
S
tree
ts
Min
imiz
e d
amag
e to
en
viro
nm
ent
Max
imiz
e eq
uit
y an
d a
cces
s to
m
ult
imo
dal
tr
ansp
ort
atio
n
syst
ems
Safety and HealthStewardship and
EfficiencySystem Performance
Sustainability, Livability, and Economy
Scoring Summary
Min
imiz
e i
nju
rie
s
and
fat
alit
ies
of
wo
rker
s
Min
imiz
e i
nju
rie
s
and
fat
alit
ies
of
use
rs
Max
imiz
e h
ealt
h
of
Cal
ifo
rnia
re
sid
ents
Min
imiz
e C
ost
to
T
axp
ayer
s
Pro
ject
Val
ue
Pro
ject
Co
st (
$mil
)
Pro
ject
Val
ue-
to-C
ost
Rat
io
Min
imiz
e in
con
ven
ien
ce t
o
use
rs o
f th
e h
igh
way
sys
tem
Max
imiz
e q
ual
ity
of
trav
el f
or
all
mo
des
Min
imiz
e d
isru
pti
on
of
the
eco
no
my
131 16707-LA-14-R54.6/R66.2, 201.235 Roadside Safety Improvements, PPNO 4811, $3.9mil (Project 167)
45 11 0 0 0 0 0 0 0 0 0 56 $3.9 14
132 5703-NEV-174-9.7/10.1, 201.361 ADA Access Improvements, PPNO 4450, $2.8mil (Project 57)
0 19 1 0 0 0 0 20 0 0 0 40 $2.8 14
133 32104-ALA-92-6.78/8.15, 201.378 ADA Pedestrian Infrastructure, PPNO '0092R, $1.9mil (Project 321)
0 27 0 0 0 0 0 0 0 0 0 27 $1.9 14
134 3102-SHA-5-0.0/67.0, 201.235 Roadside Safety Improvements, PPNO 3551, $3.2mil (Project 31)
15 11 10 0 0 0 0 10 0 0 0 46 $3.2 14
135 9904-CC-580-1.2, 201.110 Bridge Rehabilitation, PPNO 1482Q, $8.4mil (Project 99) 30 67 0 22 0 0 0 0 0 0 0 119 $8.4 14
136 24010-ALP-88-VAR, 201.112 Bridge Rail Replacement/Upgrade, PPNO 3134, $7.1mil (Project 240)
3 48 0 9 0 0 0 40 0 0 0 100 $7.1 14
137 24710-AMA-88-VAR, 201.151 Drainage System Restoration, PPNO 3119, $3.7mil (Project 247)
2 0 0 20 0 0 0 0 0 0 30 51 $3.7 14
138 37510-TUO-49-VAR, 201.151 Drainage System Restoration, PPNO 3151, $3.7mil (Project 375)
2 0 0 19 0 0 0 0 0 0 30 51 $3.7 14
139 2902-PLU-70-0.0/70.0, 201.151 Drainage System Restoration, PPNO 3587, $6.6mil (Project 29)
15 0 10 25 0 0 0 10 0 0 30 90 $6.6 14
140 2602-TRI-299-23.1/23.3, 201.150 Roadway Protective Betterment, PPNO 3591, $2mil (Project 26)
2 25 0 0 0 0 0 0 0 0 0 27 $2.0 14
141 24410-MER-5-VAR, 201.119 Bridge Preventive Maintenance, PPNO 3102, $6.9mil (Project 244)
15 62 0 16 0 0 0 0 0 0 0 93 $6.9 13
142 16907-LA-605-R 0.0/26.0, 201.315 Transportation Management Systems, PPNO 4819, $13.6mil (Project 169)
0 26 0 43 0 50 35 0 30 0 0 183 $13.6 13
143 201-HUM-101-88.2/88.3, 201.015 Collision Severity Reduction, PPNO 2397, $6.2mil (Project 2)
15 58 0 0 0 0 0 10 0 0 0 83 $6.2 13
Page 11 of 30

Projects
Rank ID Description
Wo
rker
S
afet
y
Use
r S
afet
y
Hea
lth
Ass
et
Pre
serv
atio
n
Use
r C
ost
s
Del
ay
Red
uct
ion
Sys
tem
R
elia
bil
ity
Tra
vel
Qu
alit
y
Fre
igh
t C
orr
ido
rs
Air
& W
ater
Q
ual
ity
Co
mp
lete
S
tree
ts
Min
imiz
e d
amag
e to
en
viro
nm
ent
Max
imiz
e eq
uit
y an
d a
cces
s to
m
ult
imo
dal
tr
ansp
ort
atio
n
syst
ems
Safety and HealthStewardship and
EfficiencySystem Performance
Sustainability, Livability, and Economy
Scoring Summary
Min
imiz
e i
nju
rie
s
and
fat
alit
ies
of
wo
rker
s
Min
imiz
e i
nju
rie
s
and
fat
alit
ies
of
use
rs
Max
imiz
e h
ealt
h
of
Cal
ifo
rnia
re
sid
ents
Min
imiz
e C
ost
to
T
axp
ayer
s
Pro
ject
Val
ue
Pro
ject
Co
st (
$mil
)
Pro
ject
Val
ue-
to-C
ost
Rat
io
Min
imiz
e in
con
ven
ien
ce t
o
use
rs o
f th
e h
igh
way
sys
tem
Max
imiz
e q
ual
ity
of
trav
el f
or
all
mo
des
Min
imiz
e d
isru
pti
on
of
the
eco
no
my
144 23509-INY-6-4.3/8.4, 201.015 Collision Severity Reduction, PPNO 0660, $6.2mil (Project 235) 15 42 6 0 0 0 0 20 0 0 0 83 $6.2 13
145 34707-VEN-118-R24.1/R29.7, 201.235 Roadside Safety Improvements, PPNO 4894, $4.3mil (Project 347)
45 12 0 0 0 0 0 0 0 0 0 57 $4.3 13
146 2402-TEH-36-40.3/42.1, 201.121 Roadway Preservation (CAPM), PPNO 3558, $8.9mil (Project 24)
15 46 7 15 2 0 0 30 3 1 0 118 $8.9 13
147 25110-SJ-5-VAR, 201.315 Transportation Management Systems, PPNO 3147, $5.5mil (Project 251)
0 28 0 20 0 15 10 0 0 0 0 74 $5.5 13
148 701-HUM-101-79.5/80.2, 201.113 Bridge Seismic Restoration, PPNO 2417, $11.1mil (Project 7)
0 77 0 40 0 0 0 0 0 0 30 147 $11.1 13
149 37310-STA-99-13.4/13.8, 201.310 Operational Improvements, PPNO '0037, $8.7mil (Project 373)
0 44 0 16 0 40 15 0 1 0 0 115 $8.7 13
150 13506-FRE-180-92.2, 201.112 Bridge Rail Replacement/Upgrade, PPNO 6766, $5.4mil (Project 135)
3 55 0 13 0 0 0 0 0 0 0 71 $5.4 13
151 15607-LA-1-37.67/62.8, 201.151 Drainage System Restoration, PPNO 4846, $6.6mil (Project 156)
23 0 0 34 0 0 0 0 0 0 30 86 $6.6 13
152 14707-LA-5-34.6, 201.119 Bridge Preventive Maintenance, PPNO 4853, $10.9mil (Project 147)
30 71 0 43 0 0 0 0 0 0 0 143 $10.9 13
153 7604-SCL-9-4.9, 201.119 Bridge Preventive Maintenance, PPNO 1482R, $4.7mil (Project 76)
3 51 0 7 0 0 0 0 0 0 0 61 $4.7 13
154 25710-STA-108-33.2, 201.150 Roadway Protective Betterment, PPNO 5411, $3.6mil (Project 257)
2 36 0 0 0 0 0 10 0 0 0 47 $3.6 13
155 21408-SBD-215-14.8, 201.321 Weigh Stations & WIM Facilities, PPNO 3002K, $2.3mil (Project 214)
0 30 0 0 0 0 0 0 0 0 0 30 $2.3 13
156 37912-ORA-133-3.42/13.664, 201.015 Collision Severity Reduction, PPNO 4795A, $11.6mil (Project 379)
60 89 0 0 0 0 0 0 0 0 0 149 $11.6 13
Page 12 of 30

Projects
Rank ID Description
Wo
rker
S
afet
y
Use
r S
afet
y
Hea
lth
Ass
et
Pre
serv
atio
n
Use
r C
ost
s
Del
ay
Red
uct
ion
Sys
tem
R
elia
bil
ity
Tra
vel
Qu
alit
y
Fre
igh
t C
orr
ido
rs
Air
& W
ater
Q
ual
ity
Co
mp
lete
S
tree
ts
Min
imiz
e d
amag
e to
en
viro
nm
ent
Max
imiz
e eq
uit
y an
d a
cces
s to
m
ult
imo
dal
tr
ansp
ort
atio
n
syst
ems
Safety and HealthStewardship and
EfficiencySystem Performance
Sustainability, Livability, and Economy
Scoring Summary
Min
imiz
e i
nju
rie
s
and
fat
alit
ies
of
wo
rker
s
Min
imiz
e i
nju
rie
s
and
fat
alit
ies
of
use
rs
Max
imiz
e h
ealt
h
of
Cal
ifo
rnia
re
sid
ents
Min
imiz
e C
ost
to
T
axp
ayer
s
Pro
ject
Val
ue
Pro
ject
Co
st (
$mil
)
Pro
ject
Val
ue-
to-C
ost
Rat
io
Min
imiz
e in
con
ven
ien
ce t
o
use
rs o
f th
e h
igh
way
sys
tem
Max
imiz
e q
ual
ity
of
trav
el f
or
all
mo
des
Min
imiz
e d
isru
pti
on
of
the
eco
no
my
157 3302-SIS-5-VAR, 201.315 Transportation Management Systems, PPNO 3556, $4.2mil (Project 33)
0 17 0 11 0 10 15 0 0 0 0 53 $4.2 13
158 14807-LA-101-11.8/35.3, 201.121 Roadway Preservation (CAPM), PPNO 4770, $16.7mil (Project 148)
30 44 20 22 50 0 0 10 7 30 0 213 $16.7 13
159 24110-MER-152-VAR, 201.113 Bridge Seismic Restoration, PPNO 3122, $10.6mil (Project 241)
0 78 0 26 0 0 0 0 0 0 30 134 $10.6 13
160 1702-TRI-299-1.9/2.1, 201.015 Collision Severity Reduction, PPNO 3557, $6.1mil (Project 17) 3 54 0 0 0 0 0 20 0 0 0 77 $6.1 13
161 18507-LA-10S-28.3, 201.110 Bridge Rehabilitation, PPNO 4902, $4mil (Project 185)
3 41 0 7 0 0 0 0 0 0 0 51 $4.0 13
162 5603-GLE-32-L0.0/0.8, 201.361 ADA Access Improvements, PPNO 3788, $2.2mil (Project 56)
0 16 1 0 0 0 0 10 0 0 0 27 $2.2 13
163 24610-MPA-41-2.0/4.9, 201.151 Drainage System Restoration, PPNO 3158, $3.9mil (Project 246)
8 0 0 11 0 0 0 0 0 0 30 48 $3.9 13
164 38112-ORA-57-16.4/20.88, 201.378 ADA Pedestrian Infrastructure, PPNO 3799, $2.6mil (Project 381)
0 32 0 0 0 0 0 0 0 0 0 32 $2.6 12
165 26010-SJ-99-30.9/31.3, 201.310 Operational Improvements, PPNO 3145, $11.1mil (Project 260)
0 46 0 14 0 40 35 0 1 0 0 135 $11.1 12
166 22808-SBD-10-5.9/6.3, 201.210 Roadside Rehabilitation, PPNO 3002N, $2.5mil (Project 228)
30 0 0 0 0 0 0 0 0 0 0 30 $2.5 12
167 3603-NEV-80-0.0/20.0, 201.015 Collision Severity Reduction, PPNO 4288, $8.2mil (Project 36)
45 54 0 0 0 0 0 0 0 0 0 99 $8.2 12
168 11805-MON-101-73.0/96.8, 201.235 Roadside Safety Improvements, PPNO 2571, $6.3mil (Project 118)
60 14 0 0 0 0 0 0 0 0 0 74 $6.3 12
169 9404-ALA-185-3.3/9.8, 201.378 ADA Pedestrian Infrastructure, PPNO 0091P, $4mil (Project 94)
0 17 10 0 0 0 0 20 0 0 0 46 $4.0 12
Page 13 of 30

Projects
Rank ID Description
Wo
rker
S
afet
y
Use
r S
afet
y
Hea
lth
Ass
et
Pre
serv
atio
n
Use
r C
ost
s
Del
ay
Red
uct
ion
Sys
tem
R
elia
bil
ity
Tra
vel
Qu
alit
y
Fre
igh
t C
orr
ido
rs
Air
& W
ater
Q
ual
ity
Co
mp
lete
S
tree
ts
Min
imiz
e d
amag
e to
en
viro
nm
ent
Max
imiz
e eq
uit
y an
d a
cces
s to
m
ult
imo
dal
tr
ansp
ort
atio
n
syst
ems
Safety and HealthStewardship and
EfficiencySystem Performance
Sustainability, Livability, and Economy
Scoring Summary
Min
imiz
e i
nju
rie
s
and
fat
alit
ies
of
wo
rker
s
Min
imiz
e i
nju
rie
s
and
fat
alit
ies
of
use
rs
Max
imiz
e h
ealt
h
of
Cal
ifo
rnia
re
sid
ents
Min
imiz
e C
ost
to
T
axp
ayer
s
Pro
ject
Val
ue
Pro
ject
Co
st (
$mil
)
Pro
ject
Val
ue-
to-C
ost
Rat
io
Min
imiz
e in
con
ven
ien
ce t
o
use
rs o
f th
e h
igh
way
sys
tem
Max
imiz
e q
ual
ity
of
trav
el f
or
all
mo
des
Min
imiz
e d
isru
pti
on
of
the
eco
no
my
170 13406-KER-178-1.7/6.9, 201.235 Roadside Safety Improvements, PPNO 3729, $3.5mil (Project 134)
30 11 0 0 0 0 0 0 0 0 0 41 $3.5 12
171 8404-SM-280-R0.2/R3.4, 201.235 Roadside Safety Improvements, PPNO 0481J, $4.9mil (Project 84)
45 12 0 0 0 0 0 0 0 0 0 57 $4.9 12
172 22008-RIV-74-36.9/43.5, 201.361 ADA Access Improvements, PPNO 3003P, $4.8mil (Project 220)
0 13 23 0 0 0 0 20 0 0 0 56 $4.8 12
173 601-HUM-96-VAR, 201.113 Bridge Seismic Restoration, PPNO 2302, $12.7mil (Project 6) 0 82 0 24 0 0 0 10 0 0 30 146 $12.7 12
174 6704-ALA-13-VAR, 201.015 Collision Severity Reduction, PPNO 0488Q, $5.9mil (Project 67) 3 55 0 0 0 0 0 10 0 0 0 68 $5.9 12
175 10004-NAP-121-18.6, 201.110 Bridge Rehabilitation, PPNO 1489K, $4.7mil (Project 100)
3 47 0 4 0 0 0 0 0 0 0 54 $4.7 11
176 1401-HUM-101-79.9/86.1, 201.310 Operational Improvements, PPNO 2418, $9.1mil (Project 14)
0 44 9 14 0 10 5 20 2 0 0 103 $9.1 11
177 8104-SCL-82-9.8/14.4, 201.121 Roadway Preservation (CAPM), PPNO 1490C, $13.3mil (Project 81)
23 43 5 20 21 0 0 10 1 29 0 151 $13.3 11
178 13106-KER-5-5.6/8.8, 201.151 Drainage System Restoration, PPNO 6749, $7mil (Project 131) 23 0 0 26 0 0 0 0 0 0 30 79 $7.0 11
179 26511-SD-94-R10.4/14.9, 201.121 Roadway Preservation (CAPM), PPNO 1177, $14.8mil (Project 265)
23 39 9 20 15 0 0 30 1 30 0 166 $14.8 11
180 23409-INY-178-43.4/44.2, 201.151 Drainage System Restoration, PPNO 0653, $3.8mil (Project 234)
8 0 0 4 0 0 0 0 0 0 30 42 $3.8 11
181 10705-SB-101-56.0, 201.112 Bridge Rail Replacement/Upgrade, PPNO 2561, $8.8mil (Project 107)
15 52 0 11 0 0 0 20 0 0 0 98 $8.8 11
182 36610-SJ-120-R2.6/T7.2, 201.235 Roadside Safety Improvements, PPNO 3120, $5.5mil (Project 366)
45 15 0 0 0 0 0 0 0 0 0 60 $5.5 11
Page 14 of 30

Projects
Rank ID Description
Wo
rker
S
afet
y
Use
r S
afet
y
Hea
lth
Ass
et
Pre
serv
atio
n
Use
r C
ost
s
Del
ay
Red
uct
ion
Sys
tem
R
elia
bil
ity
Tra
vel
Qu
alit
y
Fre
igh
t C
orr
ido
rs
Air
& W
ater
Q
ual
ity
Co
mp
lete
S
tree
ts
Min
imiz
e d
amag
e to
en
viro
nm
ent
Max
imiz
e eq
uit
y an
d a
cces
s to
m
ult
imo
dal
tr
ansp
ort
atio
n
syst
ems
Safety and HealthStewardship and
EfficiencySystem Performance
Sustainability, Livability, and Economy
Scoring Summary
Min
imiz
e i
nju
rie
s
and
fat
alit
ies
of
wo
rker
s
Min
imiz
e i
nju
rie
s
and
fat
alit
ies
of
use
rs
Max
imiz
e h
ealt
h
of
Cal
ifo
rnia
re
sid
ents
Min
imiz
e C
ost
to
T
axp
ayer
s
Pro
ject
Val
ue
Pro
ject
Co
st (
$mil
)
Pro
ject
Val
ue-
to-C
ost
Rat
io
Min
imiz
e in
con
ven
ien
ce t
o
use
rs o
f th
e h
igh
way
sys
tem
Max
imiz
e q
ual
ity
of
trav
el f
or
all
mo
des
Min
imiz
e d
isru
pti
on
of
the
eco
no
my
183 23810-STA-99-R18.1/R20.9, 201.015 Collision Severity Reduction, PPNO 3130, $10.6mil (Project 238)
45 71 0 0 0 0 0 0 0 0 0 116 $10.6 11
184 13006-FRE-33-69.3/70.9, 201.361 ADA Access Improvements, PPNO 6747, $3mil (Project 130)
0 11 2 0 0 0 0 20 0 0 0 33 $3.0 11
185 33306-KIN-198-8.3/R19.4, 201.235 Roadside Safety Improvements, PPNO 6737, $5mil (Project 333)
45 10 0 0 0 0 0 0 0 0 0 55 $5.0 11
186 27011-SD-8-5.0/6.0, 201.235 Roadside Safety Improvements, PPNO 1166, $5.5mil (Project 270)
45 14 0 0 0 0 0 0 0 0 0 59 $5.5 11
187 31703-YUB-70-13/13.6, 201.015 Collision Severity Reduction, PPNO 9821, $6.7mil (Project 317)
15 57 0 0 0 0 0 0 0 0 0 72 $6.7 11
188 13606-TUL-99-28.9/31.0, 201.235 Roadside Safety Improvements, PPNO 6700, $4mil (Project 136)
30 13 0 0 0 0 0 0 0 0 0 43 $4.0 11
189 36810-SJ-4-15.677/19.179, 201.235 Roadside Safety Improvements, PPNO 3110, $5.6mil (Project 368)
45 14 0 0 0 0 0 0 0 0 0 59 $5.6 11
190 7704-NAP-29-39.1, 201.119 Bridge Preventive Maintenance, PPNO 1483E, $5.3mil (Project 77)
3 48 0 5 0 0 0 0 0 0 0 56 $5.3 11
191 24210-SJ-5-VAR, 201.113 Bridge Seismic Restoration, PPNO 3118, $13.4mil (Project 242)
0 77 0 34 0 0 0 0 0 0 30 141 $13.4 11
192 5903-ED-50-R28.8, 201.110 Bridge Rehabilitation, PPNO 6923, $9.9mil (Project 59)
15 49 0 20 0 0 0 20 0 0 0 104 $9.9 10
193 20208-SBD-38-47.5/59.4, 201.151 Drainage System Restoration, PPNO 0205C, $7.4mil (Project 202)
23 0 0 25 0 0 0 0 0 0 30 77 $7.4 10
194 25510-TUO-120-48.8/R50.5, 201.150 Roadway Protective Betterment, PPNO 3136, $3.1mil (Project 255)
8 25 0 0 0 0 0 0 0 0 0 32 $3.1 10
195 401-LAK-20-VAR, 201.112 Bridge Rail Replacement/Upgrade, PPNO 3098, $9.9mil (Project 4)
3 69 0 10 0 0 0 20 0 0 0 101 $9.9 10
Page 15 of 30

Projects
Rank ID Description
Wo
rker
S
afet
y
Use
r S
afet
y
Hea
lth
Ass
et
Pre
serv
atio
n
Use
r C
ost
s
Del
ay
Red
uct
ion
Sys
tem
R
elia
bil
ity
Tra
vel
Qu
alit
y
Fre
igh
t C
orr
ido
rs
Air
& W
ater
Q
ual
ity
Co
mp
lete
S
tree
ts
Min
imiz
e d
amag
e to
en
viro
nm
ent
Max
imiz
e eq
uit
y an
d a
cces
s to
m
ult
imo
dal
tr
ansp
ort
atio
n
syst
ems
Safety and HealthStewardship and
EfficiencySystem Performance
Sustainability, Livability, and Economy
Scoring Summary
Min
imiz
e i
nju
rie
s
and
fat
alit
ies
of
wo
rker
s
Min
imiz
e i
nju
rie
s
and
fat
alit
ies
of
use
rs
Max
imiz
e h
ealt
h
of
Cal
ifo
rnia
re
sid
ents
Min
imiz
e C
ost
to
T
axp
ayer
s
Pro
ject
Val
ue
Pro
ject
Co
st (
$mil
)
Pro
ject
Val
ue-
to-C
ost
Rat
io
Min
imiz
e in
con
ven
ien
ce t
o
use
rs o
f th
e h
igh
way
sys
tem
Max
imiz
e q
ual
ity
of
trav
el f
or
all
mo
des
Min
imiz
e d
isru
pti
on
of
the
eco
no
my
196 22408-SBD-330-37.1/39.8, 201.150 Roadway Protective Betterment, PPNO 3002H, $3.3mil (Project 224)
8 26 0 0 0 0 0 0 0 0 0 34 $3.3 10
197 35408-RIV-79-0/15.6, 201.121 Roadway Preservation (CAPM), PPNO '0066Q, $10.4mil (Project 354)
23 32 0 15 5 0 0 0 1 30 0 105 $10.4 10
198 25610-TUO-108-26.4/34.4, 201.150 Roadway Protective Betterment, PPNO 3137, $4mil (Project 256)
15 25 0 0 0 0 0 0 0 0 0 40 $4.0 10
199 31804-ALA-880-4.8/11.3, 201.235 Roadside Safety Improvements, PPNO 1483N, $7.4mil (Project 318)
60 14 0 0 0 0 0 0 0 0 0 74 $7.4 10
200 7804-CC-242-R0.0/R3.4, 201.121 Roadway Preservation (CAPM), PPNO 0269H, $15.5mil (Project 78)
23 44 3 22 19 0 0 10 3 30 0 154 $15.5 10
201 19708-SBD-95-64.5/80.5, 201.121 Roadway Preservation (CAPM), PPNO 3003Y, $5.5mil (Project 197)
15 22 0 16 0 0 0 0 1 0 0 54 $5.5 10
202 4003-BUT-99-15.4, 201.111 Bridge Scour Mitigation, PPNO 2425, $11.4mil (Project 40) 0 52 0 9 0 0 0 20 0 0 30 111 $11.4 10
203 37711-SD-8-12/13, 201.235 Roadside Safety Improvements, PPNO 1168, $6mil (Project 377)
45 14 0 0 0 0 0 0 0 0 0 59 $6.0 10
204 12406-TUL-99-19.4, 201.110 Bridge Rehabilitation, PPNO 6679, $11.5mil (Project 124)
15 55 0 20 0 0 0 20 0 0 0 111 $11.5 10
205 31303-SAC-5-33.1/33.1, 201.321 Weigh Stations & WIM Facilities, PPNO 5852, $2.9mil (Project 313)
0 28 0 0 0 0 0 0 0 0 0 28 $2.9 10
206 24910-SJ-4-15.7/R19.2, 201.235 Roadside Safety Improvements, PPNO 3110, $6.3mil (Project 249)
45 14 0 0 0 0 0 0 0 0 0 59 $6.3 9
207 5303-YOL-5-VAR, 201.315 Transportation Management Systems, PPNO 8571, $13.6mil (Project 53)
0 26 0 20 0 40 10 0 30 0 0 126 $13.6 9
208 1802-SHA-5-57.4, 201.110 Bridge Rehabilitation, PPNO 3542, $10.3mil (Project 18) 15 46 0 24 0 0 0 10 0 0 0 95 $10.3 9
Page 16 of 30

Projects
Rank ID Description
Wo
rker
S
afet
y
Use
r S
afet
y
Hea
lth
Ass
et
Pre
serv
atio
n
Use
r C
ost
s
Del
ay
Red
uct
ion
Sys
tem
R
elia
bil
ity
Tra
vel
Qu
alit
y
Fre
igh
t C
orr
ido
rs
Air
& W
ater
Q
ual
ity
Co
mp
lete
S
tree
ts
Min
imiz
e d
amag
e to
en
viro
nm
ent
Max
imiz
e eq
uit
y an
d a
cces
s to
m
ult
imo
dal
tr
ansp
ort
atio
n
syst
ems
Safety and HealthStewardship and
EfficiencySystem Performance
Sustainability, Livability, and Economy
Scoring Summary
Min
imiz
e i
nju
rie
s
and
fat
alit
ies
of
wo
rker
s
Min
imiz
e i
nju
rie
s
and
fat
alit
ies
of
use
rs
Max
imiz
e h
ealt
h
of
Cal
ifo
rnia
re
sid
ents
Min
imiz
e C
ost
to
T
axp
ayer
s
Pro
ject
Val
ue
Pro
ject
Co
st (
$mil
)
Pro
ject
Val
ue-
to-C
ost
Rat
io
Min
imiz
e in
con
ven
ien
ce t
o
use
rs o
f th
e h
igh
way
sys
tem
Max
imiz
e q
ual
ity
of
trav
el f
or
all
mo
des
Min
imiz
e d
isru
pti
on
of
the
eco
no
my
209 17007-LA-405-42.9, 201.321 Weigh Stations & WIM Facilities, PPNO 4724, $4mil (Project 170)
0 36 0 0 0 0 0 0 0 0 0 36 $4.0 9
210 27111-SD-8-6.0/12.0, 201.235 Roadside Safety Improvements, PPNO 1167, $8.3mil (Project 271)
60 15 0 0 0 0 0 0 0 0 0 75 $8.3 9
211 27511-SD-5-R34.6/R35.1, 201.335 Stormwater, PPNO 1164, $3.3mil (Project 275) 0 0 0 0 0 0 0 0 0 30 0 30 $3.3 9
212 17907-VEN-101-27.5/31.0, 201.335 Stormwater, PPNO 4813, $2.5mil (Project 179) 0 0 0 0 0 0 0 0 0 23 0 23 $2.5 9
213 31503-YOL-5-17.2/24.7, 201.361 ADA Access Improvements, PPNO 5833, $1.1mil (Project 315)
0 10 0 0 0 0 0 0 0 0 0 10 $1.1 9
214 1501-HUM-299-R16.1/R16.4, 201.335 Stormwater, PPNO 2378, $5.1mil (Project 15) 0 0 0 0 0 0 0 30 0 14 0 45 $5.1 9
215 12105-SB-101-70.9, 201.110 Bridge Rehabilitation, PPNO 2522, $10.6mil (Project 121)
15 48 0 20 0 0 0 10 0 0 0 93 $10.6 9
216 10104-SF-1-6.3/6.6, 201.170 Signs and Lighting Rehabilitation, PPNO 1490A, $5.4mil (Project 101)
15 32 0 0 0 0 0 0 0 0 0 47 $5.4 9
217 11705-SB-101-46.5/68.9, 201.235 Roadside Safety Improvements, PPNO 2460, $4.7mil (Project 117)
30 11 0 0 0 0 0 0 0 0 0 41 $4.7 9
218 30502-MOD-299-51.9/52.5, 201.010 Safety Improvements, PPNO 3607, $5.3mil (Project 305)
3 43 0 0 0 0 0 0 0 0 0 46 $5.3 9
219 2702-TRI-299-11.1/11.3, 201.150 Roadway Protective Betterment, PPNO 3579, $3.3mil (Project 27)
2 27 0 0 0 0 0 0 0 0 0 29 $3.3 9
220 18307-LA-66-0.0/3.2, 201.361 ADA Access Improvements, PPNO 4744, $5.6mil (Project 183)
0 18 11 0 0 0 0 20 0 0 0 49 $5.6 9
221 26411-SD-805-27.1/28.9, 201.121 Roadway Preservation (CAPM), PPNO 1175, $10.7mil (Project 264)
23 35 2 19 3 0 0 10 1 0 0 92 $10.7 9
Page 17 of 30

Projects
Rank ID Description
Wo
rker
S
afet
y
Use
r S
afet
y
Hea
lth
Ass
et
Pre
serv
atio
n
Use
r C
ost
s
Del
ay
Red
uct
ion
Sys
tem
R
elia
bil
ity
Tra
vel
Qu
alit
y
Fre
igh
t C
orr
ido
rs
Air
& W
ater
Q
ual
ity
Co
mp
lete
S
tree
ts
Min
imiz
e d
amag
e to
en
viro
nm
ent
Max
imiz
e eq
uit
y an
d a
cces
s to
m
ult
imo
dal
tr
ansp
ort
atio
n
syst
ems
Safety and HealthStewardship and
EfficiencySystem Performance
Sustainability, Livability, and Economy
Scoring Summary
Min
imiz
e i
nju
rie
s
and
fat
alit
ies
of
wo
rker
s
Min
imiz
e i
nju
rie
s
and
fat
alit
ies
of
use
rs
Max
imiz
e h
ealt
h
of
Cal
ifo
rnia
re
sid
ents
Min
imiz
e C
ost
to
T
axp
ayer
s
Pro
ject
Val
ue
Pro
ject
Co
st (
$mil
)
Pro
ject
Val
ue-
to-C
ost
Rat
io
Min
imiz
e in
con
ven
ien
ce t
o
use
rs o
f th
e h
igh
way
sys
tem
Max
imiz
e q
ual
ity
of
trav
el f
or
all
mo
des
Min
imiz
e d
isru
pti
on
of
the
eco
no
my
222 5103-NEV-49-VAR, 201.315 Transportation Management Systems, PPNO 4125, $13.2mil (Project 51)
0 26 0 33 0 15 10 0 30 0 0 114 $13.2 9
223 18807-LA-1-35.1/35.4, 201.170 Signs and Lighting Rehabilitation, PPNO 4903, $5.8mil (Project 188)
15 35 0 0 0 0 0 0 0 0 0 50 $5.8 9
224 9104-SON-37-2.6, 201.321 Weigh Stations & WIM Facilities, PPNO 0763L, $3.4mil (Project 91)
0 29 0 0 0 0 0 0 0 0 0 29 $3.4 8
225 36210-ALP-4-16.6/31.1, 201.151 Drainage System Restoration, PPNO 3139, $6.6mil (Project 362)
15 0 0 11 0 0 0 0 0 0 30 56 $6.6 8
226 15907-LA-210-R32.8/R44.7, 201.235 Roadside Safety Improvements, PPNO 4707, $7.3mil (Project 159)
45 15 0 0 0 0 0 0 0 0 0 60 $7.3 8
227 33607-LA-107-0/4.8, 201.121 Roadway Preservation (CAPM), PPNO 4818, $14.2mil (Project 336)
23 32 0 19 11 0 0 0 1 30 0 116 $14.2 8
228 11605-MON-1-20.4, 201.151 Drainage System Restoration, PPNO 2230, $4.3mil (Project 116)
2 0 0 4 0 0 0 0 0 0 30 35 $4.3 8
229 501-MEN-1-31.4, 201.112 Bridge Rail Replacement/Upgrade, PPNO 4588, $12.4mil (Project 5)
3 43 0 6 0 0 0 50 0 0 0 101 $12.4 8
230 33206-KER-43-0/9.3, 201.121 Roadway Preservation (CAPM), PPNO 6755, $14.3mil (Project 332)
23 30 0 14 7 0 0 0 12 30 0 116 $14.3 8
231 29404-SON-12-35.1/38.9, 201.121 Roadway Preservation (CAPM), PPNO 0488K, $8.7mil (Project 294)
15 35 0 13 1 0 0 0 0 5 0 70 $8.7 8
232 1902-SHA-5-66.8, 201.110 Bridge Rehabilitation, PPNO 3543, $12.7mil (Project 19) 15 47 0 28 0 0 0 10 0 0 0 100 $12.7 8
233 2102-TRI-299-VAR, 201.119 Bridge Preventive Maintenance, PPNO 3516, $11.2mil (Project 21)
3 60 0 15 0 0 0 10 0 0 0 88 $11.2 8
234 37611-SD-905-9.6/11.4, 201.310 Operational Improvements, PPNO 1035, $10mil (Project 376)
0 32 0 14 0 15 15 0 1 0 0 77 $10.0 8
Page 18 of 30

Projects
Rank ID Description
Wo
rker
S
afet
y
Use
r S
afet
y
Hea
lth
Ass
et
Pre
serv
atio
n
Use
r C
ost
s
Del
ay
Red
uct
ion
Sys
tem
R
elia
bil
ity
Tra
vel
Qu
alit
y
Fre
igh
t C
orr
ido
rs
Air
& W
ater
Q
ual
ity
Co
mp
lete
S
tree
ts
Min
imiz
e d
amag
e to
en
viro
nm
ent
Max
imiz
e eq
uit
y an
d a
cces
s to
m
ult
imo
dal
tr
ansp
ort
atio
n
syst
ems
Safety and HealthStewardship and
EfficiencySystem Performance
Sustainability, Livability, and Economy
Scoring Summary
Min
imiz
e i
nju
rie
s
and
fat
alit
ies
of
wo
rker
s
Min
imiz
e i
nju
rie
s
and
fat
alit
ies
of
use
rs
Max
imiz
e h
ealt
h
of
Cal
ifo
rnia
re
sid
ents
Min
imiz
e C
ost
to
T
axp
ayer
s
Pro
ject
Val
ue
Pro
ject
Co
st (
$mil
)
Pro
ject
Val
ue-
to-C
ost
Rat
io
Min
imiz
e in
con
ven
ien
ce t
o
use
rs o
f th
e h
igh
way
sys
tem
Max
imiz
e q
ual
ity
of
trav
el f
or
all
mo
des
Min
imiz
e d
isru
pti
on
of
the
eco
no
my
235 24310-SJ-4-, 201.119 Bridge Preventive Maintenance, PPNO 3113, $9.3mil (Project 243)
3 48 0 19 0 0 0 0 0 0 0 70 $9.3 8
236 8004-SM-101-16.5/23.0, 201.121 Roadway Preservation (CAPM), PPNO 1487J, $20.8mil (Project 80)
30 37 7 26 28 0 0 10 9 9 0 156 $20.8 7
237 29706-MAD-41-6.3/9.2, 201.120 Roadway Rehabilitation (3R), PPNO 6708, $12.5mil (Project 297)
15 59 0 18 0 0 0 0 0 0 0 92 $12.5 7
238 19808-SBD-62-121.5/142.7, 201.121 Roadway Preservation (CAPM), PPNO 3004A, $10.8mil (Project 198)
15 23 0 10 1 0 0 0 0 30 0 80 $10.8 7
239 2302-LAS-299-18.5/25.6, 201.120 Roadway Rehabilitation (3R), PPNO 3467, $19.2mil (Project 23)
30 42 10 38 0 0 0 20 0 0 0 140 $19.2 7
240 10905-MON-101-R6.7, 201.113 Bridge Seismic Restoration, PPNO 2565, $14.2mil (Project 109)
0 46 0 27 0 0 0 0 0 0 30 103 $14.2 7
241 1201-DN-199-1.1/36.3, 201.151 Drainage System Restoration, PPNO 1055, $8.7mil (Project 12)
15 0 0 18 0 0 0 0 0 0 30 63 $8.7 7
242 21908-RIV-79-25.6/26.4, 201.361 ADA Access Improvements, PPNO 3002R, $4.1mil (Project 219)
0 9 1 0 0 0 0 20 0 0 0 30 $4.1 7
243 22108-RIV-10-27.7, 201.110 Bridge Rehabilitation, PPNO 3002F, $14.5mil (Project 221)
30 51 0 21 0 0 0 0 0 0 0 102 $14.5 7
244 32605-MON-1-T100.7/R102.3, 201.235 Roadside Safety Improvements, PPNO 2452, $5.8mil (Project 326)
30 10 0 0 0 0 0 0 0 0 0 40 $5.8 7
245 2002-TRI-3-58.7/61.9, 201.110 Bridge Rehabilitation, PPNO 3485, $12.8mil (Project 20)
15 43 5 5 0 0 0 20 0 0 0 88 $12.8 7
246 26911-SD-8-2.8/5.0, 201.235 Roadside Safety Improvements, PPNO 1165, $8.8mil (Project 269)
45 15 0 0 0 0 0 0 0 0 0 60 $8.8 7
247 6103-YUB-70-15.1/16.5, 201.120 Roadway Rehabilitation (3R), PPNO 9820, $22.7mil (Project 61)
30 57 3 21 1 0 0 40 0 2 0 154 $22.7 7
Page 19 of 30

Projects
Rank ID Description
Wo
rker
S
afet
y
Use
r S
afet
y
Hea
lth
Ass
et
Pre
serv
atio
n
Use
r C
ost
s
Del
ay
Red
uct
ion
Sys
tem
R
elia
bil
ity
Tra
vel
Qu
alit
y
Fre
igh
t C
orr
ido
rs
Air
& W
ater
Q
ual
ity
Co
mp
lete
S
tree
ts
Min
imiz
e d
amag
e to
en
viro
nm
ent
Max
imiz
e eq
uit
y an
d a
cces
s to
m
ult
imo
dal
tr
ansp
ort
atio
n
syst
ems
Safety and HealthStewardship and
EfficiencySystem Performance
Sustainability, Livability, and Economy
Scoring Summary
Min
imiz
e i
nju
rie
s
and
fat
alit
ies
of
wo
rker
s
Min
imiz
e i
nju
rie
s
and
fat
alit
ies
of
use
rs
Max
imiz
e h
ealt
h
of
Cal
ifo
rnia
re
sid
ents
Min
imiz
e C
ost
to
T
axp
ayer
s
Pro
ject
Val
ue
Pro
ject
Co
st (
$mil
)
Pro
ject
Val
ue-
to-C
ost
Rat
io
Min
imiz
e in
con
ven
ien
ce t
o
use
rs o
f th
e h
igh
way
sys
tem
Max
imiz
e q
ual
ity
of
trav
el f
or
all
mo
des
Min
imiz
e d
isru
pti
on
of
the
eco
no
my
248 7104-ALA-84-17.2, 201.111 Bridge Scour Mitigation, PPNO 0481M, $13.7mil (Project 71)
0 39 0 14 0 0 0 10 0 0 30 93 $13.7 7
249 3002-SHA-5-R31.0/31.7, 201.235 Roadside Safety Improvements, PPNO 3552, $5.7mil (Project 30)
30 8 0 0 0 0 0 0 0 0 0 38 $5.7 7
250 34807-VEN-126-R10.2/R12.7, 201.335 Stormwater, PPNO 4815, $3.4mil (Project 348)
0 0 0 0 0 0 0 0 0 23 0 23 $3.4 7
251 2802-TRI-299-43.1/43.3, 201.150 Roadway Protective Betterment, PPNO 3592, $4.3mil (Project 28)
2 27 0 0 0 0 0 0 0 0 0 28 $4.3 7
252 14907-LA-138-0.0/36.9, 201.121 Roadway Preservation (CAPM), PPNO 4804, $26.5mil (Project 149)
23 40 0 21 31 0 0 0 30 30 0 176 $26.5 7
253 4903-ED-50-0.0/80.4, 201.315 Transportation Management Systems, PPNO 3312, $13mil (Project 49)
0 22 0 22 0 15 15 0 12 0 0 86 $13.0 7
254 27611-SD-VAR-, 201.361 ADA Access Improvements, PPNO 1127, $7.9mil (Project 276)
0 17 15 0 0 0 0 20 0 0 0 52 $7.9 7
255 5403-SAC-80-15.2/17.0, 201.321 Weigh Stations & WIM Facilities, PPNO 6712, $5.5mil (Project 54)
0 34 0 0 0 0 0 0 2 0 0 36 $5.5 7
256 5203-SAC-80-M0.1/18.0, 201.315 Transportation Management Systems, PPNO 6713, $16.8mil (Project 52)
0 25 0 20 0 25 10 0 30 0 0 110 $16.8 7
257 35208-RIV-15-38.2/51.5, 201.121 Roadway Preservation (CAPM), PPNO 3003M, $30.8mil (Project 352)
30 43 0 28 48 0 0 0 20 30 0 199 $30.8 6
258 101-HUM-36-0.1/1.6, 201.015 Collision Severity Reduction, PPNO 2379, $13.3mil (Project 1) 15 48 2 0 0 0 0 20 0 0 0 86 $13.3 6
259 36310-ALP-88-VAR, 201.151 Drainage System Restoration, PPNO 3142, $7.4mil (Project 363)
2 0 0 16 0 0 0 0 0 0 30 47 $7.4 6
260 36410-MER-152-VAR, 201.151 Drainage System Restoration, PPNO 3139, $6.6mil (Project 364)
2 0 0 11 0 0 0 0 0 0 30 42 $6.6 6
Page 20 of 30

Projects
Rank ID Description
Wo
rker
S
afet
y
Use
r S
afet
y
Hea
lth
Ass
et
Pre
serv
atio
n
Use
r C
ost
s
Del
ay
Red
uct
ion
Sys
tem
R
elia
bil
ity
Tra
vel
Qu
alit
y
Fre
igh
t C
orr
ido
rs
Air
& W
ater
Q
ual
ity
Co
mp
lete
S
tree
ts
Min
imiz
e d
amag
e to
en
viro
nm
ent
Max
imiz
e eq
uit
y an
d a
cces
s to
m
ult
imo
dal
tr
ansp
ort
atio
n
syst
ems
Safety and HealthStewardship and
EfficiencySystem Performance
Sustainability, Livability, and Economy
Scoring Summary
Min
imiz
e i
nju
rie
s
and
fat
alit
ies
of
wo
rker
s
Min
imiz
e i
nju
rie
s
and
fat
alit
ies
of
use
rs
Max
imiz
e h
ealt
h
of
Cal
ifo
rnia
re
sid
ents
Min
imiz
e C
ost
to
T
axp
ayer
s
Pro
ject
Val
ue
Pro
ject
Co
st (
$mil
)
Pro
ject
Val
ue-
to-C
ost
Rat
io
Min
imiz
e in
con
ven
ien
ce t
o
use
rs o
f th
e h
igh
way
sys
tem
Max
imiz
e q
ual
ity
of
trav
el f
or
all
mo
des
Min
imiz
e d
isru
pti
on
of
the
eco
no
my
261 17707-LA-710-23.3/25.6, 201.335 Stormwater, PPNO 4717, $4.7mil (Project 177) 0 0 0 0 0 0 0 0 0 30 0 30 $4.7 6
262 25010-SJ-205-L0.0/R13.4, 201.315 Transportation Management Systems, PPNO 3146, $16mil (Project 250)
0 20 0 22 0 15 15 0 30 0 0 102 $16.0 6
263 8504-SCL-680-M0.0/M9.9, 201.235 Roadside Safety Improvements, PPNO 0481T, $12mil (Project 85)
60 16 0 0 0 0 0 0 0 0 0 76 $12.0 6
264 9004-ALA-VAR-, 201.315 Transportation Management Systems, PPNO 16543, $20.8mil (Project 90)
0 0 0 45 0 50 35 0 0 0 0 130 $20.8 6
265 18407-VEN-150-16.6/34.4, 201.361 ADA Access Improvements, PPNO 4746, $7.7mil (Project 184)
0 13 15 0 0 0 0 20 0 0 0 48 $7.7 6
266 29112-ORA-1-7.9/10.5, 201.378 ADA Pedestrian Infrastructure, PPNO 2300, $10.5mil (Project 291)
0 30 5 0 0 0 0 30 0 0 0 65 $10.5 6
267 19508-SBD-95-9.7/33.6, 201.121 Roadway Preservation (CAPM), PPNO 3002V, $11.9mil (Project 195)
15 21 0 7 1 0 0 0 0 30 0 74 $11.9 6
268 27812-ORA-73-10.0/28.0, 201.015 Collision Severity Reduction, PPNO 4051A, $23.1mil (Project 278)
60 82 0 0 0 0 0 0 0 0 0 142 $23.1 6
269 37110-SJ-5-28.97/28.97, 201.361 ADA Access Improvements, PPNO 3153, $2.2mil (Project 371)
0 13 0 0 0 0 0 0 0 0 0 13 $2.2 6
270 1601-HUM-101-75.3/77.6, 201.378 ADA Pedestrian Infrastructure, PPNO 2346, $9mil (Project 16)
0 30 3 0 0 0 0 20 0 0 0 54 $9.0 6
271 38212-ORA-91-R13.6/R13.6, 201.321 Weigh Stations & WIM Facilities, PPNO 4642A, $6.7mil (Project 382)
0 40 0 0 0 0 0 0 0 0 0 40 $6.7 6
272 29610-STA-99-R16.5/R16.7, 201.330 Hazardous Waste Mitigation, PPNO 3125, $5.1mil (Project 296)
0 0 0 0 0 0 0 0 0 30 0 30 $5.1 6
273 35308-RIV-15-23.9/33.4, 201.121 Roadway Preservation (CAPM), PPNO 3003L, $26.2mil (Project 353)
30 34 0 23 20 0 0 0 13 30 0 150 $26.2 6
Page 21 of 30

Projects
Rank ID Description
Wo
rker
S
afet
y
Use
r S
afet
y
Hea
lth
Ass
et
Pre
serv
atio
n
Use
r C
ost
s
Del
ay
Red
uct
ion
Sys
tem
R
elia
bil
ity
Tra
vel
Qu
alit
y
Fre
igh
t C
orr
ido
rs
Air
& W
ater
Q
ual
ity
Co
mp
lete
S
tree
ts
Min
imiz
e d
amag
e to
en
viro
nm
ent
Max
imiz
e eq
uit
y an
d a
cces
s to
m
ult
imo
dal
tr
ansp
ort
atio
n
syst
ems
Safety and HealthStewardship and
EfficiencySystem Performance
Sustainability, Livability, and Economy
Scoring Summary
Min
imiz
e i
nju
rie
s
and
fat
alit
ies
of
wo
rker
s
Min
imiz
e i
nju
rie
s
and
fat
alit
ies
of
use
rs
Max
imiz
e h
ealt
h
of
Cal
ifo
rnia
re
sid
ents
Min
imiz
e C
ost
to
T
axp
ayer
s
Pro
ject
Val
ue
Pro
ject
Co
st (
$mil
)
Pro
ject
Val
ue-
to-C
ost
Rat
io
Min
imiz
e in
con
ven
ien
ce t
o
use
rs o
f th
e h
igh
way
sys
tem
Max
imiz
e q
ual
ity
of
trav
el f
or
all
mo
des
Min
imiz
e d
isru
pti
on
of
the
eco
no
my
274 12306-FRE-168-45.8/65.9, 201.122 Roadway Rehabilitation (2R), PPNO 6754, $15.4mil (Project 123)
15 25 0 48 1 0 0 0 0 0 0 88 $15.4 6
275 15007-LA-134- 0.0/R13.3, 201.121 Roadway Preservation (CAPM), PPNO 4817, $42mil (Project 150)
30 40 20 31 50 0 0 10 30 30 0 241 $42.0 6
276 31904-ALA-880-14.7/14.7, 201.321 Weigh Stations & WIM Facilities, PPNO 1482G, $5.9mil (Project 319)
0 34 0 0 0 0 0 0 0 0 0 34 $5.9 6
277 32004-ALA-13-10.4/11.1, 201.378 ADA Pedestrian Infrastructure, PPNO '0144A, $5.2mil (Project 320)
0 30 0 0 0 0 0 0 0 0 0 30 $5.2 6
278 26211-SD-78-N17.6/R21.4, 201.121 Roadway Preservation (CAPM), PPNO 1162, $29.6mil (Project 262)
15 46 11 15 10 0 0 40 0 30 0 168 $29.6 6
279 12706-KER-99-0.0/19.5, 201.122 Roadway Rehabilitation (2R), PPNO 6731, $38.1mil (Project 127)
23 26 0 91 16 0 0 0 30 30 0 215 $38.1 6
280 34607-LA-57-R0.00/R4.45, 201.121 Roadway Preservation (CAPM), PPNO 4718, $22.7mil (Project 346)
23 21 0 24 20 0 0 0 10 30 0 127 $22.7 6
281 19108-SBD-15-R96.1/R124.3, 201.015 Collision Severity Reduction, PPNO 3002E, $17.3mil (Project 191)
45 51 0 0 0 0 0 0 0 0 0 96 $17.3 6
282 12906-FRE-5-1.3/1.4, 201.235 Roadside Safety Improvements, PPNO 6736, $4.6mil (Project 129)
15 10 0 0 0 0 0 0 0 0 0 25 $4.6 6
283 4703-SAC-5-33.7, 201.235 Roadside Safety Improvements, PPNO 5848, $4.6mil (Project 47)
15 11 0 0 0 0 0 0 0 0 0 26 $4.6 6
284 19608-SBD-15-64.6/75.3, 201.121 Roadway Preservation (CAPM), PPNO 3003V, $30.7mil (Project 196)
23 28 20 20 11 0 0 10 22 30 0 164 $30.7 5
285 15107-VEN-101-R36.7/R40.3, 201.122 Roadway Rehabilitation (2R), PPNO 4686, $23.4mil (Project 151)
15 29 0 66 3 0 0 0 0 12 0 125 $23.4 5
286 29801-DN-101-39.8, 201.110 Bridge Rehabilitation, PPNO 1113, $10mil (Project 298)
3 50 0 0 0 0 0 0 0 0 0 53 $10.0 5
Page 22 of 30

Projects
Rank ID Description
Wo
rker
S
afet
y
Use
r S
afet
y
Hea
lth
Ass
et
Pre
serv
atio
n
Use
r C
ost
s
Del
ay
Red
uct
ion
Sys
tem
R
elia
bil
ity
Tra
vel
Qu
alit
y
Fre
igh
t C
orr
ido
rs
Air
& W
ater
Q
ual
ity
Co
mp
lete
S
tree
ts
Min
imiz
e d
amag
e to
en
viro
nm
ent
Max
imiz
e eq
uit
y an
d a
cces
s to
m
ult
imo
dal
tr
ansp
ort
atio
n
syst
ems
Safety and HealthStewardship and
EfficiencySystem Performance
Sustainability, Livability, and Economy
Scoring Summary
Min
imiz
e i
nju
rie
s
and
fat
alit
ies
of
wo
rker
s
Min
imiz
e i
nju
rie
s
and
fat
alit
ies
of
use
rs
Max
imiz
e h
ealt
h
of
Cal
ifo
rnia
re
sid
ents
Min
imiz
e C
ost
to
T
axp
ayer
s
Pro
ject
Val
ue
Pro
ject
Co
st (
$mil
)
Pro
ject
Val
ue-
to-C
ost
Rat
io
Min
imiz
e in
con
ven
ien
ce t
o
use
rs o
f th
e h
igh
way
sys
tem
Max
imiz
e q
ual
ity
of
trav
el f
or
all
mo
des
Min
imiz
e d
isru
pti
on
of
the
eco
no
my
287 13907-LA-101-7.7/27.7, 201.015 Collision Severity Reduction, PPNO 4709, $26.1mil (Project 139)
60 77 0 0 0 0 0 0 0 0 0 137 $26.1 5
288 11405-SB-1-R36.4/49.2, 201.121 Roadway Preservation (CAPM), PPNO 2586, $11.1mil (Project 114)
15 25 0 10 1 0 0 0 0 6 0 58 $11.1 5
289 36009-INY-395-54.6/57.5, 201.121 Roadway Preservation (CAPM), PPNO '0657, $8.9mil (Project 360)
8 27 0 11 0 0 0 0 0 0 0 46 $8.9 5
290 13806-KIN-5-0.0/9.0, 201.122 Roadway Rehabilitation (2R), PPNO 6729, $28.5mil (Project 138)
23 25 0 88 6 0 0 0 1 3 0 146 $28.5 5
291 35908-SBD-60-R7.351/R9.11, 201.310 Operational Improvements, PPNO 3004E, $27.2mil (Project 359)
0 61 0 20 0 40 15 0 4 0 0 140 $27.2 5
292 30401-MEN-1-59.73/59.73, 201.112 Bridge Rail Replacement/Upgrade, PPNO 4588B, $21.8mil (Project 304)
15 84 0 12 0 0 0 0 0 0 0 111 $21.8 5
293 20008-SBD-15-12.8/14.8, 201.122 Roadway Rehabilitation (2R), PPNO 3003T, $25.9mil (Project 200)
23 28 6 57 2 0 0 10 4 0 0 130 $25.9 5
294 12606-KER-166-17.3/17.7, 201.110 Bridge Rehabilitation, PPNO 6726, $12.3mil (Project 126)
3 42 0 15 0 0 0 0 0 0 0 60 $12.3 5
295 7904-SCL-17-2.8/13.9, 201.121 Roadway Preservation (CAPM), PPNO 1480B, $38mil (Project 79)
30 43 10 23 39 0 0 10 2 29 0 186 $38.0 5
296 33406-MAD-99-22.6/29.3, 201.122 Roadway Rehabilitation (2R), PPNO 6732, $30.8mil (Project 334)
23 31 0 75 7 0 0 0 10 2 0 148 $30.8 5
297 30602-TEH-99-12/12.6, 201.378 ADA Pedestrian Infrastructure, PPNO 3606, $4.7mil (Project 306)
0 23 0 0 0 0 0 0 0 0 0 23 $4.7 5
298 21808-SBD-215-6.258, 201.352 Maintenance Facilities, PPNO 3001P, $10.6mil (Project 218)
30 0 0 0 0 0 0 20 0 0 0 50 $10.6 5
299 15407-LA-5-39.2/R43.8, 201.122 Roadway Rehabilitation (2R), PPNO 4693, $53.2mil (Project 154)
23 44 13 100 17 0 0 10 14 30 0 250 $53.2 5
Page 23 of 30

Projects
Rank ID Description
Wo
rker
S
afet
y
Use
r S
afet
y
Hea
lth
Ass
et
Pre
serv
atio
n
Use
r C
ost
s
Del
ay
Red
uct
ion
Sys
tem
R
elia
bil
ity
Tra
vel
Qu
alit
y
Fre
igh
t C
orr
ido
rs
Air
& W
ater
Q
ual
ity
Co
mp
lete
S
tree
ts
Min
imiz
e d
amag
e to
en
viro
nm
ent
Max
imiz
e eq
uit
y an
d a
cces
s to
m
ult
imo
dal
tr
ansp
ort
atio
n
syst
ems
Safety and HealthStewardship and
EfficiencySystem Performance
Sustainability, Livability, and Economy
Scoring Summary
Min
imiz
e i
nju
rie
s
and
fat
alit
ies
of
wo
rker
s
Min
imiz
e i
nju
rie
s
and
fat
alit
ies
of
use
rs
Max
imiz
e h
ealt
h
of
Cal
ifo
rnia
re
sid
ents
Min
imiz
e C
ost
to
T
axp
ayer
s
Pro
ject
Val
ue
Pro
ject
Co
st (
$mil
)
Pro
ject
Val
ue-
to-C
ost
Rat
io
Min
imiz
e in
con
ven
ien
ce t
o
use
rs o
f th
e h
igh
way
sys
tem
Max
imiz
e q
ual
ity
of
trav
el f
or
all
mo
des
Min
imiz
e d
isru
pti
on
of
the
eco
no
my
300 5503-NEV-80-19.0/19.4, 201.352 Maintenance Facilities, PPNO 4296, $3.3mil (Project 55) 15 0 0 0 0 0 0 0 0 0 0 15 $3.3 5
301 32705-SB-1-0/19.3, 201.121 Roadway Preservation (CAPM), PPNO 2542, $17mil (Project 327)
23 32 0 16 5 0 0 0 2 0 0 77 $17.0 5
302 11305-MON-101-73.8/87.3, 201.121 Roadway Preservation (CAPM), PPNO 2540, $24mil (Project 113)
23 33 0 19 17 0 0 0 3 14 0 108 $24.0 5
303 21508-RIV-15-6.8/7.6, 201.335 Stormwater, PPNO 3001X, $1.7mil (Project 215) 0 0 0 0 0 0 0 0 0 8 0 8 $1.7 4
304 31403-SAC-99-0/21.5, 201.121 Roadway Preservation (CAPM), PPNO 6924, $45mil (Project 314)
30 41 0 25 50 0 0 0 30 24 0 200 $45.0 4
305 26311-SD-52-3.8/5.1, 201.121 Roadway Preservation (CAPM), PPNO 1176, $18.4mil (Project 263)
23 35 0 21 2 0 0 0 1 0 0 81 $18.4 4
306 32905-SCR-17-6/12.5, 201.121 Roadway Preservation (CAPM), PPNO 2538, $19mil (Project 329)
23 32 0 24 3 0 0 0 0 0 0 81 $19.0 4
307 2502-PLU-70-90.3/96.0, 201.122 Roadway Rehabilitation (2R), PPNO 3599, $24mil (Project 25)
8 22 8 44 0 0 0 20 0 0 0 102 $24.0 4
308 30903-COL-5-24.3/24.3, 201.235 Roadside Safety Improvements, PPNO 2793, $5.6mil (Project 309)
15 9 0 0 0 0 0 0 0 0 0 24 $5.6 4
309 8904-ALA-580-R30.8/46.5, 201.315 Transportation Management Systems, PPNO 1487A, $27mil (Project 89)
0 23 0 23 0 50 15 0 1 0 0 113 $27.0 4
310 32505-MON-1-39.9/74.6, 201.121 Roadway Preservation (CAPM), PPNO 2534, $29.5mil (Project 325)
23 39 0 21 26 0 0 0 0 14 0 123 $29.5 4
311 13306-FRE-5-21.0/31.0, 201.121 Roadway Preservation (CAPM), PPNO 6753, $20.7mil (Project 133)
23 26 0 16 4 0 0 0 1 16 0 86 $20.7 4
312 18707-LA-10-31.2/37.2, 201.120 Roadway Rehabilitation (3R), PPNO 4712, $74.8mil (Project 187)
45 76 12 100 28 0 0 10 7 30 0 308 $74.8 4
Page 24 of 30

Projects
Rank ID Description
Wo
rker
S
afet
y
Use
r S
afet
y
Hea
lth
Ass
et
Pre
serv
atio
n
Use
r C
ost
s
Del
ay
Red
uct
ion
Sys
tem
R
elia
bil
ity
Tra
vel
Qu
alit
y
Fre
igh
t C
orr
ido
rs
Air
& W
ater
Q
ual
ity
Co
mp
lete
S
tree
ts
Min
imiz
e d
amag
e to
en
viro
nm
ent
Max
imiz
e eq
uit
y an
d a
cces
s to
m
ult
imo
dal
tr
ansp
ort
atio
n
syst
ems
Safety and HealthStewardship and
EfficiencySystem Performance
Sustainability, Livability, and Economy
Scoring Summary
Min
imiz
e i
nju
rie
s
and
fat
alit
ies
of
wo
rker
s
Min
imiz
e i
nju
rie
s
and
fat
alit
ies
of
use
rs
Max
imiz
e h
ealt
h
of
Cal
ifo
rnia
re
sid
ents
Min
imiz
e C
ost
to
T
axp
ayer
s
Pro
ject
Val
ue
Pro
ject
Co
st (
$mil
)
Pro
ject
Val
ue-
to-C
ost
Rat
io
Min
imiz
e in
con
ven
ien
ce t
o
use
rs o
f th
e h
igh
way
sys
tem
Max
imiz
e q
ual
ity
of
trav
el f
or
all
mo
des
Min
imiz
e d
isru
pti
on
of
the
eco
no
my
313 1001-HUM-101-69.9/75.2, 201.122 Roadway Rehabilitation (2R), PPNO 2382, $40.3mil (Project 10)
15 27 13 62 2 0 0 40 1 0 0 159 $40.3 4
314 17607-LA-210-R33.7/R39.8, 201.335 Stormwater, PPNO 4705, $4.7mil (Project 176) 0 0 0 0 0 0 0 0 0 18 0 18 $4.7 4
315 4603-GLE-5-R14.6, 201.235 Roadside Safety Improvements, PPNO 3710, $6.5mil (Project 46)
15 10 0 0 0 0 0 0 0 0 0 25 $6.5 4
316 11905-SCR-9-0.1/7.5, 201.335 Stormwater, PPNO 2569, $6.6mil (Project 119) 0 0 7 0 0 0 0 10 0 8 0 25 $6.6 4
317 13706-FRE-99-R0.9/R5.0, 201.122 Roadway Rehabilitation (2R), PPNO 6727, $28.9mil (Project 137)
15 29 0 38 3 0 0 0 8 16 0 110 $28.9 4
318 30101-HUM-101-17.8/87.9, 201.322 Trans Permit Requirements for Bridges, PPNO 2400, $16mil (Project 301)
0 0 0 52 0 0 0 0 8 0 0 61 $16.0 4
319 19908-RIV-15-R0.0/3.0, 201.122 Roadway Rehabilitation (2R), PPNO 3003K, $42.3mil (Project 199)
23 32 3 77 4 0 0 10 4 0 0 153 $42.3 4
320 33807-LA-110-0/25.75, 201.315 Transportation Management Systems, PPNO 4830, $38.5mil (Project 338)
0 26 0 20 0 50 35 0 8 0 0 138 $38.5 4
321 29504-SM-1-0.0/10.6, 201.121 Roadway Preservation (CAPM), PPNO 0622B, $15.3mil (Project 295)
15 24 0 5 1 0 0 0 0 9 0 55 $15.3 4
322 30201-HUM-36-11.4/34.52, 201.112 Bridge Rail Replacement/Upgrade, PPNO 2363, $23.6mil (Project 302)
30 45 0 6 0 0 0 0 0 0 0 81 $23.6 3
323 17507-LA-2-13.1/14.3, 201.335 Stormwater, PPNO 4420, $8.9mil (Project 175) 0 0 0 0 0 0 0 0 0 30 0 30 $8.9 3
324 12005-SB-101-11.0, 201.361 ADA Access Improvements, PPNO 2468, $7.1mil (Project 120)
0 14 0 0 0 0 0 10 0 0 0 24 $7.1 3
325 23108-SBD-40-R105.3/R105.6, 201.250 Safety Roadside Rest Area Rehabilitation, PPNO 0206L, $11mil (Project 231)
0 16 0 0 0 0 0 20 0 0 0 36 $11.0 3
Page 25 of 30

Projects
Rank ID Description
Wo
rker
S
afet
y
Use
r S
afet
y
Hea
lth
Ass
et
Pre
serv
atio
n
Use
r C
ost
s
Del
ay
Red
uct
ion
Sys
tem
R
elia
bil
ity
Tra
vel
Qu
alit
y
Fre
igh
t C
orr
ido
rs
Air
& W
ater
Q
ual
ity
Co
mp
lete
S
tree
ts
Min
imiz
e d
amag
e to
en
viro
nm
ent
Max
imiz
e eq
uit
y an
d a
cces
s to
m
ult
imo
dal
tr
ansp
ort
atio
n
syst
ems
Safety and HealthStewardship and
EfficiencySystem Performance
Sustainability, Livability, and Economy
Scoring Summary
Min
imiz
e i
nju
rie
s
and
fat
alit
ies
of
wo
rker
s
Min
imiz
e i
nju
rie
s
and
fat
alit
ies
of
use
rs
Max
imiz
e h
ealt
h
of
Cal
ifo
rnia
re
sid
ents
Min
imiz
e C
ost
to
T
axp
ayer
s
Pro
ject
Val
ue
Pro
ject
Co
st (
$mil
)
Pro
ject
Val
ue-
to-C
ost
Rat
io
Min
imiz
e in
con
ven
ien
ce t
o
use
rs o
f th
e h
igh
way
sys
tem
Max
imiz
e q
ual
ity
of
trav
el f
or
all
mo
des
Min
imiz
e d
isru
pti
on
of
the
eco
no
my
326 801-MEN-128-0.0/17.9, 201.121 Roadway Preservation (CAPM), PPNO 4598, $21.2mil (Project 8)
15 24 10 8 1 0 0 10 0 2 0 70 $21.2 3
327 18107-LA-134-2.6/4.8, 201.335 Stormwater, PPNO 4816, $3.1mil (Project 181) 0 0 0 0 0 0 0 0 0 10 0 10 $3.1 3
328 3202-TRI-299-3.6, 201.235 Roadside Safety Improvements, PPNO 3559, $4.3mil (Project 32)
3 10 0 0 0 0 0 0 0 0 0 13 $4.3 3
329 37812-ORA-74-0.1/1.8, 201.361 ADA Access Improvements, PPNO 4097C, $4.2mil (Project 378)
0 13 0 0 0 0 0 0 0 0 0 13 $4.2 3
330 24510-TUO-120-32.7/R56.5, 201.121 Roadway Preservation (CAPM), PPNO 0335, $25.4mil (Project 245)
15 26 20 5 0 0 0 10 1 0 0 77 $25.4 3
331 11205-SLO-1-34.4/44.4, 201.121 Roadway Preservation (CAPM), PPNO 2587, $17.9mil (Project 112)
15 24 0 10 1 0 0 0 0 0 0 51 $17.9 3
332 21608-RIV-74-7.0/R14.4, 201.335 Stormwater, PPNO 3001Y, $4.2mil (Project 216) 0 0 0 0 0 0 0 0 0 12 0 12 $4.2 3
333 3402-LAS-299-25.5, 201.352 Maintenance Facilities, PPNO 3600, $8.1mil (Project 34) 3 0 0 0 0 0 0 20 0 0 0 23 $8.1 3
334 12506-KER-99-19.5/21.1, 201.322 Trans Permit Requirements for Bridges, PPNO 6681, $11.2mil (Project 125)
0 0 0 29 0 0 0 0 2 0 0 31 $11.2 3
335 15207-VEN-23-R3.3/R11.5, 201.122 Roadway Rehabilitation (2R), PPNO 4688, $87.7mil (Project 152)
30 40 13 97 23 0 0 20 5 12 0 240 $87.7 3
336 17807-LA-1-17.4/62.8, 201.335 Stormwater, PPNO 4722, $8.8mil (Project 178) 0 0 0 0 0 0 0 0 0 24 0 24 $8.8 3
337 29204-MRN-1-22.8/31.2, 201.121 Roadway Preservation (CAPM), PPNO 1480A, $18.5mil (Project 292)
15 26 0 9 0 0 0 0 0 0 0 50 $18.5 3
338 18007-LA-101-1.7/6.6, 201.335 Stormwater, PPNO 4814, $4.9mil (Project 180) 0 0 0 0 0 0 0 0 0 13 0 13 $4.9 3
Page 26 of 30

Projects
Rank ID Description
Wo
rker
S
afet
y
Use
r S
afet
y
Hea
lth
Ass
et
Pre
serv
atio
n
Use
r C
ost
s
Del
ay
Red
uct
ion
Sys
tem
R
elia
bil
ity
Tra
vel
Qu
alit
y
Fre
igh
t C
orr
ido
rs
Air
& W
ater
Q
ual
ity
Co
mp
lete
S
tree
ts
Min
imiz
e d
amag
e to
en
viro
nm
ent
Max
imiz
e eq
uit
y an
d a
cces
s to
m
ult
imo
dal
tr
ansp
ort
atio
n
syst
ems
Safety and HealthStewardship and
EfficiencySystem Performance
Sustainability, Livability, and Economy
Scoring Summary
Min
imiz
e i
nju
rie
s
and
fat
alit
ies
of
wo
rker
s
Min
imiz
e i
nju
rie
s
and
fat
alit
ies
of
use
rs
Max
imiz
e h
ealt
h
of
Cal
ifo
rnia
re
sid
ents
Min
imiz
e C
ost
to
T
axp
ayer
s
Pro
ject
Val
ue
Pro
ject
Co
st (
$mil
)
Pro
ject
Val
ue-
to-C
ost
Rat
io
Min
imiz
e in
con
ven
ien
ce t
o
use
rs o
f th
e h
igh
way
sys
tem
Max
imiz
e q
ual
ity
of
trav
el f
or
all
mo
des
Min
imiz
e d
isru
pti
on
of
the
eco
no
my
339 21708-RIV-215-R9.0/R16.0, 201.335 Stormwater, PPNO 3002A, $11.3mil (Project 217) 0 0 0 0 0 0 0 0 0 30 0 30 $11.3 3
340 34107-LA-213-0/7.984, 201.361 ADA Access Improvements, PPNO 4743, $5.7mil (Project 341)
0 15 0 0 0 0 0 0 0 0 0 15 $5.7 3
341 36109-MNO-395-51.15/51.69, 201.361 ADA Access Improvements, PPNO '0659, $3.4mil (Project 361)
0 9 0 0 0 0 0 0 0 0 0 9 $3.4 3
342 6203-NEV-80-29.1/29.4, 201.150 Roadway Protective Betterment, PPNO 4287, $12.5mil (Project 62)
8 25 0 0 0 0 0 0 0 0 0 33 $12.5 3
343 15307-LA-210-R0.0/R9.7, 201.122 Roadway Rehabilitation (2R), PPNO 4801, $125.4mil (Project 153)
30 41 33 100 50 0 0 20 4 30 0 309 $125.4 2
344 7004-SF-1-VAR, 201.015 Collision Severity Reduction, PPNO 1489B, $9.4mil (Project 70) 3 0 0 0 0 0 0 20 0 0 0 23 $9.4 2
345 33005-SLO-41-14.2/16, 201.361 ADA Access Improvements, PPNO 2532, $7.2mil (Project 330)
0 17 0 0 0 0 0 0 0 0 0 17 $7.2 2
346 25410-MER-99-R12.7/17.6, 201.122 Roadway Rehabilitation (2R), PPNO 3089, $63.9mil (Project 254)
15 31 12 62 7 0 0 20 1 5 0 152 $63.9 2
347 1301-MEN-101-58.9/82.5, 201.235 Roadside Safety Improvements, PPNO 4574, $10.2mil (Project 13)
15 9 0 0 0 0 0 0 0 0 0 24 $10.2 2
348 32404-SON-101-29.3/54.2, 201.122 Roadway Rehabilitation (2R), PPNO 1482F, $82.1mil (Project 324)
23 29 0 91 31 0 0 0 13 5 0 192 $82.1 2
349 29304-SCL-280-11.5/20.6, 201.121 Roadway Preservation (CAPM), PPNO 0449A, $59.5mil (Project 293)
30 31 0 25 17 0 0 0 5 29 0 137 $59.5 2
350 9204-SON-116-8.5/10.5, 201.335 Stormwater, PPNO 1487F, $5.3mil (Project 92) 0 0 0 0 0 0 0 0 0 12 0 12 $5.3 2
351 33507-LA-105-R7.8/R10.3, 201.335 Stormwater, PPNO 4908, $3.7mil (Project 335) 0 0 0 0 0 0 0 0 0 8 0 8 $3.7 2
Page 27 of 30

Projects
Rank ID Description
Wo
rker
S
afet
y
Use
r S
afet
y
Hea
lth
Ass
et
Pre
serv
atio
n
Use
r C
ost
s
Del
ay
Red
uct
ion
Sys
tem
R
elia
bil
ity
Tra
vel
Qu
alit
y
Fre
igh
t C
orr
ido
rs
Air
& W
ater
Q
ual
ity
Co
mp
lete
S
tree
ts
Min
imiz
e d
amag
e to
en
viro
nm
ent
Max
imiz
e eq
uit
y an
d a
cces
s to
m
ult
imo
dal
tr
ansp
ort
atio
n
syst
ems
Safety and HealthStewardship and
EfficiencySystem Performance
Sustainability, Livability, and Economy
Scoring Summary
Min
imiz
e i
nju
rie
s
and
fat
alit
ies
of
wo
rker
s
Min
imiz
e i
nju
rie
s
and
fat
alit
ies
of
use
rs
Max
imiz
e h
ealt
h
of
Cal
ifo
rnia
re
sid
ents
Min
imiz
e C
ost
to
T
axp
ayer
s
Pro
ject
Val
ue
Pro
ject
Co
st (
$mil
)
Pro
ject
Val
ue-
to-C
ost
Rat
io
Min
imiz
e in
con
ven
ien
ce t
o
use
rs o
f th
e h
igh
way
sys
tem
Max
imiz
e q
ual
ity
of
trav
el f
or
all
mo
des
Min
imiz
e d
isru
pti
on
of
the
eco
no
my
352 17407-LA-110-3.8/6.5, 201.335 Stormwater, PPNO 4174, $14.4mil (Project 174) 0 0 0 0 0 0 0 0 0 30 0 30 $14.4 2
353 35808-SBD-40-R125.0/R154.6, 201.015 Collision Severity Reduction, PPNO 3003J, $32.3mil (Project 358)
30 36 0 0 0 0 0 0 0 0 0 66 $32.3 2
354 38012-ORA-74-0.1/1.8, 201.361 ADA Access Improvements, PPNO 4097C, $4.2mil (Project 380)
0 8 0 0 0 0 0 0 0 0 0 8 $4.2 2
355 19008-SBD-40-R75.0/R100.0, 201.015 Collision Severity Reduction, PPNO 3001R, $35.1mil (Project 190)
30 41 0 0 0 0 0 0 0 0 0 71 $35.1 2
356 8204-ALA-680-R12.4/R21.9, 201.122 Roadway Rehabilitation (2R), PPNO 0481P, $142.1mil (Project 82)
30 38 9 97 50 0 0 10 20 23 0 278 $142.1 2
357 25910-STA-5-27.0/27.5, 201.250 Safety Roadside Rest Area Rehabilitation, PPNO 3144, $11mil (Project 259)
0 21 0 0 0 0 0 0 0 0 0 21 $11.0 2
358 17107-LA-110-13.4/23.1, 201.335 Stormwater, PPNO 3279, $15.9mil (Project 171) 0 0 0 0 0 0 0 0 0 30 0 30 $15.9 2
359 25210-SJ-4-17.2, 201.322 Trans Permit Requirements for Bridges, PPNO 3148, $10.8mil (Project 252)
0 0 0 20 0 0 0 0 0 0 0 20 $10.8 2
360 36510-MER-99-20.5/24.3, 201.122 Roadway Rehabilitation (2R), PPNO 5431, $63.1mil (Project 365)
15 30 0 53 5 0 0 0 7 5 0 114 $63.1 2
361 31203-SAC-5-14.9/24.9, 201.120 Roadway Rehabilitation (3R), PPNO 5854, $175mil (Project 312)
60 67 0 100 39 0 0 0 20 24 0 310 $175.0 2
362 9304-SM-280-7.0/7.7, 201.335 Stormwater, PPNO 1487G, $4.5mil (Project 93) 0 0 0 0 0 0 0 0 0 8 0 8 $4.5 2
363 20108-SBD-15-30.8/42.5, 201.122 Roadway Rehabilitation (2R), PPNO 3003U, $173.1mil (Project 201)
30 32 30 94 20 0 0 10 29 30 0 275 $173.1 2
364 30803-BUT-32-8.8/9.54, 201.361 ADA Access Improvements, PPNO 2112, $5.3mil (Project 308)
0 8 0 0 0 0 0 0 0 0 0 8 $5.3 1
Page 28 of 30

Projects
Rank ID Description
Wo
rker
S
afet
y
Use
r S
afet
y
Hea
lth
Ass
et
Pre
serv
atio
n
Use
r C
ost
s
Del
ay
Red
uct
ion
Sys
tem
R
elia
bil
ity
Tra
vel
Qu
alit
y
Fre
igh
t C
orr
ido
rs
Air
& W
ater
Q
ual
ity
Co
mp
lete
S
tree
ts
Min
imiz
e d
amag
e to
en
viro
nm
ent
Max
imiz
e eq
uit
y an
d a
cces
s to
m
ult
imo
dal
tr
ansp
ort
atio
n
syst
ems
Safety and HealthStewardship and
EfficiencySystem Performance
Sustainability, Livability, and Economy
Scoring Summary
Min
imiz
e i
nju
rie
s
and
fat
alit
ies
of
wo
rker
s
Min
imiz
e i
nju
rie
s
and
fat
alit
ies
of
use
rs
Max
imiz
e h
ealt
h
of
Cal
ifo
rnia
re
sid
ents
Min
imiz
e C
ost
to
T
axp
ayer
s
Pro
ject
Val
ue
Pro
ject
Co
st (
$mil
)
Pro
ject
Val
ue-
to-C
ost
Rat
io
Min
imiz
e in
con
ven
ien
ce t
o
use
rs o
f th
e h
igh
way
sys
tem
Max
imiz
e q
ual
ity
of
trav
el f
or
all
mo
des
Min
imiz
e d
isru
pti
on
of
the
eco
no
my
365 17207-LA-210-R0.0/R9.7, 201.335 Stormwater, PPNO 3884, $20.4mil (Project 172) 0 0 0 0 0 0 0 0 0 30 0 30 $20.4 1
366 29903-YUB-70-16.2/25.8, 201.010 Safety Improvements, PPNO 9819, $101.7mil (Project 299)
30 65 19 0 0 0 0 30 0 0 0 145 $101.7 1
367 33707-LA-107-0/4.8, 201.361 ADA Access Improvements, PPNO 4749, $5.7mil (Project 337)
0 8 0 0 0 0 0 0 0 0 0 8 $5.7 1
368 32204-SF-101-4.12/R4.25, 201.110 Bridge Rehabilitation, PPNO 1483E, $125.9mil (Project 322)
30 42 0 67 0 0 0 0 0 0 0 138 $125.9 1
369 30001-DN-101-25.8/27.3, 201.361 ADA Access Improvements, PPNO 1095, $12.1mil (Project 300)
0 13 0 0 0 0 0 0 0 0 0 13 $12.1 1
370 34407-LA-5-1.68/1.68, 201.351 Equipment Facilities, PPNO 5031, $29mil (Project 344) 30 0 0 0 0 0 0 0 0 0 0 30 $29.0 1
371 32304-SOL-80-4.43/4.43, 201.322 Trans Permit Requirements for Bridges, PPNO '0481R, $22mil (Project 323)
0 0 0 22 0 0 0 0 0 0 0 22 $22.0 1
372 17307-LA-10-16.6/30.1, 201.335 Stormwater, PPNO 3923, $32.8mil (Project 173) 0 0 0 0 0 0 0 0 0 30 0 30 $32.8 1
373 27411-SD-78-2.5/2.7, 201.335 Stormwater, PPNO 1125, $5.6mil (Project 274) 0 0 0 0 0 0 0 0 0 4 0 4 $5.6 1
374 30702-TRI-299-VAR, 201.235 Roadside Safety Improvements, PPNO 3555, $4mil (Project 307)
3 0 0 0 0 0 0 0 0 0 0 3 $4.0 1
375 29012-ORA-5-10.1/10.6, 201.335 Stormwater, PPNO 2632A, $4.4mil (Project 290) 0 0 0 0 0 0 0 0 0 3 0 3 $4.4 1
376 30301-LAK-1-VAR, 201.015 Collision Severity Reduction, PPNO 7018, $6.7mil (Project 303) 3 0 0 0 0 0 0 0 0 0 0 3 $6.7 0
377 18207-LA-1-8.3/9.9, 201.335 Stormwater, PPNO 4913, $2.3mil (Project 182) 0 0 0 0 0 0 0 0 0 1 0 1 $2.3 0
Page 29 of 30

Projects
Rank ID Description
Wo
rker
S
afet
y
Use
r S
afet
y
Hea
lth
Ass
et
Pre
serv
atio
n
Use
r C
ost
s
Del
ay
Red
uct
ion
Sys
tem
R
elia
bil
ity
Tra
vel
Qu
alit
y
Fre
igh
t C
orr
ido
rs
Air
& W
ater
Q
ual
ity
Co
mp
lete
S
tree
ts
Min
imiz
e d
amag
e to
en
viro
nm
ent
Max
imiz
e eq
uit
y an
d a
cces
s to
m
ult
imo
dal
tr
ansp
ort
atio
n
syst
ems
Safety and HealthStewardship and
EfficiencySystem Performance
Sustainability, Livability, and Economy
Scoring Summary
Min
imiz
e i
nju
rie
s
and
fat
alit
ies
of
wo
rker
s
Min
imiz
e i
nju
rie
s
and
fat
alit
ies
of
use
rs
Max
imiz
e h
ealt
h
of
Cal
ifo
rnia
re
sid
ents
Min
imiz
e C
ost
to
T
axp
ayer
s
Pro
ject
Val
ue
Pro
ject
Co
st (
$mil
)
Pro
ject
Val
ue-
to-C
ost
Rat
io
Min
imiz
e in
con
ven
ien
ce t
o
use
rs o
f th
e h
igh
way
sys
tem
Max
imiz
e q
ual
ity
of
trav
el f
or
all
mo
des
Min
imiz
e d
isru
pti
on
of
the
eco
no
my
378 28912-ORA-142-3.5/4.7, 201.335 Stormwater, PPNO 5380A, $5.7mil (Project 289) 0 0 0 0 0 0 0 0 0 2 0 2 $5.7 0
379 10204-SON-116-0.0/46.8, 201.240 Roadside Protection and Restoration, PPNO 1490B, $5.6mil (Project 102)
0 0 0 0 0 0 0 0 0 0 0 0 $5.6 0
380 13206-MAD-VAR-, 201.240 Roadside Protection and Restoration, PPNO 6750, $2mil (Project 132)
0 0 0 0 0 0 0 0 0 0 0 0 $2.0 0
381 23008-RIV-10-VAR, 201.240 Roadside Protection and Restoration, PPNO 3002Q, $3.2mil (Project 230)
0 0 0 0 0 0 0 0 0 0 0 0 $3.2 0
382 32805-SCR-0-VAR, 201.378 ADA Pedestrian Infrastructure, PPNO 2590, $3mil (Project 328)
0 0 0 0 0 0 0 0 0 0 0 0 $3.0 0
383 35008-RIV-10-6/70, 201.240 Roadside Protection and Restoration, PPNO 3002Q, $7.8mil (Project 350)
0 0 0 0 0 0 0 0 0 0 0 0 $7.8 0
384 37210-SJ-99-VAR, 201.361 ADA Access Improvements, PPNO 3149, $3.7mil (Project 372)
0 0 0 0 0 0 0 0 0 0 0 0 $3.7 0
Page 30 of 30