sharing hyperlinks on facebook. determinants of receiving...
TRANSCRIPT
1
Wojciech Walczak
Sharing Hyperlinks on Facebook. Determinants of Receiving Feedback1
KEYWORDS
social inequalities, Social Network Services, new media
ABSTRACT
In 2010 Facebook’s users shared, on average, one million links every 20 minutes. This
ecosystem of information sharing plays an important social role: it builds and reaffirms social
position of engaged individuals. The aim of this article is to study which factors contribute to
the amount of feedback received by a particular user. An analysis of 1063 user profiles who
shared the same link with their friends is performed (the link pointed at a hit music video).
The study shows that older users, women, users with smaller number of friends, less active
ones, the ones with smaller “cultural competencies”, users less prone to add a comment to a
link, and—most of all—the ones who have received less feedback in the past are predestined
to receive less social response to their actions.
Studies of the motivations to use internet community services indicate that such activity
mainly serves to meet two basic needs: the need for self-presentation and the need of
affiliation2. One of the most popular forms of activity is sharing with one’s friends the
hyperlinks to other web pages (also referred to as links further in the paper). As demonstrated
by K. Baek et al., the need of self-presentation is met because sharing content with other users
allows one to manifest their interests, views, and tastes3. At the same time, the user who
receives clicks on “like” and comments from her friends may—at least partially—fulfil the
need of affiliation.
The aim of this paper was to examine which factors may influence the fact that some
users receive more feedback, and thus may satisfy their need of affiliation using
Facebook.com to a greater extent than others. To eliminate the influence of various types of
1 The project was co-financed by the Nicolaus Copernicus University in Toruń (Pol. Uniwersytet Mikołaja
Kopernika w Toruniu – UMK) as part of the Faculty Research Grant No. 1434-H realized at the Institute of
Sociology of the Faculty of Humanities of UMK. 2 A. Nadkami, S.G. Hofmann, Why do people use Facebook?, “Personality and Individual Differences” Vol. 52
(2012), No. 3, p. 243–249. 3 K. Baek, A. Holton, D. Harp, C. Yaschur, The links that bind: Uncovering novel motivations for linking on
Facebook, “Computers in Human Behavior” Vol. 27 (2011), No. 6, p. 2243–2248.
2
content shared by users, a link was singled out, which was shared most often in a sample of
23,578 users of the service. This link, pointing to a music video found at YouTube.com, was
shared by 1,063 members of the original sample4. The performed analysis focused on
determining the factors which could influence the uneven distribution of feedback received by
individual users.
The study used only data which could be gathered from Facebook.com. One
dependent variable was constructed, the Level of Received Feedback (LRF), indicating how
many friends clicked the “like” button or added a reply to the link posted in the service by a
given user.
Using secondary data influenced the choice of variables and narrowed the available
scope of research questions. The data shared by the users allowed to ask about the
relationships between gender, age, and LRF. The information about current residence enabled
the question about the relationship between the population of locality and LRF. Since the link
identified as the most popular pointed at a music video, it was also possible to ask the
question how the dynamics of becoming a musical hit was related to LRF.
Subsequent research questions were associated with variables typical of the studied
environment, i.e. Facebook.com. The following independent variables were distinguished:
Number of user’s friends, Level of Facebook.com-related skills, Cultural competency level,
Average daily activity, Average level of received feedback per link (before the publication of
the link defined as the most popular here), as well as Author’s comments. These variables are
discussed in more detail in the Methodology section of this paper.
The variables of Age, Gender, Population of locality, and Average daily activity were
treated in an exploratory fashion, without trying to determine the direction of relationships
between them and the LRF variable. In the case of the variable Publication of the link during
peak popularity period it was assumed that in the period when the link was shared most
frequently—and thus when it was most popular—the average values of the LRF variable were
higher than in other period. Similarly in the case of the Author’s comments variable it was
assumed that a commentary attached to the link would encourage friends to interact and
therefore would positively correlate with the LRF variable.
In regard to other variables, they were assumed to be specific indicators of the levels
of cultural and social capital of an individual. It was also assumed that individuals of higher
4 The sample of 23,578 users is also further referred to as Sample I, while the set of 1,063 intentionally selected
users is named Sample II.
3
level of social capital5 would receive more feedback, since the individuals with lower levels
of this capital would more often interact with them—by using the “like” button and replying
with a comment—in order to gain access to resources involved in establishing this kind of
relationships (popularity, prestige, social respect)6. Therefore, a positive direction of the
relationship was expected: the higher the values of such variables as Number of friends, Level
of Facebook.com-related skills, Cultural competency level, Average daily activity, and
Average level of received feedback per link, the higher the value of the LRF variable.
Methodology
Facebook.com enables third parties—and therefore also researchers—to create applications
using the collected data. Every user of the service can grant to an external application—
created by any individual, company, or institution—the rights to access her own data and the
data of her friends. This is how the games are made, which can detect by themselves if the
user has friends who play them and what their scores are; applications recommending music,
movies, or places to visit based on the data regarding cultural and tourism activity of friends;
applications providing extra functionalities which Facebook does not have (such as a “dislike”
button or the detector of people who deleted the user from the list of friends); applications
analyzing users’ activity, etc. Facebook.com serves as the intermediary in the transaction of
exchanging data for a service (i.e., the ability to use the application) between the user and the
author of the application and guarantees that the latter can only access the data to which it is
entitled, and only the data which the users agreed to share with third party applications in their
privacy settings. In the case of the application developed to carry out this research, the
Application Programming Interface (API) called Graph API was used7.
Independent variables
Gender. The gender of the participants was determined on the basis of users’ profile data.
Users are not requiring to disclose their gender, therefore the value of this variable can be
unspecified. While there were 306 such people in Sample I, not a single one of them found
5 The concept of social capital originating from Pierre Bourdieu is adopted here, where social capital is an
attribute of an individual and not the community; thus, social capital is an—actual or potential—individual
resource associated with the membership of a group providing support, reliability, or recognition. Cf. P.
Bourdieu, The forms of capital, in: Handbook of Theory and Research for the Sociology of Education, ed. by
J.G. Richardson, New York 1986, p. 241–258. 6 N. Lin, Social Capital: A Theory of Social Structure and Action, New York 2002.
7 Cf.: Facebook Inc., Graph API, https://developers.facebook.com/docs/reference/api/ [accessed: 20 Jul 2013].
4
her way to Sample II. It is worth to mention that while women made up 48.8 % of Sample I,
their proportion in Sample II equalled 66.1 %.
Age. The age of the users was determined on the basis of their birthdates found in their
profile data. Out of 23,578 users, 10,526 (44.64 %) did not disclose the year of birth. The
average age was 30.24 years (SD = 9.08) in Sample I and 28.57 years (SD = 6.42) in Sample
II. The minimum and maximum values of this variable were 18 and 72 years, respectively. It
is also worth to note that only one person who declared the age of 75 was found in Sample II.
The second oldest person declared 61, and the third 58 years. Only 5 % of people in Sample II
were 40 years old or older (compared to 11% of users aged 40+ years in Sample I).
Population of locality. Ordinal variable taking one of 8 possible values: 1. – a city
with the population of 500,000 or more inhabitants; 2. – a city with the population between
400,000 and 499,999 inhabitants; 3. – a city with the population between 300,000 and
399,999 inhabitants; 4. – a city with the population between 200,000 and 299,999 inhabitants;
5. – a city with a population between 100,000 and 199,999 inhabitants; 6. – a town with the
population of less than 100,000 inhabitants; 7. – a village. The eighth possible value
corresponds to the lack of data: either the locality was not specified by the user, or could not
be identified (which is e.g. the case of localities outside the territory of Poland). For Sample
II, the size of locality was identified for 650 (61.15 %) users. The three main categories in this
number are: 1. (42.8 %), 4. (22.6 %), and 6. (14.6 %).
Number of friends. The employed API does not allow to obtain the number of user’s
friends. However, this number can be estimated based on the user’s activity feed, which
contains the information about adding users to the friends list, among other things. It should
be remembered, however, that a user can limit the access to her activity feed (1,277 people–
5.4 % of Sample I did so). Moreover, due to the lack of information on breaking relationships,
this number may be overestimated. The largest possible number of friends at Facebook is
4,999 people, while the gathered data indicate that one of the users had 6,174 friends. It
means this number was overstated by 1,175 at least. This, however, is an extreme example.
Three quarters of the users in Sample I have less than 300 friends, and only 3% of this sample
has more than 1000.
Level of Facebook.com-related skills (or FB skills in short). This variable was
estimated based on the variety of actions taken by a user within the service. Thirty types of
activity were distinguished (liking, replying, sharing content, creating and participating in
events, pinning offers, playing games, using applications, editing profile fields, inviting,
evaluating photos, subscribing, recommending, indicating family members, etc.). The variable
5
is a kind of index, where performing a given activity at least once increases the index value by
1 point. The theoretical minimum is 0 (for a user who just created an account or disabled the
access to her activity feed in her profile), while the maximum is 30. Sample II contained 76
users (7.1 %) with the value of 0. The number of activity types for the first quartile was 10, 14
for the second, and 17 for the third.
Level of cultural competencies (Cultural competencies in short). This variable was
estimated based on the variety of fan pages liked by the user of Facebook.com. “Liking” a
page means that the newest—but not necessarily all—entries published on that page will
appear in the user’s news feed. Each page is assigned a category chosen by its creator.
The exhaustive list of categories in the number of studied users equals 206, therefore
the index of Cultural competencies takes values between 0 and 206. The value of 0 means that
the user either does not “like” any Facebook.com page or had made it impossible to download
these data through her privacy settings. There were 59 such users (5.6 %) in Sample II. The
first, second, and third quartiles contained 26, 44, and 66 different page categories,
respectively. The maximum value assumed by this variable was 159 categories. The index of
Cultural competencies, just like the FB skills index, only measures the range of competencies
or skills of the user but does not say anything about its intensity. For instance, a user who
“likes” several hundred “Sport” category pages but does not like pages from other categories
will have the index value of 1, while the user who likes only two pages—e.g. one in each of
the “Sport” and “Society & Culture Website” categories—will get the index value of 2.
Average daily activity. This variable is calculated based on the user’s activity feed.
The date of the first and last activities is used to calculate the number of days the user has an
account in the service. Subsequently all the activities are counted, and the average is
calculated based on these two values. This value may equal 0 if the user did not allow viewing
her feed (there 80 such cases in Sample II, or 7.5 %) or any high number which only depends
on the user’s activity. The average for the first quartile was 0.69 activities per day, 1.22 for
the second, and 2.28 activities per day for the third. The most active user took on average
29.17 actions daily (in the period of 139 days). It should be remembered that the activity feed
in the service does not encompass all actions. For instance, it does not take into account
private messages or chats at all.
Average level of received feedback per link. This variable shows how many people on
average clicked the “like” button and replied to the links shared by a given user. Auto likes
and auto replies were not taken into account. Moreover, only these hyperlinks were counted
which were published earlier than the link identified as the most popular. The lowest possible
6
value of this variable is 0, which may mean that one of two events took place. The first is that
a user who shared links with other users before, has never received any feedback in the form
of a click on “like” or a reply. The second is that the user may have never used the ability to
share hyperlinks with her friends. However, neither of these two alternatives took place in
Sample II. The value of this variable for the user with the lowest average was 0.06325
feedbacks per shared link (a total of 21 likes and replies compared to 332 published links). On
the other hand, the maximum average number of feedbacks per link was 12.30, with 931
published links. The average equalled 0.74 for the first quartile, 1.15 for the second, and 1.65
for the third.
Publication of the link during peak popularity period. A binary variable. The studied
link was published by 1063 users in 672 days. Half of the users (50.2 %) shared the link
between 146 and 226 days after the first publication of this hyperlink. Therefore, 50.2 % cases
of publication of the hyperlink under investigation correspond to 11.90 % of the time of study.
To sum up, the period from day 146 to day 226 after the first publication of the link is
considered its peak popularity period.
Author’s comment. A binary variable. Users who share a hyperlink have the
opportunity to attach a commentary. If the comment field contained only the hyperlink, it was
not considered a commentary. Owing to this, only the actual commentaries added by the users
were taken into account. Such commentaries were added by 552 users (21.9 %). They usually
advertised the published link: “great lyrics, superb clip and beautiful song”, “it’s an
earworm!”, “that’s really awesome”.
The dependent variable
Level of Received Feedback (LRF). It equals the sum of “like” clicks and the number of
people who wrote a reply under the post containing the hyperlink. Neither autoreplies nor
autolikes of one’s own post were counted. If the same person—other than the author of the
post—clicked on “like” and wrote a reply, she was counted twice. For example, if five
people—including the author of the post—clicked to “like” it, and 3 different people—
without the author of the post—wrote a total of 10 replies under it, the value of the Feedback
variable amounted to 7 (4 clicks on “like” and 3 commentators). In 85 cases (8 %), users
received no feedback at all. This value equalled 2 for the first quartile, 4 for the second, and 7
for the third. The maximum value reached by this variable was 61.
Selection of the sample

7
In order to gather the data, an open application working in the Facebook.com environment
was developed. Every user who launched this application was rewarded with a report on her
own and her friends’ activity in the service. As is known, there are no methods allowing to
effectively reach every user of the internet8, or every Facebook.com user, which makes it
difficult or even impossible to carry out research on representative samples. The sample
selection method used in this study bears the features of the snowball method. First, it was
assumed that the ability to use an application to generate a report on one’s friends’ activity
will cause the information about the application to be spread voluntarily, which would
increase the number of its users. This effect was achieved, at the cost of losing control of the
recruitment process. Second, following the logic of functioning of social applications, each
user shared not only her own data but also the data her friends allowed to be shared with
applications launched by third parties. The result was, in turn, that the scope of gathered data
was broader than it would be if the traditional form of the snowball method was used, since a
single respondent provided her own data and the data of her friends (at least to the extent to
which they agreed to share them using their privacy settings). Simultaneously, it means that
the risk of sample bias has to be seen differently. The trend to recruit people similar to the
recruiter becomes less significant, while what gains significance—due to a broader scale—is
the sample bias due to the similarity to people one has among her friends in the service. For
instance, a person who has 2,000 friends (let us assume that 1,500 people from this pool
enabled the gathering of data used in this study in their privacy settings), who are similar to
one another in some respect (like age of locality of residence), may significantly influence the
shape of the sample.
The data which constitute the basis of the below analyses were gathered in the period
from January to the end of May 2013. Until that time, 127 people used the application, which
allowed the gathering of data shared by a total of 23,578 people. This number does not take
into consideration people below 18 years of age, who were excluded from the study.
From among 23,578 users, 1,063 were included in the research. First, all those who
never published any link in the service or blocked the access to these data in the service were
excluded. There were 1,289 such users (18.2 %) in the sample of 23,578 people. Second, the
users who declared to be more than 75 years old were excluded; there were 118 (0.5 %) of
them. In this case, it was based on contextual knowledge: some users provide a false year of
8 D. Batorski, M. Olcoń–Kubicka, Prowadzenie badań przez Internet – podstawowe zagadnienia metodologiczne
[Carrying out research via the Internet – basic methodological issues], “Studia Socjologiczne” [Sociological
studies] Vol. 182 (2006), No. 3, p. 99–132.
8
birth, much overstating it. Third, all persons who did not meet the key criterion were
excluded, that is, those who did not share the hyperlink which was identified as the most often
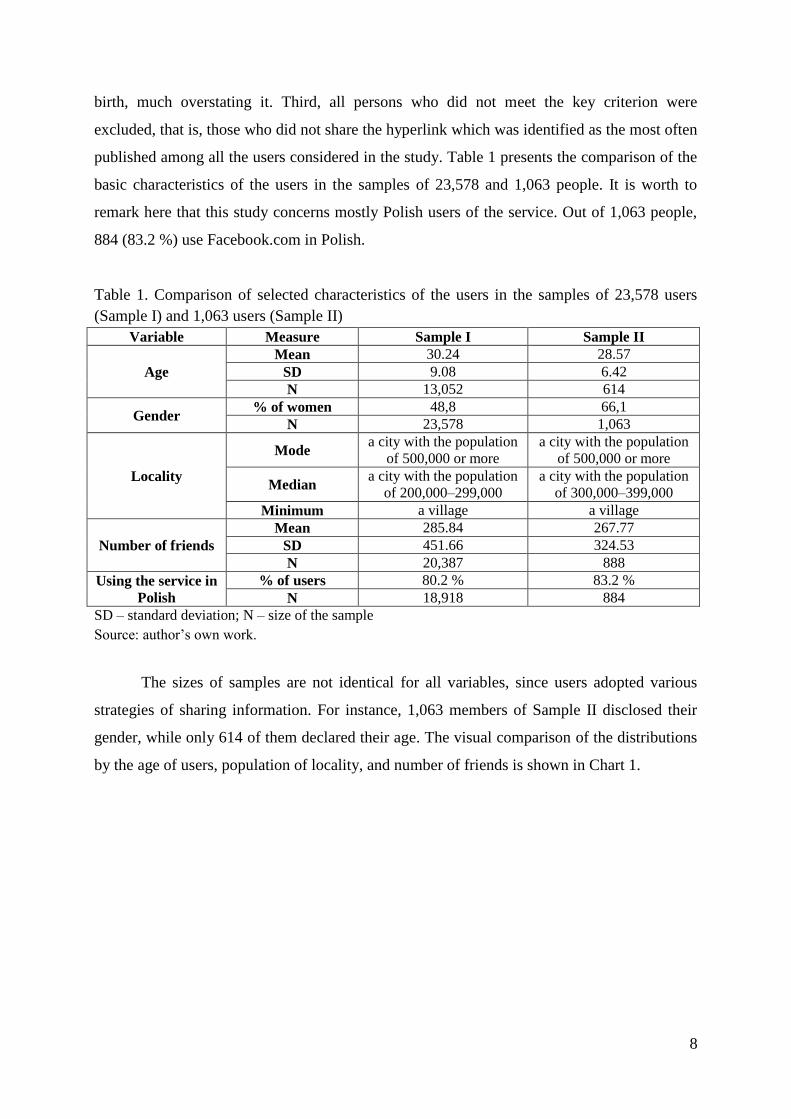
published among all the users considered in the study. Table 1 presents the comparison of the
basic characteristics of the users in the samples of 23,578 and 1,063 people. It is worth to
remark here that this study concerns mostly Polish users of the service. Out of 1,063 people,
884 (83.2 %) use Facebook.com in Polish.
Table 1. Comparison of selected characteristics of the users in the samples of 23,578 users
(Sample I) and 1,063 users (Sample II)
Variable Measure Sample I Sample II
Age
Mean 30.24 28.57
SD 9.08 6.42
N 13,052 614
Gender % of women 48,8 66,1
N 23,578 1,063
Locality
Mode a city with the population
of 500,000 or more
a city with the population
of 500,000 or more
Median a city with the population
of 200,000–299,000
a city with the population
of 300,000–399,000
Minimum a village a village
Number of friends
Mean 285.84 267.77
SD 451.66 324.53
N 20,387 888
Using the service in
Polish
% of users 80.2 % 83.2 %
N 18,918 884
SD – standard deviation; N – size of the sample
Source: author’s own work.
The sizes of samples are not identical for all variables, since users adopted various
strategies of sharing information. For instance, 1,063 members of Sample II disclosed their
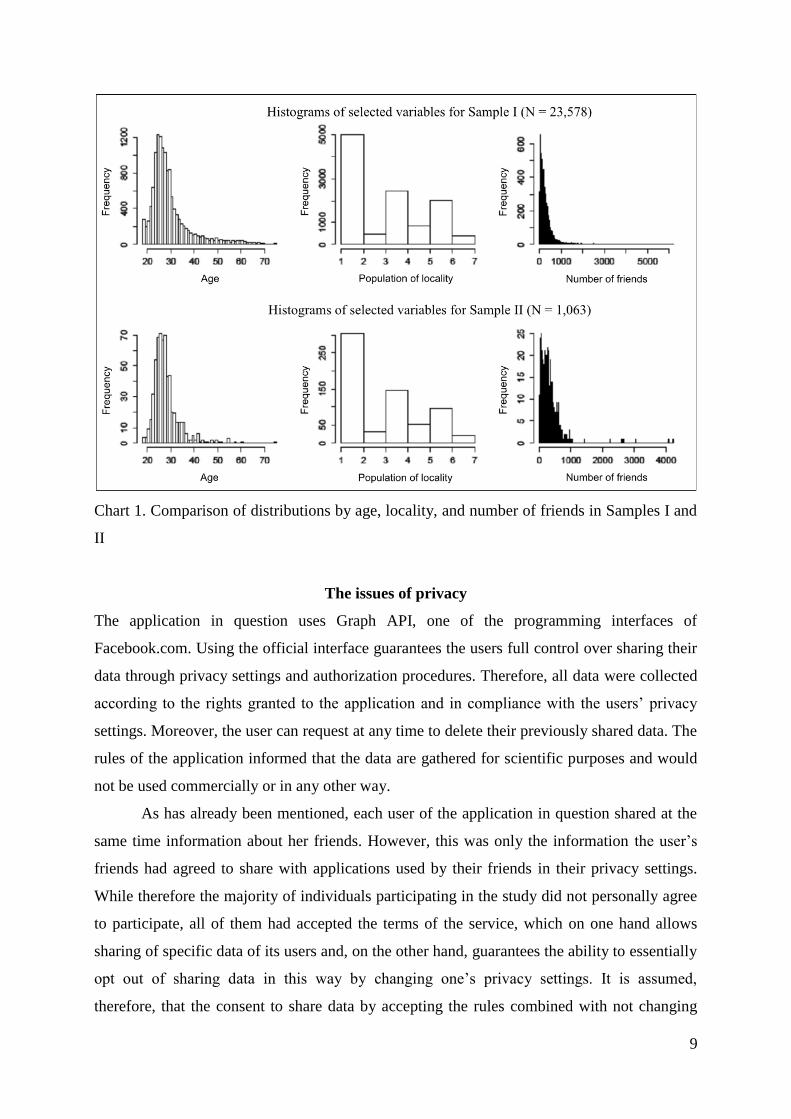
gender, while only 614 of them declared their age. The visual comparison of the distributions
by the age of users, population of locality, and number of friends is shown in Chart 1.
9
Chart 1. Comparison of distributions by age, locality, and number of friends in Samples I and
II
The issues of privacy
The application in question uses Graph API, one of the programming interfaces of
Facebook.com. Using the official interface guarantees the users full control over sharing their
data through privacy settings and authorization procedures. Therefore, all data were collected
according to the rights granted to the application and in compliance with the users’ privacy
settings. Moreover, the user can request at any time to delete their previously shared data. The
rules of the application informed that the data are gathered for scientific purposes and would
not be used commercially or in any other way.
As has already been mentioned, each user of the application in question shared at the
same time information about her friends. However, this was only the information the user’s
friends had agreed to share with applications used by their friends in their privacy settings.
While therefore the majority of individuals participating in the study did not personally agree
to participate, all of them had accepted the terms of the service, which on one hand allows
sharing of specific data of its users and, on the other hand, guarantees the ability to essentially
opt out of sharing data in this way by changing one’s privacy settings. It is assumed,
therefore, that the consent to share data by accepting the rules combined with not changing
10
one’s privacy settings so as to prevent access to data is tantamount to the consent to use data
in research9.
Moreover, the collected data were subjected to a range of anonymization procedures.
Identification numbers were encrypted using one-way algorithm (which means that the
backward conversion algorithm, restoring the original coded value, does not exist). The names
of all users were shortened to two initial letters, middle names were deleted. Such information
as biographical notes, links to home pages, phone numbers, e-mail addresses, and other details
allowing to clearly identify the user were irretrievably deleted from the users’ profiles. The
collected data were also anonymized with regard to information shared by the Graph API (for
instance, numbers of objects such as users’ comments were deleted). As a result, it would
require extreme effort to be able to identify a selected user on the basis of collected data.
Results
In the sample of 23,578 users, 1,908,896 unique links were identified, which were shared
3,412,332 times altogether. The most frequently shared link was the music video, the full
name of which is: “Gotye – Somebody That I Used To Know (feat. Kimbra) – official
video”10
. The view counter on YouTube.com shows that it was watched by more than 400
million users. The link was shared by 1,063 people from the studied sample and received a
total of 5,121 “likes” and 2,716 replies. The second most popular link—interestingly, a remix
of the same song—was shared by 553 people. Thus the difference between the two is
significant. Table 2 presents the matrix of correlations between the independent variables (1–
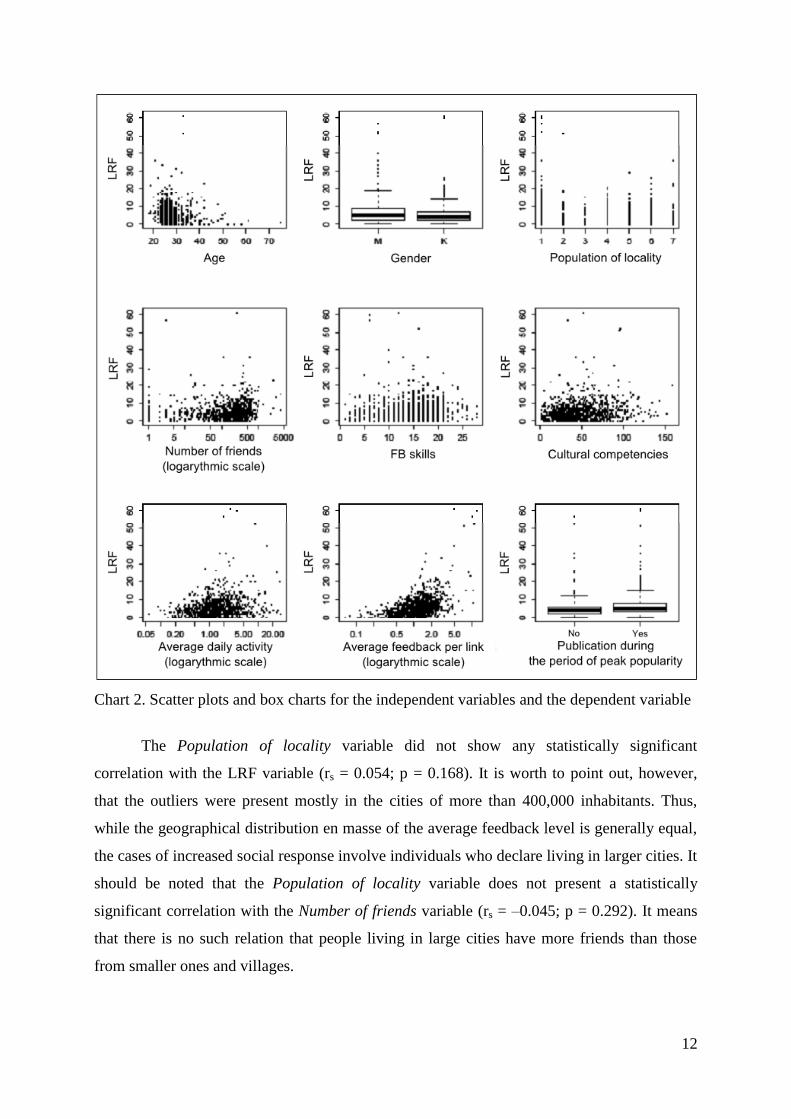
10) and the dependent variable (11). The relationships between the variables were also
visualized in Chart 2.
As can be seen, most of the correlations between the independent variables and the
dependent variable are weak. Older users received less feedback than younger ones (r = –
0.103; p < 0.05). It is worth to notice, however, that the average LRF dropped significantly
only for the users aged 50+ years: the mean LRF was 5.93 (SD = 1.78; N = 434) for users
aged 20–29 years, 5.98 (SD = 7.74; N = 145) for users aged 30–39 years, 5.28 (SD = 6.29; N
= 21) for users aged 40–49 years, and 1.70 (SD = 2.26; N = 10) for users aged 50 years and
older. It does not mean, however, that older people receive less feedback in general. In
9 Regarding the ethical issues of carrying out research in the Internet, cf.: P. Siuda, Prowadzenie badań w
Internecie – podstawowe problemy etyczne [Carrying out research in the Internet – fundamental ethical issues],
“Ruch Prawniczy, Ekonomiczny i Socjologiczny” [Legal, Economic, and Sociological Movement] LXXII
(2010), No. 4, p. 187–202. 10
Gotye – Somebody That I Used To Know (feat. Kimbra) – official video,
http://www.youtube.com/watch?v=8UVNT4wvIGY [accessed: 20 Jul 2013].
11
Sample I, the average feedback level per shared link showed the following distribution: the
average was 0.9 (SD = 1.49; N = 7,913) for users aged 20–29 years, 0.81 (SD = 1.26; N =
3,307) for users aged 30–39 years, 1.07 (SD = 2.92; N = 798) for users aged 40–49 years,
0.91 (SD = 3.07; N = 451) for users aged 50–59 years, and 0.96 (SD = 2.00; N = 300) for
users aged 60 years and older. As can be seen, when one considers the whole of the users’
activity, there are no significant differences in the average level of feedback received under
shared links. It only becomes visible when a specific link is discussed, in this case pointing
out at a musical hit.
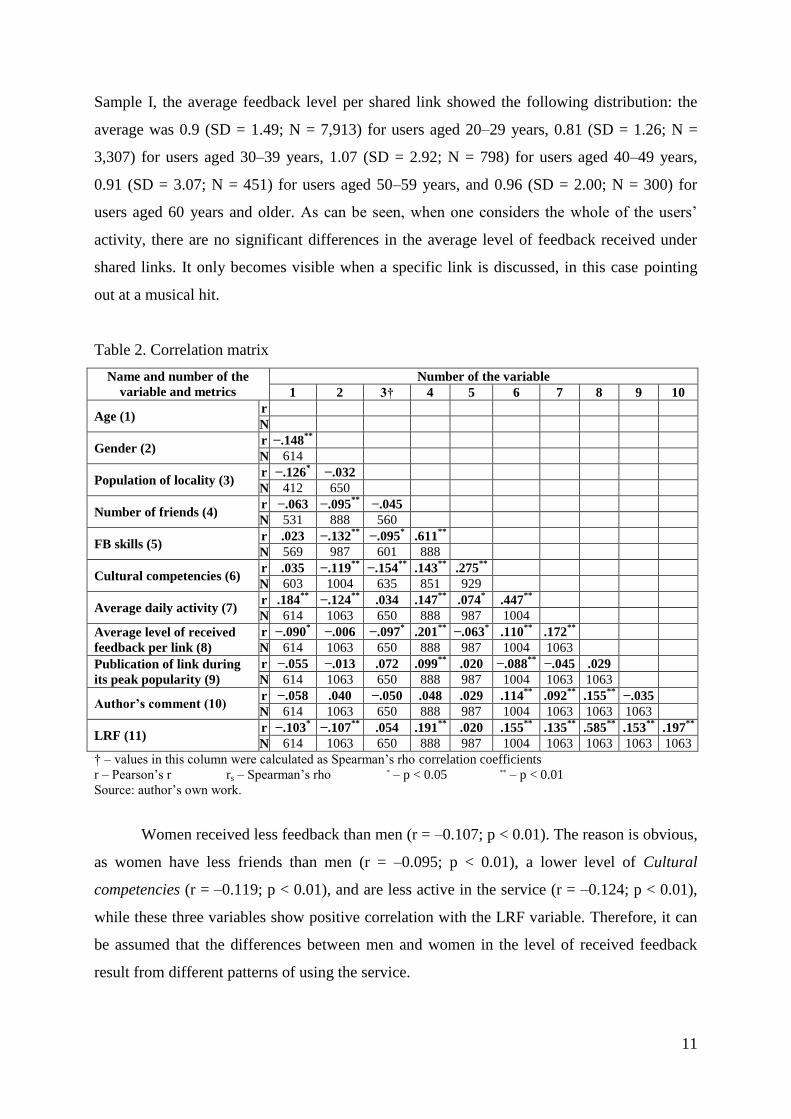
Table 2. Correlation matrix
Name and number of the
variable and metrics
Number of the variable
1 2 3† 4 5 6 7 8 9 10
Age (1) r
N
Gender (2) r −.148
**
N 614
Population of locality (3) r −.126
* −.032
N 412 650
Number of friends (4) r −.063 −.095
** −.045
N 531 888 560
FB skills (5) r .023 −.132
** −.095
* .611
**
N 569 987 601 888
Cultural competencies (6) r .035 −.119
** −.154
** .143
** .275
**
N 603 1004 635 851 929
Average daily activity (7) r .184
** −.124
** .034 .147
** .074
* .447
**
N 614 1063 650 888 987 1004
Average level of received
feedback per link (8)
r −.090* −.006 −.097
* .201
** −.063
* .110
** .172
**
N 614 1063 650 888 987 1004 1063
Publication of link during
its peak popularity (9)
r −.055 −.013 .072 .099**
.020 −.088**
−.045 .029
N 614 1063 650 888 987 1004 1063 1063
Author’s comment (10) r −.058 .040 −.050 .048 .029 .114
** .092
** .155
** −.035
N 614 1063 650 888 987 1004 1063 1063 1063
LRF (11) r −.103
* −.107
** .054 .191
** .020 .155
** .135
** .585
** .153
** .197
**
N 614 1063 650 888 987 1004 1063 1063 1063 1063
† – values in this column were calculated as Spearman’s rho correlation coefficients
r – Pearson’s r rs – Spearman’s rho * – p < 0.05 ** – p < 0.01
Source: author’s own work.
Women received less feedback than men (r = –0.107; p < 0.01). The reason is obvious,
as women have less friends than men (r = –0.095; p < 0.01), a lower level of Cultural
competencies (r = –0.119; p < 0.01), and are less active in the service (r = –0.124; p < 0.01),
while these three variables show positive correlation with the LRF variable. Therefore, it can
be assumed that the differences between men and women in the level of received feedback
result from different patterns of using the service.
12
Chart 2. Scatter plots and box charts for the independent variables and the dependent variable
The Population of locality variable did not show any statistically significant
correlation with the LRF variable (rs = 0.054; p = 0.168). It is worth to point out, however,
that the outliers were present mostly in the cities of more than 400,000 inhabitants. Thus,
while the geographical distribution en masse of the average feedback level is generally equal,
the cases of increased social response involve individuals who declare living in larger cities. It
should be noted that the Population of locality variable does not present a statistically
significant correlation with the Number of friends variable (rs = –0.045; p = 0.292). It means
that there is no such relation that people living in large cities have more friends than those
from smaller ones and villages.
13
The Number of friends variable shows a weak positive correlation with the LRF
variable (r = 0.191; p <0.01). The obvious interpretation of this relationship says that the more
friends an individual has the greater the likelihood of receiving feedback. The FB skills
variable, in spite of a relatively strong correlation with the Number of friends variable (r =
0.611; p <0.01), does not show a statistically significant correlation with the LRF variable (r =
0.020; p = 0.526). It can be assumed that in the case of many people using multiple functions
of Facebook (and thus getting high scores on the FB skills index) the activity associated with
using these other functions is visible more often. Therefore, even though they have a large
number of friends, the visibility of links they publish may be lower.
The Cultural competencies and Average daily activity variables show week correlation
with the LRF variable (respectively, r = 0.155; p <0.01 and r = 0.135; p < 0.01), and moderate
correlation between each other (r = 0.447; p < 0.01). The mutual correlation between these
variables is fairly obvious. A high value of the Cultural competencies variable tells that the
user “likes” many pages functioning within the service, which in turn means that she receives
more varied information, which may contribute to increased activity. This activity may then
indirectly influence the user’s visibility calculated by the EdgeRank algorithm, and thus cause
the increase of the LRF variable.
Providing additional commentary to the published link also improves the chance of
receiving feedback (r = 0.197; p < 0.01). The users who previously received more feedback
were particularly eager to post comments (r = 0.155; p < 0.01). Therefore, it may be
hypothesized that these people who had been socially accepted in the past are more willing to
express their opinions. Obviously, the opposite interpretation is possible as well: these people
who were more willing to express their opinion received more feedback and more often.
The strongest correlation between independent variables and the dependent variable
(i.e. LRF) relates to the Average level of received feedback per link (r = 0.585; p < 0.01). Thus
the level of received feedback for a given user is most easy to predict on the basis of the data
about the feedback she had received in the past. This should not be surprising. An individual
having a large amount of social capital will regularly receive more feedback, regardless of the
content referred by the hyperlinks that person posts. It has to be stressed, however, that having
received feedback in the past also improves the visibility of the posts of a given user in the
future. This is the result of the principles of the EdgeRank algorithm, which is responsible for
filtering the content within Facebook.com11
. This algorithm leads to the Matthew effect: the
11
Cf.: T. Bucher, “Want to be on the top? Algorithmic power and the threat of invisibility on Facebook”, New
Media & Society Vol. 14 (2012), No. 7, p. 1164–1180; D. Taylor, “Everything you need to know about
14
actions of the users who receive more feedback will be more visible to their friends than the
activities of users less often rewarded with social response. Therefore, they will have the
opportunity to amass even more feedback resources. The results are conducive of justifying
the Social Enhancement hypothesis (“the rich get richer”), which assumes that the Internet
and such tools as community services particularly favour these individuals who contribute
their cultural and social capital and multiply it12
.
Paradoxically, these studies may also confirm the opposite hypothesis, known as the
Hypothesis of Social Compensation. It assumes that the Internet may serve as a compensatory
tool for socially handicapped individuals13
. As is shown in other studies carried out by the
author, one of the strategies to gain feedback by individuals of low social capital level is
publishing links to the content which is popular or fashionable at the moment.14
In other
words, an excluded person who wants to join the social life—at least that social life which
takes place within Facebook.com—must adopt the strategy of reproducing the mainstream.
An example of such behaviour is publishing a hyperlink to a worldwide musical hit, such as
the link discussed in this paper, especially when it is done during its peak popularity, as it is
easier to receive feedback (r = 0.153; p < 0.01). Out of 1,063 users, only 85 (8 %) did not
receive any feedback. Yet the disproportion is still present: the “rich” obtain much more
social rewards for joining the same activities as the “socially poorer”.
Conclusion
In 2010, users of Facebook.com published a million of links every 20 minutes on average15
,
thus creating an ecosystem of exchanging information, which simultaneously fulfilled an
important social role of establishing and confirming the social position of individuals
involved in its functioning. Therefore, it has to be assumed that it has an impact on the mental
Facebook’s EdgeRank”, The Next Web, 9 May 2011, http://thenextweb.com/socialmedia/2011/05/09/everything-
you-need-toknow-about-facebooks-edgerank/ [accessed: 20 July 2013]. 12
J. Zywica, J. Danowski, The faces of Facebookers: Investigating social enhancement and social compensation
hypotheses; predicting Facebook™ and offline popularity from sociability and self-esteem, and mapping the
meanings of popularity with semantic networks, “Journal of Computer-Mediated Communication” Vol. 14
(2008), No. 1, p. 1–34. 13
A.P. Schouten, P.M. Valkenburg, J. Peter, Precursors and underlying processes of adolescents’ online
selfdisclosure: Developing and testing an ‘Internet-attribute-perception’ model, “Media Psychology” Vol. 10
(2007), p. 292–314. 14
W. Walczak, Crowdsourcing the Mainstream. An Analysis of the Most Frequently Posted Links on Facebook,
“Central European Journal of Communication” Vol. 7 (2014), No. 1 (12) [in print]. 15
Democrarcy UK, A Snapshot of Facebook in 2010, https://www.facebook.com/notes/democracy-uk-on-
facebook/a-snapshot-of-facebook-in-2010/172769082761603 [accessed: 20 July 2013].

15
condition of users16
. The structure of this environment, however, associated with the visibility
of individual messages being managed by the EdgeRank algorithm, is not neutral. It
contributes to the Matthew effect: the users who have more social and cultural capital can
translate their greater initial social contribution into a higher visibility among their friends and
thus strengthen their social position. Therefore, the publication of links to the same content by
individuals of different social capital levels (and different visibility of activities undertaken in
the service) will yield different results.
Even though in the case of the hyperlink discussed here young users received more
feedback, it is worth to mention that after taking into account all the links (almost 2 million
links shared almost 3.5 million times) the average LRF did not stratify users by age. It means
that the environment of Facebook.com allows older people to reap comparable benefits in
fulfilling the need of affiliation, at least in the area of sharing links.
Women and men adopt separate strategies of using the service. Men more often
undertake activities visible to the public (it is possible that women more often take advantage
of the private services of the portal, such as sending messages or chatting, yet it is not possible
to test that hypothesis in the scope of this study); they also have more friends, so their
activities reach a greater number of recipients. They also more extensively use fan pages,
which may be the sources of interesting links, subsequently shared with their friends.
The study has shown that the population of locality does not influence the ability to
realize one’s need of affiliation within Facebook.com. The few outliers are the only
exception. Whereas the locality of residence makes no difference for the vast majority of
normal users, the small subset of individuals who reap the greatest benefits, lives in the largest
localities.
People who provide additional comments to the links they publish receive feedback
more often. Thus, the readiness to express one’s opinions improves the probability that the
user will satisfy both her need of self-presentation and the need of affiliation. It can also be
assumed that positive feedback increases the likelihood of expressing one’s opinion in the
future.
The strongest predictor of LRF, however, was the variable indicating the level of
feedback received by the user in the past. So, while providing a comment to a link or sharing
it during its peak popularity period increases the probability of receiving feedback, what still
remains the key factor is the individual’s social capital—strengthened by the EdgeRank
16
M. Burke, C. Marlow, T. Lento, Social network activity and social well-being, in: Proceedings of the SIGCHI
Conference on Human Factors in Computing Systems, ACM (2010), p. 1909–1912.
16
algorithm—reflected by the regular reception of feedback, regardless of the shared link.
Should one assume that this capital has its origins in the offline world, it can be said that—in
spite of a certain emancipatory potential—community portals serve most of all to reproduce
the social structure. The role of community services in reproducing this structure—and, in
consequence, their possible role in social change—merits further research.