sharing experiences: how to analysis data from kormi/kamir
TRANSCRIPT

Seung-Woon Rha, MD, PhD FACC, FAHA, FSCAI, FESC, FAPSIC
Byoung Geol Choi, BS, PhD
Sharing Experiences; How to Analysis
Data from KORMI/KAMIR (SPSS를 활용한 방법론)
Cardiovascular Center,
Korea University Guro Hospital
April 17, 2015 KSC 2015 춘계학회, 부산

Kamir/Kormi 연구 배경

Sep 29-30th 2005
Korea Acute Myocardial Infarction Registry (KAMIR)
for the memorandum of 50th Anniversary of Korean
Circulation Society

Kamir.or.kr
On-line Korea Acute Myocardial
Infarction Registry: KAMIR
http://www.kamir.or.kr

KAMIR: Korea Acute Myocardial Infarction Registry
Principal Investigator: Jeong MH Sub-investigators: Kim YJ, Kim CJ, Cho MC, Ahn YK Co-investigators: 55 primary PCI centers Ko YP, Koo BG, Gwon HC, Kim KS, Kim DI, Kim MH, Kim BO, Kim SW, Kim SJ, Kim YJ, Kim JK, Kim CJ, Kim TI, Rha SW, Rhew JY, Park GS, Park SW, Park SH, Bae JH, Seong IW, Seung KB, Ahn YK, Ahn TH, Yang JY, Oh SK, Yoon Jh, Lee HS, Lee MY, Lee SH, Lee SW, Rhim JY, Jeong KT, Jeong MH, Chung WS, Jeong HJ, Cho MC, Cho JH, Cho JM, Joo SJ, Jin DG, Jin SW, Chae SC, Chae IH, Chae JK, Choi DH, Tahk SJ, Han KR, Hur SH, Hwang JY Steering Committee: Park SJ, Jang YS, Seung KB, Chung WS, Cho JG, Kim YJ, Kim CJ, Cho MC, Yoon JH, Chae IH, Jeong MH

Purpose of KAMIR Study
1. On-line registration of Korean AMI patients
2. Early detection of high risk patients
3. Risk factor documentation and analysis
4. New therapeutic strategy for AMI
5. Effective prevention strategy for AMI

Four Phases of KAMIR Study
KAMIR-I (Nov 2005-Dec 2006)
KAMIR-II (Jan 2007-Jan 2008)
KAMIR-III (KorMI-I) (Feb 2008-Mar 2012)
KAMIR-IV (KorMI-II )
(Apr 2012~)
KAMIR-NIH (Nov 2011~)
N=8,489
N=6,381 (14,870)
N=24,600 (39,470)
N=12,616 (52,086)

Research Committee
Steering Committee
Research Coordinating
Center
Audit Committee
Advisory Committee
Executive Committee

KAMIR Publications and Presentations (2006~2014)
99
21
0
50
100
150
SCI Domestic
Published Papers
202254
0
100
200
300
Internatial Domestic
Presentations

Korea Acute Myocardial Infarction Research Group
Nov 19th 2007

Pubmed Outcomes; Rha SW (238)
2015.4.17 현재

KUGH Published Kamir Papers (1)

KUGH Published Kamir Papers (2)

1. Chen KY, Rha SW, Li YJ, Poddar KL, Jin Z, Minami Y, et al. Triple versus dual antiplatelet therapy in patients with acute ST-
segment elevation myocardial infarction undergoing primary percutaneous coronary intervention. Circulation.
2009;119(25):3207-14.
2. Choi CU, Rha SW, Chen KY, Jin Z, Minami Y, Shin SY, et al. Mid-term angiographic benefit of sirolimus-eluting stents
compared with paclitaxel-eluting stents in patients with acute myocardial infarction. Journal of cardiology. 2009;54(1):80-5.
3. Choi CU, Rha SW, Chen KY, Li YJ, Poddar KL, Jin Z, et al. Lack of clinical benefit of improved angiographic results with
sirolimus-eluting stents compared with paclitaxel and zotarolimus-eluting stents in patients with acute myocardial infarction
undergoing percutaneous coronary intervention. Circulation journal : official journal of the Japanese Circulation Society.
2009;73(12):2229-35.
4. Li YJ, Rha SW, Chen KY, Jin Z, Minami Y, Wang L, et al. Clinical characteristics and mid-term outcomes of acute myocardial
infarction patients with prior cerebrovascular disease in an Asian population: Lessons from the Korea Acute Myocardial
Infarction Registry. Clinical and experimental pharmacology & physiology. 2010;37(5-6):581-6.
5. Li YJ, Rha SW, Chen KY, Poddar KL, Jin Z, Minami Y, et al. Low-molecular-weight heparin versus unfractionated heparin in
acute ST-segment elevation myocardial infarction patients undergoing primary percutaneous coronary intervention with drug-
eluting stents. American heart journal. 2010;159(4):684-90 e1.
6. Choi CU, Rha SW, Oh DJ, Poddar KL, Na JO, Kim JW, et al. Standard versus high loading doses of clopidogrel in Asian ST-
segment elevation myocardial infarction patients undergoing percutaneous coronary intervention: insights from the Korea
Acute Myocardial Infarction Registry. American heart journal. 2011;161(2):373-82 e1-3.
Dr Rha’s Kamir Published Papers (1)

7. Suh SY, Rha SW, Ahn TH, Shin EK, Choi CU, Oh DJ, et al. Long-term safety and efficacy of Pitavastatin in patients with
acute myocardial infarction (from the Livalo Acute Myocardial Infarction Study [LAMIS]). The American journal of cardiology.
2011;108(11):1530-5.
8. Chen KY, Rha SW, Li YJ, Jin Z, Minami Y, Park JY, et al. ‘Smoker's paradox’in young patients with acute myocardial
infarction. Clinical and Experimental Pharmacology and Physiology. 2012;39(7):630-5.
9. Chen KY, Rha SW, Wang L, Li YJ, Li GP, Poddar KL, et al. Unrestricted use of 2 new-generation drug-eluting stents in
patients with acute myocardial infarction: a propensity score-matched analysis. JACC Cardiovascular interventions.
2012;5(9):936-45.
10. Li YJ, Rha SW, Chen KY, Jin Z, Wang L, Ramasamy S, et al. Low molecular weight heparin versus unfractionated heparin in
patients with acute non-ST-segment elevation myocardial infarction undergoing percutaneous coronary intervention with
drug-eluting stents. Journal of cardiology. 2012;59(1):22-9.
11. Chen KY, Rha SW, Wang L, Li YJ, Li GP, Choi CU, et al. One-year clinical outcomes of everolimus- versus sirolimus-eluting
stents in patients with acute myocardial infarction. International journal of cardiology. 2014;176(3):583-8.
12. Chen KY, Rha SW, Li YJ, Li GP, Oh DJ, Jeong MH, et al. Comparisons of Everolimus- and Paclitaxel-Eluting Stents in
Patients with Acute Myocardial Infarction. Journal of Interventional Cardiology. 2015.
Dr Rha’s Kamir Published Papers (2)

KAMIR & KORMI Data
**AMI 등록 시점 (Registrations)
1. KAMIR1: 2005.11 – 2006.12 (Total;41 center; 8,489 명)
2. KAMIR2: 2007.1 – 2008.1 (Total;48 center; 6,381명)
3. KORMI3: 2008.2 – 2012.3 (Total;59 center; 25,980 명)
2005.1 – 2012.3 (Total; 73 center; 40,850 명)

Variables in Kamir/Kormi CRF
** Additional Variables for the updated Kamir/Kormi CRF
1. KAMIR 1: 140개 변수
2. KAMIR 2: 149개 변수
추가변수:
- Premedication before PCI (Q37-5)
- GP IIbIIIa inhibitor during PCI (Q37-6)
- Distal protection device (Q37-7)
- Stent thrombosis was developed (Q68)
3. KORMI: 235개 변수
추가변수:
- Premedication before PCI (Q37-5-1,2,3)
- Approach method; Radial, Femoral.. (Q37-8)
- Use IVUS (Q38-6), - QCA information (Q38-12)
- Echocardiography (Q42), - Cardiac CT (Q46), - HbA1c (Q61)
- Medical therapy 세분화; ( In-hospital, Q62~Q86; Discharge; Q88-7)
- F/U Echocardiogram, MR grade (Q90- 4~8)
- F/U Lab (Q95), - 24 months clinical F/U (Q96)

Excel Data 통합
KAMIR & KORMI 통합 후
SPSS변환용 자료로 정리

SPSS변환
메뉴 상단: 파일-> 데이터베이스 열기 - >새 쿼리
1. Excel file선택 -> 2.데이터베이스 찾아보기
-> 3.데이터 파일 열기
1.그림 왼쪽 Sheet를 오른쪽 필드로 이동
-> 2. 마침
1
2
SPSS 결과물

Tip & Tricks for Raw Data Clean Up (1)
Missing data의 처리
- 범주형 변수는 가능한 이분형 (Binary; 0 or 1) 형태로 변환
- ‘변수’ 속성에 맞추어 각각 새로운 변수로 만들어 준다
Examples)
Gender는 ‘남자: 1’와 ‘여자: 0’로 나뉘어 지지만
KAMIR에서는 7.3%의 missing data가 존재한다.
따라서
Male: ‘1’ others: ‘0’ / Female: ‘1’ others: ‘0’
- 논문 작성시 현재 알고 있는 명확한 자료만 제시한다
Gender (male): 16,875 (65.8%)
- 알고 있는 자료만 나누어 정리하면 회귀분석이나
Propensity score 분석 시 missing data의 loss없이 분석
가능
Missing data도 ‘0’으로 표시

Tip & Tricks for Raw Data Clean Up (2)
- KAMIR Data set은 등록된 자료의 진행사항을 확인 가능.
통계 진행 시 적절한 필터를 사용하면
Missing data를 걸러낼 수 있다.
Examples)
- AMI의 연도별 발생건수 분석
: step 선택 해당 없음
- 가설의 Endpoint가
In hospital complication 이면..
=> step 6~10단계
- 가설의 Endpoint가 Follow-up Clinical Outcomes이면..
=> step 10단계

Statistical Analysis 1. 연속형 변수 (Continuous variables)
Student t-test (Independent, Un-paired)
Anova/Ancova
2. 범주형 변수 (Categorical variables)
Chi-square test or Fischer’s exact test
3. 상대 위험과 오즈비 (Relative Risk & Odds Ratio)
4. 로지스틱 회귀분석 (Logistic Regression Analysis)
단순회귀모형 (Simple logistic)
다중회귀모형 (Multiple logistic); Independent predictors./no time dependence
5. 생존율 곡선 (Survival Curve Analysis)
Kaplan-Meier: Log-rank test
Cox-regression: Cox proportional hazard model (time dependent)
6. Propensity-Score Analysis
Adjusted analysis / Matched analysis
“모두 합쳐도 10개 이내” 기본통계방법

Dr. Rha 의 Kamir 통계 Step
Ex) 두 군의 비교연구 (KAMIR/KORMI data에서만…)
1. 가설 설정 및 데이터 탐색
2. Propensity Score Matching: PS Matching 다중회귀분석 보다 PSM이 ‘혼란변수보정’에 있어 여러모로 편리하고 직관적임.
Clinical Risk평가에 있어서, “상대위험도” 평가와 “Cox-proportional hazard model” 사용.
PS Matching으로 인한 data loss를 피하고 싶다면
Cox-proportional hazard model의 공변량 (co-variates) 에 PS를 넣어 보정.
3. 기본 통계 (Chi-검정, 독립T검정, 상대위험검정)
4. 회귀분석 & 생존율 분석 Follow-up data의 Risk평가는 “회귀분석”이 아닌 “Cox-proportional hazard model”로 평가.
5. Subgroup Analysis ; cox regression between two subgroups

Step 1 - Grouping Everolimus-eluting (EES ) Vs. Biodegradable Polymer Biolimus Stent (BPBS; BES)의
2 Years Outcomes 비교연구
“EESBPBS”변수 생성
- 대상군: BPBSs (NOBORI, Biomatrix) => “1” 로 코딩
- 비교군: EESs (Promus, Xience V) => “0”으로 코딩
(NOBORI, Biomatrix)
(Promus, Xience V)

Step 2 – PS Matching (1)
- SPSS용 PSM Tool설치 (version 18-20, window 7) 참고 사이트: http://www.ibm.com/developerworks/spssdevcentral
설치파일 목록
PS Matching in SPSS Dialog

Step 2 – PS Matching (2)
검정변수: (EES vs. BPBS)
환자 고유의 ID을 만들어 넣어준다.
보정할 ‘공변량’ 넣어준다.
- 다중공선성 test 상관없이 넣을 수 있다.
- 주의)
공변량에는 ‘null’값이 있어서는 안된다.
Tip) 변수를 ‘세분화’ 하고, 연속형 변수를
‘그룹화’ 하면 Missing data를
random 시키는 효과가 있어
Case lose를 줄일 수 있다.
비교, 대상군의 PS 간격 설정
- 숫자가 작을수로 잘 매칭되지만
-Data Loss가 많아짐

PS Matching Result
PSM실행 후 아래와 같은 Information Pop-up창이 뜬다.
PSM 결과
917 Pair, N=1,837
Data field 맨 뒤에 자동 생성
Propensity score
코딩: “1”
Matched case
코딩: “0”
Un-matched case
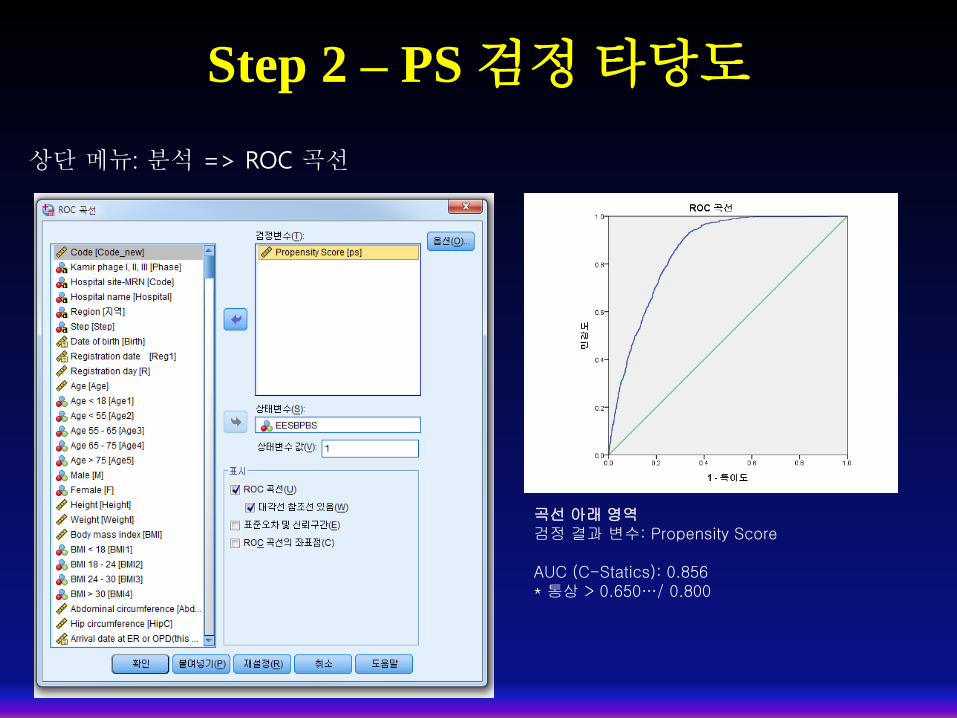
Step 2 – PS 검정 타당도
상단 메뉴: 분석 => ROC 곡선
곡선 아래 영역 검정 결과 변수: Propensity Score AUC (C-Statics): 0.856 * 통상 > 0.650…/ 0.800

Step 3 – 기본 통계 (1)
1. 연속형 변수 (Continuous variables) Student t-test
- 메뉴 상단: 분석 => 평균비교 => 독립표본T검정
Levene의 등분산 검정
- 유의확율 ≥ 0.05: 등분산 가정
- 유의확율 < 0.05: 등분산 가정X
EES vs. BPBS
63.1± 12.3, 62.6± 12.6, P=0.271

Step 3 – 기본 통계 (2)
2. 범주형 변수 (Categorical variables) & 상대위험도 분석 Chi-square test or Fischer’s exact test
메뉴 상단: 분석 => 기술통계 => 교차분석
상대 위험과 오즈비
(Relative Risk & Odds Ratio)
Chi-square test
Fischer’s exact test: 정확한 검정

Step 3 – 기본 통계 (3)
2. 범주형 변수 (Categorical variables) & 상대위험도 분석 Chi-square test or Fischer’s exact test or Relative Risk
상대 위험도와 오즈비
(Relative Risk & Odds Ratio)
RR: 1.140, CI: 0.799 – 1.625
Chi-square test
Fischer’s exact test: 정확한 검정
5보다 작은 기대빈도의 셀이
20% 이상이면
Fischer’s exact test를 사용한다
*Cox regression; HR
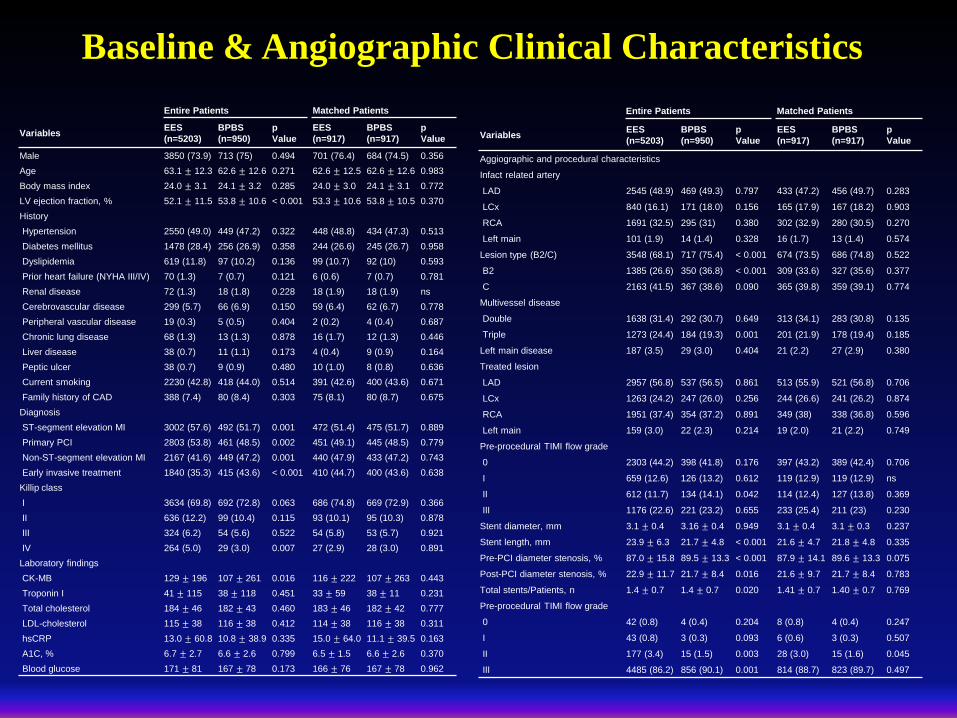
Baseline & Angiographic Clinical Characteristics
Entire Patients Matched Patients
Variables EES
(n=5203)
BPBS
(n=950)
p
Value
EES
(n=917)
BPBS
(n=917)
p
Value
Male 3850 (73.9) 713 (75) 0.494 701 (76.4) 684 (74.5) 0.356
Age 63.1 ± 12.3 62.6 ± 12.6 0.271 62.6 ± 12.5 62.6 ± 12.6 0.983
Body mass index 24.0 ± 3.1 24.1 ± 3.2 0.285 24.0 ± 3.0 24.1 ± 3.1 0.772
LV ejection fraction, % 52.1 ± 11.5 53.8 ± 10.6 < 0.001 53.3 ± 10.6 53.8 ± 10.5 0.370
History
Hypertension 2550 (49.0) 449 (47.2) 0.322 448 (48.8) 434 (47.3) 0.513
Diabetes mellitus 1478 (28.4) 256 (26.9) 0.358 244 (26.6) 245 (26.7) 0.958
Dyslipidemia 619 (11.8) 97 (10.2) 0.136 99 (10.7) 92 (10) 0.593
Prior heart failure (NYHA III/IV) 70 (1.3) 7 (0.7) 0.121 6 (0.6) 7 (0.7) 0.781
Renal disease 72 (1.3) 18 (1.8) 0.228 18 (1.9) 18 (1.9) ns
Cerebrovascular disease 299 (5.7) 66 (6.9) 0.150 59 (6.4) 62 (6.7) 0.778
Peripheral vascular disease 19 (0.3) 5 (0.5) 0.404 2 (0.2) 4 (0.4) 0.687
Chronic lung disease 68 (1.3) 13 (1.3) 0.878 16 (1.7) 12 (1.3) 0.446
Liver disease 38 (0.7) 11 (1.1) 0.173 4 (0.4) 9 (0.9) 0.164
Peptic ulcer 38 (0.7) 9 (0.9) 0.480 10 (1.0) 8 (0.8) 0.636
Current smoking 2230 (42.8) 418 (44.0) 0.514 391 (42.6) 400 (43.6) 0.671
Family history of CAD 388 (7.4) 80 (8.4) 0.303 75 (8.1) 80 (8.7) 0.675
Diagnosis
ST-segment elevation MI 3002 (57.6) 492 (51.7) 0.001 472 (51.4) 475 (51.7) 0.889
Primary PCI 2803 (53.8) 461 (48.5) 0.002 451 (49.1) 445 (48.5) 0.779
Non-ST-segment elevation MI 2167 (41.6) 449 (47.2) 0.001 440 (47.9) 433 (47.2) 0.743
Early invasive treatment 1840 (35.3) 415 (43.6) < 0.001 410 (44.7) 400 (43.6) 0.638
Killip class
I 3634 (69.8) 692 (72.8) 0.063 686 (74.8) 669 (72.9) 0.366
II 636 (12.2) 99 (10.4) 0.115 93 (10.1) 95 (10.3) 0.878
III 324 (6.2) 54 (5.6) 0.522 54 (5.8) 53 (5.7) 0.921
IV 264 (5.0) 29 (3.0) 0.007 27 (2.9) 28 (3.0) 0.891
Laboratory findings
CK-MB 129 ± 196 107 ± 261 0.016 116 ± 222 107 ± 263 0.443
Troponin I 41 ± 115 38 ± 118 0.451 33 ± 59 38 ± 11 0.231
Total cholesterol 184 ± 46 182 ± 43 0.460 183 ± 46 182 ± 42 0.777
LDL-cholesterol 115 ± 38 116 ± 38 0.412 114 ± 38 116 ± 38 0.311
hsCRP 13.0 ± 60.8 10.8 ± 38.9 0.335 15.0 ± 64.0 11.1 ± 39.5 0.163
A1C, % 6.7 ± 2.7 6.6 ± 2.6 0.799 6.5 ± 1.5 6.6 ± 2.6 0.370
Blood glucose 171 ± 81 167 ± 78 0.173 166 ± 76 167 ± 78 0.962
Entire Patients Matched Patients
Variables EES
(n=5203)
BPBS
(n=950)
p
Value
EES
(n=917)
BPBS
(n=917)
p
Value
Aggiographic and procedural characteristics
Infact related artery
LAD 2545 (48.9) 469 (49.3) 0.797 433 (47.2) 456 (49.7) 0.283
LCx 840 (16.1) 171 (18.0) 0.156 165 (17.9) 167 (18.2) 0.903
RCA 1691 (32.5) 295 (31) 0.380 302 (32.9) 280 (30.5) 0.270
Left main 101 (1.9) 14 (1.4) 0.328 16 (1.7) 13 (1.4) 0.574
Lesion type (B2/C) 3548 (68.1) 717 (75.4) < 0.001 674 (73.5) 686 (74.8) 0.522
B2 1385 (26.6) 350 (36.8) < 0.001 309 (33.6) 327 (35.6) 0.377
C 2163 (41.5) 367 (38.6) 0.090 365 (39.8) 359 (39.1) 0.774
Multivessel disease
Double 1638 (31.4) 292 (30.7) 0.649 313 (34.1) 283 (30.8) 0.135
Triple 1273 (24.4) 184 (19.3) 0.001 201 (21.9) 178 (19.4) 0.185
Left main disease 187 (3.5) 29 (3.0) 0.404 21 (2.2) 27 (2.9) 0.380
Treated lesion
LAD 2957 (56.8) 537 (56.5) 0.861 513 (55.9) 521 (56.8) 0.706
LCx 1263 (24.2) 247 (26.0) 0.256 244 (26.6) 241 (26.2) 0.874
RCA 1951 (37.4) 354 (37.2) 0.891 349 (38) 338 (36.8) 0.596
Left main 159 (3.0) 22 (2.3) 0.214 19 (2.0) 21 (2.2) 0.749
Pre-procedural TIMI flow grade
0 2303 (44.2) 398 (41.8) 0.176 397 (43.2) 389 (42.4) 0.706
I 659 (12.6) 126 (13.2) 0.612 119 (12.9) 119 (12.9) ns
II 612 (11.7) 134 (14.1) 0.042 114 (12.4) 127 (13.8) 0.369
III 1176 (22.6) 221 (23.2) 0.655 233 (25.4) 211 (23) 0.230
Stent diameter, mm 3.1 ± 0.4 3.16 ± 0.4 0.949 3.1 ± 0.4 3.1 ± 0.3 0.237
Stent length, mm 23.9 ± 6.3 21.7 ± 4.8 < 0.001 21.6 ± 4.7 21.8 ± 4.8 0.335
Pre-PCI diameter stenosis, % 87.0 ± 15.8 89.5 ± 13.3 < 0.001 87.9 ± 14.1 89.6 ± 13.3 0.075
Post-PCI diameter stenosis, % 22.9 ± 11.7 21.7 ± 8.4 0.016 21.6 ± 9.7 21.7 ± 8.4 0.783
Total stents/Patients, n 1.4 ± 0.7 1.4 ± 0.7 0.020 1.41 ± 0.7 1.40 ± 0.7 0.769
Pre-procedural TIMI flow grade
0 42 (0.8) 4 (0.4) 0.204 8 (0.8) 4 (0.4) 0.247
I 43 (0.8) 3 (0.3) 0.093 6 (0.6) 3 (0.3) 0.507
II 177 (3.4) 15 (1.5) 0.003 28 (3.0) 15 (1.6) 0.045
III 4485 (86.2) 856 (90.1) 0.001 814 (88.7) 823 (89.7) 0.497

Clinical Outcomes up to 2 Years Entire Patients Matched Patients
Variables EES
(n=5203)
BPBS
(n=950)
Relative Risk
(Odd ratio)
p
Value
EES
(n=917)
BPBS
(n=917)
Relative Risk
(Odd ratio)
p
Value
Outcomes at 30 days
Total death 167 (3.2) 23 (2.4) 0.74 (0.48 - 1.16) 0.196 28 (3.0) 23 (2.5) 0.81 (0.46 - 1.42) 0.478
Cardiac Death 162 (3.1) 22 (2.3) 0.73 (0.46 - 1.15) 0.184 27 (2.9) 22 (2.3) 0.81 (0.45 - 1.43) 0.469
Re-MI 13 (0.2) 5 (0.5) 2.11 (0.75 - 5.93) 0.181 3 (0.3) 5 (0.5) 1.67 (0.39 - 7.00) 0.726
STEMI 11 (0.2) 2 (0.2) 0.99 (0.22 - 4.49) ns 2 (0.2) 2 (0.2) 1.00 (0.14 - 7.11) ns
Outcomes at 2 years
Total death 233 (4.4) 37 (3.8) 0.86 (0.60 - 1.23) 0.419 37 (4.0) 37 (4.0) 1.00 (0.62 - 1.59) ns
Cardiac Death 200 (3.8) 27 (2.8) 0.73 (0.48 - 1.10) 0.132 33 (3.5) 27 (2.9) 0.81 (0.48 - 1.36) 0.431
Re-MI 58 (1.1) 15 (1.5) 1.42 (0.80 - 2.52) 0.224 11 (1.1) 15 (1.6) 1.36 (0.62 - 2.99) 0.429
STEMI 30 (0.5) 6 (0.6) 1.09 (0.45 - 2.64) 0.838 6 (0.6) 6 (0.6) 1.00 (0.32 - 3.11) ns
Revascularization 132 (2.5) 20 (2.1) 0.82 (0.51 - 1.32) 0.430 15 (1.6) 19 (2.0) 1.27 (0.64 - 2.51) 0.489
CABG 6 (0.1) 1 (0.1) 0.91 (0.10 - 7.58) ns 0 (0.0) 1 (0.1) 0.49 (0.47 - 0.52) ns
Re-PCI 126 (2.4) 19 (2.0) 0.82 (0.50 - 1.33) 0.431 15 (1.6) 18 (1.9) 1.20 (0.60 - 2.40) 0.598
TLR 37 (0.7) 9 (0.9) 1.33 (0.64 - 2.77) 0.437 4 (0.4) 9 (0.9) 2.26 (0.69 - 7.37) 0.164
TVR 59 (1.1) 10 (1.0) 0.92 (0.47 - 1.81) 0.827 8 (0.8) 10 (1.0) 1.25 (0.49 - 3.18) 0.636
Non-TVR 67 (1.2) 10 (1.0) 0.81 (0.41 - 1.59) 0.549 5 (0.5) 9 (0.9) 1.80 (0.60 - 5.41) 0.283
Total MACE 410 (7.8) 71 (7.4) 0.94 (0.72 - 1.22) 0.668 62 (6.7) 70 (7.6) 1.13 (0.79 - 1.62) 0.470
TLF 285 (5.4) 50 (5.2) 0.95 (0.70 - 1.30) 0.789 47 (5.1) 50 (5.4) 1.06 (0.70 - 1.60) 0.754
TLR MACE 262 (5.0) 42 (4.4) 0.87 (0.62 - 1.21) 0.422 43 (4.6) 42 (4.5) 0.97 (0.63 - 1.50) 0.912
TVR MACE 338 (6.4) 61 (6.4) 0.98 (0.74 - 1.30) 0.931 55 (5.9) 61 (6.6) 1.11 (0.76 - 1.62) 0.565
Probable or definite stent thrombosis 29 (0.5) 10 (1.0) 1.89 (0.92 - 3.90) 0.077 4 (0.4) 10 (1.0) 2.51 (0.78 - 8.05) 0.107
Acute 6 (0.1) 1 (0.1) 0.91 (0.10 - 7.58) ns 1 (0.1) 1 (0.1) 1.00 (0.06 - 16.0) ns
Subacute 3 (0.0) 3 (0.3) 5.49 (1.10 - 27.2) 0.051 0 (0.0) 3 (0.3) 0.49 (0.47 - 0.52) 0.250
Late (1-12 months) 17 (0.3) 5 (0.5) 1.61 (0.59 - 4.38) 0.370 2 (0.2) 5 (0.5) 2.50 (0.48 - 12.9) 0.452
Very late (1-2 years) 3 (0.0) 1 (0.1) 1.82 (0.18 - 17.5) 0.489 1 (0.1) 1 (0.1) 1.00 (0.06 - 16.0) ns
*동일한 결과값; p=1.0 or p<0.001 or ns

Step 4 – 생존율 곡선 (1)
1. Kaplan-Meier Survival Curve
- 메뉴 상단: 분석 => 생존확율 => K-M curve분석
생존 시간
Event
Log Rank test
생존표
그래프
비교 변수

Step 4 – 생존율 곡선 (2)
Log Rank test
도표 더블클릭 하여 편집기에서 편집

Step 4 – 생존율 곡선 (3)
2. Cox-regression: Cox proportional hazard model
- 메뉴 상단: 분석 => 생존확율 => Cox 회귀모형
Propensity Score
- Cox proportional hazard ratio
adjusted PS
K-M curve분석과 거의 동일 함

Step 4 – 생존율 곡선 (4)
도표 더블클릭 하여 편집기에서 편집

Dr. Rha 의 Kamir/Kormi 통계분석 Summary
Ex) 두 군의 비교연구 (KAMIR/KORMI data에서만…)
1. 가설 설정 및 데이터 탐색
2. Propensity Score Matching: PS Matching .
3. 기본 통계 (chi-검정, 독립T검정, 상대위험검정)
4. 회귀분석 & 생존율 분석
5. Subgroup Analysis
1. 의학통계학과의 정식 자문
2. 연구인력의 전문화; Data Coordinator/Statistics (최병걸, 최세연, 변재경 연구원)

Thank you for your attention
Korea University Guro Hospital