sharc, a model for calculating atmospheric and infrared
TRANSCRIPT
AD-A275 207 ATO PG Form Approvied1Aj1 PA E0MB Nlo. 0704-0188
3 a .ef ae co, r fIocr iomr'sei. sirnuedi ng thme tiemnesfoergraervaenwi ntg nbstrucetiarns, searchinnq exi~st tng d ata sources,~.:OI~~in t trwtin en cmmns e'arifq hs budnetmaeO 3n ther aspect of %nosocr'to Vasn'qtn 4eC~urteS ervices. Directorate for inoriration Operations and Reports. Q215 ýeirfefsci
ý,v inaqjemerot and Budget, l'aperNOrK Reduction Project (070"-188). Washington. XC 20503
4. TITLE AND SUBTITLE 5. FUNDING NUMBERS
SHARC, A Model for Calculating Atmospheric and InfraredRadiation Under Non-Equilibrium Conditions S3411301
6. AUTHOR(S) LSBrsenR.L. Sundberg*, J.W. Duff*, J.H. Gruninger*, . BentiR.D. Sharma, M.W. Matthew*, S.M. Alder-Golden*,R.J. Healey**, J.H. Brown, D.C. Robertson*
7. PERFORMING ORGANIZATION NAME(S) AND ADDRESS(ES) 8. PERFORMING ORGANIZATION
Phillips Laboratory/GPOS REPORT NUMBER
29 Randolph RoadHanscom AFB, MA 01731-3010 PL-TR-94-20 10
9. SONSOING/MONTORIG AGNCY AMES) O-Sitf; TEl1. SPONSORING /MONITORING
FEB 1 994 1 AGENCY REPORT NUMBER
S11. SUPPLEMENTARY NCTE3 *Spectral Sciences Inc., 99 Bedford St., Burlington, MA 01803**Yap Analytics, Inc., 594 Marrett Rd.,' Lexington, MA 02173
IReprint from AGU Geophysical Monograph based on the proceedings of the ChapmanConference on the Upper Mesosphere and Lower Thermosphere
~12a. DISTRIBUTION. AVAILA31L.TY _iTATEMN Z b. I 7!LAJ~ Z C
Approved for public release; Distribution unlimitedI
13. ABSTRACT (Maximumr 2'20 --ords)A new computer model, SHARC, has been developed by the Air Force for
calculating high-altitude atmospheric IR radiance and transmittance spectra with aresolution of better than 1 cm1l. Comprehensive coverage of the 2 to 40 p~m (250 to5,000 cm-') wavelength region is provided for arbitrary lines of sight in the 50-300 CD IIm altitude regime. SHARC accounts for the deviation from local thermodynamicequilibrium (LTE) in vibrational state populations by explicitly modeling the detailedJproduction, loss, and energy transfer processes among the important molecular ovi*brational states. The calculated vibrational populations are found to be similar tothose obtained from other non-LTE codes. The radiation transport algorithm is CAbased on a single-line equivalent width approximation along with a statistical ____=w
correction for line overlap. This approach is reasonably accurate for mostapplications and is roughly two orders of magnitude faster than the traditional LELmethods which explicitly integrate over individual line shapes. In addition toquiescent atmospheric processes, this model calculates the auroral production and
exctaton f C 2.No, and No+ in localized regions of the atmosphere. Illustrativecomparisons of SHARC predictions to other models and to data from the CIRRIS,SPIRE and FWI field experiments are presented.
14. SUBJECT TERMS 15. NUMBFR OF PAGESNon-Local Thermodynamic Equilibrium, Infrared Radiation, Computel 16
Code, Vibrational and Rotational Levels, Limb Radiance 16. PRICE CODE
17. SECURITY CLASSIFICATION 18. SECURITY CLASSIFICATION 19. SECURITY CLASSIFICATION 20. LIMITATION OF ABSTRACTOF REPORT OF THIS PAGE OF ABSTRACT
1UNCLASSIFIED UNCLASSIFIED UNCLASSIFIED SARNSN 7540-01-280-5500 Standard Form 298 (Rev. 2-89)
Prescribed by ANSI Std. Z39-18298-102
• pL_1t,1_94-2010
SHARC,A Model for Calculating Atmospheric Infrared Radiation
Under Non-Equilibrium Conditions
R. L. Sundberg,* J. W. Duff,* J. H. Gruninger,* L. S. Bernstein,*R. D. Sharma,$ M. W. Matthew,* S. M. Adler-Golden,* R. J. Healey,&
J. H. Brown,$ and D. C. Robertson*
ABSTRACTA new computer model, SHARC, has been developed by the Air Force for
calculating high-altitude atmospheric IR radiance and transmittance spectra with aresolution of better than 1 cm'. Comprehensive coverage of the 2 to 40 Am (250 to5,000 cm-1) wavelength region is provided for arbitrary lines of sight in the 50-300km altitude regime. SHARC accounts for the deviation from local thermodynamicequilibrium (LTE) in vibrational state populations by explicitly modeling the detailedproduction, loss, and energy transfer processes among the important molecularvibrational states. The calculated vibrational populations are found to be similar tothose obtained from other non-LTE codes. The radiation transport algorithm isbased on a single-line equivalent width approximation along with a statisticalcorrection for line overlap. This approach is reasonably accurate for mostapplications and is roughly two orders of magnitude faster than the traditional LBLmethods which explicitly integrate over individual itne shapes. In addition toquiescent atmospheric processes, this model calculates the auroral production andexcitation of CO2, NO, and NO' in localized regions of the atmosphere. Illustrativecomparisons of SHARC predictions to other models and to data from the CIRRIS,SPIRE and FWI field experiments are presented.
1. INTRODUCTION
The calculation of infrared (IR) radiance and transmittance spectra is important in
many areas of atmospheric science, including modeling the energy budget, analyzing data
from remote sounding experiments, and understanding molecular excitation and production
processes. The US Air Force has developed a number of computer codes that can address
these applications, including LOWTRAN, 1 MODTRAN, 2 and FASCODE. 3 In the upper
altitude regime, more sophisticated models are required to describe deviations from local
thermodynamic equilibrium (LTE) as radiative and collisional processes become
comparable. An initial non-LTE (NLTE) computer model, HAIRM, 4 resulted from
'Phillips Laboratory, Geophysics Directorate/OS, 29 Randolph Rd., Hanscom AFB, MA 01731-3010&kYap Analytics, Inc., 594 Marrett Rd., Lexington, MA 02173
Spectral Sciences, Inc., 99 S. Bedford St., Burlington, MA 01803
431 167

analyses of the 1977 SPIRE rocket measurements. 5-7 In addition, high resolution radiative
transport codes, NLTEs, 9 for the quiescent atmosphere and AARC 10 for auroral
conditions, were developed. However, a rapid and unified code spanning a wide range of
altitudes and conditions has been lacking.
This paper describes a new NLTE code, SHARC,' 1 which calculates upper
atmospheric IR radiation and transmittance. Its combination of speed and spectral
resolution (0.5 cm-1 ) should make it useful for many applications. The calculational model
includes all important IR-active species in the 2-40 pm wavelength region for arbitrary
line-of-sight (LOS) paths between 50 and 300 km. It incorporates the bands of NO, C0 2,
03, H20, OH, CO, and CH4 found in the quiescent atmosphere, including isotopic bands
of C0 2 , and H20. It also accounts for auroral production and excitation of C0 2, NO, and
NO+ caused by the flux of energetic solar electrons.
In accounting for NLTE effects, molecular vibrational state populations are
calculated by explicitly solving the chemical equations for the excitation and relaxation of
each vibrational state. As in other NLTE atmospheric models (e.g., Wintersteiner et al.,9
Lopez-Puertas et al. 12,13), steady-state kinetics are assumed for the quiescent atmosphericprocesses of collisional excitation, de-excitation, energy transfer, radiative decay, chemical
production, and illumination by the sun, earth, and atmosphere. The additional production
and excitation mechanisms resulting from electron deposition during auroral storms areincluded in SHARC using a time-dependent kinetic model.
A profile of vibrational state populations is input to the LOS spectral radiance
module, which performs line-by-line (LBL) radiation transport calculations using an
equivalent width formalism. This approach uses an algebraic approximation for the total
absorption by a single isolated line, resulting in a considerable enhancement in speed
compared to the standard LBL grid method, by which we mean explicit integration over
individual line shapes. Corrections are made for line overlap. As will be discussed below,
typical radiance differences with this approach are less than 10%.
SHARC is available for use by the scientific community and may be obtained from
the Air Force Phillips Laboratory/GPOS, 29 Randolph Rd., Hanscom AFB, MA 01731. ,, ;o'
CRAMI
2. CODE DESCRIPTION I AH
The schematic in Fig. 1 illustrates SHARC's module structure and overall -
calculational sequence. The input module is a menu-driven user interface. Atmospheric
temperature and species density profiles are specified via an external file. Profiles are b.Ai,Availib~i•ty Code
-2- DIsM spAcml
M QUALITY I NS TED 1 11 -1

OUTPUTS
II
I IIONS OW$NT J P TS
EXCITED-STATr
igre 1. S-R Mo -l Str- re ad -LIoNAR PATH Seuece
SPECTRAL RADIANCEAND TRANSMITTANCE
IN-~J wmrDIT
- --- - - - INTENSITr
Figure 1. SHARC Module Structure and Calculational Sequence.
required for the IR-active species (NO, C0 2 , H20, 03, CO, OH, and CH4), the majoratmospheric species to which they are collisionally coupled (N2, 02, 0), and atomic
hydrogen, whose reaction with 03 provides the main source of OH(v). Other input
parameters include LOS specifications and, if desired, the coordinates of a localized
auroral region through which the LOS may pass.
Altitude profiles of excited vibrational state populations are calculated in the
chemical kinetics and radiative transfer modules and saved in a data file for later use.
Under auroral conditions, a time-dependent chemical model then calculates the additional
production of C0 2, NO, and NO+ arising from interactions of auroral electrons. To
generate the desired LOS spectrum, the vibrational state populations are fed to the spectral
radiance module, which outputs radiance and transmittance spectra and in-band intensities.
Condensed descriptions of the calculations are given below. Additional information
may be found in the SHARC Users Manual. 11 Code upgrades in progress or planned are
indicated by the dotted lines in Fig. 1. These include: a generalized generator for
atmospheric profiles of IR-active species based on scaling of MSIS14 profiles; extending
the spectral region into the near IR and visible regions; and provisions for multiple, distinct
atmospheric regions, for use in modeling the solar terminator, tidal and gravity waves, or
other atmospheric inhomogeneities.
-3-

2.1 Quiescent Chemical Kinetics
The quiescent chemical kinetics are handled primarily through separate reaction setsfor each IR-active molecule; these sets are solved individually in each layer of theatmosphere to obtain the excited vibrational state population profiles. Atmospheric layers
are assumed to be horizontally uniform and typically 2 to 10 km in height. The reaction
database files contain the list of vibrational states for each molecule and the equations for
the chemical reactions and rate constants written in symbolic form. These equations
include chemical formation of excited vibrational states, collisional deactivation and
excitation (satisfying detailed balance), spontaneous emission, and the radiative excitation
processes associated with absorption of radiation from the sun and from the atmosphere.
The size of the database is indicated in Table 1.
Table 1. Quiescent Radiating Species in SHARC.
Molecule Isotopes States Reactions Bands
CO2 3 84 664 113
H 2 0 4 32 128 36
03 1 30 176 45
NO 1 3 5 3
CO 1 3 9 3
OH 1 10 32 24
CH4 1 12 52 13
The SHARC CHEMKIN module, which is based on the Sandia CHEMKIN
general-purpose chemical kinetics code, 15 reads the reaction files and sets up the time-
dependent differential rate equations. The quiescent vibrational state number density [M*]
in each atmospheric layer is obtained from the solution to the steady-state equations. The
species C0 2 (v), H20(v), and OH(v) are indirectly coupled to each other via resonant
energy transfer processes involving N2(v =1). 16,17 The steady-state equations for these
species are linearized by equating the ground vibrational state number densities to the total
number densities and then solving for the N2(v= 1) population.
The collisional rate constants were obtained from the recent literature and from
Taylor's reviewi1 of measurements prior to 1974; details are given elsewhere.1 9 The solar
excitation rates are derived using the LOS radiation transport model discussed below. For
"-4-

solar zenith angles greater than 900, MODTRAN 2 is used to account for the attenuation of
sunlight by the atmosphere below 50 kIn. The earthshine excitation rates are expressed in
terms of an effective blackbody temperature corresponding to the ,atitude where the
vibrational band becomes optically thick in a nadir view.
The calculation of the radiative excitation rate, ra, of molecular vibrational states
due to emission originating from atmospheric layers in the 50-300 km altitude range is
performed in a subroutine dubbed NEMESIS and follows the treatment of Kumer andco-workers. 16' 17 For a given vibrational band, the population enhancements of the
vibrational states are expressed via a set of linear equations,
[*i]- [M*]o = aii Pji.jM*j] , (1)
where ai is the probability for absorption of a photon entering layer i, Pji is the probability
that a photon emitted from layer j will be absorbed in layer i, and wi is the branching ratio
for re-emission. Both the P matrix elements and the ai depend on the populations of thelower vibrational states. Therefore, the calculation proceeds in stages to solve for
successively higher-energy states. The first CHEMKIN run (with all ra = 0) defines the
ground state populations [Mi] and the initial excited state populations [M*i]o for transitions
to the ground state. The results are used in NEMESIS to evaluate (P) and ai and tocompute the radiative excitation rates ra for those transitions. CHEMKIN is then rerun
including the ra to generate the corresponding populations for the next set of vibrationaltransitions. The CHEMKIN/NEMESIS sequence is repeated until solutions for the highest
energy states are obtained.
The major calculational effort in NEMESIS is computing the P matrix elements,which involves a multidimensional integral over the location, direction, vibration-rotation
line, frequency location within the line, and propagation distance of the emitted photons
within each layer. The integral is evaluated with the aid of Monte Carlo sampling using
trial "photons". The calculation assumes semi-infinite plane-parallel geometry and uses theVoigt line shape.
The CHEMKIN/NEMESIS calculations were verified by comparing vibrational
temperatures for NLTE vibrational states of C0 2 , which are both solar and earthshinepumped, with calculations by other workers. These profiles of vibrational temperatures are
consistent with the results of Wintersteiner et al. 9 and Lopez-Puertas et al., 20 who used
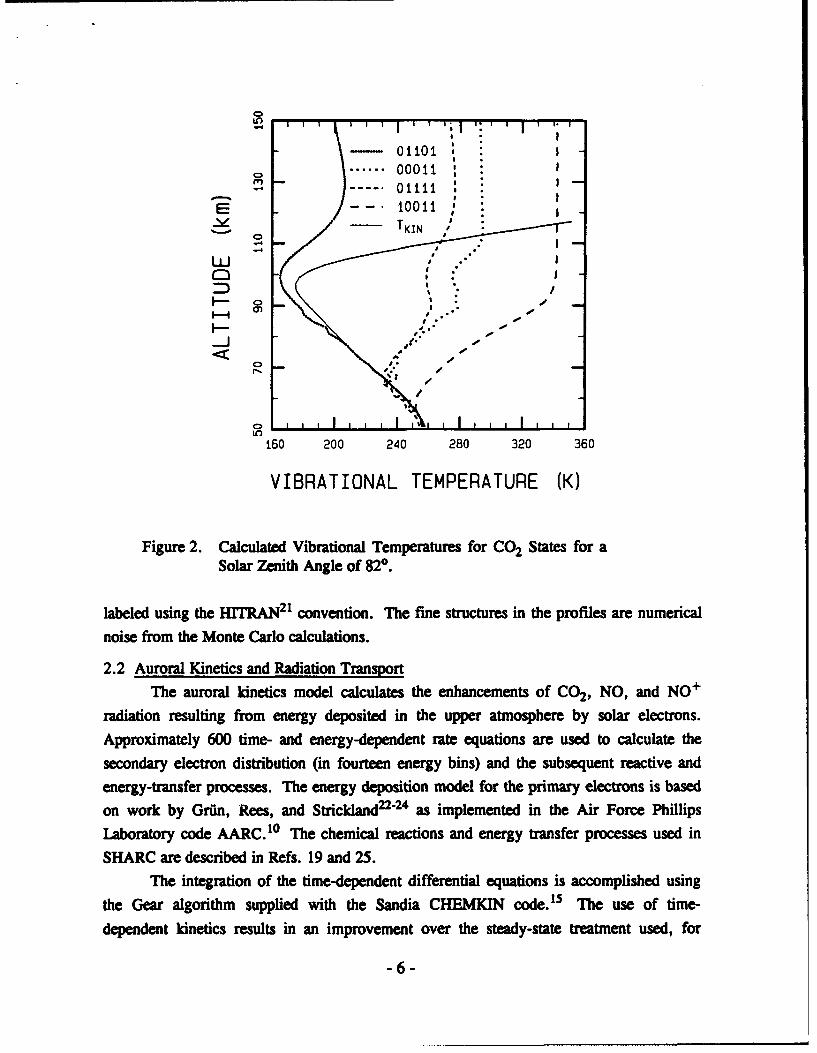
different computer algorithms but similar chemical kinetic models and atmosphericprofiles. Typical results from SHARC are shown in Fig. 2. The vibrational states are
-5-
01o-4' I
...... 00011 , I01111I
* "." I
0 20 20011 20 36
00
LO
VIBRATIONAL TEMPERATURE WK
Figure 2. Calculated Vibrational Temperatures for C02 States for aSolar Zenith Angle of 820.
labeled using the H1TRAN21 convention. The fine structures in the profiles are numerical
noise from the Monte Carlo calculations.
2.2 Auroral Kinetics and Radiation TransprThe auroral kinetics model calculates the enhancements of C02, NO, and NO+
radiation resulting from energy deposited in the upper atmosphere by solar electrons.
Approximately 600 time- and energy-dependent rate equations are used to calculate the
secondary electron distribution (in fourteen energy bins) and the subsequent reactive and
energy-transfer processes. The energy deposition model for the primary electrons is basedon work by Grfin, Rees, and Strickland22"24 as implemented in the Air Force Phillips
Laboratory code AARC.° 10hIe chemical reactions and energy transfer processes used in
SHARC are described in Refs. 19 and 25.
The integration of the time-dependent differential equations is accomplished usingthe Gear algorithm supplied with the Sandia CHEMKIN code. 15 The use of time-
dependent kinetics results in an improvement over the steady-state treatment used, for
-6-
example, in AARC. 10 According to SHARC, the NO(v=1) production efficiency per ion
pair increases with time during the aurora. This results from collisional excitation of the
increasing concentration of ground state NO, whereas in AARC the efficiency remainsconstant.
The emissions from NO and NO+ are both optically thin and prompt; by prompt,we mean that the excited states radiatively decay before they have a chance to relax
collisionally. Therefore, coupling of the radiative transfer and collisional processes is not
required, and the solutions to the excitation mechanisms for each layer suffice. However,
CO2 513 emission below 100 km is both optically thick and delayed, so that coupling the
CO 2 time-dependent chemical kinetics to a radiative transfer scheme is required. With the
present kinetic scheme, a full treatment would require either solving approximately 4000
coupled differential equations or repeating the radiative excitation calculations(CHEMKIN/NEMESIS) at each time increment. Since these are impractical, a modifiedescape function approximation,25 which assumes that photons emitted from a given layer
either escape the atmosphere or are re-absorbed within the layer, has been adopted. Toinsure the correct limit for negligible auroral excitation, SHARC includes a correctionwhich forces a match to the exact NEMESIS solution for ambient conditions. This
correction consists of a time-independent source or sink term added to the differential
equation for excitation of CO2 ,3 .
2.3 Line-of-Sight Spectral Radiance Model
In order to determine the LOS spectral radiance, the LOS properties are represented
in terms of a sequence of homogeneous segments. The spectral radiance contribution of a
single emission line, j, to a single segment, i, is modeled by1 r1
Iij O =) =- A R3j [ i Wij - i- W(- 1)j j , (2)
where V is the central frequency of the calculational spectral interval of width, AV, Rjj is
the emission source function, Wij is the cumulative equivalent width for the LOS path from
the observer through the i'th segment, and E is a correction factor which accounts for line
overlap. The total path spectral radiance is determined by direct summation of Ii over all
segments and lines.
The emission source term is derived directly from the kinetically determined
excited-state vibration rotation populations and is given by
-7-
C1V3 yj (3)Rij' I f -'ij '
where C1 is the first radiation constant and yij is the ratio of the upper-to-lower state
vibration-rotation populations. This expression for Rij reduces to the Planck blackbody
function in the limit in which all the vibration-rotation state populations are specified by
the local gas temperature, i.e., LTE conditions.
In the limit of no line overlap (Q = ) Eq. (2) is exact provided that the equivalent
widths are exactly determined, such as by explicit frequency integration over the line shape
function. However, this is computationally time consuming. By using the approximations
described below, a rapid evaluation can be achieved with only a modest sacrifice of
accuracy (about ± 10%).
The equivalent widths Wij for single lines are calculated using the Rodgers-
Williams 26 approximations for Voigt line shapes,
j v 2 WLWD)2 , (4)w2= ; o [ + WW ],
where the subscripts V, D, L, and W refer to the Voigt, Doppler, Lorentz, and weak-line
limits, and aD(cm"') is the Doppler linewidth. WD, WL, and Ww are calculated from the
approximations given by Ludwig et al.,27 which are accurate to within 8% or better, using
Curtis-Godson2 8' 29 path-averaged line parameters. The line strengths and air-broadened
half-widths are tabulated in a file generated from the HITRAN atlas2 ' that has been
supplemented with lines for NO+ and higher vibrational states of NO and 03.
The line overlap correction is based on the statistical overlap approximation in
which it is assumed that there is no positional correlation among the lines in the
calculational spectral interval. This approximation accounts for line wing overlap within
the spectral interval but does not include the contribution of line wings from lines centered
outside the interval. The correction factor is given by
1= ]v [- 1( Wij (5)J j
In applying this spectral radiance model, it is implicitly assumed that the
calculational spectral interval width, Av, is larger than the largest single-line equivalent
width for the entire LOS. This limits the calculational spectral resolution to about 0.5 cm"1
for tangent paths near the lower atmosphere boundary of 50 km. However, higher spectral
resolution can be used for non-limb paths or limb paths with higher-altitude tangent points.
-8-

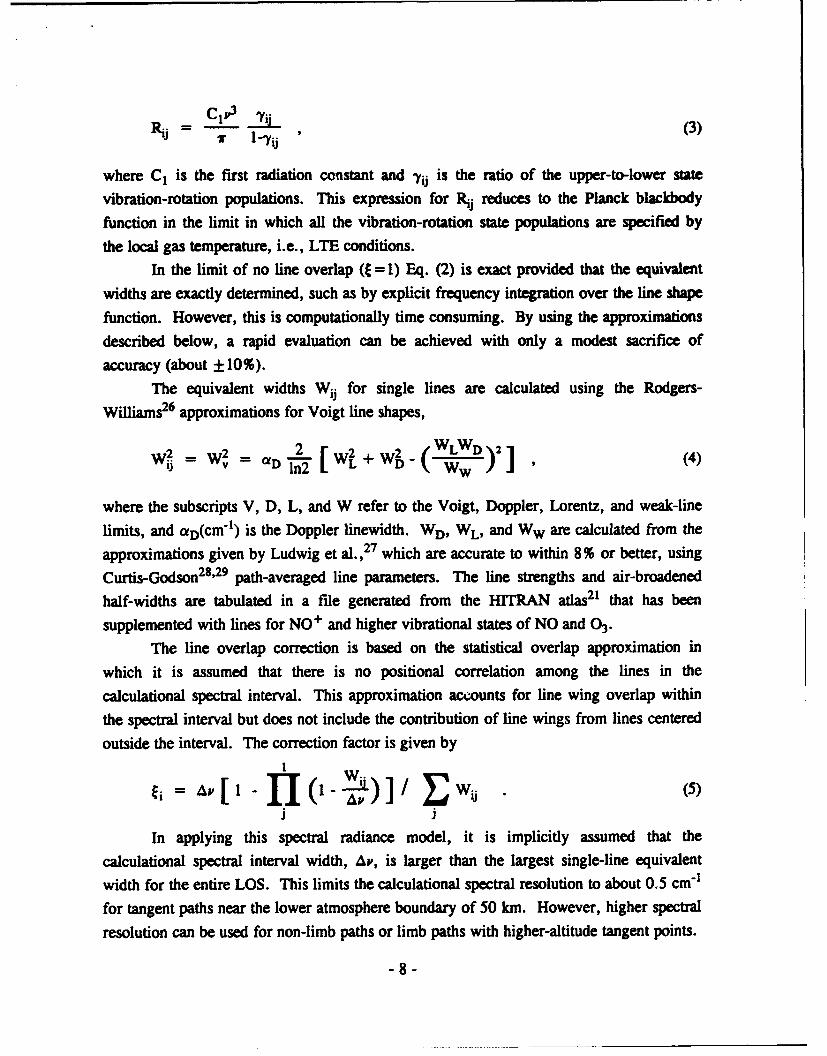
The accuracy of this LOS radiance algorithm has been explored through
comparisons to standard high-resolution LBL grid calculations for typical atmospheric
conditions. A number of different regimes were investigated, including vertical and
horizontal viewing geometries, optically thin and thick lines, multiple overlapping linesand bands, and LTE and NLTE conditions. Figures 3a and 3b show SHARC limb
radiance calculations for just CO2 in the v2 spectral region at tangent altitudes of 50 and 75
km, respectively. Each figure also includes the absolute value of the difference spectrum
which was obtained by subtracting a LBL grid method calculation from the SHARC
calculations. A major source of error in the SHARC calculations is the statistical line
overlap approximation. This approximation under-corrects for line overlap when the
emission lines in a given spectral interval are nearly degenerate. This can be seen in the 50
km limb calculation shown in Figure 3a for the Q branch near 597 cm"1 and leads to a 20%
over prediction for the radiance over a 2 cm-1 spectral interval. The line overlap
approximation over-corrects for line overlap when the emission lines in a spectral interval
are nearly equally spaced. This occurs in the calculation shown in Figure 3a in the Q
branch near 667 cmi1 and leads to an error of 10%. For LOS's and bands which have less
line overlap, such as the 75 km limb calculation in Figure 3b, peak errors remain below
10%. The SHARC calculation is roughly two orders of magnitude faster than a LBL
calculation using FASCODE.
3. DATA COMPARISONS
While comparisons with other computer codes can verify the numerical algorithms,
upper atmospheric IR data are needed to assess the reasonableness of the various model
assumptions, including kinetic mechanisms, rate constants, and properties of the
atmosphere. To illustrate typical levels of agreement between field data and model
calculations in diverse applications, several comparisons of SHARC predictions and data
from US Air Force-sponsored field experiments are presented.
The C1RRIS-IA experiment30 conducted on the Space Shuttle STS-39 during April,
1991, collected the first extensive set of limb IR radiance spectra over a wide altitude range
using a sensitive cryogenic Michelson interferometer with a spectral resolution of 1 cm-1 .
A typical quiescent nighttime spectrum in the 780-1250 cm"1 spectral region is shown in
Figs. 4a and 4b; the tangent height at the center of the detector FOV is about 64 km. For
clarity in plotting, the resolution of the original spectrum has been degraded to 3 cm"1
FWHM. The major features are CO2 hot bands near 791 cm"1 and 961 cm-', the v3
-9-
I l I I l In
0 -E-
Cf)
C- -U3 0
c'J
u 0M
.4 .
-- :. ::. .
I< s : /. f.3 *' 'i-
500 600 700 800
FREQUENCY (cm- 1)Figure 3a. SHARC (Solid) and SHARC minus LBL Difference (Dotted)
Spectra for CO2 Radiance for a 50 km Limb View.
2U C
cn_'Cn
%% 0 :. :
- ' "ii. '"o . :
C210
500 600 700 800
FREQ]UENCY (cm-1)Figure 3b. SHARC (Solid) and SHARC minus LBL Difference (Dotted)
Spectra for CO2 Radiance for a 75 kmn Limb View.
- 10-

S- - CIRRIS-IA DataS...SHARC Calc
U
U 0-J
Cn 1'
750 850 950 1050 1150 1250
FREQUENCY (cm-1)
-. 0 Is
' I
E
U
L b)
U0
-cc
ccI
U .
1250 1350 1450 1550
FRIEQUENCY (cm-1)
Figure 4. Quiescent Nighttime Limb Spectrum from the CIRRS-1AExperimentO° Near 64 km Tangent Height and SHARCSimulation.
I-11
(1042 cm-1) and sq (1103 cm' 1) bands of 03, the v4 band of CH4 near 1311 cm-1, and
resolved lines of the P2 band of H20, which dominate the spectrum beyond around 1370
cm-1 . The overlaid SHARC calculation, performed for similar viewing conditions,
reproduces the observed spectral structure throughout this region. The up to factor-of-two
differences in the absolute intensities of some bands are ascribed to differences in species
concentrations between the actual atmosphere and the model atmosphere, which is derived
from the NRL Trace Gas Climatology database.31
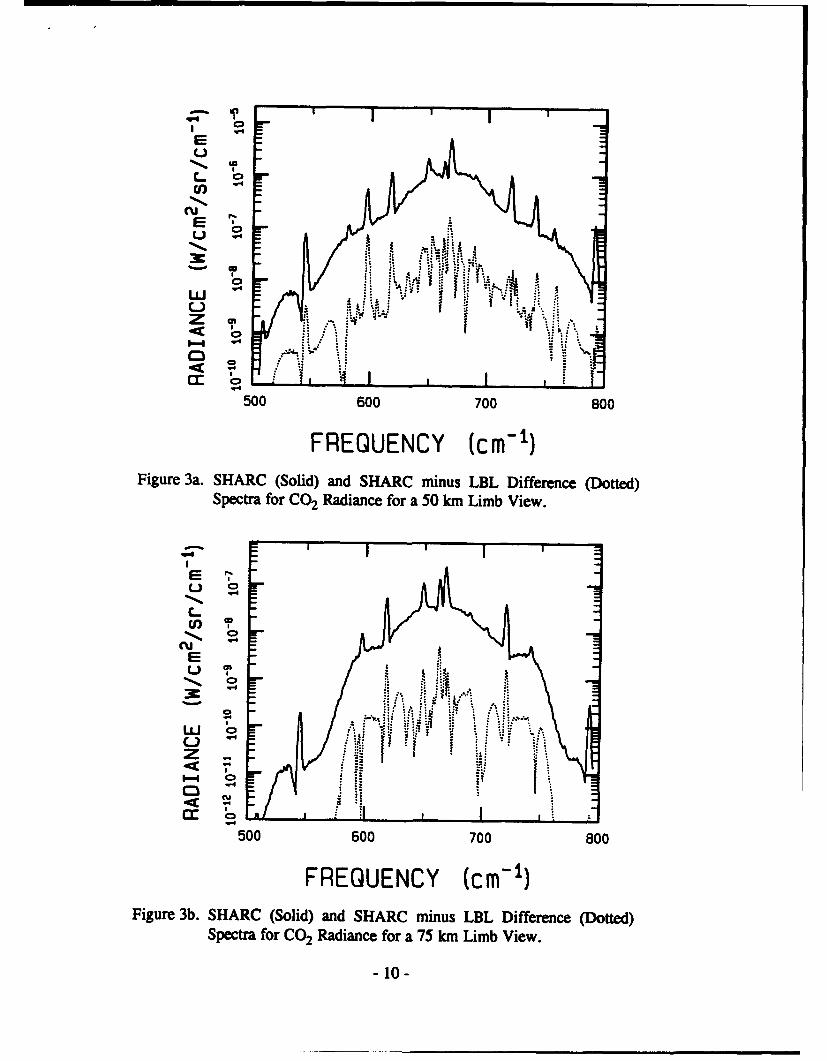
Data for upper atmospheric CO2 v3 emission and its dependence on solar angle is
provided in Fig. 5, which shows the limb radiance measured in an earlier rocket
experiment, SPIRE,32 launched from Poker Flat Research Range, Alaska near the dawn
terminator. Different phenomena dominate the excitation depending on the altitude
regimes. During the day, the primary isotope is solar-excited above 110 kin, while at
lower altitudes the radiance is enhanced by pumping of the 2.7 pm band and by emissions
t-- 111'1" " I 11' " 1"1 I I 1"1111 1 1 1111" 1 "
[] Scan 4-8 DataSSHARC 990-1070 SZA
E A Scan 9,10.12 Data\- .... SHARC 770-880 SZA
4-)
I _- %" %
CD
0) U--
to-1O 10-9 10-11 tO-7 t10 -6 10-5
In-Band Radiance (W/cm 2/sr)Figure 5. CO2 4.3 )m Band Limb Radiance Measured in the SPIRE Rocket
Experiment3 2 and Predicted by SHARC for Different Solar ZenithAngles Near the Dawn Terminator.
- 12-

from hot bands and minor isotopes. 6' 33 As the density increases, the widening line shape
makes the single-quantum excitation of the primary isotope again important with
contributions from multiple quantum bands at 1.6, 2.0, and 2.7 Am. 6 The SPIRE data and
the SHARC calculations agree to within the data scatter, which averages around a factor of
two.
An example of SHARC's capability to calculate auroral radiance enhancements is
shown in Fig. 6. A nitric oxide spectrum from the Field-Widened Interferometer rocket
experiment, 34 which observed an IBC Class II aurora, is compared with a SHARC model
calculation at a resolution of 1 cm"1. The auroral calculation uses energy deposition
parameters described by Picard et al. 35 The reaction of metastable nitrogen atom, N(2D),
with molecular oxygen has been assumed to be the only source of NO chemiluminescence
in the SHARC auroral model. The overall band shape, which includes strong aurorally
induced hot band contributions, is reproduced well by the calculation, except near the
edges of the band where NLTE rotational populations, not currently modeled, yield
enhanced high rotational lines. The calculated absolute radiance is a factor of four lower
C)
U -FWI Data- .. SHARC
r=_ U
2 -,U
0
PII I f
-"j II.cc
oý -Lt~ ?
Cfl 0'. L
1600 1700 1800 1900 2000
FREQUENCY (cm-1)Figure 6. Calculated and Observed34 NO Spectrum for Zenith Viewing
Through a Class II Aurora from 90 km Altitude.
- 13-

than the data. Solomon36 and Gfrard et al.A have suggested that the reaction of
translationally hot N(4S) with 02 may be an important contributor to NO formed in the
thermosphere. Sharma et al.38 have presented calculations that show that the reaction of
N(4S) atoms with 02 accounts for recent observations of highly rotationally excited NO
vibrational emissions in the dayglow. 39 Finally, the reactions of N(4S) and N(2D) with 02
may lead to a quantitative explanation of NO formed in recent artificial auroral
experiments.40 Given the uncertainties associated with characterization of the aurora and
as well as the role of N('S) in the formation of NO, the agreement between the model and
data is encouraging.
Numerous other data and model comparisons have been and are currently being
performed for all the major atmospheric IR emission bands during daytime, nighttime, and
auroral conditions. The results will be reported in future papers.
4. CONCLUSION
A new computer m,'el, SHARC, has been developed by the Air Force for rapid
LBL calculation of NLTE upper atmospheric IR radiance and transmittance spectra with a
resolution of 1.0 cm'1 or better. SHARC treats the important molecular vibrational bands
from 2 to 40 pm (250 to 5,000 cm"1) for arbitrary lines of sight in the 50-300 km altitude
range, accounting for the detailed production, loss, and energy transfer processes among
the important vibrational states. Calculated vibrational temperatures agree with results
from other NLTE codes, 9"10' 13 and the equivalent-width spectral algorithm used in LOS
radiation transport calculations results in a considerable time savings over grid LBL
methods that explicitly integrate over the full line shape.
Comparisons of SHARC radiance predictions with field measurements, especially
those from CIRRIS 1A, are ongoing. Comparisons performed to date indicate reasonable
agreement for most emission bands, including the CO2 4.3 pm feature, which poses a good
test for different aspects of the code. Planned upgrades include a solar terminator module
and extension of the spectral region down to the near IR. Data simulations using SHARC
have applications to remote sensing of the upper atmosphere, such as deriving density
profiles for species like NO, 03, and H 2 0, which have significant atmospheric variability.
5. ACKNOWLEDGEMENTS
The authors wish to thank Dr. A.J. Ratkowski and Dr. W.A.M. Blumberg (Phillips
Laboratory/GPOS) for their support during the development of SHARC and Mr. R.M.
- 14-

Nadile of the Phillips Laboratory/GPOS for providing the emission spectrum from the
CIRRIS IA measurements. The authors also wish to acknowledge Dr. V.I. Lang of theAerospace Corp. for reviewing the chemical kinetic database. This work was funded by
the Ballistic Missile Defense Organization (formerly SDIO) under PMA 1105.
6. REFERENCES1. F.X. Kneizys, G.P. Anderon, E.P. Shettle, W.O. Gallery, L.W. Abreu, J.E.A. Selby, J.H.
Chetwynd, and S.A. Clough, "Users Guide to LOWTRAN 7," AFGL-TR-88-0177, (NTISNo. ADA 206773) (1988).
2. G.P. Anderson, J.H. Chetwynd, J.-M. Theriault, P. Acharya, A. Berk, D.C. Robertson,F.X. Kneizys, M.L. Hoke, L.W. Abreu, and E.P. Shettle, "MODTRAN2: Suitability forRemote Sensing," SPIE Proc., 1968 (1993)
3. S.A. Clough, F.X. Kneizys, E.P. Shettle, and G.P. Anderson, "Atmospheric Radiance andTransmittance: FASCOD2", Proc. of the Sixth Conference on Atmospheric Radiation, pp.141-144, Am. Met. Soc., Boston, MA (1986).
4. T.C. Degges and A.P. D'Agati, "A User's Guide to the AFGLNisidyne High AltitudeInfrared Radiance Model," AFGL-TR-85-0015 (NTIS No. ADA 161432) (1985).
5. A.T. Stair, Jr., R.D. Sharma, R.M. Nadile, D.J. Baker, and W.F. Grieder, "Observations ofLimb Radiance with Cryogenic Spectral Infrared Rocket Experiment," J. Geophys. Res., 90,9763 (1985).
6. R.D. Sharma and P.P. Wintersteiner, "CO2 Component of Daytime Earth Limb Emission at2.7 itm," J. Geophys. Res., 90, 9789 (1985)
7. R.D. Sharma and R.J. Healey, "Earthlimb Emission Analysis of _pectral Infrared RocketExperiment (SPIRE) Data at 2.7 /I= - A 10 Year Update," SPIE Proc., 1540 (1991)
8. R.D. Sharma, R.D. Siani, M.K. Bullitt, and P.P. Wintersteiner, "A Computer Code toCalculate Emission and Transmission of Infrared Radiation Through Non-EquilibriumAtmospheres," AFGL-TR-83-0168 (NTIS No. ADA 137162) (1983).
9. P.P. Wintersteiner, R.H. Picard, R.D. Sharma, J.R. Winick, and R.A. Joseph, "Line-by-LineRadiative Excitation Model for the Non-Equilibrium Atmosphere: Application to CO2 15-1&mEmission," J. Geophys. Res., 97, 18083 (1992).
10. J.R. Winick, R.H. Picard, R.D. Sharma, R.A. Joseph, and P.P. Wintersteiner "RadiativeTransfer Effects on Aurora Enhanced 4.3 Micron Emission," Adv. Space Res., 7, 17-21(1987).
11. R.D. Sharma, J.W. Duff, R.L. Sundberg, L.S. Bernstein, J.H. Gruninger, D.C. Robertson,and R.J. Healey, "Description of SHARC-2, The Strategic High-Altitude Radiance Code,"PL-TR-91-2071, (NTIS No., ADA 239008) (1991).
- 15-
'9
12. M. Lopez-Puertas, R. Rodrigo, A. Molina, and F.W. Taylor, "A Non-LTE RadiativeTransfer Model for Infrared Bands in the Middle Atmosphere, I, Theoretical Basis andApplication to CO2 15 ;&m Bands," J. Anmos. Terr. Phys., 48, 729 (1986).
13. M. Lopez-Puertas, R. Rodrigo, J.J. Lopez-Moreno, and F.W. Taylor, "A Non-LTERadiative Transfer Model for Infrared Bands in the Middle Atmosphere, II, CO2 (2.7 and 4.3;&m) and Water Vapor (6.3 pm) Bands and N2(1) and 02(1) Vibrational Levels," J. Atmos.Terr. Phys., 48, 749 (1986).
14. A.E. Hedin, "Extension of the MSIS Thermospheric Model into the Middle and LowerAtmosphere," J. Geophys. Res., 96, 1159 (1991).
15. R.J. Kee, J.A. Miller, and T.H. Jefferson, "CHEMKIN: Problem-Independent,Transportable, Fortran Chemical Kinetics Code Package," Sandia Rpt. No. SAND80.8003,Sandia National Laboratory, Livermore, CA 94550 (1980).
16. J.B. Kumer and T.C. James, "CO2 (001) and N2 Vibrational Temperatures in the50! Z < 130 km Altitude Range," J. Geophys. Res., 79, 638 (1974).
17. J.B. Kumer, "Atmospheric CO2 and N2 Vibrational Temperatures at 40- to 140-km Altitude,"J. Geophys. Res., 82, 16 (1977).
18. R.L. Taylor, "Energy Transfer Processes in the Stratosphere," Can. J. Chem., 52, 1436(1974).
19. D.C. Robertson, P.K. Acharya, S.M. Adler-Golden, L.S. Bernstein, F. Bien, J.W. Duff,J.H. Gruninger, R.L. Sundberg, R.J. Healey, J.M. Sindoni, P.M. Bakshi, A. Dalgarno, andB. Zygelman, "Investigations into Atmospheric Radiative Processes in the 50-300 kmRegime," PL-TR-91-2137, (NTIS No. ADA 251588) (1991).
20. M. Lopez-Puertas, M.A. Lopez-Valverde, C.P. Rinsland, and M.R. Gunson, "Analysis ofthe Upper Atmosphere CO2(,v2) Vibrational Temperatures Retrieved From ATMOS/Spacelab3 Observations," J. Geophys. Res., 97, 20469 (1992).
21. L.S. Rothman, R.R. Gamache, A. Goldman, L.R. Brown, R.A. Toth, H.M. Pickett, R.L.Poynter, J.M. Flaud, C. Camy-Peyret, A. Barbe, N. Husson, C.P. Rinsland, and M.A.H.Smith, "The H1TRAN Molecular Database: Editions of 1991 and 1992," J. Quant.Spectrosc. Radiat. Transfer, 48, 469 (1992).
22. A.E. Grdn, "Luminescenz-photometrische Messungen der Energieabsorption imStrahlungsfeld von Elektronenquellen Eindimensionaler Fall im Luft," Z Natiirforsch., 112a,89-95 (1957).
23. M.H. Rees, "Auroral Ionization and Excitation by Incident Energetic Electrons," Planet.Space Sci., 111, 1209-18 (1964).
24. D.J. Strickland, J.R. Jasperse, and J.A. Whalen, "Dependence of Auroral FUV Emissions onthe Incident Electron Spectrum and Neutral Atmosphere," J. Geophys. Res., 88, 8051-62(1983).
25. J.B. Kumer, "Theory of the CO2 4.3 pm Aurora and Related Phenomena," J. Geophys.Res., 82, 2203 (1977).
-16-

26. C.D. Rodgers and A.P. Williams, "Integrated Absorption of a Spectral Line with the VoigtProfile," J. Quant. Spectrosc. Radiat. Transfer, 14, 319 (1974).
27. C.B. Ludwig, W. Malkmus, J.E. Reardon, and J.A. Thomson, Handbook of InfraredRadiation From Combustion Gases, SP-3080, Scientific and Technical Information Office,NASA, Washington DC (1973).
28. A.R. Curtis, "A Statistical Model for Water Vapour Absorption," Q. J. R. Meteorol. Soc.,78, 638-640 (1952)
29. W.L. Godson, "The Evaluation of Infrared-Radiative Fluxes due to Atmospheric WaterVapour," Q. J. R. Meteorol. Soc., 79, 367-379 (1953).
30. D.R. Smith, W.A.M. Blumberg, R.M. Nadile, S.J. Lipson, E.R. Huppi, and N.B. Wheeler,"Observation of High-N Hydroxyl Pure Rotation Lines in Atmospheric Emission Spectra bythe CIRRIS-IA Space Shuttle Experiment," Geophys. Res. Lett., 19, 593 (1992).
31. M.E. Summers, W.J. Sawchuck, and G.P. Anderson, "Model Climatologies of Trace Speciesin the Atmosphere," Annual Review Conference on Atmospheric Transmission Models,Phillips Laboratory, Hanscom AFB, MA 01731 (June 1992)
32. A.T. Stair, Jr., R.D. Sharma, R.M. Nadile, D.J. Baker, and W.F. Grieder, "Observations ofLimb Radiance with Cryogenic Spectral Infrared Rocket Experiment," J. Geophys. Res., 90,9763 (1985).
33. J.B. Kumer, R.M. Nadile, and W. Grieder, "Detailed Analysis of 4.3 pm Earthlimb Data,"SPIE Proceedings, 430, 244, SPIE, Box 10, Bellingham, WA 98227 (1983)
34. P.J. Espy, C.R. Harris, A.J. Steed, J.C. Ulwick, R.H. Haycock, and R.A. Straka,"Rocketborne Interferometer Measurement of Infrared Auroral Spectra," Planet. Space Sd.,36, 543 (1988).
35. Picard, R.H., J.R. Winick, R.D. Sharma, A.S. Zachor, P.J. Espy, and C.R. Harris,"Interpretation of infrared measurements of the high-latitude thermosphere from arocketborne interferometer," Adv. Space Res., 7, 23-30 (1987).
36. Solomon, S., "The possible effects of translationally excited nitrogen atoms on lowerthermospheric odd nitrogen," Planet. Space Sci., 31, 135-139 (1983).
37. Gkard, J.-C., V.I. Shematovich, D.V. Bisikalo, "Non thermal nitrogen atoms in the Earth'sthermosphere 2. a source of nitric oxide," Geophys. Res. Lett., 18, 1695-1698 (1991).
38. Sharma, R.D., Y. Sun, and A. Dalgarno, "Highly rotationally excited nitric oxide in theterrestrial thermosphere," Geophys. Res. Lett., 20, 2043-2045 (1993).
39. Armstrong, P.S., S.J. Lipson, J.R. Lowell, W.A.M. Blumberg, D.R. Smith, R.M. Nadile,and J.A. Dodd, "Analysis of comprehensive CIRRIS IA observations of nitric oxide in thethermosphere," Eos Trans AGU, 74, 225 (1993).
40. Lipson, S.J., P.S. Armstrong, J.R. Lowell, W.A.M. Blumberg, D.E. Paulsen, M.J. Fraser,W.T. Rawlins, D.B. Green, R.E. Murphy, and J.A. Dodd, "Mission-wide EXCEDE m] nitricoxide spectroscopic analysis," Eos Trans AGU, 74, 225 (1993).
- 17-