shale gas extraction: volunteer monitoring manual
TRANSCRIPT
© 2016 Alliance for Aquatic Resource Monitoring. Shale Gas Extraction: Volunteer Monitoring Manual. Is licensed under the Creative Commons Attribution-NonCommercial-NoDerivatives 4.0 International license.
http://creativecommons.org/licenses/by-nc-nd/4.0/
If you would like to use this content in other ways, please email us.
Alliance for Aquatic Resource Monitoring
Shale Gas Extraction: Volunteer Monitoring Manual
Visit ALLARM’s Shale Gas Database to input/view data, research and for training resources, presentations and videos: ALLARMwater.org
Version 3.2: September 2016
Alliance for Aquatic Resource Monitoring (ALLARM), 2016 Page 2
Primary Authors: • Candie C. Wilderman, professor of Environmental Science at Dickinson College and ALLARM Founder and
Science Advisor, [email protected]. • Jinnieth J. Monismith, ALLARM Assistant Director, [email protected].
Contacts for Workshops:
• Julie Vastine, ALLARM Director, [email protected]. • Holden Sparacino, ALLARM Outreach Manager, [email protected], (717) 245-1678.
Note: This manual is designed to be a dynamic document. The most up-to-date version can be found on ALLARM’s Shale Gas Database ALLARMwater.org. We expect changes as we conduct training workshops across the region and continue to learn from our interactions with professionals in the field and with volunteers. Please feel free to send us your comments, corrections, and suggestions!
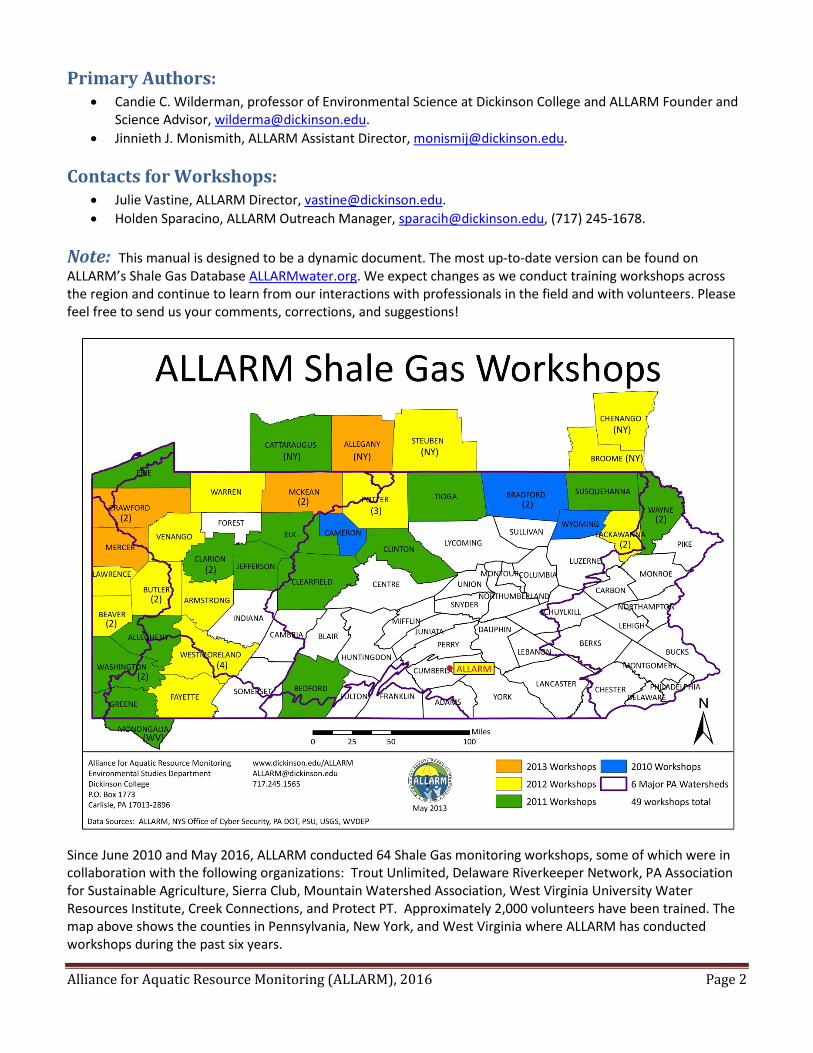
Since June 2010 and May 2016, ALLARM conducted 64 Shale Gas monitoring workshops, some of which were in collaboration with the following organizations: Trout Unlimited, Delaware Riverkeeper Network, PA Association for Sustainable Agriculture, Sierra Club, Mountain Watershed Association, West Virginia University Water Resources Institute, Creek Connections, and Protect PT. Approximately 2,000 volunteers have been trained. The map above shows the counties in Pennsylvania, New York, and West Virginia where ALLARM has conducted workshops during the past six years.
Alliance for Aquatic Resource Monitoring (ALLARM), 2016 Page 3
Table of Contents Background on ALLARM ........................................................................................................................................................ 4 Protocol and Monitoring Goals ............................................................................................................................................. 5 The Monitoring Process ........................................................................................................................................................ 5 Shale Gas Background ........................................................................................................................................................... 6
Marcellus and Utica Shale ....................................................................................................................................... 6 Frack Water ............................................................................................................................................................. 6 Flowback Water ....................................................................................................................................................... 6
Protocol Overview................................................................................................................................................................. 7 Visual Observations ................................................................................................................................................. 7 Chemical Monitoring ............................................................................................................................................... 7 Stage Monitoring ..................................................................................................................................................... 8
Choosing Site Locations ........................................................................................................................................................ 9 Baseline Monitoring Sites ........................................................................................................................................ 9 Locating and Mapping Shale Gas Wells ................................................................................................................. 10 Active Drilling Monitoring Sites ............................................................................................................................. 11
Weekly Monitoring ............................................................................................................................................................. 12 Visual Observations ............................................................................................................................................... 12 Chemical Monitoring ............................................................................................................................................ 13 Stage Monitoring ................................................................................................................................................... 16
Semiannual Analysis ............................................................................................................................................................ 18 Quality Assurance/Quality Control ....................................................................................................................... 18 Barium and Strontium Monitoring ........................................................................................................................ 19
Data Management .............................................................................................................................................................. 20 Individual Data Sheets ........................................................................................................................................... 20 Field Data Log ........................................................................................................................................................ 20 Database (ALLARMwater.org) .............................................................................................................................. 20
Data Interpretation ............................................................................................................................................................. 21 Visual Observations ............................................................................................................................................... 21 Chemical Monitoring ............................................................................................................................................. 21 Chemical, Physical and Pipeline Decision Trees .................................................................................................... 22
Reportable Event ................................................................................................................................................................ 25 Action Steps ........................................................................................................................................................... 25 Who to Contact ..................................................................................................................................................... 25
References .......................................................................................................................................................................... 26 Acknowledgements ............................................................................................................................................................. 26 Appendix A: Agency Contact Information .......................................................................................................................... 27 Appendix B: Visual Observations Checklist ........................................................................................................................ 28 Appendix C: Chemical and Stage Monitoring Data Sheet .................................................................................................. 29 Appendix D: LaMotte Tracer PockeTester Directions ........................................................................................................ 30 Appendix E: Quality Assurance/Quality Control Form ....................................................................................................... 31 Appendix F: Field Data Log ……………………………………………………………………………………………………………………………………………32
Alliance for Aquatic Resource Monitoring (ALLARM), 2016 Page 4
Background on ALLARM The Alliance for Aquatic Resource Monitoring (ALLARM) is a project of the Environmental Studies Department at Dickinson College. Since its founding in 1986, ALLARM has become a nationally recognized technical and programmatic support center for community organizations interested in watershed assessment, protection, and restoration. ALLARM’s program goals are to:
1) Enhance local action for the protection and restoration of Pennsylvania watersheds by empowering
communities with scientific knowledge and tools to implement watershed assessments; 2) Provide Dickinson College students with opportunities to participate in community-based participatory
research thereby enhancing the quality of undergraduate science education; and 3) Be the leader in volunteer monitoring in Pennsylvania and a national model for college-community
partnerships. Through the work of student and professional staff, ALLARM offers comprehensive services to enable groups to use critical scientific tools to enhance environmental quality and fully participate in community decision-making. The program staff includes a Director, two Assistant Directors, a faculty Science Director, and 12-14 undergraduate student staff. For more information on ALLARM please visit: dickinson.edu/ALLARM or email: [email protected] or mail:
Dickinson College/ALLARM P.O. Box 1773
Carlisle, PA 17013 717.245.1565
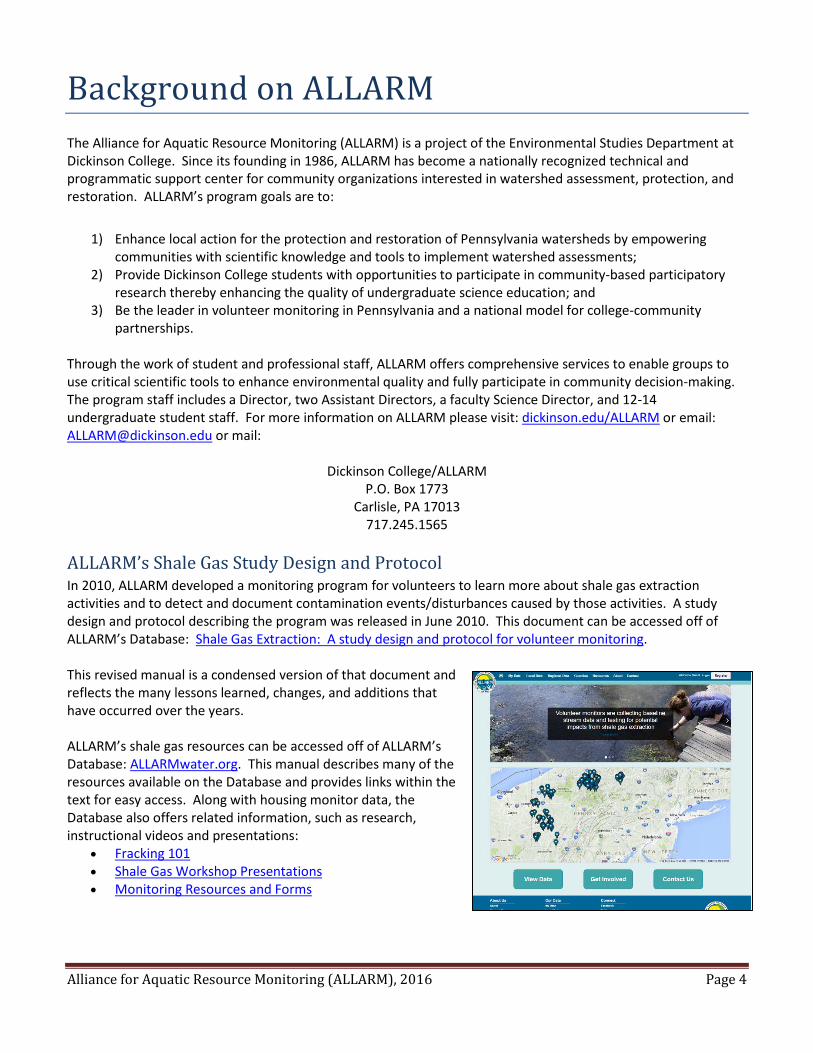
ALLARM’s Shale Gas Study Design and Protocol In 2010, ALLARM developed a monitoring program for volunteers to learn more about shale gas extraction activities and to detect and document contamination events/disturbances caused by those activities. A study design and protocol describing the program was released in June 2010. This document can be accessed off of ALLARM’s Database: Shale Gas Extraction: A study design and protocol for volunteer monitoring. This revised manual is a condensed version of that document and reflects the many lessons learned, changes, and additions that have occurred over the years. ALLARM’s shale gas resources can be accessed off of ALLARM’s Database: ALLARMwater.org. This manual describes many of the resources available on the Database and provides links within the text for easy access. Along with housing monitor data, the Database also offers related information, such as research, instructional videos and presentations:
• Fracking 101 • Shale Gas Workshop Presentations • Monitoring Resources and Forms
Alliance for Aquatic Resource Monitoring (ALLARM), 2016 Page 5
Protocol and Monitoring Goals The goals of ALLARM’s Shale Gas Volunteer Monitoring Protocol include:
1. Detect contamination in small streams and the surrounding area caused by gas extraction activities. 2. Document the stream quality and changes over time. 3. Educate individuals in the community about monitoring and impacts related to shale gas extraction.
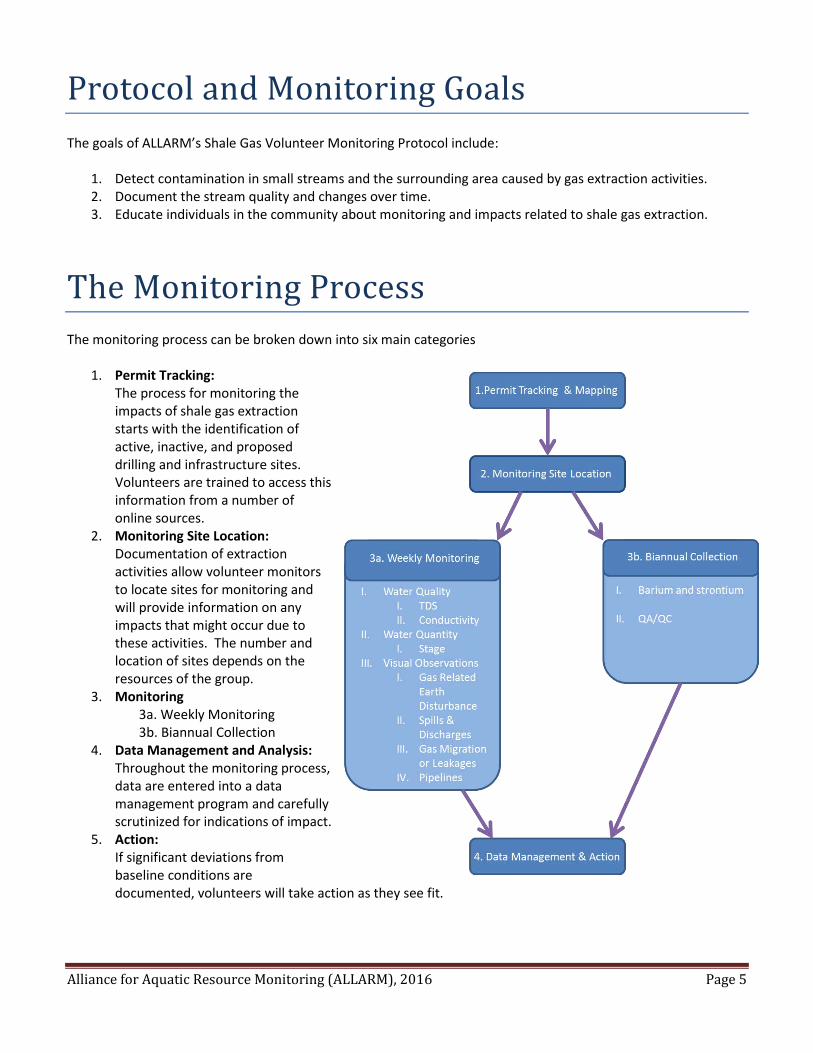
The Monitoring Process The monitoring process can be broken down into six main categories
1. Permit Tracking: The process for monitoring the impacts of shale gas extraction starts with the identification of active, inactive, and proposed drilling and infrastructure sites. Volunteers are trained to access this information from a number of online sources.
2. Monitoring Site Location: Documentation of extraction activities allow volunteer monitors to locate sites for monitoring and will provide information on any impacts that might occur due to these activities. The number and location of sites depends on the resources of the group.
3. Monitoring 3a. Weekly Monitoring 3b. Biannual Collection
4. Data Management and Analysis: Throughout the monitoring process, data are entered into a data management program and carefully scrutinized for indications of impact.
5. Action: If significant deviations from baseline conditions are documented, volunteers will take action as they see fit.
Alliance for Aquatic Resource Monitoring (ALLARM), 2016 Page 6
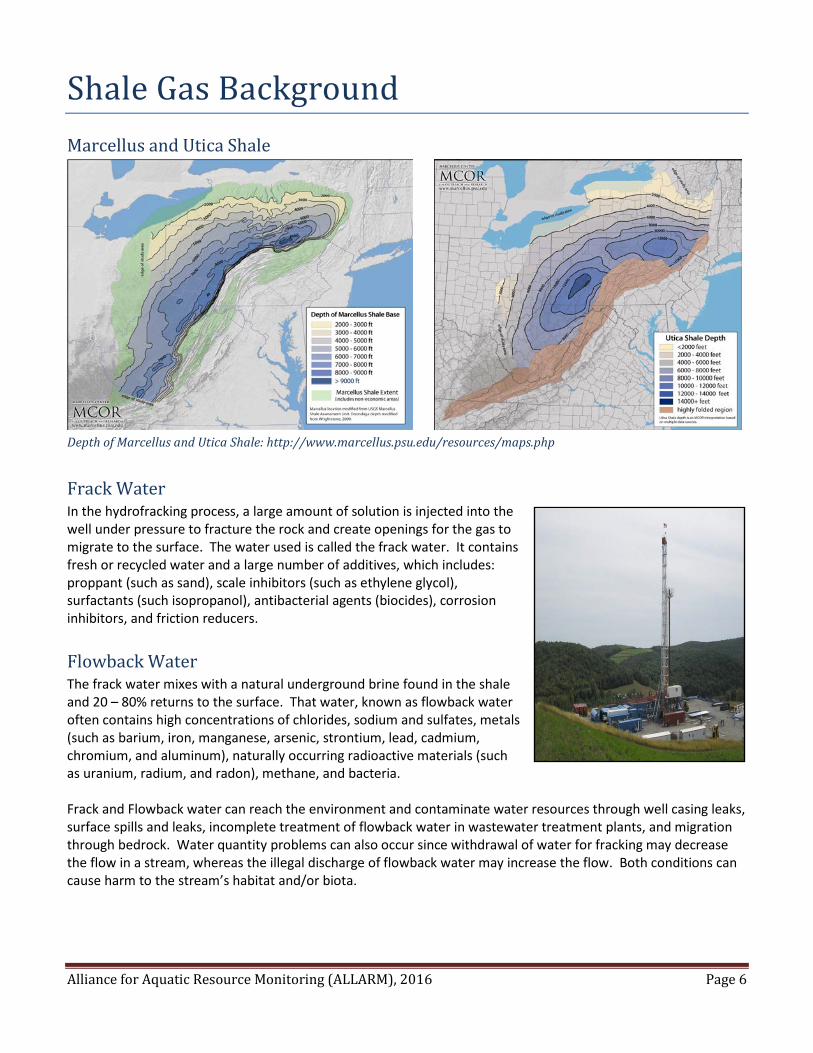
Shale Gas Background Marcellus and Utica Shale
Depth of Marcellus and Utica Shale: http://www.marcellus.psu.edu/resources/maps.php
Frack Water In the hydrofracking process, a large amount of solution is injected into the well under pressure to fracture the rock and create openings for the gas to migrate to the surface. The water used is called the frack water. It contains fresh or recycled water and a large number of additives, which includes: proppant (such as sand), scale inhibitors (such as ethylene glycol), surfactants (such isopropanol), antibacterial agents (biocides), corrosion inhibitors, and friction reducers. Flowback Water The frack water mixes with a natural underground brine found in the shale and 20 – 80% returns to the surface. That water, known as flowback water often contains high concentrations of chlorides, sodium and sulfates, metals (such as barium, iron, manganese, arsenic, strontium, lead, cadmium, chromium, and aluminum), naturally occurring radioactive materials (such as uranium, radium, and radon), methane, and bacteria. Frack and Flowback water can reach the environment and contaminate water resources through well casing leaks, surface spills and leaks, incomplete treatment of flowback water in wastewater treatment plants, and migration through bedrock. Water quantity problems can also occur since withdrawal of water for fracking may decrease the flow in a stream, whereas the illegal discharge of flowback water may increase the flow. Both conditions can cause harm to the stream’s habitat and/or biota.
Alliance for Aquatic Resource Monitoring (ALLARM), 2016 Page 7
Protocol Overview In order to fully document stream quality and detect multiple types and sources of pollution, three types of monitoring must occur: 1) visual observations, 2) chemical monitoring, and 3) stage monitoring.
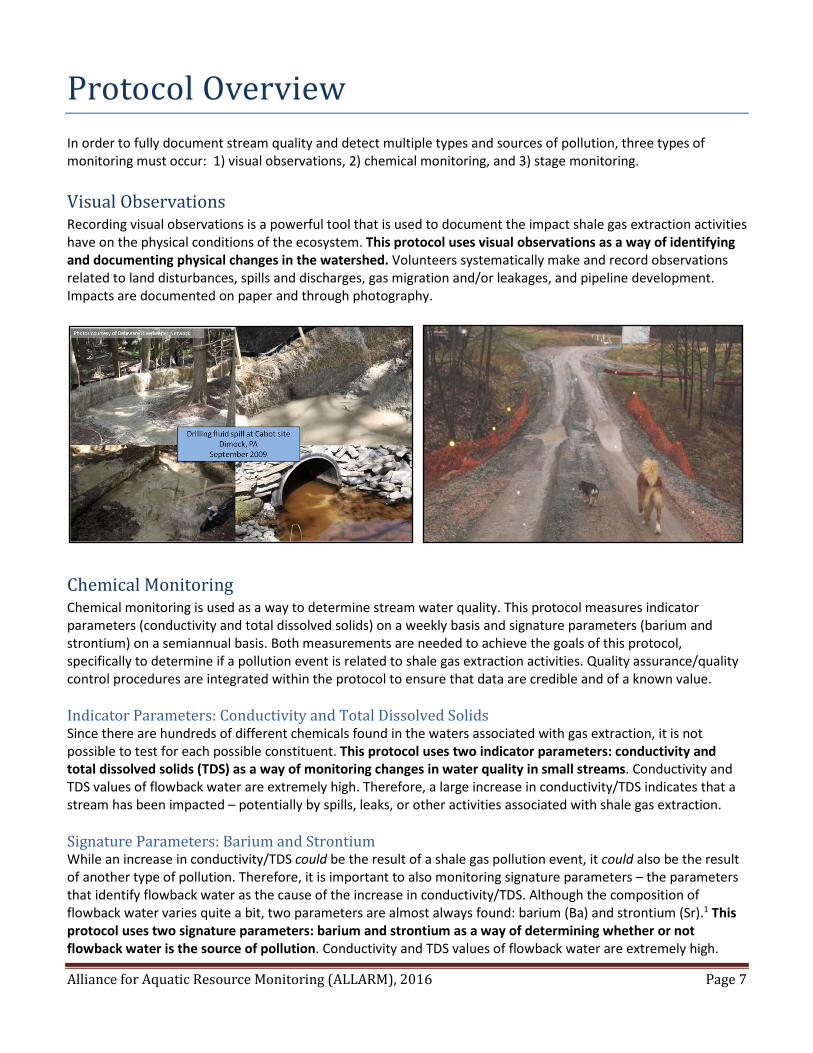
Visual Observations Recording visual observations is a powerful tool that is used to document the impact shale gas extraction activities have on the physical conditions of the ecosystem. This protocol uses visual observations as a way of identifying and documenting physical changes in the watershed. Volunteers systematically make and record observations related to land disturbances, spills and discharges, gas migration and/or leakages, and pipeline development. Impacts are documented on paper and through photography.
Chemical Monitoring Chemical monitoring is used as a way to determine stream water quality. This protocol measures indicator parameters (conductivity and total dissolved solids) on a weekly basis and signature parameters (barium and strontium) on a semiannual basis. Both measurements are needed to achieve the goals of this protocol, specifically to determine if a pollution event is related to shale gas extraction activities. Quality assurance/quality control procedures are integrated within the protocol to ensure that data are credible and of a known value. Indicator Parameters: Conductivity and Total Dissolved Solids Since there are hundreds of different chemicals found in the waters associated with gas extraction, it is not possible to test for each possible constituent. This protocol uses two indicator parameters: conductivity and total dissolved solids (TDS) as a way of monitoring changes in water quality in small streams. Conductivity and TDS values of flowback water are extremely high. Therefore, a large increase in conductivity/TDS indicates that a stream has been impacted – potentially by spills, leaks, or other activities associated with shale gas extraction. Signature Parameters: Barium and Strontium While an increase in conductivity/TDS could be the result of a shale gas pollution event, it could also be the result of another type of pollution. Therefore, it is important to also monitoring signature parameters – the parameters that identify flowback water as the cause of the increase in conductivity/TDS. Although the composition of flowback water varies quite a bit, two parameters are almost always found: barium (Ba) and strontium (Sr).1 This protocol uses two signature parameters: barium and strontium as a way of determining whether or not flowback water is the source of pollution. Conductivity and TDS values of flowback water are extremely high.
Alliance for Aquatic Resource Monitoring (ALLARM), 2016 Page 8
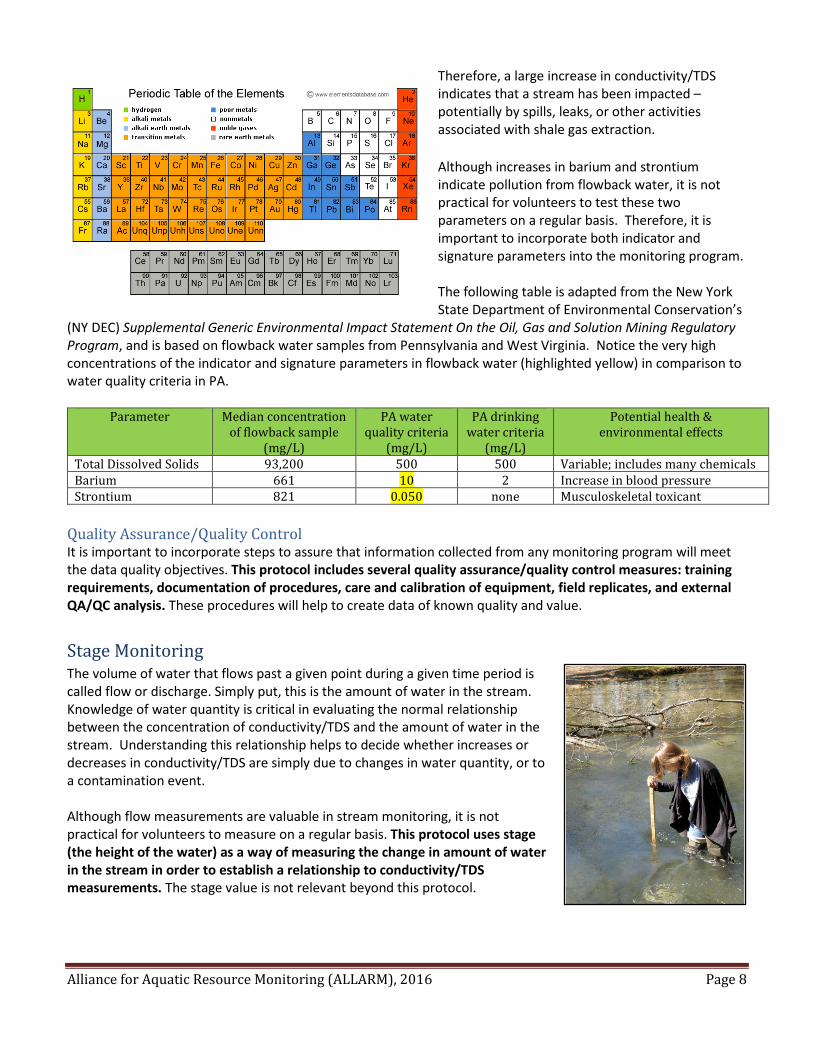
Therefore, a large increase in conductivity/TDS indicates that a stream has been impacted – potentially by spills, leaks, or other activities associated with shale gas extraction. Although increases in barium and strontium indicate pollution from flowback water, it is not practical for volunteers to test these two parameters on a regular basis. Therefore, it is important to incorporate both indicator and signature parameters into the monitoring program. The following table is adapted from the New York State Department of Environmental Conservation’s
(NY DEC) Supplemental Generic Environmental Impact Statement On the Oil, Gas and Solution Mining Regulatory Program, and is based on flowback water samples from Pennsylvania and West Virginia. Notice the very high concentrations of the indicator and signature parameters in flowback water (highlighted yellow) in comparison to water quality criteria in PA.
Parameter Median concentration of flowback sample
(mg/L)
PA water quality criteria
(mg/L)
PA drinking water criteria
(mg/L)
Potential health & environmental effects
Total Dissolved Solids 93,200 500 500 Variable; includes many chemicals Barium 661 10 2 Increase in blood pressure Strontium 821 0.050 none Musculoskeletal toxicant
Quality Assurance/Quality Control It is important to incorporate steps to assure that information collected from any monitoring program will meet the data quality objectives. This protocol includes several quality assurance/quality control measures: training requirements, documentation of procedures, care and calibration of equipment, field replicates, and external QA/QC analysis. These procedures will help to create data of known quality and value. Stage Monitoring The volume of water that flows past a given point during a given time period is called flow or discharge. Simply put, this is the amount of water in the stream. Knowledge of water quantity is critical in evaluating the normal relationship between the concentration of conductivity/TDS and the amount of water in the stream. Understanding this relationship helps to decide whether increases or decreases in conductivity/TDS are simply due to changes in water quantity, or to a contamination event. Although flow measurements are valuable in stream monitoring, it is not practical for volunteers to measure on a regular basis. This protocol uses stage (the height of the water) as a way of measuring the change in amount of water in the stream in order to establish a relationship to conductivity/TDS measurements. The stage value is not relevant beyond this protocol.
Alliance for Aquatic Resource Monitoring (ALLARM), 2016 Page 9
Choosing Site Locations In order to choose an appropriate place to monitor, it is important to think through the different aspects of your watershed, as they will impact where you choose your monitoring site. When thinking about your watershed, try to identify whether or not there are:
1. Sources of elevated conductivity/TDS (aside from shale gas extraction activities) • Municipal buildings that house road salt • Salted road during snow season • Stormwater outflow pipes • Wastewater treatment facilities • Acid mine drainage • Permitted discharger – check National Pollution Discharge Elimination Systems (NPDES)
2. Special protection waters • High Quality or Exceptional Value: www.pacode.com/secure/data/025/chapter93/chap93toc.html • Class A Wild/Wilderness Trout Streams: http://fishandboat.com/waters_trout.htm
3. Special areas of interest • Swimming holes • Fishing areas • Forested or pristine areas • Areas with endangered or high value species
4. Drinking water withdrawal points The best way to make note of these locations is to mark them on a large watershed or county map. County maps of Pennsylvania can be purchased at a number of locations, including from US Geological Survey at: USGS County Maps. They may also available through your County Conservation District. Another good, yet smaller option is the Pennsylvania Gazetteer, which can also be purchased many places. Baseline Monitoring Sites Collecting baseline data (normal conditions before drilling activities occur) is important in understanding the typical values of conductivity/TDS in your watershed and where the sources are located. In an ideal scenario, you will be able to collect a year’s worth of baseline data, however this is not always possible. When choosing a baseline monitoring site, keep the considerations above in mind as well as other factors that are important to you/your group. If monitoring with a group that has multiple sites, you will want to be strategic in how you choose your sites to account for both baseline conditions and drilling activities. Even if drilling activities have begun in your watershed, it is still necessary to choose a few static monitoring sites – permanent sites that never change regardless of changes in drilling activities. You should identify at least two static monitoring sites:
1. Tributary: reference site that you do not anticipate any activity to occur (baseline unimpacted site) 2. Mainstem: site near the mouth/bottom of the watershed (cumulative impact site)
The number of baseline/static monitoring sites you choose will be dependent on your resources (volunteers and equipment) as well as how much activity has already begun. For example, it is not practical to choose 10 monitoring sites if there are only three people monitoring, sharing two kits. Be realistic when choosing sites. ALLARM recommends that new volunteers start with one site, adding additional sites after the volunteer is used to the monitoring protocol and is comfortable with a larger time commitment.
Alliance for Aquatic Resource Monitoring (ALLARM), 2016 Page 10
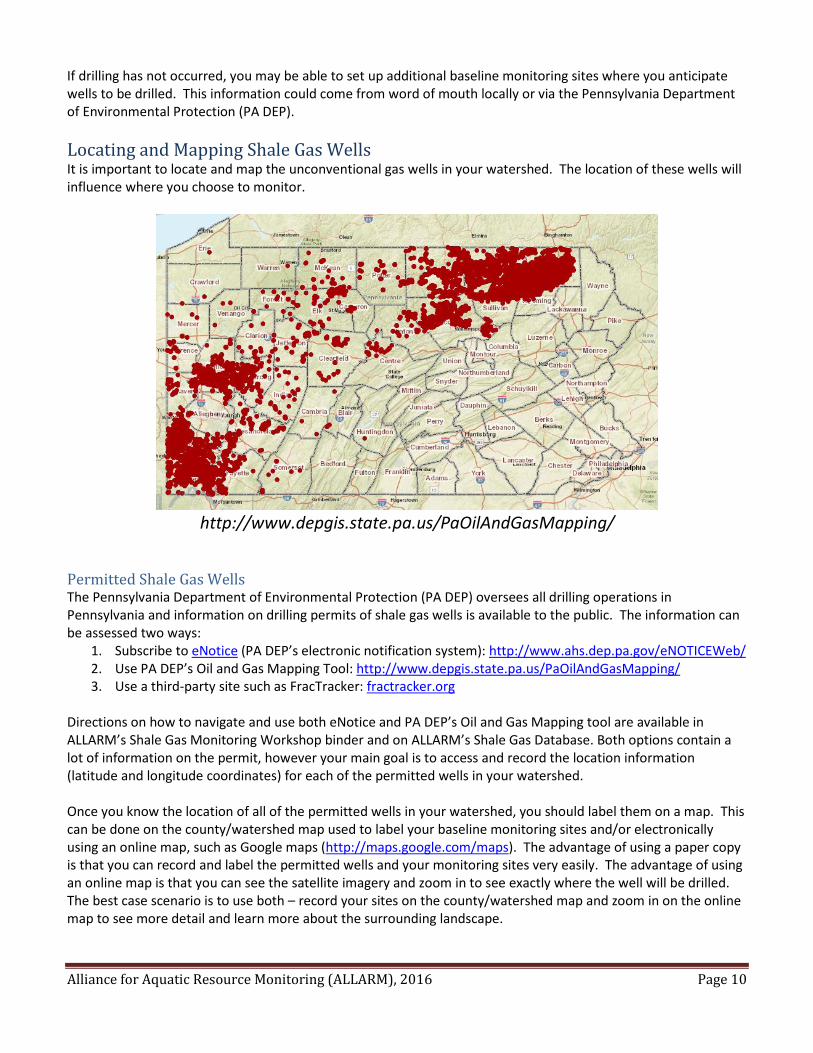
If drilling has not occurred, you may be able to set up additional baseline monitoring sites where you anticipate wells to be drilled. This information could come from word of mouth locally or via the Pennsylvania Department of Environmental Protection (PA DEP). Locating and Mapping Shale Gas Wells It is important to locate and map the unconventional gas wells in your watershed. The location of these wells will influence where you choose to monitor.
http://www.depgis.state.pa.us/PaOilAndGasMapping/
Permitted Shale Gas Wells The Pennsylvania Department of Environmental Protection (PA DEP) oversees all drilling operations in Pennsylvania and information on drilling permits of shale gas wells is available to the public. The information can be assessed two ways:
1. Subscribe to eNotice (PA DEP’s electronic notification system): http://www.ahs.dep.pa.gov/eNOTICEWeb/ 2. Use PA DEP’s Oil and Gas Mapping Tool: http://www.depgis.state.pa.us/PaOilAndGasMapping/ 3. Use a third-party site such as FracTracker: fractracker.org
Directions on how to navigate and use both eNotice and PA DEP’s Oil and Gas Mapping tool are available in ALLARM’s Shale Gas Monitoring Workshop binder and on ALLARM’s Shale Gas Database. Both options contain a lot of information on the permit, however your main goal is to access and record the location information (latitude and longitude coordinates) for each of the permitted wells in your watershed. Once you know the location of all of the permitted wells in your watershed, you should label them on a map. This can be done on the county/watershed map used to label your baseline monitoring sites and/or electronically using an online map, such as Google maps (http://maps.google.com/maps). The advantage of using a paper copy is that you can record and label the permitted wells and your monitoring sites very easily. The advantage of using an online map is that you can see the satellite imagery and zoom in to see exactly where the well will be drilled. The best case scenario is to use both – record your sites on the county/watershed map and zoom in on the online map to see more detail and learn more about the surrounding landscape.
Alliance for Aquatic Resource Monitoring (ALLARM), 2016 Page 11
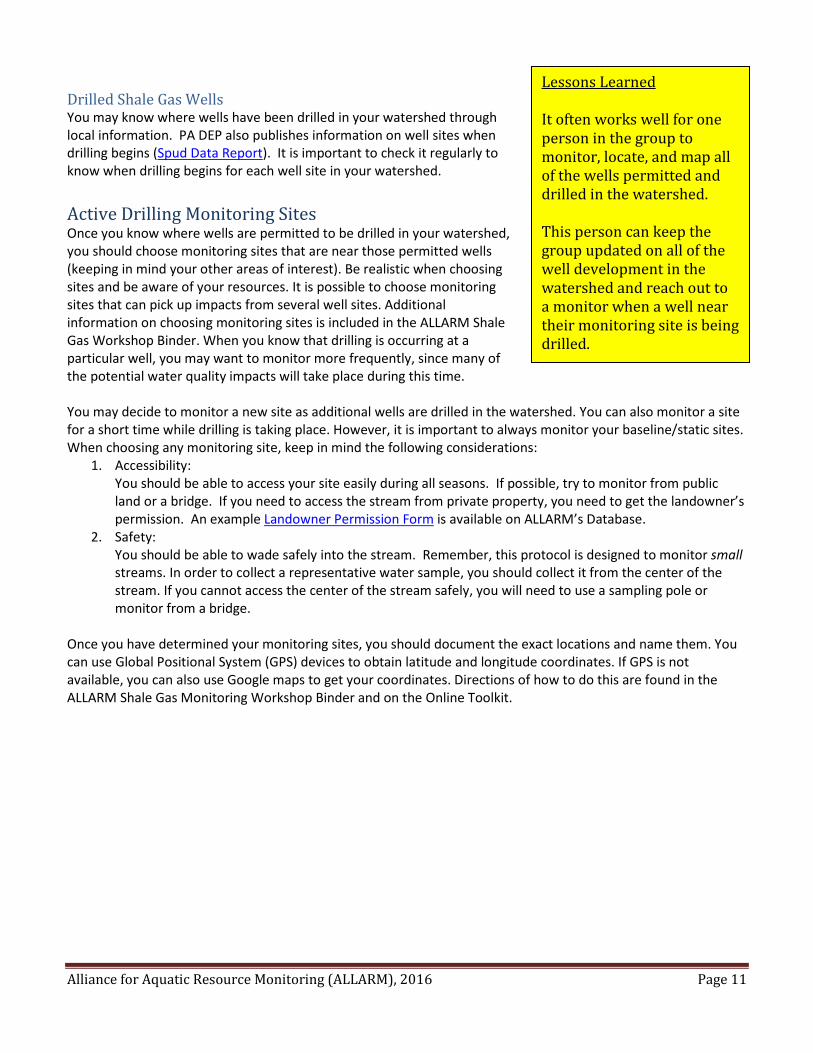
Drilled Shale Gas Wells You may know where wells have been drilled in your watershed through local information. PA DEP also publishes information on well sites when drilling begins (Spud Data Report). It is important to check it regularly to know when drilling begins for each well site in your watershed. Active Drilling Monitoring Sites Once you know where wells are permitted to be drilled in your watershed, you should choose monitoring sites that are near those permitted wells (keeping in mind your other areas of interest). Be realistic when choosing sites and be aware of your resources. It is possible to choose monitoring sites that can pick up impacts from several well sites. Additional information on choosing monitoring sites is included in the ALLARM Shale Gas Workshop Binder. When you know that drilling is occurring at a particular well, you may want to monitor more frequently, since many of the potential water quality impacts will take place during this time. You may decide to monitor a new site as additional wells are drilled in the watershed. You can also monitor a site for a short time while drilling is taking place. However, it is important to always monitor your baseline/static sites. When choosing any monitoring site, keep in mind the following considerations:
1. Accessibility: You should be able to access your site easily during all seasons. If possible, try to monitor from public land or a bridge. If you need to access the stream from private property, you need to get the landowner’s permission. An example Landowner Permission Form is available on ALLARM’s Database.
2. Safety: You should be able to wade safely into the stream. Remember, this protocol is designed to monitor small streams. In order to collect a representative water sample, you should collect it from the center of the stream. If you cannot access the center of the stream safely, you will need to use a sampling pole or monitor from a bridge.
Once you have determined your monitoring sites, you should document the exact locations and name them. You can use Global Positional System (GPS) devices to obtain latitude and longitude coordinates. If GPS is not available, you can also use Google maps to get your coordinates. Directions of how to do this are found in the ALLARM Shale Gas Monitoring Workshop Binder and on the Online Toolkit.
Lessons Learned It often works well for one person in the group to monitor, locate, and map all of the wells permitted and drilled in the watershed. This person can keep the group updated on all of the well development in the watershed and reach out to a monitor when a well near their monitoring site is being drilled.
Alliance for Aquatic Resource Monitoring (ALLARM), 2016 Page 12
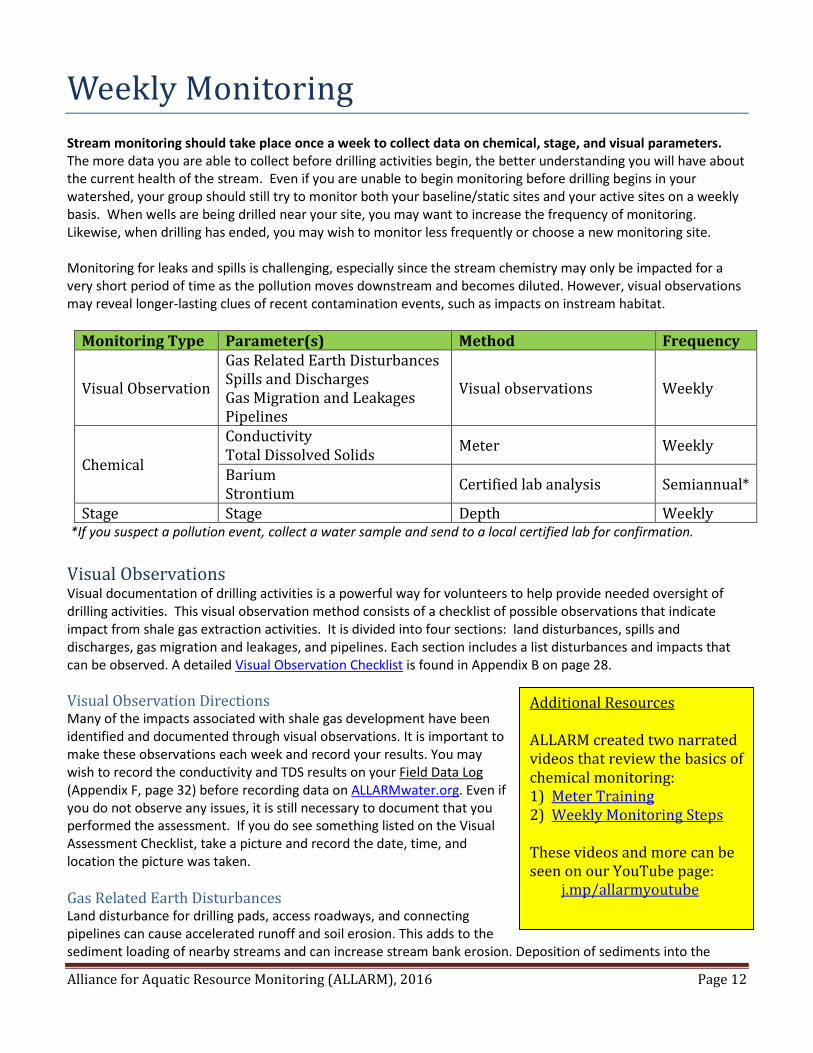
Weekly Monitoring Stream monitoring should take place once a week to collect data on chemical, stage, and visual parameters. The more data you are able to collect before drilling activities begin, the better understanding you will have about the current health of the stream. Even if you are unable to begin monitoring before drilling begins in your watershed, your group should still try to monitor both your baseline/static sites and your active sites on a weekly basis. When wells are being drilled near your site, you may want to increase the frequency of monitoring. Likewise, when drilling has ended, you may wish to monitor less frequently or choose a new monitoring site. Monitoring for leaks and spills is challenging, especially since the stream chemistry may only be impacted for a very short period of time as the pollution moves downstream and becomes diluted. However, visual observations may reveal longer-lasting clues of recent contamination events, such as impacts on instream habitat.
Monitoring Type Parameter(s) Method Frequency
Visual Observation
Gas Related Earth Disturbances Spills and Discharges Gas Migration and Leakages Pipelines
Visual observations Weekly
Chemical
Conductivity Total Dissolved Solids Meter Weekly
Barium Strontium Certified lab analysis Semiannual*
Stage Stage Depth Weekly *If you suspect a pollution event, collect a water sample and send to a local certified lab for confirmation. Visual Observations Visual documentation of drilling activities is a powerful way for volunteers to help provide needed oversight of drilling activities. This visual observation method consists of a checklist of possible observations that indicate impact from shale gas extraction activities. It is divided into four sections: land disturbances, spills and discharges, gas migration and leakages, and pipelines. Each section includes a list disturbances and impacts that can be observed. A detailed Visual Observation Checklist is found in Appendix B on page 28. Visual Observation Directions Many of the impacts associated with shale gas development have been identified and documented through visual observations. It is important to make these observations each week and record your results. You may wish to record the conductivity and TDS results on your Field Data Log (Appendix F, page 32) before recording data on ALLARMwater.org. Even if you do not observe any issues, it is still necessary to document that you performed the assessment. If you do see something listed on the Visual Assessment Checklist, take a picture and record the date, time, and location the picture was taken. Gas Related Earth Disturbances Land disturbance for drilling pads, access roadways, and connecting pipelines can cause accelerated runoff and soil erosion. This adds to the sediment loading of nearby streams and can increase stream bank erosion. Deposition of sediments into the
Additional Resources ALLARM created two narrated videos that review the basics of chemical monitoring: 1) Meter Training 2) Weekly Monitoring Steps These videos and more can be seen on our YouTube page: j.mp/allarmyoutube
Alliance for Aquatic Resource Monitoring (ALLARM), 2016 Page 13
stream adversely affects stream biota. An erosion and sedimentation control plan incorporating best management practices must be prepared and followed for all land disturbances associated with oil and gas development. In general, these measures do a good job of holding soil erosion in check. However, sometimes improperly installed or maintained erosion and sediment control measures can lead to accelerated erosion. Most often access roadways are the problem, as they frequently are built on steep slopes, and routine maintenance is not a priority once a well is installed and producing. If you find any of the features in this checklist, there is a high probability that the company is violating its sedimentation and erosion plan. Spills and Discharges Discharges of polluted water to streams, whether intentional or not, can have a significant impact on water quality and stream biota. In extreme cases, fish kills can occur. Every producing gas well also produces some water, which is stored in a tank at the well site and periodically trucked to a treatment facility as required by Pennsylvania law. But spills do occur; and regrettably, “midnight dumping” occasionally does take place. These events can occur and important evidence can disappear before anyone takes notice, especially on more remote streams. Early detection and prompt reporting are crucial. Gas Migration and Leakages Leakage of natural gas into soil, springs, and waterways results from a pipeline break or a breech in the gas well casing. This is not so much an environmental problem as a concern for human health and welfare. As it is colorless and odorless, it may not be detected if migrating directly out of the ground. Natural gas mixes with atmospheric oxygen, and any spark or flame can ignite the mixture. This situation is particularly dangerous when someone’s potable water supply is contaminated. When gas is routed to a pipeline, mercaptan compounds are added to provide an odor for detection. Pipelines It can be difficult to track pipeline development as routes can change during the development process. However, if your site is next to a pipeline right-of-way or stream crossing, or you know of an accessible location, physical monitoring can be done by looking for visual observations. For example, erosion and sedimentation control measures should be in place around a right-of-way to prevent earth disturbances. Chemical Monitoring There are two chemical parameters you will be testing on a weekly basis – conductivity and total dissolved solids, which are measured using the LaMotte Tracer PockeTester. Directions on how to calibrate and use the meter are found in Appendix D on page 30 and on the Database at: LaMotte Tracer PockeTester Directions. Conductivity and Total Dissolved Solids Conductivity measures the ability of water to pass an electrical current, which is possible by the presence of charged particles (ions) that are dissolved in the water. Inorganic solids (i.e. chloride and sodium) are better conductors of electricity than organic compounds (i.e. oil and alcohol), and therefore have a higher conductivity value. Conductivity is affected by temperature – the warmer the temperature, the higher the conductivity. Total dissolved solids (TDS) measures the amount of matter (i.e. calcium and nitrogen) dissolved in the water. The materials dissolved in the water are essential for aquatic life, however too many dissolved solids can be toxic to organisms.
Alliance for Aquatic Resource Monitoring (ALLARM), 2016 Page 14
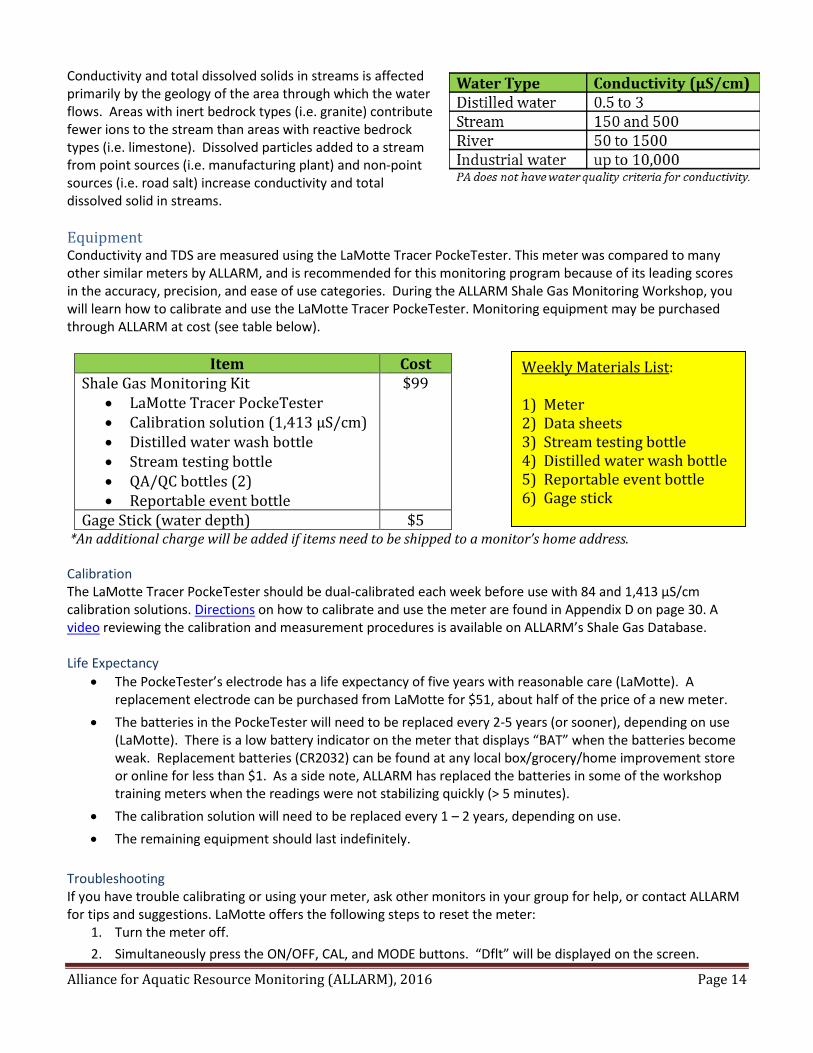
Conductivity and total dissolved solids in streams is affected primarily by the geology of the area through which the water flows. Areas with inert bedrock types (i.e. granite) contribute fewer ions to the stream than areas with reactive bedrock types (i.e. limestone). Dissolved particles added to a stream from point sources (i.e. manufacturing plant) and non-point sources (i.e. road salt) increase conductivity and total dissolved solid in streams. Equipment Conductivity and TDS are measured using the LaMotte Tracer PockeTester. This meter was compared to many other similar meters by ALLARM, and is recommended for this monitoring program because of its leading scores in the accuracy, precision, and ease of use categories. During the ALLARM Shale Gas Monitoring Workshop, you will learn how to calibrate and use the LaMotte Tracer PockeTester. Monitoring equipment may be purchased through ALLARM at cost (see table below).
Item Cost Shale Gas Monitoring Kit
• LaMotte Tracer PockeTester • Calibration solution (1,413 µS/cm) • Distilled water wash bottle • Stream testing bottle • QA/QC bottles (2) • Reportable event bottle
$99
Gage Stick (water depth) $5 *An additional charge will be added if items need to be shipped to a monitor’s home address. Calibration The LaMotte Tracer PockeTester should be dual-calibrated each week before use with 84 and 1,413 µS/cm calibration solutions. Directions on how to calibrate and use the meter are found in Appendix D on page 30. A video reviewing the calibration and measurement procedures is available on ALLARM’s Shale Gas Database. Life Expectancy
• The PockeTester’s electrode has a life expectancy of five years with reasonable care (LaMotte). A replacement electrode can be purchased from LaMotte for $51, about half of the price of a new meter.
• The batteries in the PockeTester will need to be replaced every 2-5 years (or sooner), depending on use (LaMotte). There is a low battery indicator on the meter that displays “BAT” when the batteries become weak. Replacement batteries (CR2032) can be found at any local box/grocery/home improvement store or online for less than $1. As a side note, ALLARM has replaced the batteries in some of the workshop training meters when the readings were not stabilizing quickly (> 5 minutes).
• The calibration solution will need to be replaced every 1 – 2 years, depending on use. • The remaining equipment should last indefinitely.
Troubleshooting If you have trouble calibrating or using your meter, ask other monitors in your group for help, or contact ALLARM for tips and suggestions. LaMotte offers the following steps to reset the meter:
1. Turn the meter off. 2. Simultaneously press the ON/OFF, CAL, and MODE buttons. “Dflt” will be displayed on the screen.
Weekly Materials List: 1) Meter 2) Data sheets 3) Stream testing bottle 4) Distilled water wash bottle 5) Reportable event bottle 6) Gage stick
Alliance for Aquatic Resource Monitoring (ALLARM), 2016 Page 15
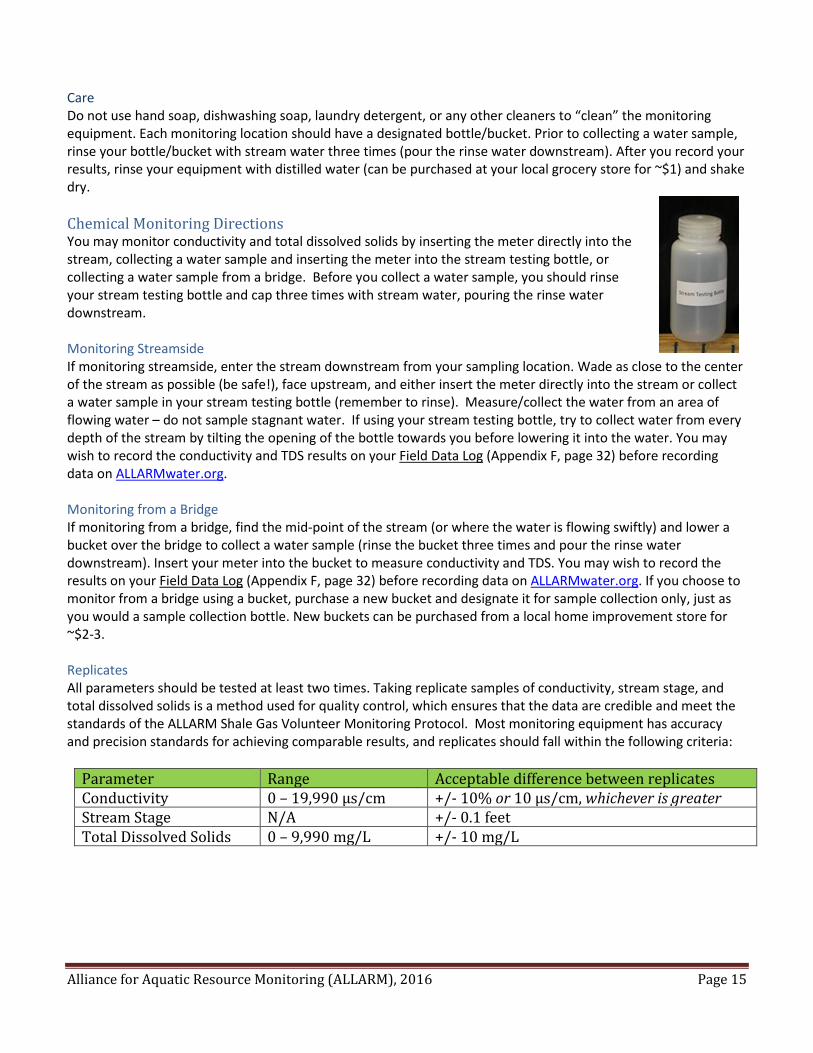
Care Do not use hand soap, dishwashing soap, laundry detergent, or any other cleaners to “clean” the monitoring equipment. Each monitoring location should have a designated bottle/bucket. Prior to collecting a water sample, rinse your bottle/bucket with stream water three times (pour the rinse water downstream). After you record your results, rinse your equipment with distilled water (can be purchased at your local grocery store for ~$1) and shake dry. Chemical Monitoring Directions You may monitor conductivity and total dissolved solids by inserting the meter directly into the stream, collecting a water sample and inserting the meter into the stream testing bottle, or collecting a water sample from a bridge. Before you collect a water sample, you should rinse your stream testing bottle and cap three times with stream water, pouring the rinse water downstream. Monitoring Streamside If monitoring streamside, enter the stream downstream from your sampling location. Wade as close to the center of the stream as possible (be safe!), face upstream, and either insert the meter directly into the stream or collect a water sample in your stream testing bottle (remember to rinse). Measure/collect the water from an area of flowing water – do not sample stagnant water. If using your stream testing bottle, try to collect water from every depth of the stream by tilting the opening of the bottle towards you before lowering it into the water. You may wish to record the conductivity and TDS results on your Field Data Log (Appendix F, page 32) before recording data on ALLARMwater.org. Monitoring from a Bridge If monitoring from a bridge, find the mid-point of the stream (or where the water is flowing swiftly) and lower a bucket over the bridge to collect a water sample (rinse the bucket three times and pour the rinse water downstream). Insert your meter into the bucket to measure conductivity and TDS. You may wish to record the results on your Field Data Log (Appendix F, page 32) before recording data on ALLARMwater.org. If you choose to monitor from a bridge using a bucket, purchase a new bucket and designate it for sample collection only, just as you would a sample collection bottle. New buckets can be purchased from a local home improvement store for ~$2-3. Replicates All parameters should be tested at least two times. Taking replicate samples of conductivity, stream stage, and total dissolved solids is a method used for quality control, which ensures that the data are credible and meet the standards of the ALLARM Shale Gas Volunteer Monitoring Protocol. Most monitoring equipment has accuracy and precision standards for achieving comparable results, and replicates should fall within the following criteria:
Parameter Range Acceptable difference between replicates Conductivity 0 – 19,990 µs/cm +/- 10% or 10 µs/cm, whichever is greater Stream Stage N/A +/- 0.1 feet Total Dissolved Solids 0 – 9,990 mg/L +/- 10 mg/L
Alliance for Aquatic Resource Monitoring (ALLARM), 2016 Page 16
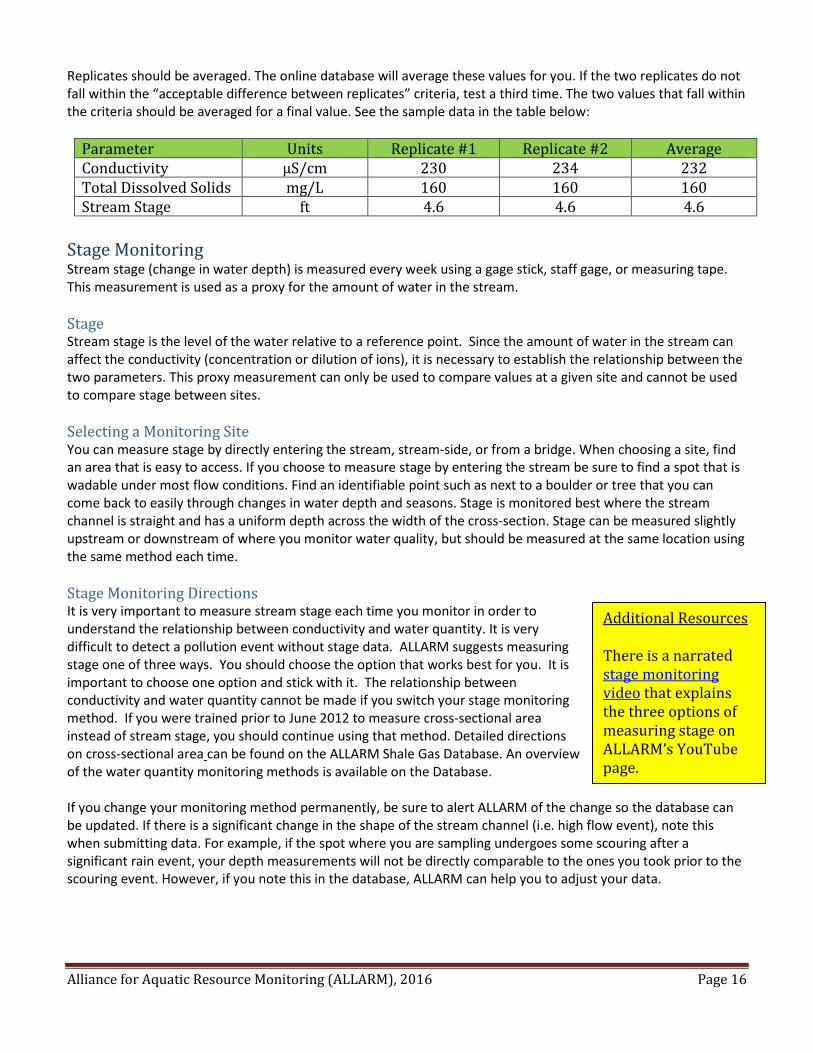
Replicates should be averaged. The online database will average these values for you. If the two replicates do not fall within the “acceptable difference between replicates” criteria, test a third time. The two values that fall within the criteria should be averaged for a final value. See the sample data in the table below:
Parameter Units Replicate #1 Replicate #2 Average Conductivity µS/cm 230 234 232 Total Dissolved Solids mg/L 160 160 160 Stream Stage ft 4.6 4.6 4.6
Stage Monitoring Stream stage (change in water depth) is measured every week using a gage stick, staff gage, or measuring tape. This measurement is used as a proxy for the amount of water in the stream. Stage Stream stage is the level of the water relative to a reference point. Since the amount of water in the stream can affect the conductivity (concentration or dilution of ions), it is necessary to establish the relationship between the two parameters. This proxy measurement can only be used to compare values at a given site and cannot be used to compare stage between sites. Selecting a Monitoring Site You can measure stage by directly entering the stream, stream-side, or from a bridge. When choosing a site, find an area that is easy to access. If you choose to measure stage by entering the stream be sure to find a spot that is wadable under most flow conditions. Find an identifiable point such as next to a boulder or tree that you can come back to easily through changes in water depth and seasons. Stage is monitored best where the stream channel is straight and has a uniform depth across the width of the cross-section. Stage can be measured slightly upstream or downstream of where you monitor water quality, but should be measured at the same location using the same method each time. Stage Monitoring Directions It is very important to measure stream stage each time you monitor in order to understand the relationship between conductivity and water quantity. It is very difficult to detect a pollution event without stage data. ALLARM suggests measuring stage one of three ways. You should choose the option that works best for you. It is important to choose one option and stick with it. The relationship between conductivity and water quantity cannot be made if you switch your stage monitoring method. If you were trained prior to June 2012 to measure cross-sectional area instead of stream stage, you should continue using that method. Detailed directions on cross-sectional area can be found on the ALLARM Shale Gas Database. An overview of the water quantity monitoring methods is available on the Database. If you change your monitoring method permanently, be sure to alert ALLARM of the change so the database can be updated. If there is a significant change in the shape of the stream channel (i.e. high flow event), note this when submitting data. For example, if the spot where you are sampling undergoes some scouring after a significant rain event, your depth measurements will not be directly comparable to the ones you took prior to the scouring event. However, if you note this in the database, ALLARM can help you to adjust your data.
Additional Resources There is a narrated stage monitoring video that explains the three options of measuring stage on ALLARM’s YouTube page.
Alliance for Aquatic Resource Monitoring (ALLARM), 2016 Page 17
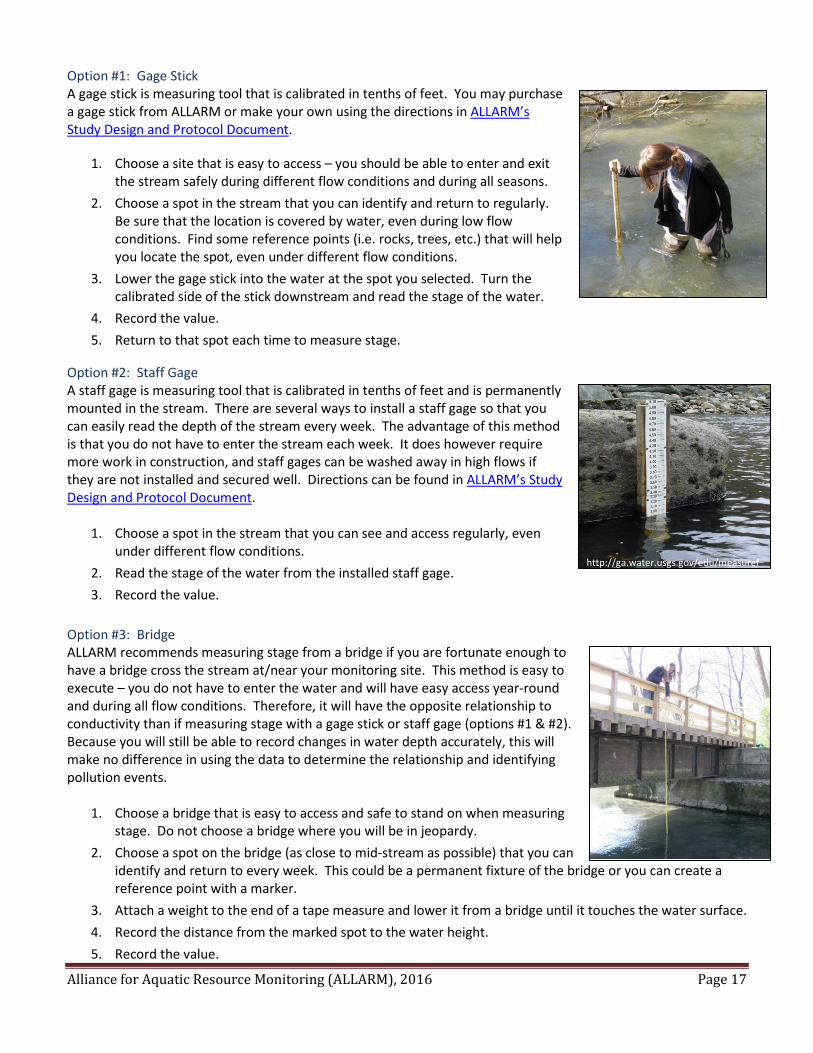
Option #1: Gage Stick A gage stick is measuring tool that is calibrated in tenths of feet. You may purchase a gage stick from ALLARM or make your own using the directions in ALLARM’s Study Design and Protocol Document.
1. Choose a site that is easy to access – you should be able to enter and exit the stream safely during different flow conditions and during all seasons.
2. Choose a spot in the stream that you can identify and return to regularly. Be sure that the location is covered by water, even during low flow conditions. Find some reference points (i.e. rocks, trees, etc.) that will help you locate the spot, even under different flow conditions.
3. Lower the gage stick into the water at the spot you selected. Turn the calibrated side of the stick downstream and read the stage of the water.
4. Record the value. 5. Return to that spot each time to measure stage.
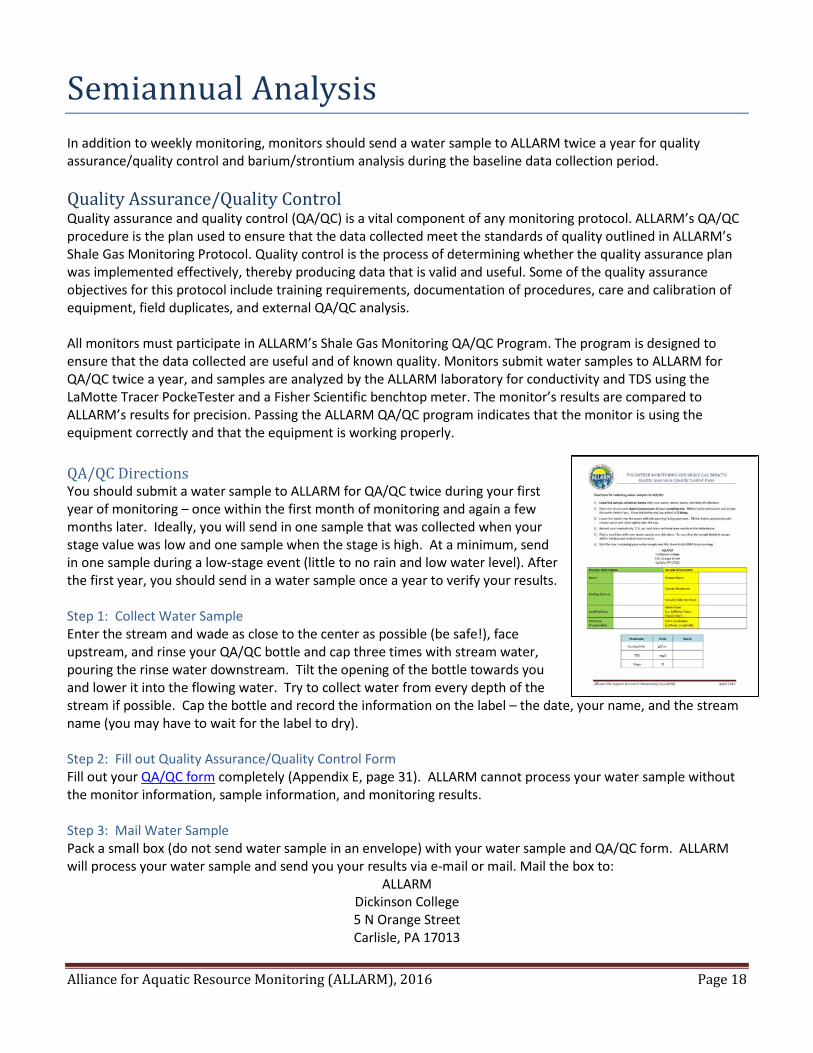
Option #2: Staff Gage A staff gage is measuring tool that is calibrated in tenths of feet and is permanently mounted in the stream. There are several ways to install a staff gage so that you can easily read the depth of the stream every week. The advantage of this method is that you do not have to enter the stream each week. It does however require more work in construction, and staff gages can be washed away in high flows if they are not installed and secured well. Directions can be found in ALLARM’s Study Design and Protocol Document.
1. Choose a spot in the stream that you can see and access regularly, even under different flow conditions.
2. Read the stage of the water from the installed staff gage. 3. Record the value.
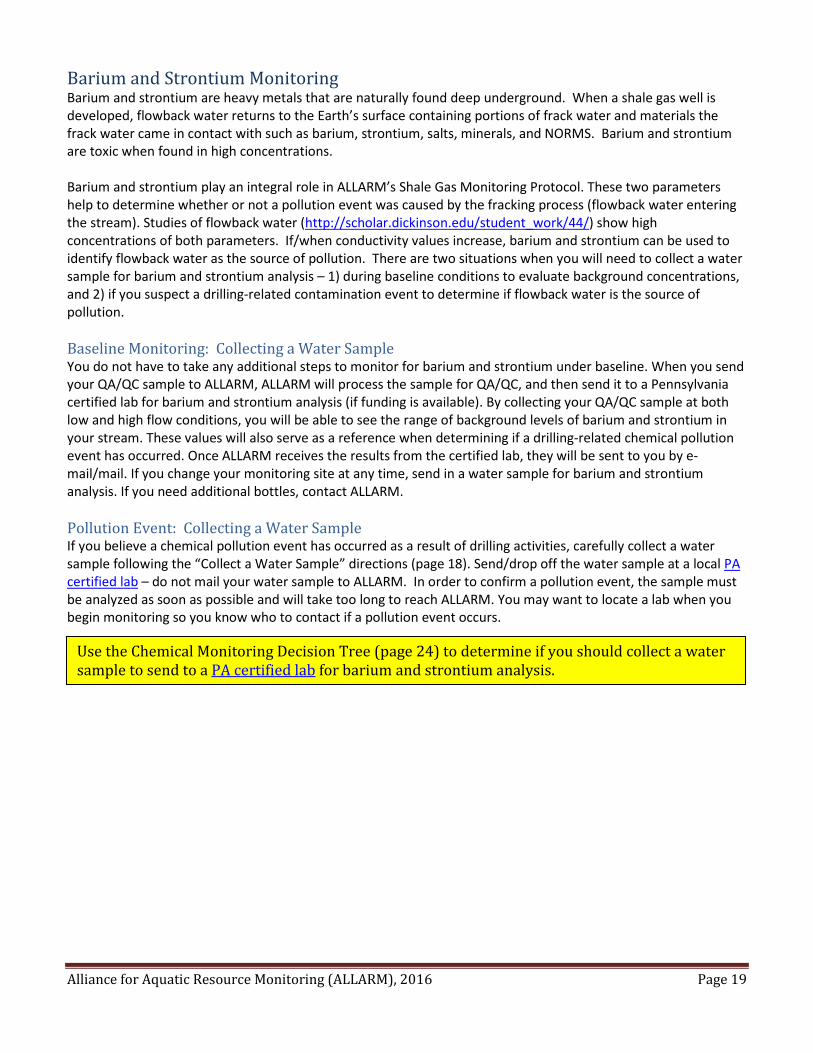
Option #3: Bridge ALLARM recommends measuring stage from a bridge if you are fortunate enough to have a bridge cross the stream at/near your monitoring site. This method is easy to execute – you do not have to enter the water and will have easy access year-round and during all flow conditions. Therefore, it will have the opposite relationship to conductivity than if measuring stage with a gage stick or staff gage (options #1 & #2). Because you will still be able to record changes in water depth accurately, this will make no difference in using the data to determine the relationship and identifying pollution events.
1. Choose a bridge that is easy to access and safe to stand on when measuring stage. Do not choose a bridge where you will be in jeopardy.
2. Choose a spot on the bridge (as close to mid-stream as possible) that you can identify and return to every week. This could be a permanent fixture of the bridge or you can create a reference point with a marker.
3. Attach a weight to the end of a tape measure and lower it from a bridge until it touches the water surface. 4. Record the distance from the marked spot to the water height. 5. Record the value.
http://ga.water.usgs.gov/edu/measureflow.html
Alliance for Aquatic Resource Monitoring (ALLARM), 2016 Page 18
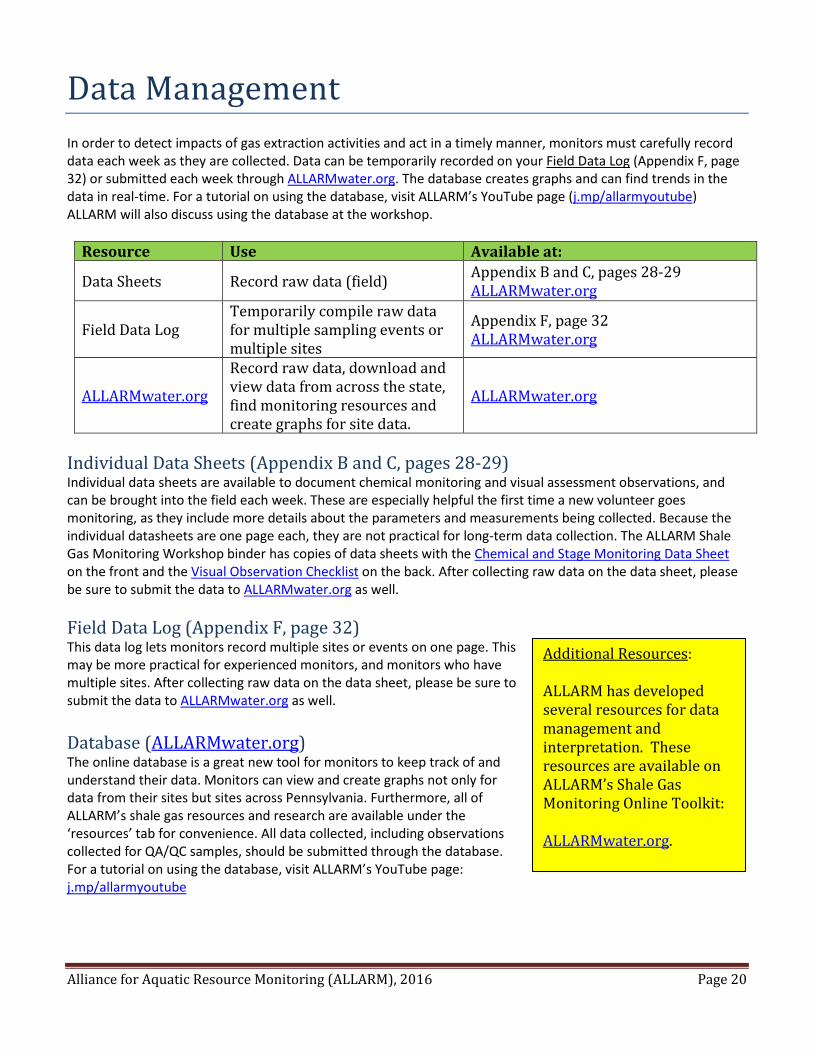
Semiannual Analysis In addition to weekly monitoring, monitors should send a water sample to ALLARM twice a year for quality assurance/quality control and barium/strontium analysis during the baseline data collection period. Quality Assurance/Quality Control Quality assurance and quality control (QA/QC) is a vital component of any monitoring protocol. ALLARM’s QA/QC procedure is the plan used to ensure that the data collected meet the standards of quality outlined in ALLARM’s Shale Gas Monitoring Protocol. Quality control is the process of determining whether the quality assurance plan was implemented effectively, thereby producing data that is valid and useful. Some of the quality assurance objectives for this protocol include training requirements, documentation of procedures, care and calibration of equipment, field duplicates, and external QA/QC analysis. All monitors must participate in ALLARM’s Shale Gas Monitoring QA/QC Program. The program is designed to ensure that the data collected are useful and of known quality. Monitors submit water samples to ALLARM for QA/QC twice a year, and samples are analyzed by the ALLARM laboratory for conductivity and TDS using the LaMotte Tracer PockeTester and a Fisher Scientific benchtop meter. The monitor’s results are compared to ALLARM’s results for precision. Passing the ALLARM QA/QC program indicates that the monitor is using the equipment correctly and that the equipment is working properly. QA/QC Directions You should submit a water sample to ALLARM for QA/QC twice during your first year of monitoring – once within the first month of monitoring and again a few months later. Ideally, you will send in one sample that was collected when your stage value was low and one sample when the stage is high. At a minimum, send in one sample during a low-stage event (little to no rain and low water level). After the first year, you should send in a water sample once a year to verify your results. Step 1: Collect Water Sample Enter the stream and wade as close to the center as possible (be safe!), face upstream, and rinse your QA/QC bottle and cap three times with stream water, pouring the rinse water downstream. Tilt the opening of the bottle towards you and lower it into the flowing water. Try to collect water from every depth of the stream if possible. Cap the bottle and record the information on the label – the date, your name, and the stream name (you may have to wait for the label to dry). Step 2: Fill out Quality Assurance/Quality Control Form Fill out your QA/QC form completely (Appendix E, page 31). ALLARM cannot process your water sample without the monitor information, sample information, and monitoring results. Step 3: Mail Water Sample Pack a small box (do not send water sample in an envelope) with your water sample and QA/QC form. ALLARM will process your water sample and send you your results via e-mail or mail. Mail the box to:
ALLARM Dickinson College 5 N Orange Street Carlisle, PA 17013
Alliance for Aquatic Resource Monitoring (ALLARM), 2016 Page 19
Barium and Strontium Monitoring Barium and strontium are heavy metals that are naturally found deep underground. When a shale gas well is developed, flowback water returns to the Earth’s surface containing portions of frack water and materials the frack water came in contact with such as barium, strontium, salts, minerals, and NORMS. Barium and strontium are toxic when found in high concentrations. Barium and strontium play an integral role in ALLARM’s Shale Gas Monitoring Protocol. These two parameters help to determine whether or not a pollution event was caused by the fracking process (flowback water entering the stream). Studies of flowback water (http://scholar.dickinson.edu/student_work/44/) show high concentrations of both parameters. If/when conductivity values increase, barium and strontium can be used to identify flowback water as the source of pollution. There are two situations when you will need to collect a water sample for barium and strontium analysis – 1) during baseline conditions to evaluate background concentrations, and 2) if you suspect a drilling-related contamination event to determine if flowback water is the source of pollution. Baseline Monitoring: Collecting a Water Sample You do not have to take any additional steps to monitor for barium and strontium under baseline. When you send your QA/QC sample to ALLARM, ALLARM will process the sample for QA/QC, and then send it to a Pennsylvania certified lab for barium and strontium analysis (if funding is available). By collecting your QA/QC sample at both low and high flow conditions, you will be able to see the range of background levels of barium and strontium in your stream. These values will also serve as a reference when determining if a drilling-related chemical pollution event has occurred. Once ALLARM receives the results from the certified lab, they will be sent to you by e-mail/mail. If you change your monitoring site at any time, send in a water sample for barium and strontium analysis. If you need additional bottles, contact ALLARM. Pollution Event: Collecting a Water Sample If you believe a chemical pollution event has occurred as a result of drilling activities, carefully collect a water sample following the “Collect a Water Sample” directions (page 18). Send/drop off the water sample at a local PA certified lab – do not mail your water sample to ALLARM. In order to confirm a pollution event, the sample must be analyzed as soon as possible and will take too long to reach ALLARM. You may want to locate a lab when you begin monitoring so you know who to contact if a pollution event occurs.
Use the Chemical Monitoring Decision Tree (page 24) to determine if you should collect a water sample to send to a PA certified lab for barium and strontium analysis.
Alliance for Aquatic Resource Monitoring (ALLARM), 2016 Page 20
Data Management In order to detect impacts of gas extraction activities and act in a timely manner, monitors must carefully record data each week as they are collected. Data can be temporarily recorded on your Field Data Log (Appendix F, page 32) or submitted each week through ALLARMwater.org. The database creates graphs and can find trends in the data in real-time. For a tutorial on using the database, visit ALLARM’s YouTube page (j.mp/allarmyoutube) ALLARM will also discuss using the database at the workshop.
Resource Use Available at:
Data Sheets Record raw data (field) Appendix B and C, pages 28-29 ALLARMwater.org
Field Data Log Temporarily compile raw data for multiple sampling events or multiple sites
Appendix F, page 32 ALLARMwater.org
ALLARMwater.org
Record raw data, download and view data from across the state, find monitoring resources and create graphs for site data.
ALLARMwater.org
Individual Data Sheets (Appendix B and C, pages 28-29) Individual data sheets are available to document chemical monitoring and visual assessment observations, and can be brought into the field each week. These are especially helpful the first time a new volunteer goes monitoring, as they include more details about the parameters and measurements being collected. Because the individual datasheets are one page each, they are not practical for long-term data collection. The ALLARM Shale Gas Monitoring Workshop binder has copies of data sheets with the Chemical and Stage Monitoring Data Sheet on the front and the Visual Observation Checklist on the back. After collecting raw data on the data sheet, please be sure to submit the data to ALLARMwater.org as well. Field Data Log (Appendix F, page 32) This data log lets monitors record multiple sites or events on one page. This may be more practical for experienced monitors, and monitors who have multiple sites. After collecting raw data on the data sheet, please be sure to submit the data to ALLARMwater.org as well. Database (ALLARMwater.org) The online database is a great new tool for monitors to keep track of and understand their data. Monitors can view and create graphs not only for data from their sites but sites across Pennsylvania. Furthermore, all of ALLARM’s shale gas resources and research are available under the ‘resources’ tab for convenience. All data collected, including observations collected for QA/QC samples, should be submitted through the database. For a tutorial on using the database, visit ALLARM’s YouTube page: j.mp/allarmyoutube
Additional Resources: ALLARM has developed several resources for data management and interpretation. These resources are available on ALLARM’s Shale Gas Monitoring Online Toolkit: ALLARMwater.org.
Alliance for Aquatic Resource Monitoring (ALLARM), 2016 Page 21
Data Interpretation The data you collect need to be interpreted weekly to determine if follow-up action is needed. After submitting data, ALLARMwater.org will alert volunteers if follow-up is needed from submitted data, and will notify ALLARM that additional support might be needed. ALLARM has created several resources to help with the process of identifying and reporting shale gas-related pollution events.
Resource Use Available at:
Decision Trees Interpret data & determine further action steps
Shale Gas Manual - Decision Trees (page 22- 24)
Contacts Contact appropriate entities about reportable events Appendix A (page 27)
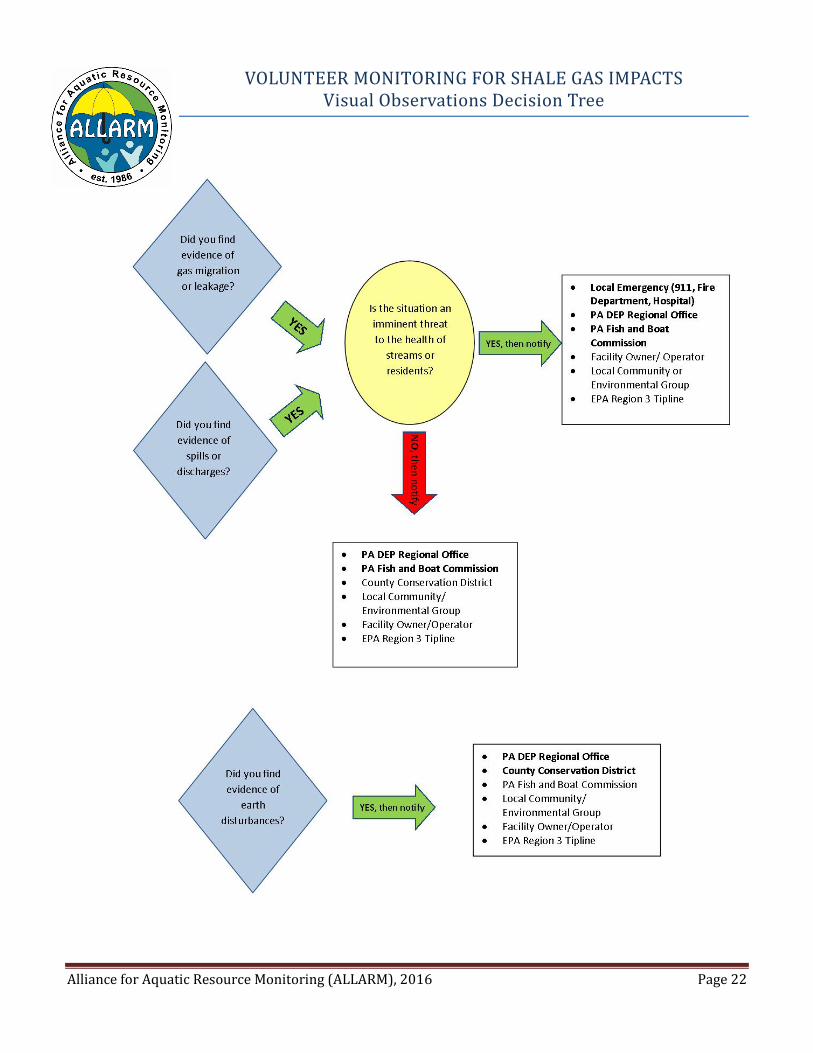
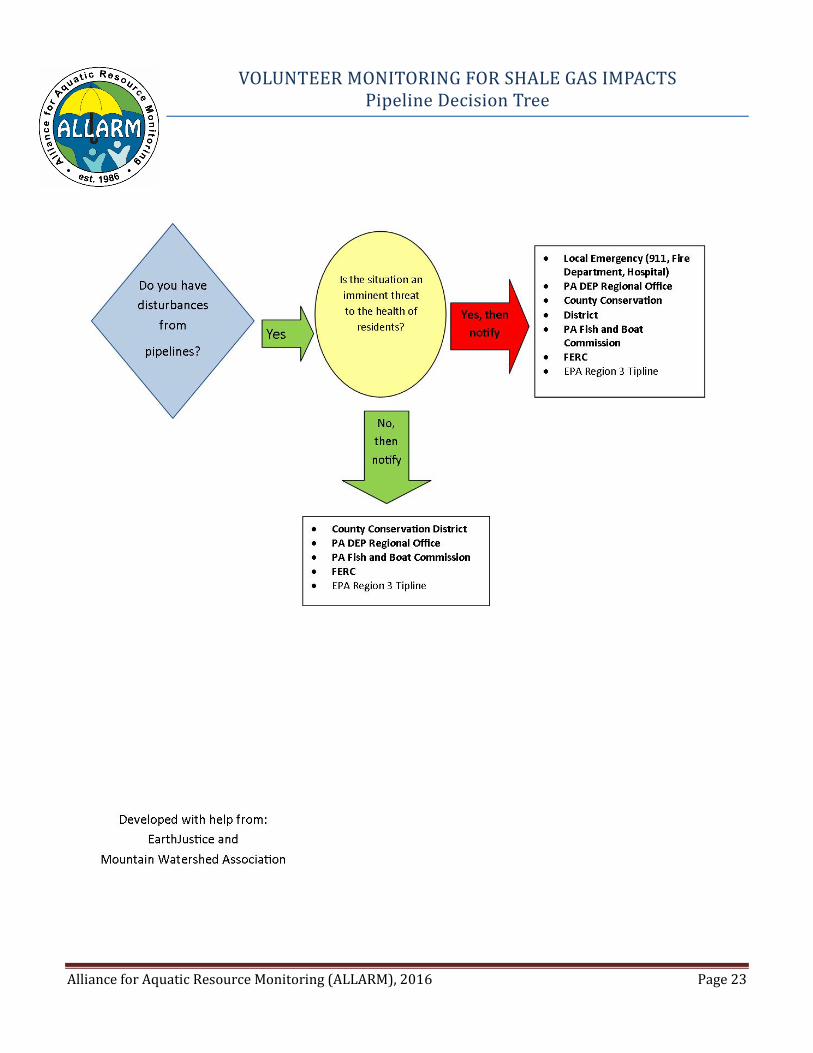
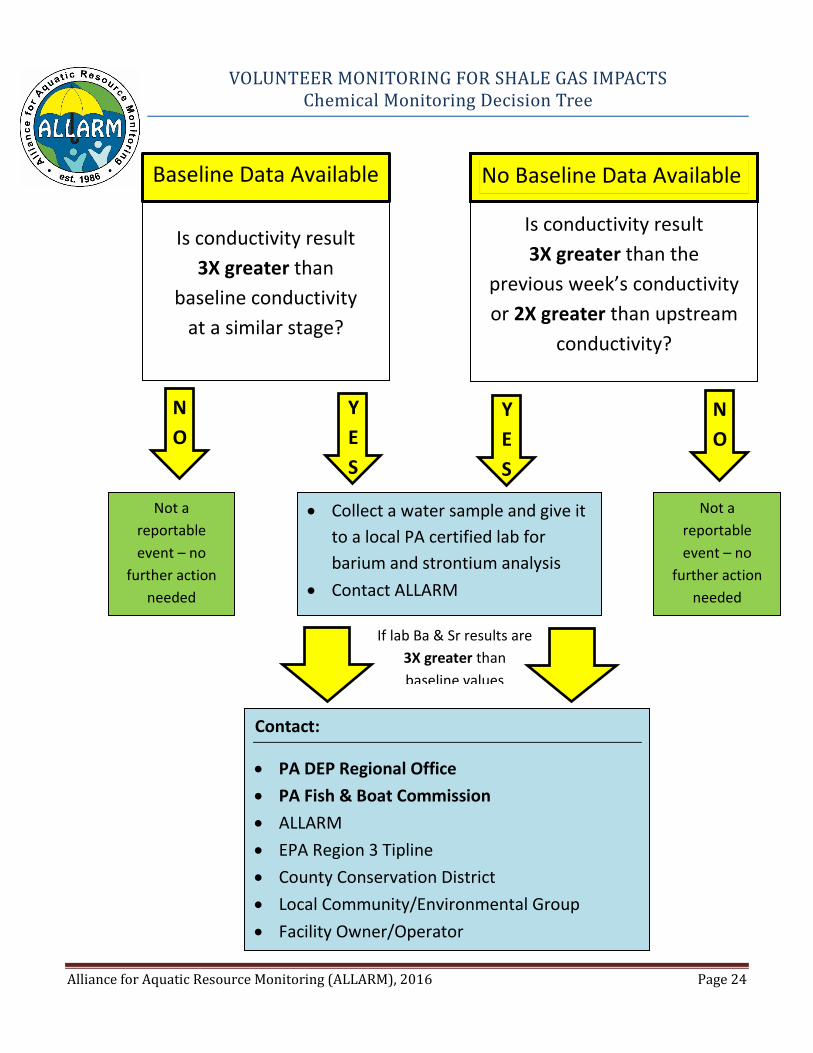
Visual Observations If visual observations indicate an impact from shale gas extraction activities, use the Visual Assessment Decision Tree (page 22) and Pipeline Decision Tree (page 23) to determine if follow-up action is needed. Chemical Monitoring Data need to be interpreted immediately after monitoring to determine if there is a reportable event – pay close attention to conductivity measurements each week. Use the next section to determine what an actionable level for your stream is. Conductivity values will fluctuate over time and are influenced by the amount of water in the stream, however large increases in conductivity from one week to the next are suspicious. If you observe a large increase in conductivity, use the Chemical Monitoring Decision Tree (page 24) and section below to determine if follow-up action is needed, and if so, who to contact. If you are unsure if you have found a reportable event and would like assistance, reach out to ALLARM. If Baseline Data is Available If you measure a spike in conductivity, compare the value in question to the baseline data. Identify other weeks when the stage value was comparable (within 0.2 feet) to the current week, and if the conductivity value is:
• Three times greater than (> 3x) the baseline conductivity value(s) for those weeks, collect a water sample using your reportable event bottle. Drop the bottle off at a local PA certified lab for barium/strontium analysis and contact ALLARM.
• Less than three times greater (< 3x) than the baseline conductivity values, no further action is needed. If Baseline Data is Not Available If you are new to monitoring and you measure a spike in conductivity, travel upstream and measure the conductivity of the same stream upstream from the gas well. If the downstream conductivity value is more than double the upstream value, or more than double than the previous week’s conductivity value at a comparable (within 0.2 feet) stage, collect a water sample using one of the ALLARM QA/QC bottles. Drop the bottle off at a local PA certified lab for barium/strontium analysis and contact ALLARM. If the conductivity value is less than two times greater than the upstream or previous week’s values, no further action is needed. Identifying a Reportable Event The certified lab should be able to analyze the water sample for barium and strontium and contact you with the results within a day or two. If the Ba/Sr results are three times greater than the baseline Ba/Sr results, refer to Reportable Event on page 25 and Chemical Monitoring Decision Tree on page 24.
Alliance for Aquatic Resource Monitoring (ALLARM), 2016 Page 22
VOLUNTEER MONITORING FOR SHALE GAS IMPACTS Visual Observations Decision Tree
Alliance for Aquatic Resource Monitoring (ALLARM), 2016 Page 23
VOLUNTEER MONITORING FOR SHALE GAS IMPACTS Pipeline Decision Tree
Alliance for Aquatic Resource Monitoring (ALLARM), 2016 Page 24
VOLUNTEER MONITORING FOR SHALE GAS IMPACTS Chemical Monitoring Decision Tree
NO
NO
YES
YES
No Baseline Data Available
Is conductivity result 3X greater than the
previous week’s conductivity or 2X greater than upstream
conductivity?
Baseline Data Available
Is conductivity result 3X greater than
baseline conductivity at a similar stage?
• Collect a water sample and give it to a local PA certified lab for barium and strontium analysis
• Contact ALLARM
Contact:
• PA DEP Regional Office • PA Fish & Boat Commission • ALLARM • EPA Region 3 Tipline • County Conservation District • Local Community/Environmental Group • Facility Owner/Operator
Not a reportable event – no
further action needed
Not a reportable event – no
further action needed
If lab Ba & Sr results are 3X greater than baseline values
Alliance for Aquatic Resource Monitoring (ALLARM), 2016 Page 25
Reportable Event Reportable events are those events that require action, such as collecting a water sample for barium/strontium analysis by a PA certified lab or calling the appropriate agency to report a shale gas impact. Reportable events are identified by criteria outlined in the decision trees. If you have questions determining whether or not an event is reportable, contact another monitor or ALLARM. Action Steps The type of reportable event you observed will inform your follow-up action steps. For example, if you observe a spike in conductivity 3x greater than baseline conditions at a comparable flow, you will collect a water sample to drop off at a local PA certified lab for barium and strontium analysis. However, if you observe a pipeline incident, you do not need to collect a water sample and will instead contact the appropriate agencies/groups. Who to Contact Anytime you witness a reportable event, be sure to contact ALLARM as well as the other agencies/groups listed in the decision tree. When contacting an agency, be sure to:
1. Identify yourself as someone who has been trained by the Alliance for Aquatic Resource Monitoring at Dickinson College to monitor impacts from shale gas extraction.
2. Explain that you have been collecting baseline data and are aware of what constitutes healthy conditions of the stream.
3. State that you have followed the protocol’s quality control procedures and have passed the ALLARM quality control program to ensure that the data you collect are credible.
4. Describe the reportable event.
Example: Hello, Mr. Bradley. My name is Jinnie Monismith and I live in Cumberland County and I have been trained by the Alliance for Aquatic Resource Monitoring at Dickinson College to monitor impacts from shale gas extraction. I have been collecting baseline data on the Letort Spring Run for 13 months and have developed an understanding of the normal and healthy conditions of the stream. I have followed the quality assurance/quality control procedures outlined in the ALLARM Shale Gas Volunteer Monitoring Protocol, and have passed ALLARM’s QA/QC Program, so I know that the data I have been collecting for these past 13 months are credible. On March 2, 2013 I observed a conductivity reading of 8,360 µS/cm, when typical values range from 560 – 680 µS/cm when the stage is 3.0 feet. 8,360 µS/cm is greater than 3x the conductivity values at the same stage, which as outlined in the ALLARM Protocol, makes this a reportable event. My monitoring site is located off of Shady Lane road at coordinates 40.1234 N latitude and -77.9876 W longitude. How can follow-up on the status of this report? For PA agency contact information, see Appendix A (page 27)
Alliance for Aquatic Resource Monitoring (ALLARM), 2016 Page 26
References ALLARM, 2012. Shale Gas Extraction: A Study Design and Protocol for Volunteer Monitoring (Version 2.0), available online at: http://blogs.dickinson.edu/marcellusmonitoring/files/2014/02/Shale-Gas-Volunteer-Monitoring-Manual-2.0-updated-links-2014.pdf
New York State Department of Environmental Conservation, Division of Mineral Resources. 2009. DRAFY Supplemental Generic Environmental Impact Statement On The Oil, Gas and Solution Mining Regulatory Program, available online at: http://www.dec.ny.gov/energy/58440.html
Penn State Marcellus Center for Outreach and Research (MCOR). 2016. Resources: Maps and Graphics, available online at: http://www.marcellus.psu.edu/resources/maps.php
River Network and PA DEP Citizen Volunteer Monitoring Program. 2001. Designing Your Monitoring Program: A Technical Handbook for Community-Based Monitoring in Pennsylvania.
Schlimm, Helen and (ALLARM), Alliance for Aquatic Resource Monitoring, "Hydraulic Fracturing Flowback Water Chemical Composition Research" (2015). Student Scholarship & Creative Works By Year. Paper 44. http://scholar.dickinson.edu/student_work/44
Zerbe, F. and C. Wilderman, 2010. Monitoring Impacts of New Gas-drilling Technologies, The Volunteer Monitor, 21(1), Spring 2010.
EPA, 2016. Drinking Water Contaminants – Standards and Regulations, available online at: https://www.epa.gov/dwstandardsregulations
Acknowledgements Throughout the process of developing this manual, the authors have worked with numerous people and organizations across the shale region gathering information from them, asking their opinions, and getting permission to use their materials. ALLARM would especially like to acknowledge the following people and organizations for their invaluable contributions to this manual:
Debra Nardone and Robert Volkmar of PA Trout Unlimited; Mike Lovegreen and Scott Mollnar of Bradford County Conservation District; Julie Vastine, Director of ALLARM; Jinnie Monismith, Assistant Director of ALLARM; Candie Wilderman, Scientific Advisor and Founder of ALLARM; Benson Ansell, Vallie Edenbo, Anna Farb, Vinca Krajewski, Kerri Oddenino, Simona Perry, Katie Tomsho, and Maunette Watson, of Dickinson College; Jim Weaver of Waterdogs; Steve Penningroth of Community Science Institute; and Faith Zerbe of Delaware Riverkeeper.
Alliance for Aquatic Resource Monitoring (ALLARM), 2016 Page 27
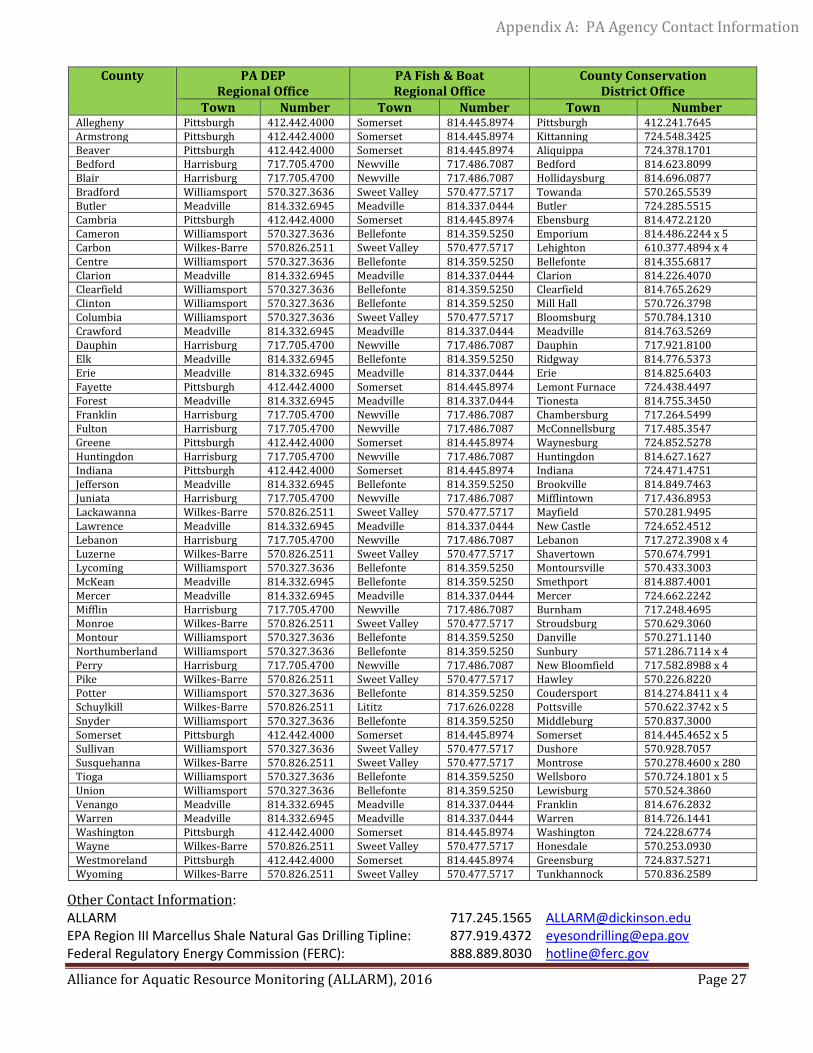
County PA DEP Regional Office
PA Fish & Boat Regional Office
County Conservation District Office
Town Number Town Number Town Number Allegheny Pittsburgh 412.442.4000 Somerset 814.445.8974 Pittsburgh 412.241.7645 Armstrong Pittsburgh 412.442.4000 Somerset 814.445.8974 Kittanning 724.548.3425 Beaver Pittsburgh 412.442.4000 Somerset 814.445.8974 Aliquippa 724.378.1701 Bedford Harrisburg 717.705.4700 Newville 717.486.7087 Bedford 814.623.8099 Blair Harrisburg 717.705.4700 Newville 717.486.7087 Hollidaysburg 814.696.0877 Bradford Williamsport 570.327.3636 Sweet Valley 570.477.5717 Towanda 570.265.5539 Butler Meadville 814.332.6945 Meadville 814.337.0444 Butler 724.285.5515 Cambria Pittsburgh 412.442.4000 Somerset 814.445.8974 Ebensburg 814.472.2120 Cameron Williamsport 570.327.3636 Bellefonte 814.359.5250 Emporium 814.486.2244 x 5 Carbon Wilkes-Barre 570.826.2511 Sweet Valley 570.477.5717 Lehighton 610.377.4894 x 4 Centre Williamsport 570.327.3636 Bellefonte 814.359.5250 Bellefonte 814.355.6817 Clarion Meadville 814.332.6945 Meadville 814.337.0444 Clarion 814.226.4070 Clearfield Williamsport 570.327.3636 Bellefonte 814.359.5250 Clearfield 814.765.2629 Clinton Williamsport 570.327.3636 Bellefonte 814.359.5250 Mill Hall 570.726.3798 Columbia Williamsport 570.327.3636 Sweet Valley 570.477.5717 Bloomsburg 570.784.1310 Crawford Meadville 814.332.6945 Meadville 814.337.0444 Meadville 814.763.5269 Dauphin Harrisburg 717.705.4700 Newville 717.486.7087 Dauphin 717.921.8100 Elk Meadville 814.332.6945 Bellefonte 814.359.5250 Ridgway 814.776.5373 Erie Meadville 814.332.6945 Meadville 814.337.0444 Erie 814.825.6403 Fayette Pittsburgh 412.442.4000 Somerset 814.445.8974 Lemont Furnace 724.438.4497 Forest Meadville 814.332.6945 Meadville 814.337.0444 Tionesta 814.755.3450 Franklin Harrisburg 717.705.4700 Newville 717.486.7087 Chambersburg 717.264.5499 Fulton Harrisburg 717.705.4700 Newville 717.486.7087 McConnellsburg 717.485.3547 Greene Pittsburgh 412.442.4000 Somerset 814.445.8974 Waynesburg 724.852.5278 Huntingdon Harrisburg 717.705.4700 Newville 717.486.7087 Huntingdon 814.627.1627 Indiana Pittsburgh 412.442.4000 Somerset 814.445.8974 Indiana 724.471.4751 Jefferson Meadville 814.332.6945 Bellefonte 814.359.5250 Brookville 814.849.7463 Juniata Harrisburg 717.705.4700 Newville 717.486.7087 Mifflintown 717.436.8953 Lackawanna Wilkes-Barre 570.826.2511 Sweet Valley 570.477.5717 Mayfield 570.281.9495 Lawrence Meadville 814.332.6945 Meadville 814.337.0444 New Castle 724.652.4512 Lebanon Harrisburg 717.705.4700 Newville 717.486.7087 Lebanon 717.272.3908 x 4 Luzerne Wilkes-Barre 570.826.2511 Sweet Valley 570.477.5717 Shavertown 570.674.7991 Lycoming Williamsport 570.327.3636 Bellefonte 814.359.5250 Montoursville 570.433.3003 McKean Meadville 814.332.6945 Bellefonte 814.359.5250 Smethport 814.887.4001 Mercer Meadville 814.332.6945 Meadville 814.337.0444 Mercer 724.662.2242 Mifflin Harrisburg 717.705.4700 Newville 717.486.7087 Burnham 717.248.4695 Monroe Wilkes-Barre 570.826.2511 Sweet Valley 570.477.5717 Stroudsburg 570.629.3060 Montour Williamsport 570.327.3636 Bellefonte 814.359.5250 Danville 570.271.1140 Northumberland Williamsport 570.327.3636 Bellefonte 814.359.5250 Sunbury 571.286.7114 x 4 Perry Harrisburg 717.705.4700 Newville 717.486.7087 New Bloomfield 717.582.8988 x 4 Pike Wilkes-Barre 570.826.2511 Sweet Valley 570.477.5717 Hawley 570.226.8220 Potter Williamsport 570.327.3636 Bellefonte 814.359.5250 Coudersport 814.274.8411 x 4 Schuylkill Wilkes-Barre 570.826.2511 Lititz 717.626.0228 Pottsville 570.622.3742 x 5 Snyder Williamsport 570.327.3636 Bellefonte 814.359.5250 Middleburg 570.837.3000 Somerset Pittsburgh 412.442.4000 Somerset 814.445.8974 Somerset 814.445.4652 x 5 Sullivan Williamsport 570.327.3636 Sweet Valley 570.477.5717 Dushore 570.928.7057 Susquehanna Wilkes-Barre 570.826.2511 Sweet Valley 570.477.5717 Montrose 570.278.4600 x 280 Tioga Williamsport 570.327.3636 Bellefonte 814.359.5250 Wellsboro 570.724.1801 x 5 Union Williamsport 570.327.3636 Bellefonte 814.359.5250 Lewisburg 570.524.3860 Venango Meadville 814.332.6945 Meadville 814.337.0444 Franklin 814.676.2832 Warren Meadville 814.332.6945 Meadville 814.337.0444 Warren 814.726.1441 Washington Pittsburgh 412.442.4000 Somerset 814.445.8974 Washington 724.228.6774 Wayne Wilkes-Barre 570.826.2511 Sweet Valley 570.477.5717 Honesdale 570.253.0930 Westmoreland Pittsburgh 412.442.4000 Somerset 814.445.8974 Greensburg 724.837.5271 Wyoming Wilkes-Barre 570.826.2511 Sweet Valley 570.477.5717 Tunkhannock 570.836.2589
Other Contact Information: ALLARM 717.245.1565 [email protected] EPA Region III Marcellus Shale Natural Gas Drilling Tipline: 877.919.4372 [email protected] Federal Regulatory Energy Commission (FERC): 888.889.8030 [email protected]
Appendix A: PA Agency Contact Information
Alliance for Aquatic Resource Monitoring (ALLARM), 2016 Page 28
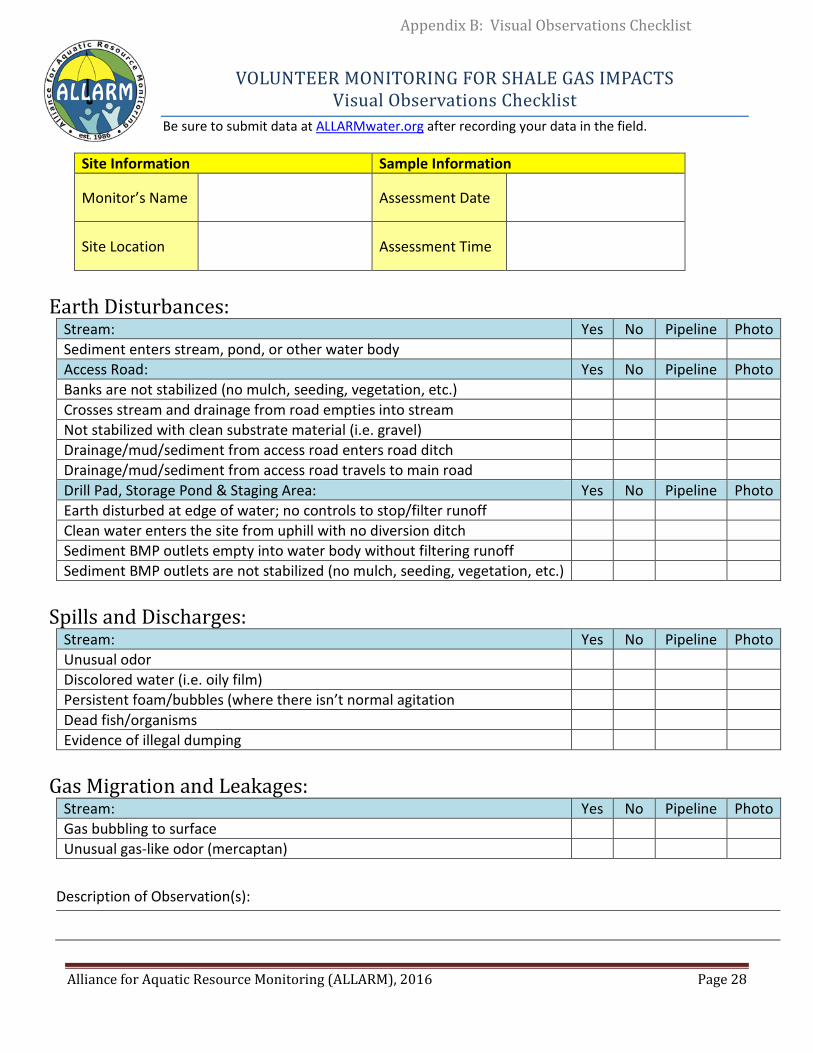
VOLUNTEER MONITORING FOR SHALE GAS IMPACTS Visual Observations Checklist
Be sure to submit data at ALLARMwater.org after recording your data in the field.
Site Information Sample Information
Monitor’s Name Assessment Date
Site Location Assessment Time
Earth Disturbances:
Stream: Yes No Pipeline Photo Sediment enters stream, pond, or other water body Access Road: Yes No Pipeline Photo Banks are not stabilized (no mulch, seeding, vegetation, etc.) Crosses stream and drainage from road empties into stream Not stabilized with clean substrate material (i.e. gravel) Drainage/mud/sediment from access road enters road ditch Drainage/mud/sediment from access road travels to main road Drill Pad, Storage Pond & Staging Area: Yes No Pipeline Photo Earth disturbed at edge of water; no controls to stop/filter runoff Clean water enters the site from uphill with no diversion ditch Sediment BMP outlets empty into water body without filtering runoff Sediment BMP outlets are not stabilized (no mulch, seeding, vegetation, etc.)
Spills and Discharges:
Stream: Yes No Pipeline Photo Unusual odor Discolored water (i.e. oily film) Persistent foam/bubbles (where there isn’t normal agitation Dead fish/organisms Evidence of illegal dumping
Gas Migration and Leakages: Stream: Yes No Pipeline Photo Gas bubbling to surface Unusual gas-like odor (mercaptan)
Description of Observation(s):
Appendix B: Visual Observations Checklist
Alliance for Aquatic Resource Monitoring (ALLARM), 2016 Page 29
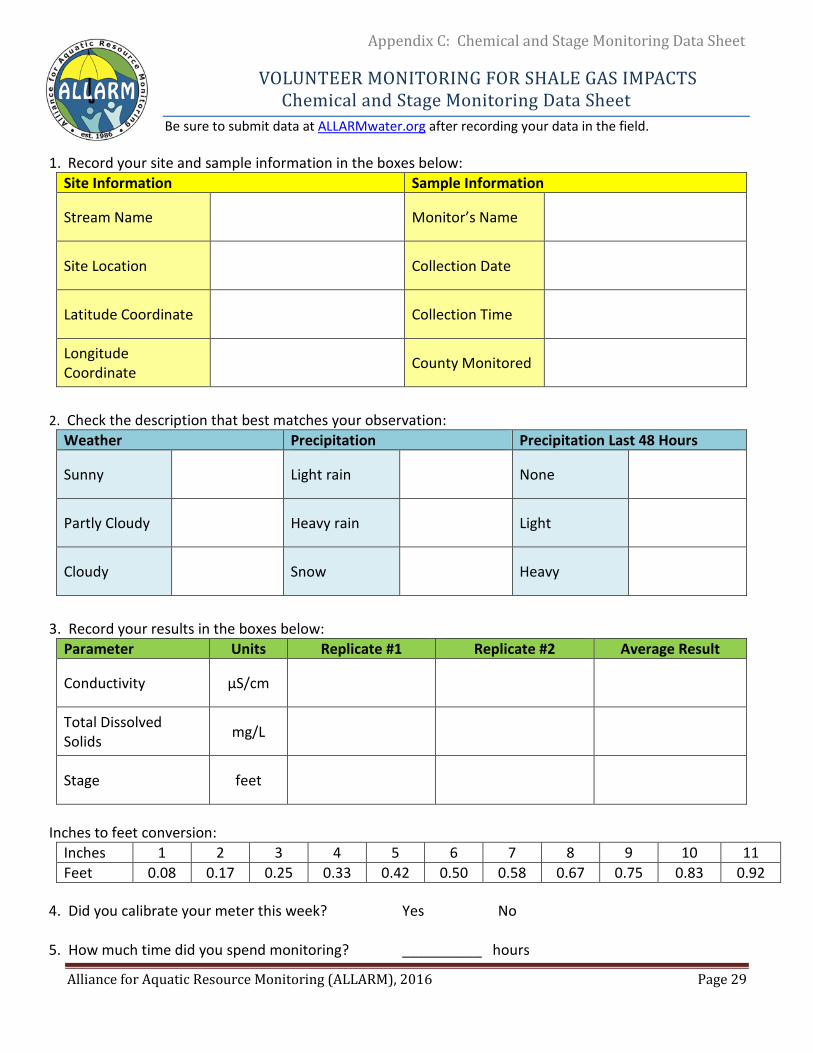
VOLUNTEER MONITORING FOR SHALE GAS IMPACTS
Chemical and Stage Monitoring Data Sheet Be sure to submit data at ALLARMwater.org after recording your data in the field.
1. Record your site and sample information in the boxes below: Site Information Sample Information
Stream Name Monitor’s Name
Site Location Collection Date
Latitude Coordinate Collection Time
Longitude Coordinate County Monitored
2. Check the description that best matches your observation:
Weather Precipitation Precipitation Last 48 Hours
Sunny Light rain None
Partly Cloudy Heavy rain Light
Cloudy Snow Heavy
3. Record your results in the boxes below:
Parameter Units Replicate #1 Replicate #2 Average Result
Conductivity µS/cm
Total Dissolved Solids mg/L
Stage feet
Inches to feet conversion:
Inches 1 2 3 4 5 6 7 8 9 10 11 Feet 0.08 0.17 0.25 0.33 0.42 0.50 0.58 0.67 0.75 0.83 0.92
4. Did you calibrate your meter this week? Yes No 5. How much time did you spend monitoring? __________ hours
Appendix C: Chemical and Stage Monitoring Data Sheet
Alliance for Aquatic Resource Monitoring (ALLARM), 2016 Page 30
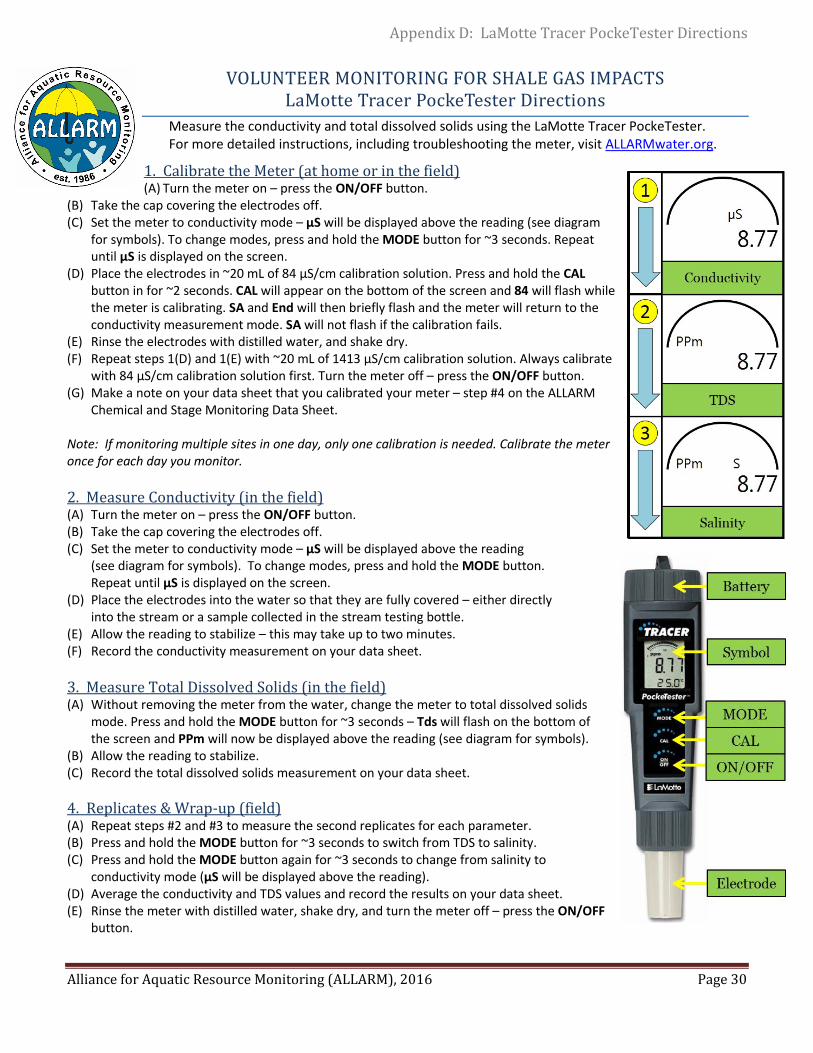
VOLUNTEER MONITORING FOR SHALE GAS IMPACTS LaMotte Tracer PockeTester Directions
Measure the conductivity and total dissolved solids using the LaMotte Tracer PockeTester. For more detailed instructions, including troubleshooting the meter, visit ALLARMwater.org.
1. Calibrate the Meter (at home or in the field) (A) Turn the meter on – press the ON/OFF button.
(B) Take the cap covering the electrodes off. (C) Set the meter to conductivity mode – µS will be displayed above the reading (see diagram
for symbols). To change modes, press and hold the MODE button for ~3 seconds. Repeat until µS is displayed on the screen.
(D) Place the electrodes in ~20 mL of 84 µS/cm calibration solution. Press and hold the CAL button in for ~2 seconds. CAL will appear on the bottom of the screen and 84 will flash while the meter is calibrating. SA and End will then briefly flash and the meter will return to the conductivity measurement mode. SA will not flash if the calibration fails.
(E) Rinse the electrodes with distilled water, and shake dry. (F) Repeat steps 1(D) and 1(E) with ~20 mL of 1413 µS/cm calibration solution. Always calibrate
with 84 µS/cm calibration solution first. Turn the meter off – press the ON/OFF button. (G) Make a note on your data sheet that you calibrated your meter – step #4 on the ALLARM
Chemical and Stage Monitoring Data Sheet. Note: If monitoring multiple sites in one day, only one calibration is needed. Calibrate the meter once for each day you monitor. 2. Measure Conductivity (in the field) (A) Turn the meter on – press the ON/OFF button. (B) Take the cap covering the electrodes off. (C) Set the meter to conductivity mode – µS will be displayed above the reading
(see diagram for symbols). To change modes, press and hold the MODE button. Repeat until µS is displayed on the screen.
(D) Place the electrodes into the water so that they are fully covered – either directly into the stream or a sample collected in the stream testing bottle.
(E) Allow the reading to stabilize – this may take up to two minutes. (F) Record the conductivity measurement on your data sheet. 3. Measure Total Dissolved Solids (in the field) (A) Without removing the meter from the water, change the meter to total dissolved solids
mode. Press and hold the MODE button for ~3 seconds – Tds will flash on the bottom of the screen and PPm will now be displayed above the reading (see diagram for symbols).
(B) Allow the reading to stabilize. (C) Record the total dissolved solids measurement on your data sheet. 4. Replicates & Wrap-up (field) (A) Repeat steps #2 and #3 to measure the second replicates for each parameter. (B) Press and hold the MODE button for ~3 seconds to switch from TDS to salinity. (C) Press and hold the MODE button again for ~3 seconds to change from salinity to
conductivity mode (µS will be displayed above the reading). (D) Average the conductivity and TDS values and record the results on your data sheet. (E) Rinse the meter with distilled water, shake dry, and turn the meter off – press the ON/OFF
button.
Appendix D: LaMotte Tracer PockeTester Directions
Alliance for Aquatic Resource Monitoring (ALLARM), 2016 Page 31
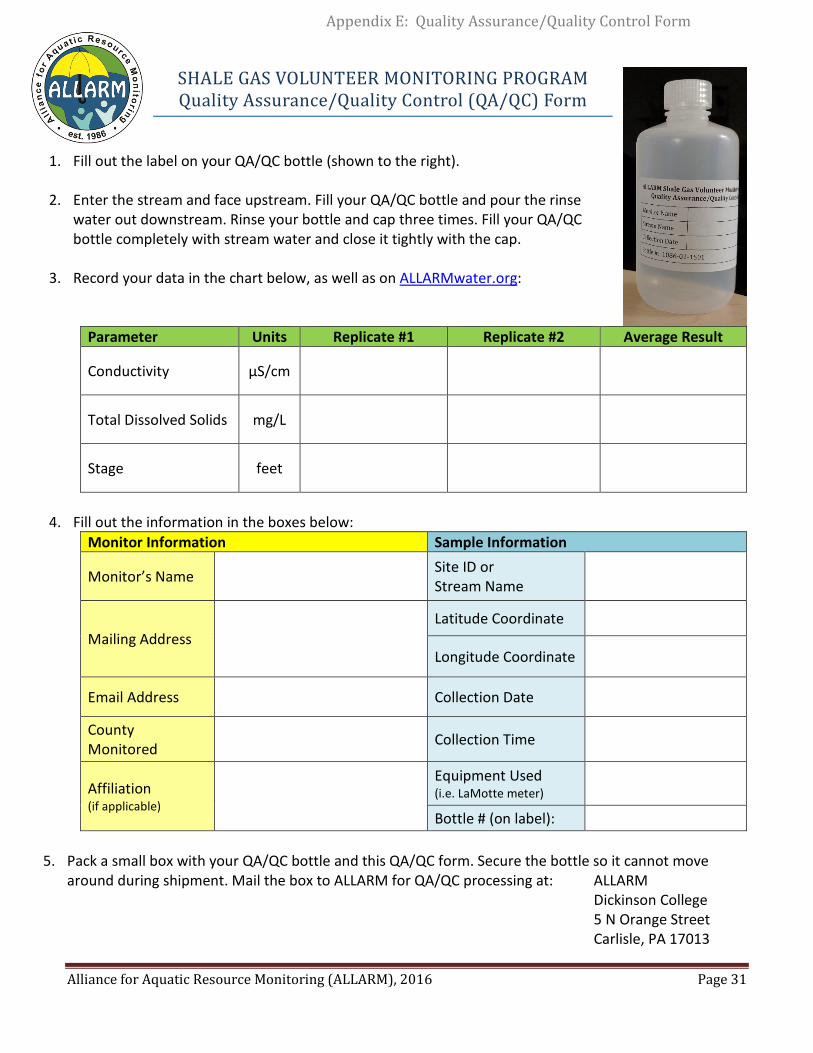
SHALE GAS VOLUNTEER MONITORING PROGRAM Quality Assurance/Quality Control (QA/QC) Form
1. Fill out the label on your QA/QC bottle (shown to the right). 2. Enter the stream and face upstream. Fill your QA/QC bottle and pour the rinse
water out downstream. Rinse your bottle and cap three times. Fill your QA/QC bottle completely with stream water and close it tightly with the cap.
3. Record your data in the chart below, as well as on ALLARMwater.org:
Parameter Units Replicate #1 Replicate #2 Average Result
Conductivity µS/cm
Total Dissolved Solids mg/L
Stage feet
4. Fill out the information in the boxes below:
Monitor Information Sample Information
Monitor’s Name Site ID or Stream Name
Mailing Address Latitude Coordinate
Longitude Coordinate
Email Address Collection Date
County Monitored Collection Time
Affiliation (if applicable)
Equipment Used (i.e. LaMotte meter)
Bottle # (on label):
5. Pack a small box with your QA/QC bottle and this QA/QC form. Secure the bottle so it cannot move
around during shipment. Mail the box to ALLARM for QA/QC processing at: ALLARM Dickinson College 5 N Orange Street Carlisle, PA 17013
Appendix E: Quality Assurance/Quality Control Form
Alliance for Aquatic Resource Monitoring (ALLARM), 2016 Page 32
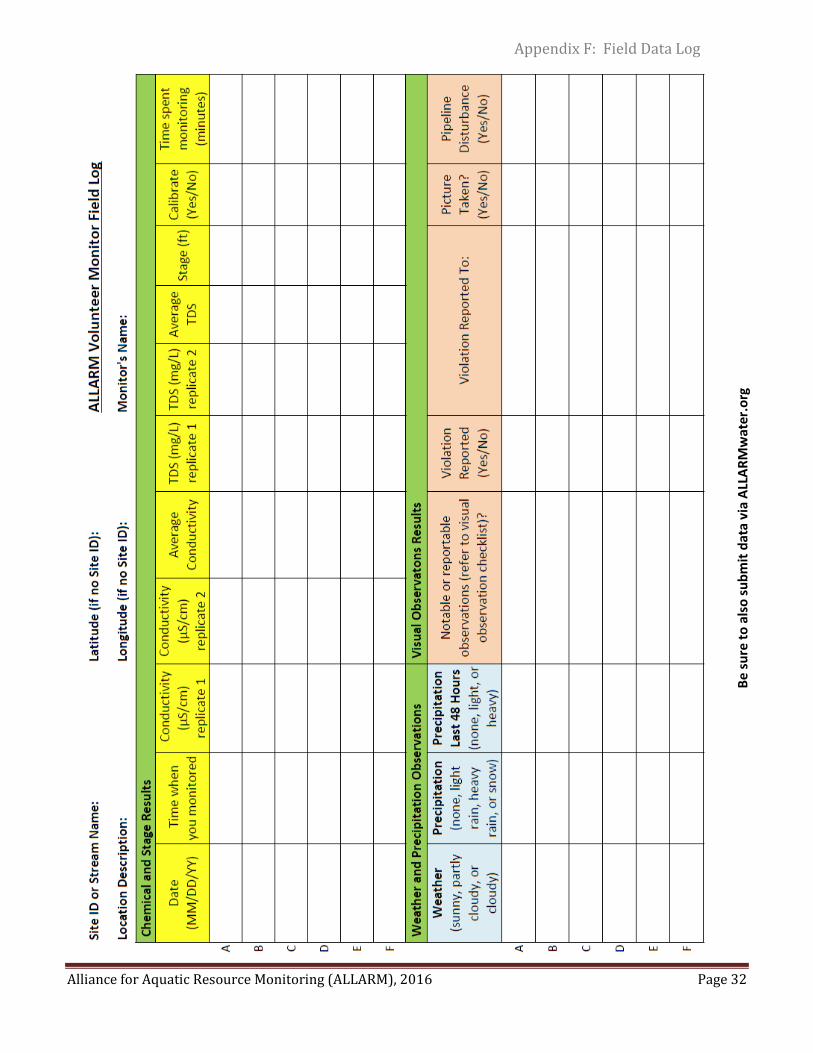
Appendix F: Field Data Log
Be su
re to
als
o su
bmit
data
via
ALL
ARM
wat
er.o
rg