shadow banking in china: institutional risks - peri · 1 shadow banking in china: institutional...
TRANSCRIPT
1
Shadow Banking in China: Institutional Risks1
Jianjun Li, Professor, Central University of Finance and Economics and
Sara Hsu, Assistant Professor, State University of New York at New Paltz
with Yanzhi Qin, Masters Student, Central University of Finance and Economics
JEL Codes: G2, G3
Keywords: Shadow banking; China; Stress Tests; banks; Risk; Solvency; Liquidity
Abstract: In this paper, we examine China’s shadow banking institutions for financial risks. We
use a bank stress test to analyze solvency risk for the systemically important financial
institutions and the banking system as a whole. We find that there is some risk of bankruptcy
and potentially a risk of liquidity shortages, for which we lack sufficient data to run a stress test.
We conclude with policy recommendaitons.
Introduction
China’s shadow banking system is receiving increasing attention for new products and practices
that, while developing the financial system, have increased risk. In this paper, we examine the
shadow financial system in China and examine where microeconomic-level financial risks lie.
We use a bank stress test to examine solvency risk. We find that bank-related indicators may
indicate solvency risk, especially where there are many existing non-performing loans, and that
liquidity risk may be an issue for the banking sector as a whole. This paper has a companion
piece on China’s shadow banking system risks at the systemic level.
While some products appear to contribute positively to financial development, other products,
such as credit guarantees and trusts, have proven to be far riskier. China’s regulatory bodies
are well aware of this. However, due to rapid expansion of the shadow financial system over
the past few years, it is impossible to regulate and monitor all aspects of the system. In this
paper, we ask, how can we conceive of and assess risks in the system, at the institutional level?
Risk Theory-From the Firm to the Economy
Before laying out the topography of the Chinese shadow banking system, we enter into a
discussion of risk by looking at what financial risk entails. Indeed, it is a complex subject that
must be analyzed at the firm level, and protected against by using microprudential regulations, 1 This project is sponsored by the National Natural Science Foundation of China, Project Number 71173246.
2
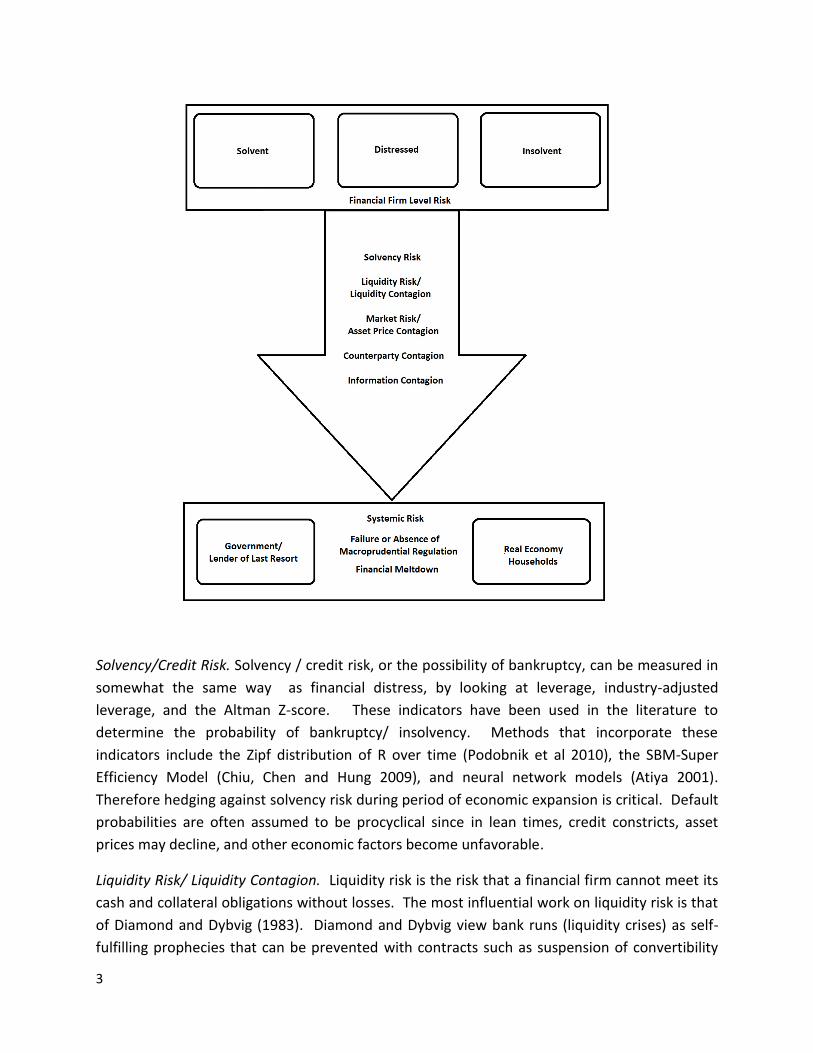
as well as at the economy-wide level, protected against by using macroprudential regulations.
We use the following diagram to explain the different levels of risk.
First, at the level of the firm, we follow Purnanandam (2008), who makes a distinction between
financial distress and insolvency in discussing solvency or credit risk. In the state of financial
distress, firms lose customers, employees, and suppliers and may miss debt payments.
Distress can be quantified by examining leverage, industry-adjusted leverage, and the Altman Z-
score. In the state of insolvency, the value of firms’ bonds is below the face value of its debt.
Firms must control for liquidity and solvency risk, and guard against market risk. These three
types of risk can lead to contagion when unchecked. Liquidity contagion can occur when
uncertainty prevails. Asset price contagion can arise from increased insolvencies and a rise in
market risk. As solvency and liquidity shocks occur, counterparty contagion and information
contagion spread financial distress to the rest of the economy, bringing about an upswing in
systemic risk and the increased likelihood of a financial meltdown. We explore these types of
risks and channels of contagion in this section.
The following diagram illustrates the types of risks emanating from the firm to the rest of the
financial system. Financial firm level risk includes solvency or credit risk. Liquidity risk, and
market risk, and these in turn pose the threat of liquidity contagion, asset price contagion,
counterparty contagion, and information contagion to the rest of the financial system. We next
explore risks that we will discuss in this paper, liquidity and solvency or credit risk.
3
Solvency/Credit Risk. Solvency / credit risk, or the possibility of bankruptcy, can be measured in
somewhat the same way as financial distress, by looking at leverage, industry-adjusted
leverage, and the Altman Z-score. These indicators have been used in the literature to
determine the probability of bankruptcy/ insolvency. Methods that incorporate these
indicators include the Zipf distribution of R over time (Podobnik et al 2010), the SBM-Super
Efficiency Model (Chiu, Chen and Hung 2009), and neural network models (Atiya 2001).
Therefore hedging against solvency risk during period of economic expansion is critical. Default
probabilities are often assumed to be procyclical since in lean times, credit constricts, asset
prices may decline, and other economic factors become unfavorable.
Liquidity Risk/ Liquidity Contagion. Liquidity risk is the risk that a financial firm cannot meet its
cash and collateral obligations without losses. The most influential work on liquidity risk is that
of Diamond and Dybvig (1983). Diamond and Dybvig view bank runs (liquidity crises) as self-
fulfilling prophecies that can be prevented with contracts such as suspension of convertibility
4
and deposit insurance. Diamond and Rajan (2001) describe a model in which banks create
liquidity and in the process experience financial fragility. Other models have shown that there
are alternatives to regulation to stop liquidity crises. Cifuentes, Ferrucci, and Shin (2005) find
that liquidity requirements on institutions can be as effective as capital requirements in
preventing contagion.2
For China, we can compute solvency or credit risk and some aspects of systemic risk. Other
data, such as information on liquid assets, specific interbank liabilities (nonaggregated), foreign
exchange loans, and details on structure of the bond portfolio, are publicly unavailable. Using
this framework above and the data available, we qualitatively analyze the Chinese shadow
banking system in the following section, then set up a model to analyze firm risk in terms of
solvency or credit risk and, at a less detailed level, in terms of liquidity risk. We examine
contagion and systemic risk in a companion paper.
China’s Shadow Banking System
China’s shadow financial system is comprised of non-bank financial products, including bank-
trust cooperation financial products, products issued by trust companies and financial leasing
companies, and Q-REITS3 and credit risk assets; and credit creation products often produced by
small loan companies, investment companies, credit guarantee companies, insurance
brokerage firms, pawn shops, private equity investment funds, and venture capital funds. The
shadow financial system is dominated by commercial banks (in off balance sheet transactions),
insurance companies, and trusts. Although the Chinese shadow banking system includes
informal, or folk, financing, we disregard this sector in this paper because it is highly
heterogeneous and relatively low-risk (see Li and Hsu 2009 for more information).
The shadow banking system has grown rapidly in recent years. Supervision currently focuses on
commercial banks, while attention is not given to property securities and other non-loan
assets. Trust companies and security traders engage in activities that may be high-risk, with
high returns as well. Below, we discuss some of the riskier shadow banking institutions,
including commercial banks, trusts, Q-REITs, and credit guarantee companies.
2 They construct a model accounting for both counterparty contagion and a decline in asset prices, and find that
prudential regulation imposing solvency constraints can still create contagion when asset prices are marked to
market.
3 Q-REITS is the short for quasi real estate investment trusts. It is a kind of investment funds issued by companies
that own and usually manage income-producing real estate property such as apartments, offices, and industrial
space.
5
Commercial Banks. Commercial bank financial products have been viewed as relatively less
risky, although many of the products purchased through banks carry more risk than has been
perceived by customers. There has been historically a lower rate of default for commercial
bank products, although officials have recognized that risk has been building and have recently
attempted to deleverage the shadow banking system through monetary policy tightening.
Commercial banks in China have sold the products of trust and investment companies, or have
engaged in shadow banking activities themselves by transferring deposits into financial
management products and lending the funds to short-term project investors. Commercial
banks are better regulated than trust financing or credit guarantee companies, although they
face some obstacles to appropriate supervision. The Commercial Banking Law, passed in 1995,
is enforced by the People’s Bank of China. In addition, the China Banking Regulatory
Commission, created in 2003, is charged with regulating banks. The power of regulation does
not necessarily translate into the power of enforcement, since the CBRC is both a supervisor
and a state agent (supporting changing state policies), playing conflicting roles, and because it
lacks a sufficient budget to carry out proper law enforcement (Brehm 2008). The commercial
banking system hence appears to closely follow international standards in regulation, but in
terms of enforcement it lags behind.
By 2011, there were 23,501 financial products, valued at 16.49 trillion RMB, and the number of
issuers increased from 14 in 2004 to 100 in 2011. Financial products are becoming increasingly
complex, with both increasing variety of and increasing participation in product
investments. The average growth rate of new financial products has been as high as 114.09%
over this eight-year period, at its lowest in 2009 due to the global financial crisis, and picking up
speed again in 20104,5,6.
4 Currently, the top ten financial fund trading banks, occupying 62.27% of the financial products market, are the
Bank of Communications, China Merchants Bank, the Industrial and Commercial Bank of China (ICBC), Bank of
China, China Construction Bank, Shenzhen Development Bank, Agriculture Bank of China, Shanghai Pudong
Development Bank, China Minsheng Bank, and the Bank of Beijing.
5 In 2011, five major state-owned banks and the nationwide joint-stock banks hold the dominant position in the
release of RMB financial products. In foreign currency denominated financial products, Bank of China, Bank of
Communications, and China Merchants Bank dominate, while for USD denominated financial products specifically,
the Shanghai Bank is also prominent.
6 Financial products include those denominated in RMB, USD (U.S. Dollars), HKD (Hong Kong Dollars), AUD
(Australian Dollars), and EUR (Euros). In 2004, US dollar financial products occupied 62.28% of foreign exchange
denominated financial products. However, as Chinese personal wealth increased, the issuance size of RMB
financial products exceeded those of the USD in 2007. By the end of 2011, RMB financial products accounted for
6
China’s rising middle class has given way to new financial market investors, individuals who may
not have large amounts of wealth to invest and who may not have much knowledge of the
market. Specialized funds have been created to meet their needs, some of which are on the
esoteric side. For example, the China Construction Bank created an investment product based
on the art industry, while Minsheng Bank sold a product based on white liquor. Shenzhen
Development Bank also created a financial product based on white wine with an investment
period of one year. Personalized financial management products satisfy a wide range of
demands.
Both on and off balance sheet transactions can be classified as shadow banking. On balance
sheet products include bonds, acceptances, repo, and ABS products. Off balance sheet
products include wealth management products, and included trust products until the CBRC
banned banks’ sales of trust products in 2013. We can obtain a glimpse of both on and off
balance sheet transactions in the balance sheet indicator ‘Risk Weighted Assets.’ Assets and off
balance sheet transasctions are accorded the proper risk weight category according to
international guidelines.
Trusts. China’s trust sector is the third largest financial subsector, after the banking and
insurance subsectors, and possibly the riskiest. As we discuss below, some trusts have
encountered problems since financial trusts are not subject to the same regulations that banks
are subject to (Reuters 2012).
Until 2013, trusts could be set up either as cooperation between banks and trusts, or as
financial trusts alone. Now banks are forbidden from selling trust products. Trust products
may stretch across banking, securities, and many other fields of investment.
Trust companies have skirted regulation that governs activity of commercial banks, and have
often engaged in very risky activity. “Wealth management products” or trusts issued by non-
bank financial companies have attracted attention for investing in undisclosed or highly risky
projects. Poor real investments that the trusts are based on have come to light in recent
months—the product called Golden Elephant No. 38 was based on investment in a near-empty
housing project in poor, rural Taihe, while another product invested in a coal company, Zhenfu
Energy, was at risk of default because the coal company owner was unable to repay loans
(Reuters 2012). Additional, possibly questionable, real investments include investment in oil
paintings or white liquor.
87% of all financial products in China. RMB financial products are larger in total value than foreign exchange
denominated financial products, occupying most of the financial products market
7
Trusts that invest in local government and municipal bonds are also at risk since these products
are based on underlying assets that may not generate an equivalent cash flow. Large amounts
of local government debt were issued in 2011, some of which will likely not be repaid. For
example, a local government just outside of Beijing that financed a copy of Manhattan on the
ground will likely not return the amount of debt it has used to pay for construction of the city,
nor will a stadium fronted by Olympic rings in Hunan, central China (Forsythe and Sanderson
2011). Corporate bonds may also face higher levels of risk, with the slowdown of the
economy.7 In addition, to skirt restrictions on Chinese capital controls, corporate bond issuers
have issued bonds through offshore holdings companies and sent the proceeds onshore in the
form of foreign direct investment, equity rather than debt, which means that foreign bond
holders are subordinated to onshore creditors, reducing likelihood of repayment should the
corporation collapse (Cookson 2011).
Both trust financing companies and trust issuing commercial banks are regulated, even though
some trust companies have engaged in high risk project investment. The regulatory authority
has put forth a series of laws and regulations to bring about the healthy development of trust
financial products, but the trust companies continue to engage in speculative investment.
Quasi-Real Estate Investment Trusts. Quasi-Real Estate Investment Trusts, or Q-REITS, carry
out investment in real estate management and operations.8 Most Q-REIT transactions are
associated with government owned real estate. As in the case of the general trust category, Q-
REITs have been suffering recently due to a decline in the value of underlying assets—in this
case, real estate.
The most common Q-REIT9 form is the trust. This began on August 12, 2010, when the CBRC
officially issued the notice on “Bank-trust Financial Cooperation”, which ushered in a stage of
7 China’s new high-yield bond market (junk bond market) is a sub-sector to watch.
8 China does not have REITs that rank at the international standard, but rather has similar REIT products that are
denoted as Quasi-Real Estate Investment Trusts, or Q-REITs.
9 Q-REITs have several players. First, is the fund holder—the investor who holds the certificate, who enjoys fund
rights and interests. Second, is the fund supervisor, who belongs to the fund management company and charges a
supervisory fee. Third, is the property supervisor manages the real estate property and charges a management fee,
and fourth, the fund trustee is assigned by the commercial bank and is responsible for holding fund assets and
settling fund accounts, and collecting trust fees. Fifth is the consultant firm which may be invited by the fund
supervisor as needed to provide professional investment advice and is paid the corresponding consultancy fee.
8
comprehensive standards and innovation. Q-REITs also come in the form of Listed Property
Funds (LPFs), which use real estate rental receipts as an income flow10.
Q-REITs incorporate risk based in large part on the underlying real estate assets. As the Chinese
real estate market experiences a boom and corresponding bust, Q-REITs are at risk as well. As
of 2011, the real estate trust average yearly returns ratio was as high as 10.09%. Figure Two
shows the average annualized returns of funds raised by REITs. However, products related to
real estate have already been in trouble. According to public statistics, in the first half of this
year, more than 30 early redemptions of real estate trust products have already been
completed (Xinhua 2012). Statistics reported by Yongyi Trust, a well-known trust web portal in
China, showed that mature REITs may reach a peak both in third quarter of 2012 and second
quarter of 2013, when the total repayment scale will be 43.959 billion RMB and 50.570 billion
RMB respectively (Xu 2012). A far more aggressive report is given by China Investment
Corporation Limited (CICC), which said that in the next three years a 700-billion RMB
repayment of REITs will be due. The estimation of repayment scale in this year and next year
are 223.4 billion and 250.0 billion RMB respectively.
Tightening housing policy serves as a main reason for the REITs trouble. Influenced by
restrictive home-buying policies, housing prices witnessed a continuous decline during recent
months. Thus, numbers of real estate agents have faced financial strain. Consequently,
concerns about the housing industry and devaluation of REITs have increased.
China’s real estate trust products are in their initial stages of development and growing rapidly.
Because of their rapid growth and corresponding poor risk management, Q-REIT business
carried out by four major trust companies was ordered to be temporarily suspended at the end
of 2011. The China Banking Regulatory Commission (CBRC) required Bohai International Trust,
Founder BEA Trust, Minmetals International Trust and Sichuan Trust to suspend business due to
a lack of prudence in selecting investment programs (China Business News 2011).11 10
LPFs realize gains through four methods: gaining higher rent through existing real estate, developing new real
estate projects, carrying out real estate development to enhance income, and reducing operating costs. The major
part of the income is assigned to the investors of Q-REITs.
11 Most of the investors of REITs are individual investors. Devaluation of the financial product will cause significant
losses for them, which would likely lead to a wider range of early redemptions. Still, the current situation is unlikely
to act as a systemic shock on the domestic financial system. First of all, commercial banks, the most important part
of the financial system, would not be strongly impacted. Bank-trust products, on the other hand, have been kept
under rigid supervision. Secondly, the trust industry has ways to overcome this specter. Solutions for insolvent real
estate agents include debt restructuring and rollover, both of which have already taken place. Assumption of REIT-
related debt by asset management companies has prevented default. Regardless of restructuring, most of the
9
Credit Guarantee Companies. Credit guarantee companies guarantee credit risk, thereby
taking responsibility for the risk.12 While as a concept these types of companies seem like a
good idea, they are particularly subject to the riskiness of the transactions they guarantee.
Recently, a rash of problems stemming from credit guarantee companies has affected China’s
financial sector, which we turn to in a moment.
Credit guarantee companies have undergone four stages of development13. In the first stages,
1993 to 2000, development of the credit guarantee industry was slow, and capital stocks were
used mainly for government investment. In the second stage, 2001 to 2007, China joined the
World Trade Organization and the economy boomed. Credit guarantee companies were no
exception, and developed rapidly under increased private capital injections. The third stage,
2008 to 2010, witnessed the impact of the financial crisis, and survival of the industry has been
exceptionally difficult. The government, in response, has guaranteed the industry, causing
some inflows of finance. The fourth stage has occurred since 2011. In this stage, several
regional credit guarantee companies have arisen, as have local credit guarantee associations.
In addition, starting in this period, some of the guarantee companies have experienced
difficulties. Tight monetary policies and tightened real estate market supervision occurred.
Informal finance increased as bank lending declined. Some credit guarantee companies lent
money to informal financial markets. This increased the riskiness of credit guarantee
companies. For example, the Henan Province credit guarantee industry based in Zhengzhou
REITs were issued based on qualified collateral. This collateral provides that if investment cannot be recovered by
the returns from REITs, trust companies have the ability to make up losses from these projects (Xu 2012).
12 Credit guarantee companies may be divided into financial bonding companies and non-financial bonding
companies. The former provides a guarantee for the fund holder and the latter is not directly engaged with the
loan itself, but guarantees advanced payments and commercial contracts for example. We examine here financial
bonding companies.
13 Most guarantee companies with low registered capital collect money from institutions and banks have been
based on special relationships (guanxi loans), absorbing public deposits at high interest rates (average 10-25%).
They then lent the funds to folk lending brokers or institutions (such as investment conpanies) at a higher rate or
invested in real estate projects or purchased REITs. They also lent out the money as bridge loans, including short
term construction loans or loans for business working capital, Some of the guarantee companies invested money
in private equity funds or directly traded stocks on securities markets. This method of operating reveals that
guarantee companies have pursued high-risk-industry investment or high-risk markets. In China, most guarantee
companies are lending and borrowing for business purposes, which is the main factor creating high risk in credit
companies.
10
contains companies that are densely interwoven with informal finance. A crisis among four
large-scale credit guarantee companies erupted in 2011, involving an amount of 2,450 million
RMB. These companies went out of business.
In another case of guarantee company difficulties, Zhongdan Investment Credit Guarantee Co.
Ltd. faced a liquidity shortage due to its investment in a US consultancy that failed (Yang and
Ma 2012). In another case, a complex web of 23 companies in Hangzhou, Zhejiang Province
was linked together and threatened with failure due to the bankruptcy of Tianyu Construction,
a company at the center of the web (Zhang, Zhang, Shen, Wen and Zheng 2012). After Tianyu’s
bankruptcy, the company’s creditors started to call in loans to other firms guaranteed by Tianyu.
According to Zhang Hanhua, the Vice President of Guangzhou Intermediate People’s Court,
increasing numbers of small-loan companies and guarantee companies are involved in informal
finance credit disputes which have already been accepted by the court. In Wenzhou, one third
of credit disputes accepted by the local court are related to guarantee companies (Wang 2012).
Credit guarantee companies have engaged in riskier activity, and have aroused supervisory
organizations to examine them more carefully. Additional policies and measures were
implemented in 2011 to strengthen credit guarantee company supervision. The China Banking
Regulatory Commission has increased attention to credit guarantee companies’ risks. Most
provinces and cities have also acted to adopt supervisory measures since 2010. For example, in
August 2010, Jiangsu Province began external audits and spot checks on credit guarantee
companies’ business. Guangdong Province and Zhejiang Province, in November 2010 and
January 2011 respectively, issued policies to strengthen regulations on credit guarantee
companies.
One source of credit guarantee companies’ capital is via institutional investor funds.
Enterprises are partial to credit guarantee companies because the rate of return is high. The
populace itself invested in credit guarantee companies, with individuals getting family and
friends to put their funds into the companies. Credit guarantee companies have been able to
obtain funds at a low interest rate from banks and extend loans to individuals at a higher
interest rate, earning a big profit. Some banks, however, including the Bank of China and the
Agricultural Bank of China have declared that they will not cooperate with private guarantee
companies. According to a guarantee company employee, without issuing any public
announcement yet, the Industrial and Commercial Bank of China is not willing to support
private guarantee companies, either (Qin 2012). Acting as an intermediary, the credit guarantee
company takes a big risk because they cannot gain re-financing from the Central Bank.
Credit guarantee companies engaging in the real estate market seek high returns at a very high
risk. Credit guarantee companies have also provided bridge loans to companies that could not
11
repay their bank debts. Some credit guarantee companies have absorbed funds for investment
in the stock market or for venture capital institutions. This activity has moved credit guarantee
companies away from traditional guarantee services. In Henan, some real estate businesses
even register through credit guarantee companies in order to obtain financing. Credit
guarantee companies have lost competitiveness due to increased perceived risky behavior.
Two additional notable problems with credit guarantee companies include opaqueness of
company control structure and inside trading. For example, the identity of Chen Yibiao, the
person in control of Huangding Financial Guarantee Corporation, once the biggest guarantee
company in Guangdong province, was concealed from the shareholder lists of these two firms.
This allowed the firms under Chen’s control to appear that they had no relation to each other.
A wide range of inside trading within Huangding had developed. The complicated shareholder
structure and prodigious transaction scale resulted in a loss of financing, and afterward all
insider trading committed by Huangding employees was released. Influenced by Huangding’s
collapse, the guarantee industry in Guangdong province has been severely impacted (Qin 2012).
We next turn to modeling firm risk.
Modeling Firm Risk
In this section, we analyze firm level credit risk indicators for public banks in the Chinese
financial sector, and then look at liquidity ratios of banks and trusts. While we realize that not
all banks are shadow banks per se, they are systemically important for both the non-shadow
and shadow banking sectors. It is difficult to impossible to separate out banks’ shadow banking
transactions from regular transactions. Trusts, on the other hand, can be considered mostly
within the shadow banking sector due to the nature of their transactions, as noted above.
First, we run a bank stress test on the banking sector as a whole and on the top five significant
financial institutions (SIFIs), including the Agricultural Bank of China, the Bank of China, the
Bank of Communications, the China Construction Bank, and the Industrial and Commercial Bank
of China. In this stress test, we assume that an external shock impacts China’s banking sector.
Since we lack detailed data on foreign exchange loans and interbank lending, we focus on the
impact of a rise in credit risk to the Chinese banking system. The stress test process is as in the
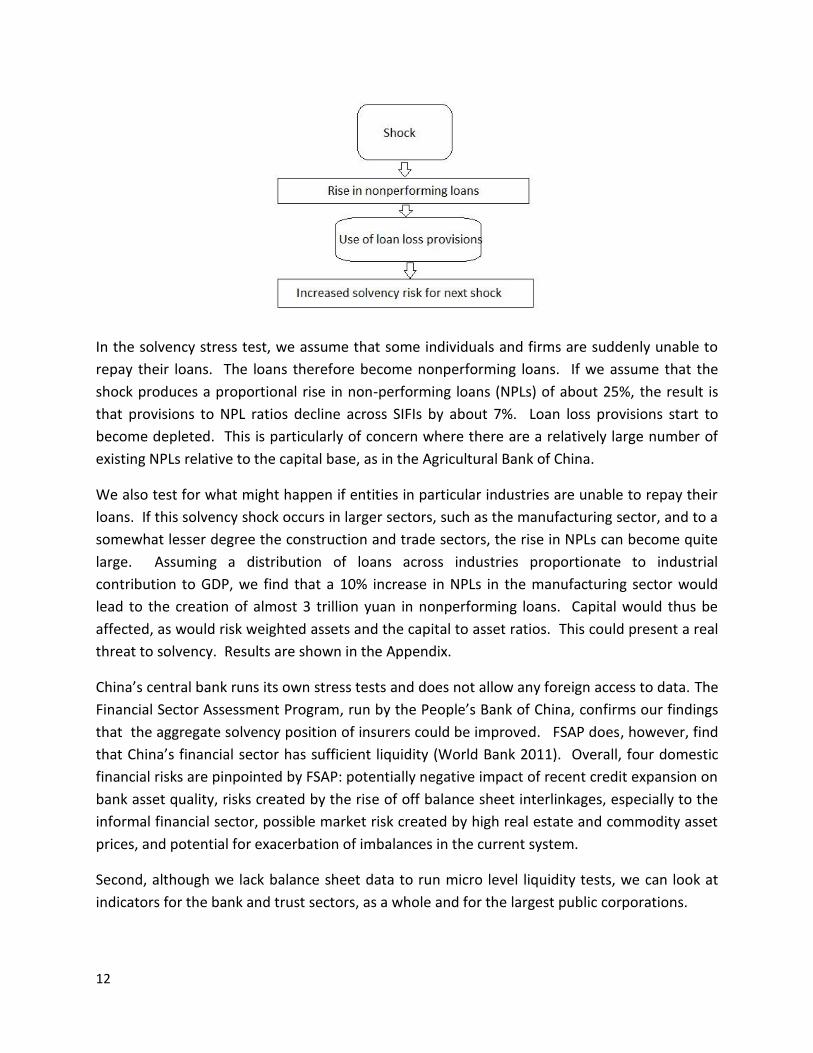
chart below. We base our stress tests on the stress test model presented in Čihák (2007). This
is a balance sheet type of stress test that examines scenarios in which particular balance sheet
items are negatively impacted, and how they affect other balance sheet indicators.
12
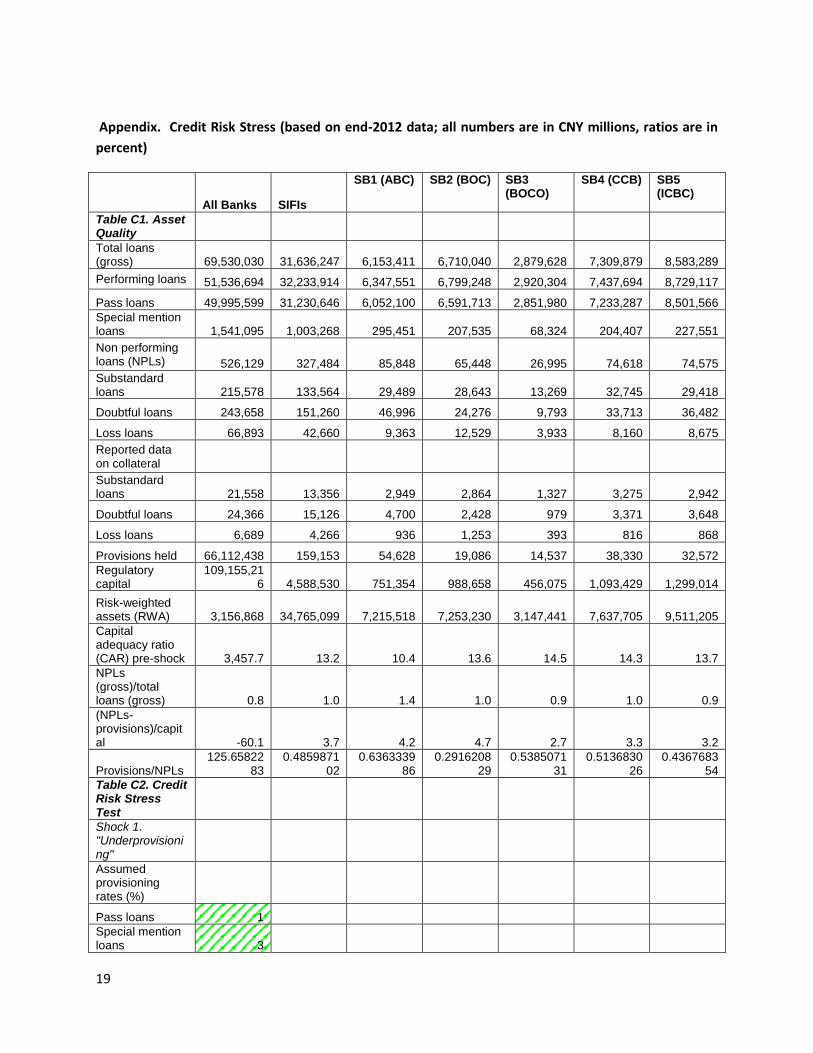
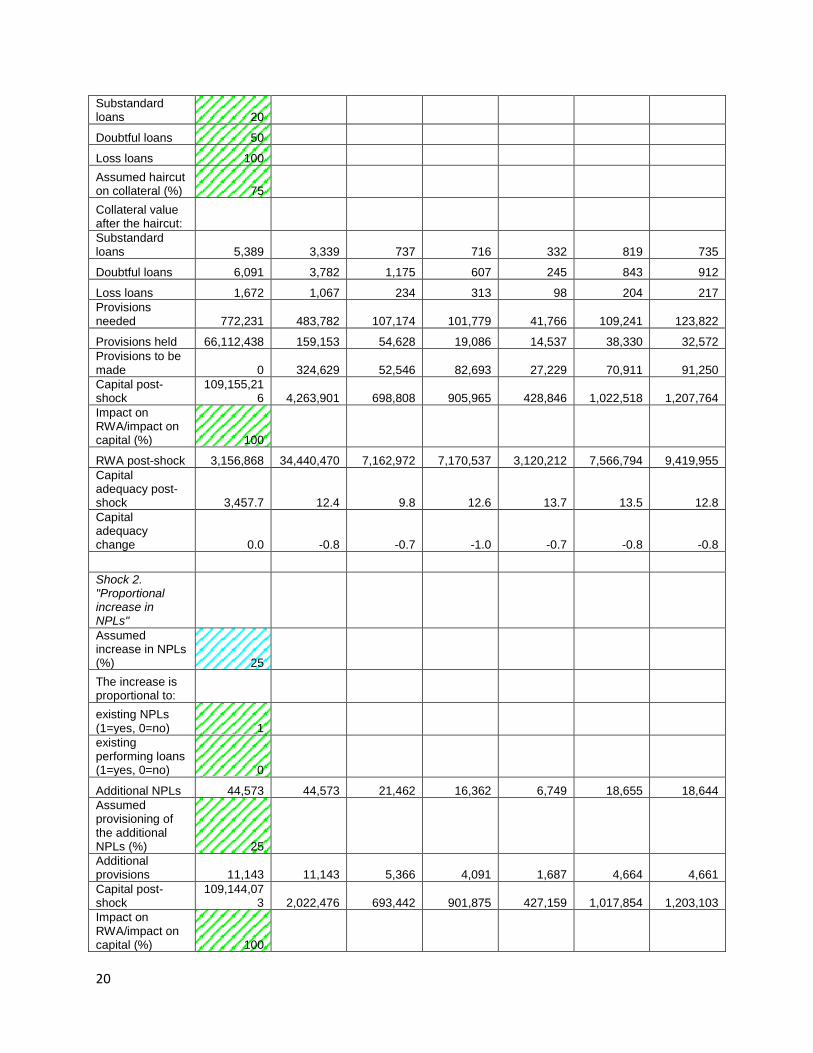
In the solvency stress test, we assume that some individuals and firms are suddenly unable to
repay their loans. The loans therefore become nonperforming loans. If we assume that the
shock produces a proportional rise in non-performing loans (NPLs) of about 25%, the result is
that provisions to NPL ratios decline across SIFIs by about 7%. Loan loss provisions start to
become depleted. This is particularly of concern where there are a relatively large number of
existing NPLs relative to the capital base, as in the Agricultural Bank of China.
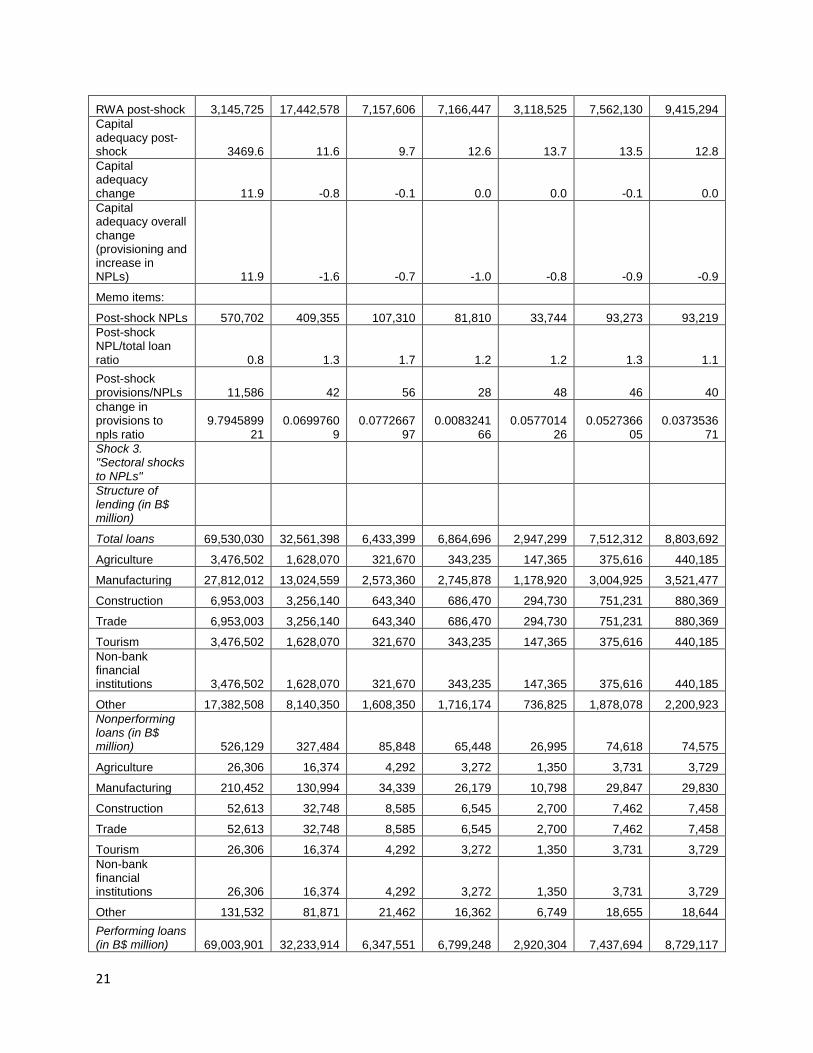
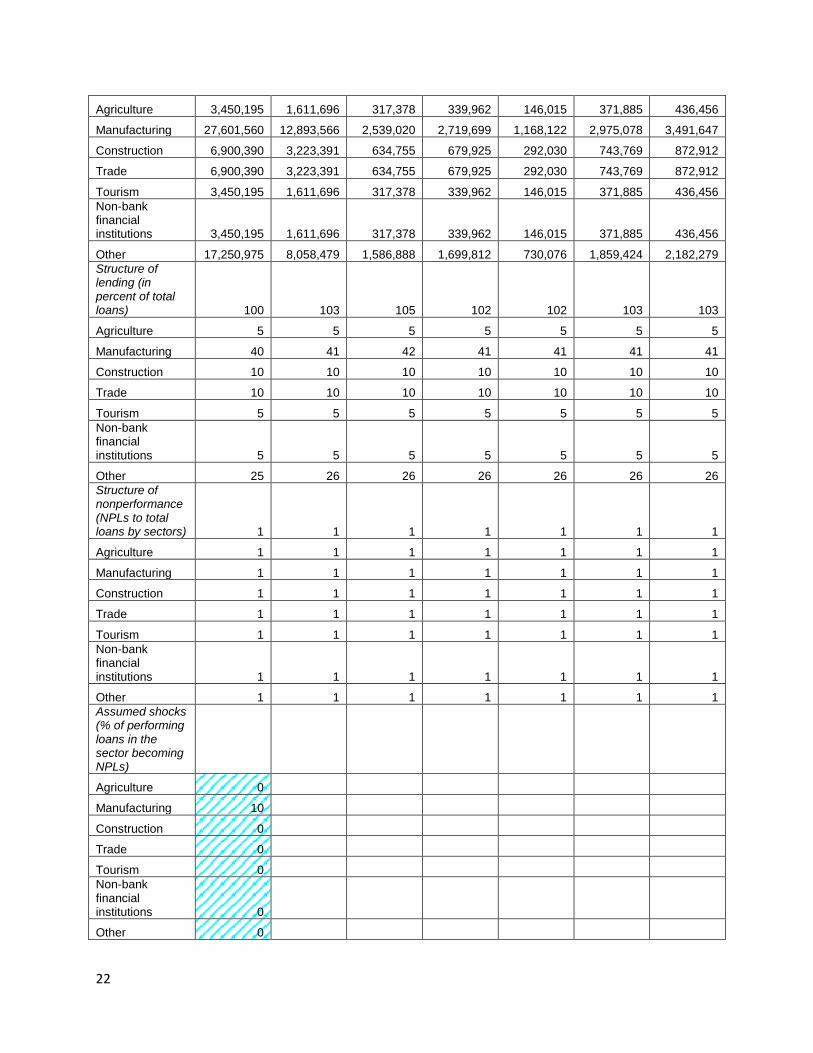
We also test for what might happen if entities in particular industries are unable to repay their
loans. If this solvency shock occurs in larger sectors, such as the manufacturing sector, and to a
somewhat lesser degree the construction and trade sectors, the rise in NPLs can become quite
large. Assuming a distribution of loans across industries proportionate to industrial
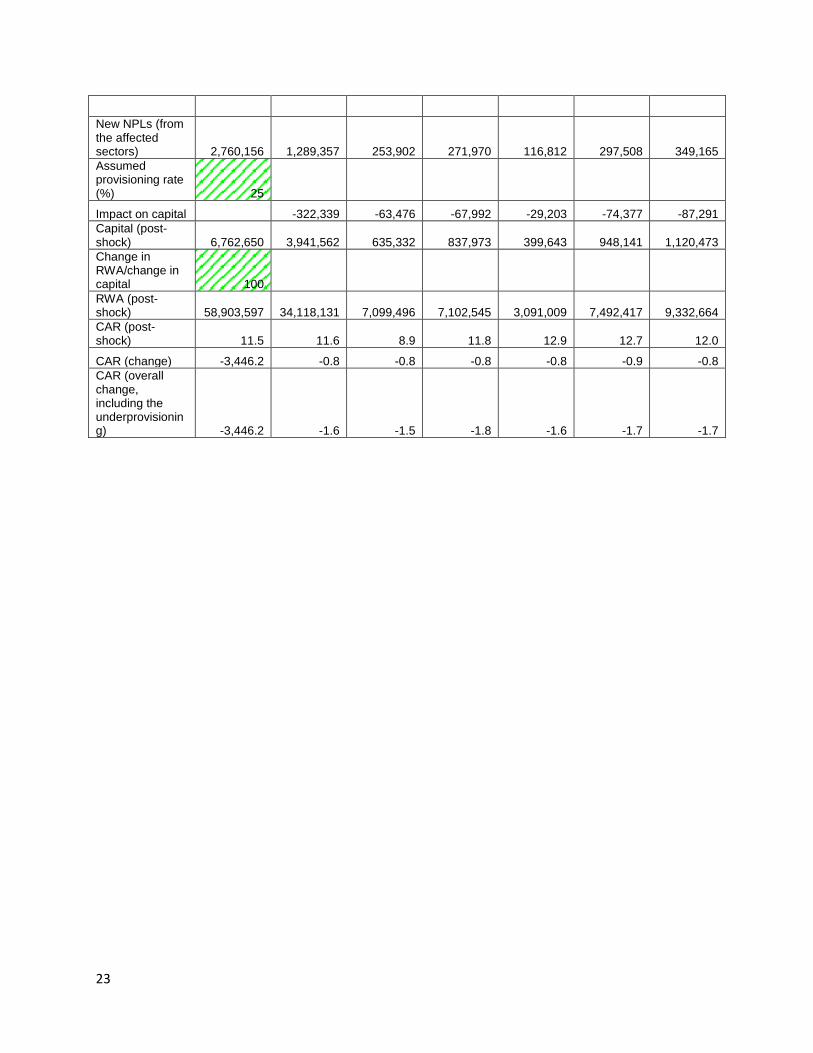
contribution to GDP, we find that a 10% increase in NPLs in the manufacturing sector would
lead to the creation of almost 3 trillion yuan in nonperforming loans. Capital would thus be
affected, as would risk weighted assets and the capital to asset ratios. This could present a real
threat to solvency. Results are shown in the Appendix.
China’s central bank runs its own stress tests and does not allow any foreign access to data. The
Financial Sector Assessment Program, run by the People’s Bank of China, confirms our findings
that the aggregate solvency position of insurers could be improved. FSAP does, however, find
that China’s financial sector has sufficient liquidity (World Bank 2011). Overall, four domestic
financial risks are pinpointed by FSAP: potentially negative impact of recent credit expansion on
bank asset quality, risks created by the rise of off balance sheet interlinkages, especially to the
informal financial sector, possible market risk created by high real estate and commodity asset
prices, and potential for exacerbation of imbalances in the current system.
Second, although we lack balance sheet data to run micro level liquidity tests, we can look at
indicators for the bank and trust sectors, as a whole and for the largest public corporations.
13
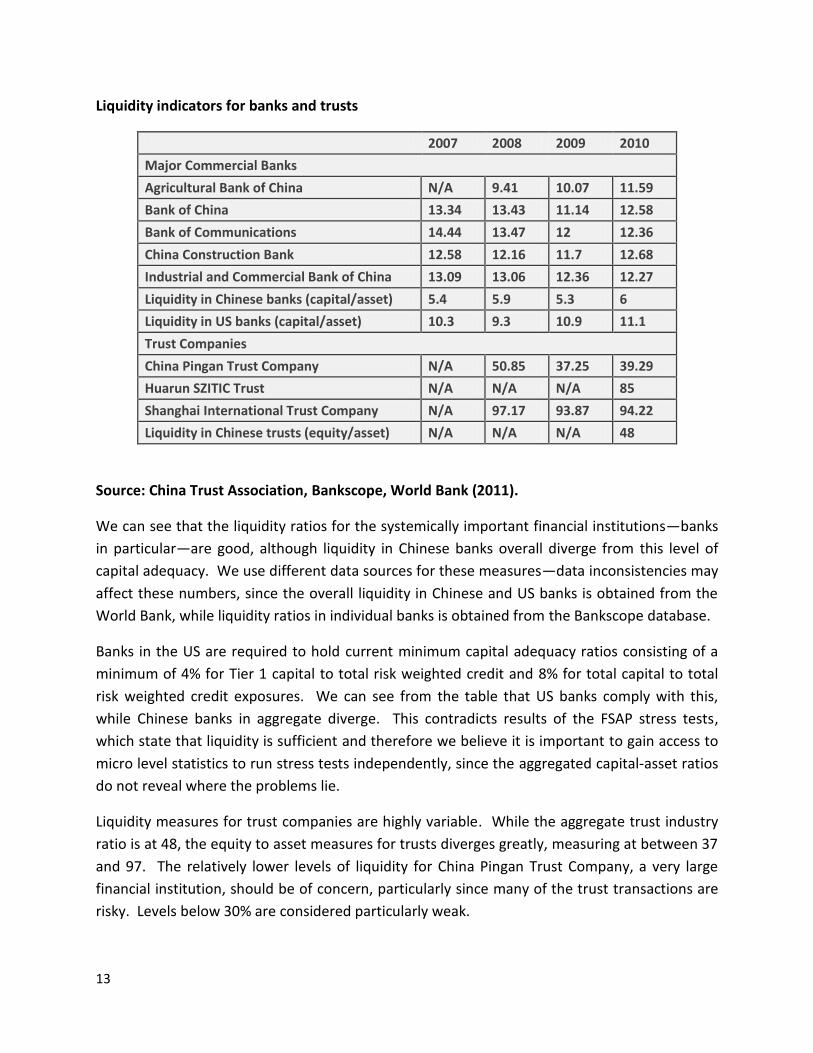
Liquidity indicators for banks and trusts
2007 2008 2009 2010
Major Commercial Banks
Agricultural Bank of China N/A 9.41 10.07 11.59
Bank of China 13.34 13.43 11.14 12.58
Bank of Communications 14.44 13.47 12 12.36
China Construction Bank 12.58 12.16 11.7 12.68
Industrial and Commercial Bank of China 13.09 13.06 12.36 12.27
Liquidity in Chinese banks (capital/asset) 5.4 5.9 5.3 6
Liquidity in US banks (capital/asset) 10.3 9.3 10.9 11.1
Trust Companies
China Pingan Trust Company N/A 50.85 37.25 39.29
Huarun SZITIC Trust N/A N/A N/A 85
Shanghai International Trust Company N/A 97.17 93.87 94.22
Liquidity in Chinese trusts (equity/asset) N/A N/A N/A 48
Source: China Trust Association, Bankscope, World Bank (2011).
We can see that the liquidity ratios for the systemically important financial institutions—banks
in particular—are good, although liquidity in Chinese banks overall diverge from this level of
capital adequacy. We use different data sources for these measures—data inconsistencies may
affect these numbers, since the overall liquidity in Chinese and US banks is obtained from the
World Bank, while liquidity ratios in individual banks is obtained from the Bankscope database.
Banks in the US are required to hold current minimum capital adequacy ratios consisting of a
minimum of 4% for Tier 1 capital to total risk weighted credit and 8% for total capital to total
risk weighted credit exposures. We can see from the table that US banks comply with this,
while Chinese banks in aggregate diverge. This contradicts results of the FSAP stress tests,
which state that liquidity is sufficient and therefore we believe it is important to gain access to
micro level statistics to run stress tests independently, since the aggregated capital-asset ratios
do not reveal where the problems lie.
Liquidity measures for trust companies are highly variable. While the aggregate trust industry
ratio is at 48, the equity to asset measures for trusts diverges greatly, measuring at between 37
and 97. The relatively lower levels of liquidity for China Pingan Trust Company, a very large
financial institution, should be of concern, particularly since many of the trust transactions are
risky. Levels below 30% are considered particularly weak.
14
Policy Recommendations
From our stress tests, we can conclude that the solvency position of SIFIs should be improved.
This is something that is widely recognized; non-performing loans have presented a problem to
the banking sector since the 1980s, and the tight connection between the banking sector the
state has perpetuated the problem. Clearly, non-performing loans present solvency and credit
risks, particularly if government backing becomes an issue. As it has in the past, the Agricultural
Bank of China continues to require special attention in this area.
Liquidity appears to be adequate for the SIFIs but inadequate for the banking sector as a whole.
Although the central government may stand by ready to inject funds into the banking sector
where needed, it would be more efficient to ensure that banks are liquid before a credit crunch
ensues, particularly since it may be more difficult to identify flagging banks in a crisis if they are
spread throughout the system and not concentrated in the SIFIs. Access to more detailed data
on the liquidity composition of asset holdings would allow those external to the banking system
to run stress tests on banks that go beyond examination of indicators.
In terms of more general policy recommendations, since we write at the nascent stages of
growth in China’s shadow banking system, we can say that the shadow banking system,
excluding informal finance, is small relative to the rest of China’s financial system according to
the size of total assets, but its credit scale (net financing) is larger than that of commercial bank
loans. In the aggregate, bank loans occupied 48.8% of China’s financing of the economy at the
end of Quarter 3 of 2012, down from 53% in 2010 (People’s Bank of China 2012). Looking at the
scale of financing, the size of the shadow banking system has exceeded that of the commercial
banking system. That means shadow banking system is impacting the monetary policy transfer
mechanism and regulatory performance.
China’s regulatory bodies are attempting to respond to the explosion in shadow banking
products over the past decade. A continuing expansion in shadow financing can quickly foment
risk, and this is of great concern. Because of this, ongoing monitoring of the shadow banking
system must be carried out. China’s financial economy is innovative and fast-paced, and
monitoring will require close connection to the shadow financial sector.14
14
A small but growing market to watch is the hedge funds market. China has also recently allowed hedge funds to
raise funds in China and invest domestically (only for domestic hedge funds) or overseas. The first hedge fund in
China was Junxiang lianghua, issued by Guotai Junan Securities Assets Management CO.,Ltd and set up on March 7,
2011 (Zhou 2011). Issuers of hedge funds include security traders, private equity funds, and public funds. Product
design and market regulation have been developing slowly, mainly due to regulatory and financial restrictions.
There are a limited number of derivatives to invest in, as well as restrictions on speculative activity (Money 163
2012).
15
With the rapid development of the shadow banking system in China, financial disintermediation
has rapidly increased, potentially causing financial fragility and financial instability. Shadow
banking institutions innovate many new products every day, but these products are not
necessarily monitored by regulatory sectors effectively. The risks of shadow banking system are
increasing under the background of the global economic downturn. Government guarantees to
some public bonds and publicly owned banks and other financial institutions may intensify
moral hazard which would cause systematic risk. So it is necessary to build up a new financial
regulatory system to adapt to the development of the shadow banking system. The financial
regulatory system must change the model of supervision from institutional regulatation to
business monitoring in order to create a unified financial supervision framework. Business risk
control is at the core of the regulatory system.
It is also important to push forward reform of interest rate marketization of the banking system
and to develop the monetary market and build a multi-level capital market. This would allow
investors more opportunity to receive returns on their money, so that they refrain from seeking
out shadowy investments. The bond market is the best channel for risk pricing in loan rate
marketization, but China’s corporate bond market and middle and long term national bond
markets are still relatively small. Interest rate pricing that reflects market risk would help
investors in the shadow banking system to monitor their own risk levels
16
References.
1. Acharya, Viral V. and Tanju Yorulmazer. 2003. Information Contagion and Inter-Bank
Correlation in a Theory of Systemic Risk. CEPR Discussion Paper 3743.
2. Anderlini, Jamil. 2010. China Ushers in Credit Default Swaps. Financial Times,
November 6.
3. Atiya, Amir F. 2001. Bankruptcy Prediction for Credit Risk Using Neural Networks: A
Survey and New Results. IEEE TRANSACTIONS ON NEURAL NETWORKS, VOL. 12, NO. 4,
JULY 2001. 929-935.
4. Brehm, Stefan. 2008. Risk Management in China’s State Banks – International Best
Practice and the Political Economy of Regulation. Business and Politics 10(1): 1-29.
5. Brunnermeier, Markus K. 2010. Bubbles, Liquidity, and the Macroecnomy. NBER
Reporter.
6. China Business News. 2011. China Banking Regulatory Commission Requires Four Trust
Companies to Suspend REIT Operations. China Business News, October 20.
7. Chiu, Yung-Ho, Yu-Chuan Chen and Yu Han Hung. 2009. Basel II and Bank Bankruptcy
Analysis. Applied Economics Letters, 16, 1843–1847.
8. Cifuentes, Rodrigo, Gianluigi Ferrucci, and Hyun Song Shin. 2005. Liquidity Risk and
Contagion. Journal of the European Economic Association, Papers and Proceedings
of the Nineteenth Annual Congress of the European Economic Association 3(2/3):
556-566
9. Čihák, Martin. 2007. Introduction to Applied Stress Testing. IMF Working Paper
WP/07/59.
10. Cookson, Robert. 2011. Investors Warned of Chinese Bond Risks. Financial Times, July
20.
11. Diamond, Douglas W. and Philip H. Dybvig. 1983. Bank Runs, Deposit Insurance, and
Liquidity. The Journal of Political Economy, 91(3): 401-419.
12. Diamond, Douglas W. and Raghuram G. Rajan. 2001. Journal of Political Economy,
109(2): 287-327.
13. Forsythe, Michael and Henry Sanderson. 2011. China Debts Dwarf Official Data With
Too-Big-To-Finish Alarm. Bloomber, December 18.
14. Freixas -Liquidity Provision by the Central Bank”, Journal of Money Credit and Banking,
No. 32(3) , Part 2, pp. 611-38.
15. Furfine, C. H. (2003), “Interbank Exposures: Quantifying the Risk of Contagion”, Journal
of Money, Credit and Banking, No 35(1), pp.111-28.
16. Gai, Prasanna, Andrew Haldane, and Sujit Kapadia. 2011. Complexity, Concentration,
and Contagion. Journal of Monetary Economics 58(5): 453–470.
17. Huang, Yiping, Chang Jian and Linxiu Yang. 2012. “China’s Shadow Banking be Another
Sub-prime Debt?”, International Economic Review, 2, pp. 42-52.
17
18. Lelyveld, Iman van and Franka Liedorp. 2006. Interbank Contagion in the Dutch Banking
Sector: A Sensitivity Analysis. International Journal of Central Banking 2(2): 99-133.
19. Li, Jianjun and Sara Hsu. 2009. Informal Finance in China: American and Chinese
Perspectives. New York: Oxford University Press.
20. Lintner, John (1965). The valuation of risk assets and the selection of risky investments
in stock portfolios and capital budgets, Review of Economics and Statistics, 47 (1), 13-37.
21. Liu, Wei. 2012. “REITs Risk are Concentrated”, Beijing Business Today, May 21: 007
22. Markose, Sheri, Simone Giansante, and Ali Rais Shaghaghi, 2012.`Too interconnected to
fail' financial network of US CDS market: Topological fragility and systemic risk. Journal
of Economic Behavior & Organization, 83 (3), 627–646.
23. Money 163. 2012. The Era of Hedge Fund is Beginning & Several Strategies Used by
China’s Hedge Fund, http://money.163.com/12/0210/16/7PTPC7KK00253B0H.html.
(02/10/2012)
24. Mossin, Jan. (1966). Equilibrium in a Capital Asset Market, Econometrica, Vol. 34, No. 4,
pp. 768–783.
25. People’s Bank of China. 2012. Aggregate Financing of the Economy.
http://www.pbc.gov.cn/publish/html/2012s18.xls
26. Podobnik, Boris, Davor Horvatic, Alexander M. Petersen, Branko Urošević and H.Eugene Stanley.
2010. Bankruptcy Risk Model and Empirical Tests. Proceedings of the National Academy of
Sciences of the United States of America, 107(43): 18325-18330.
27. Purnanandam, Amiyatosh. 2008. Financial Distress and Corporate Risk Management: Theory
and Evidence. Journal of Financial Economics 87: 706–739.
28. Qin, Liping. 2012. “Investigation on Potential Risk Among Financial Guarantee
Companies Stars, Guarantee Industry Faced With Reshuffle”, China Business News, June
20: A10
29. Reuters. 2012. New Investment Products in China Raise Fears of Collapse. The New
York Times. August 7.
30. Schonbucher, Philipp J. 2003. Information-Driven Default Contagion. Paper presented
at the CREDIT 2003 Conference in Venice, the J.P.Morgan Credit Derivatives Research
31. Group in London, Risk Day 2003 at ETH ZÄurich, and QMF 2003 in Sydney.
32. Sheldon, G. and Maurer, M. (1998): “Interbank Lending and Systemic Risk: An Empirical
Analysis for Switzerland”, Swiss Journal of Economics and Statistics, 134 (4.2), 257-77
33. Upper, C. (2007): “Using Counterfactual Simulations to Assess the Danger of Contagion
in Interbank Markets”, BIS Working Paper No. 234, Basel.
34. Vaghela, Viren. 2012. CDS, China-style. AsiaRisk, March: 18-21.
35. White, Lawrence. 2010. Credit Derivatives: China Begins Cautious Experiments with
CDS. Euromoney, December.
36. Wang, Pan, Yiying Shang and Jianqiang Lai. 2012. “ Folk Lending: Transforming with
Obvious Risk Transmission ”, Economic Information Daily, May 7: 006
18
37. Wells, S. (2004): “Financial Interlinkages in the United Kingdom’s Interbank Market and
the Risk of Contagion”, Bank of England, Working Paper No. 230.
38. World Bank. 2011. Financial Sector Assessment Program Report for China. World Bank
Publication.
39. Xinhua. 2012. About 50 REITs Faced with Early Redemption within 2012, Stress from
Payment Increases, Xinhua September 6.
40. Xu, Xiaotian. 2012. “Individual Real Estate Trust Products Postponed Clearing, While
Systematic Risk Is Still Under Control”, Security Daily, May 29: C03
41. Yang, Na and Yuan Ma. 2012. Fool’s Gold Behind Beijing Loan Guarantees. Caixin,
March 20.
42. Yicai. 2012. Total Assets Held by Financial Lease Industry Has Exceeded 500 Billion Yuan,
http://www.yicai.com/news/2012/02/1400599.html, February 3.
43. Yildirak, Kasirga and Cumhur Ekinci. 2013. A Review of Market Risk Measures and
Computation Techniques. Chapter 17 in Rethinking Valuation and Pricing Models:
Lessons Learned from the Crisis and Future Challenges. Eds. Carsten Wehn, Christian
Hoppe and Greg N. Gregoriou. Elsevier.
44. Yu, Gang. 2012. “Four Kinds of Risk Transmitted from Folk Lending to Banking System”,
China Finance, 14, pp. 68-69
45. Zhang, Yuzhe, Bing Zhang, Hu Shen, Xiu Wen, and Fei Zheng. 2012. Domino Risk Grips
Zhejiang Bankers, Borrowers. Caixin. June 26.
46. Zhou, Zifan. 2011. Current Situation of Hedge Fund In China And Analysis On Its
Regulation. Theory Horizon, 9: 55-57.
19
Appendix. Credit Risk Stress (based on end-2012 data; all numbers are in CNY millions, ratios are in
percent)
All Banks SIFIs
SB1 (ABC) SB2 (BOC) SB3 (BOCO)
SB4 (CCB) SB5 (ICBC)
Table C1. Asset Quality
Total loans (gross) 69,530,030 31,636,247 6,153,411 6,710,040 2,879,628 7,309,879 8,583,289
Performing loans 51,536,694 32,233,914 6,347,551 6,799,248 2,920,304 7,437,694 8,729,117
Pass loans 49,995,599 31,230,646 6,052,100 6,591,713 2,851,980 7,233,287 8,501,566
Special mention loans 1,541,095 1,003,268 295,451 207,535 68,324 204,407 227,551
Non performing loans (NPLs) 526,129 327,484 85,848 65,448 26,995 74,618 74,575
Substandard loans 215,578 133,564 29,489 28,643 13,269 32,745 29,418
Doubtful loans 243,658 151,260 46,996 24,276 9,793 33,713 36,482
Loss loans 66,893 42,660 9,363 12,529 3,933 8,160 8,675
Reported data on collateral
Substandard loans 21,558 13,356 2,949 2,864 1,327 3,275 2,942
Doubtful loans 24,366 15,126 4,700 2,428 979 3,371 3,648
Loss loans 6,689 4,266 936 1,253 393 816 868
Provisions held 66,112,438 159,153 54,628 19,086 14,537 38,330 32,572
Regulatory capital
109,155,216 4,588,530 751,354 988,658 456,075 1,093,429 1,299,014
Risk-weighted assets (RWA) 3,156,868 34,765,099 7,215,518 7,253,230 3,147,441 7,637,705 9,511,205
Capital adequacy ratio (CAR) pre-shock 3,457.7 13.2 10.4 13.6 14.5 14.3 13.7
NPLs (gross)/total loans (gross) 0.8 1.0 1.4 1.0 0.9 1.0 0.9
(NPLs-provisions)/capital -60.1 3.7 4.2 4.7 2.7 3.3 3.2
Provisions/NPLs 125.65822
83 0.4859871
02 0.6363339
86 0.2916208
29 0.5385071
31 0.5136830
26 0.4367683
54
Table C2. Credit Risk Stress Test
Shock 1. "Underprovisioning"
Assumed provisioning rates (%)
Pass loans 1
Special mention loans 3
20
Substandard loans 20
Doubtful loans 50
Loss loans 100
Assumed haircut on collateral (%) 75
Collateral value after the haircut:
Substandard loans 5,389 3,339 737 716 332 819 735
Doubtful loans 6,091 3,782 1,175 607 245 843 912
Loss loans 1,672 1,067 234 313 98 204 217
Provisions needed 772,231 483,782 107,174 101,779 41,766 109,241 123,822
Provisions held 66,112,438 159,153 54,628 19,086 14,537 38,330 32,572
Provisions to be made 0 324,629 52,546 82,693 27,229 70,911 91,250
Capital post-shock
109,155,216 4,263,901 698,808 905,965 428,846 1,022,518 1,207,764
Impact on RWA/impact on capital (%) 100
RWA post-shock 3,156,868 34,440,470 7,162,972 7,170,537 3,120,212 7,566,794 9,419,955
Capital adequacy post-shock 3,457.7 12.4 9.8 12.6 13.7 13.5 12.8
Capital adequacy change 0.0 -0.8 -0.7 -1.0 -0.7 -0.8 -0.8
Shock 2. "Proportional increase in NPLs"
Assumed increase in NPLs (%) 25
The increase is proportional to:
existing NPLs (1=yes, 0=no) 1
existing performing loans (1=yes, 0=no) 0
Additional NPLs 44,573 44,573 21,462 16,362 6,749 18,655 18,644
Assumed provisioning of the additional NPLs (%) 25
Additional provisions 11,143 11,143 5,366 4,091 1,687 4,664 4,661
Capital post-shock
109,144,073 2,022,476 693,442 901,875 427,159 1,017,854 1,203,103
Impact on RWA/impact on capital (%) 100
21
RWA post-shock 3,145,725 17,442,578 7,157,606 7,166,447 3,118,525 7,562,130 9,415,294
Capital adequacy post-shock 3469.6 11.6 9.7 12.6 13.7 13.5 12.8
Capital adequacy change 11.9 -0.8 -0.1 0.0 0.0 -0.1 0.0
Capital adequacy overall change (provisioning and increase in NPLs) 11.9 -1.6 -0.7 -1.0 -0.8 -0.9 -0.9
Memo items:
Post-shock NPLs 570,702 409,355 107,310 81,810 33,744 93,273 93,219
Post-shock NPL/total loan ratio 0.8 1.3 1.7 1.2 1.2 1.3 1.1
Post-shock provisions/NPLs 11,586 42 56 28 48 46 40
change in provisions to npls ratio
9.794589921
0.06997609
0.077266797
0.008324166
0.057701426
0.052736605
0.037353671
Shock 3. "Sectoral shocks to NPLs"
Structure of lending (in B$ million)
Total loans 69,530,030 32,561,398 6,433,399 6,864,696 2,947,299 7,512,312 8,803,692
Agriculture 3,476,502 1,628,070 321,670 343,235 147,365 375,616 440,185
Manufacturing 27,812,012 13,024,559 2,573,360 2,745,878 1,178,920 3,004,925 3,521,477
Construction 6,953,003 3,256,140 643,340 686,470 294,730 751,231 880,369
Trade 6,953,003 3,256,140 643,340 686,470 294,730 751,231 880,369
Tourism 3,476,502 1,628,070 321,670 343,235 147,365 375,616 440,185
Non-bank financial institutions 3,476,502 1,628,070 321,670 343,235 147,365 375,616 440,185
Other 17,382,508 8,140,350 1,608,350 1,716,174 736,825 1,878,078 2,200,923
Nonperforming loans (in B$ million) 526,129 327,484 85,848 65,448 26,995 74,618 74,575
Agriculture 26,306 16,374 4,292 3,272 1,350 3,731 3,729
Manufacturing 210,452 130,994 34,339 26,179 10,798 29,847 29,830
Construction 52,613 32,748 8,585 6,545 2,700 7,462 7,458
Trade 52,613 32,748 8,585 6,545 2,700 7,462 7,458
Tourism 26,306 16,374 4,292 3,272 1,350 3,731 3,729
Non-bank financial institutions 26,306 16,374 4,292 3,272 1,350 3,731 3,729
Other 131,532 81,871 21,462 16,362 6,749 18,655 18,644
Performing loans (in B$ million) 69,003,901 32,233,914 6,347,551 6,799,248 2,920,304 7,437,694 8,729,117
22
Agriculture 3,450,195 1,611,696 317,378 339,962 146,015 371,885 436,456
Manufacturing 27,601,560 12,893,566 2,539,020 2,719,699 1,168,122 2,975,078 3,491,647
Construction 6,900,390 3,223,391 634,755 679,925 292,030 743,769 872,912
Trade 6,900,390 3,223,391 634,755 679,925 292,030 743,769 872,912
Tourism 3,450,195 1,611,696 317,378 339,962 146,015 371,885 436,456
Non-bank financial institutions 3,450,195 1,611,696 317,378 339,962 146,015 371,885 436,456
Other 17,250,975 8,058,479 1,586,888 1,699,812 730,076 1,859,424 2,182,279
Structure of lending (in percent of total loans) 100 103 105 102 102 103 103
Agriculture 5 5 5 5 5 5 5
Manufacturing 40 41 42 41 41 41 41
Construction 10 10 10 10 10 10 10
Trade 10 10 10 10 10 10 10
Tourism 5 5 5 5 5 5 5
Non-bank financial institutions 5 5 5 5 5 5 5
Other 25 26 26 26 26 26 26
Structure of nonperformance (NPLs to total loans by sectors) 1 1 1 1 1 1 1
Agriculture 1 1 1 1 1 1 1
Manufacturing 1 1 1 1 1 1 1
Construction 1 1 1 1 1 1 1
Trade 1 1 1 1 1 1 1
Tourism 1 1 1 1 1 1 1
Non-bank financial institutions 1 1 1 1 1 1 1
Other 1 1 1 1 1 1 1
Assumed shocks (% of performing loans in the sector becoming NPLs)
Agriculture 0
Manufacturing 10
Construction 0
Trade 0
Tourism 0
Non-bank financial institutions 0
Other 0
23
New NPLs (from the affected sectors) 2,760,156 1,289,357 253,902 271,970 116,812 297,508 349,165
Assumed provisioning rate (%) 25
Impact on capital
-322,339 -63,476 -67,992 -29,203 -74,377 -87,291
Capital (post-shock) 6,762,650 3,941,562 635,332 837,973 399,643 948,141 1,120,473
Change in RWA/change in capital 100
RWA (post-shock) 58,903,597 34,118,131 7,099,496 7,102,545 3,091,009 7,492,417 9,332,664
CAR (post-shock) 11.5 11.6 8.9 11.8 12.9 12.7 12.0
CAR (change) -3,446.2 -0.8 -0.8 -0.8 -0.8 -0.9 -0.8
CAR (overall change, including the underprovisioning) -3,446.2 -1.6 -1.5 -1.8 -1.6 -1.7 -1.7