session 5 documenting indicators using performance ... · documenting indicators using performance...
TRANSCRIPT
Session 5Documenting Indicators Using Performance Indicator Reference Sheets (PIRS)
Document Version Date: 2014-1-22
Performance Monitoring
Performance Indicators Reference Sheet – What is it?
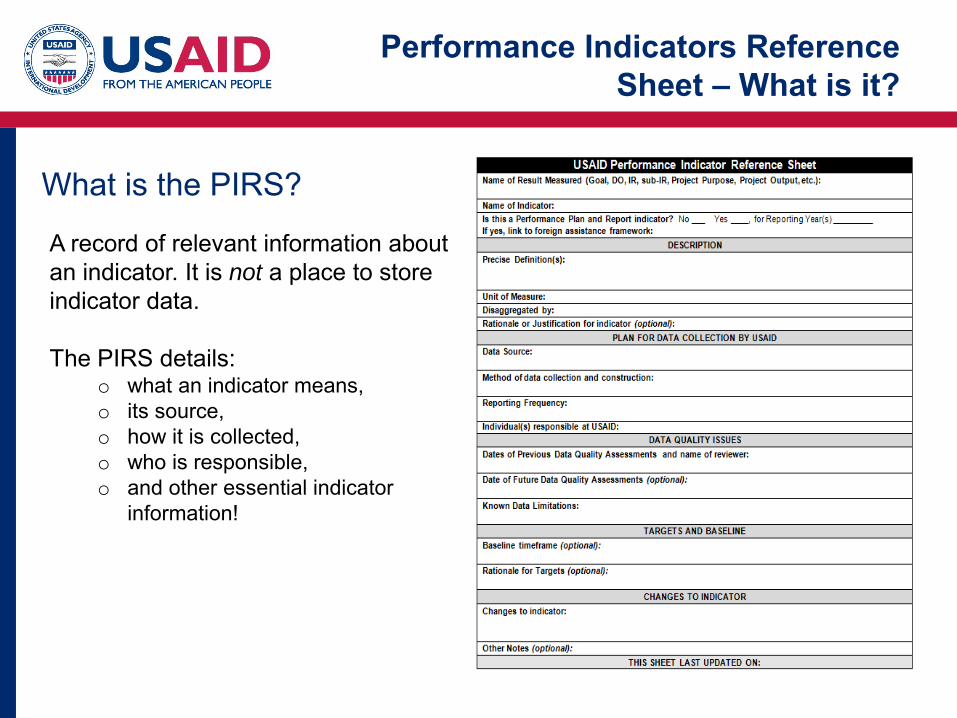
What is the PIRS?
A record of relevant information about an indicator. It is not a place to store indicator data.
The PIRS details:o what an indicator means, o its source, o how it is collected,o who is responsible, o and other essential indicator
information!
Session Objective
By the end of this session, participants should be:
• Familiar with the friendly Performance Indicator Reference Sheet and its value and uses
Why fill out the PIRS?
• Clarity in indicator definition, methodology, responsibilities
• Consistency in data collection
• Transparency in decision-making around indicator selection and indicator changes
• Collaboration between USAID and partners to collect the data we want and need
• Higher quality data!
PIRS are fundamental to our ability to do good performance
monitoring!
Exercise20 minutes in small groups
Review the PIRS given to your group. In the blank PIRS template, document any improvements you
would make to the PIRS.
Be prepared to report out on the top 2 PIRS
improvements your group would make!
Performance Indicators Reference Sheet – Filling it out
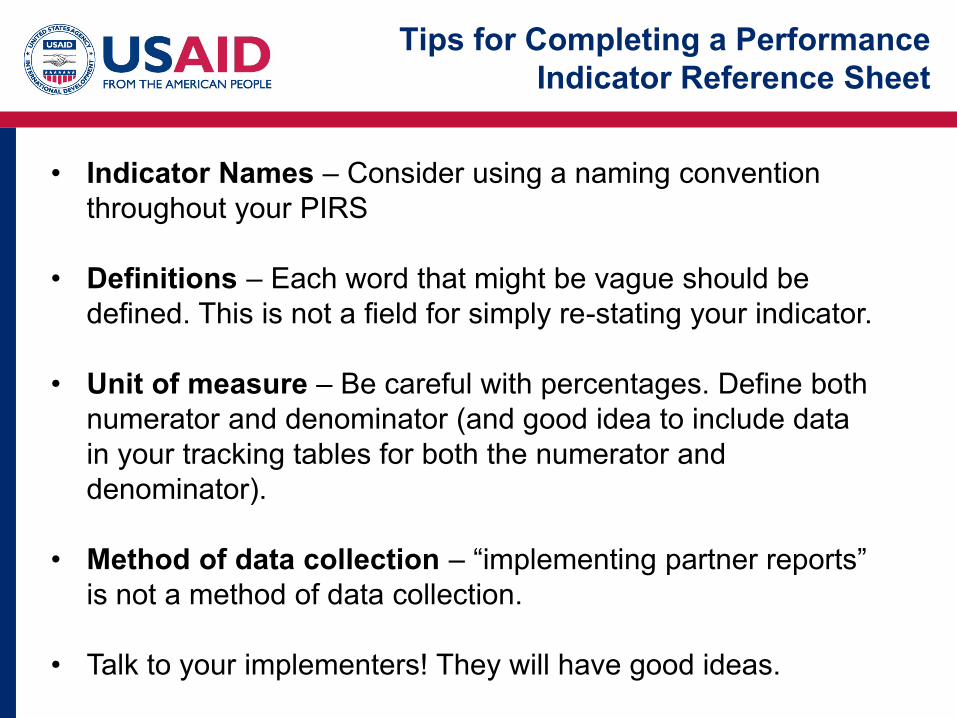
Tips for Completing a Performance Indicator Reference Sheet
• Indicator Names – Consider using a naming convention throughout your PIRS
• Definitions – Each word that might be vague should be defined. This is not a field for simply re-stating your indicator.
• Unit of measure – Be careful with percentages. Define both numerator and denominator (and good idea to include data in your tracking tables for both the numerator and denominator).
• Method of data collection – “implementing partner reports” is not a method of data collection.
• Talk to your implementers! They will have good ideas.
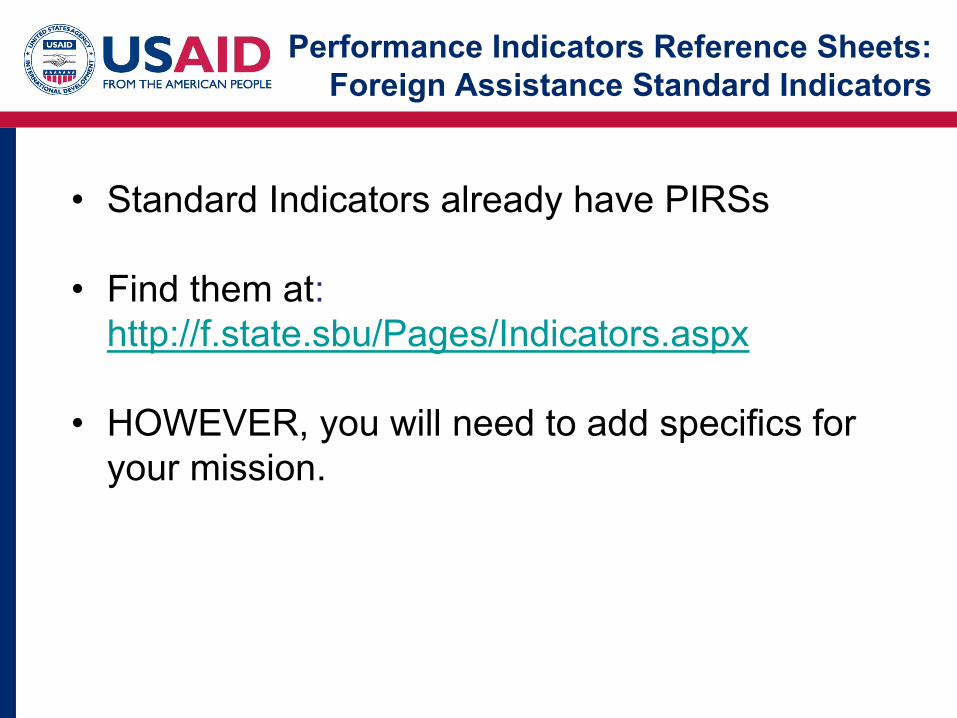
Performance Indicators Reference Sheets: Foreign Assistance Standard Indicators
• Standard Indicators already have PIRSs
• Find them at: http://f.state.sbu/Pages/Indicators.aspx
• HOWEVER, you will need to add specifics for your mission.
Setting Baselines for Performance Indicators
What is a baseline?
• First measurement of an indicator
• Conducted prior to delivery of project outputs
• Include baseline timeframe in the PIRS
• Uses the same measurement method and data source that will be throughout the life of the CDCS/Project, as specified in your PIRS
• Baselines also needed for disaggregations
Setting Baselines for Performance Indicators
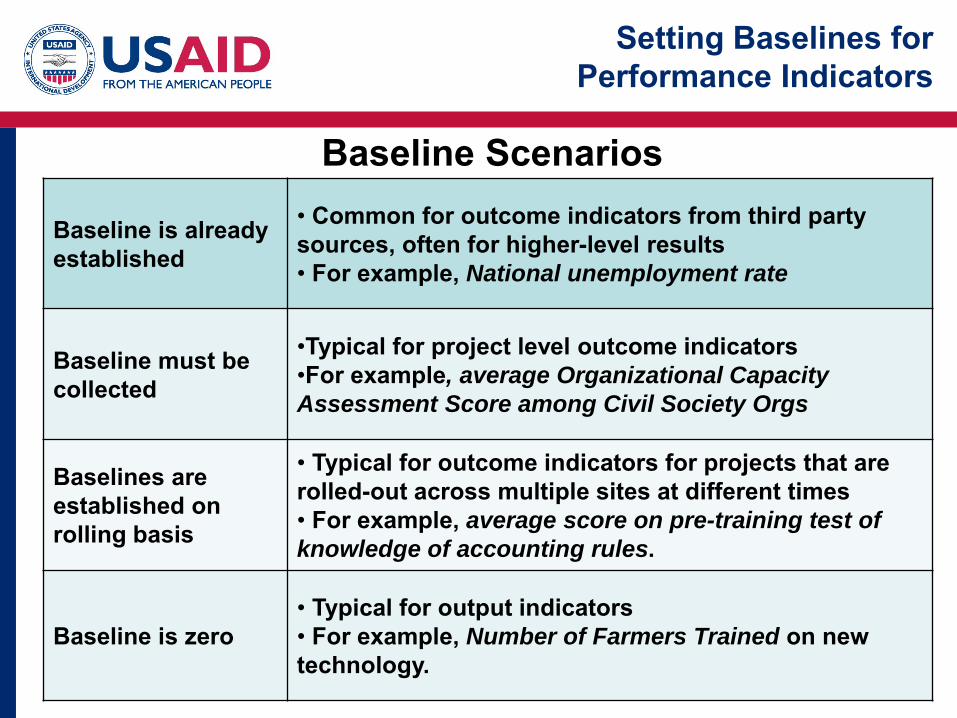
Baseline is already established
• Common for outcome indicators from third party sources, often for higher-level results• For example, National unemployment rate
Baseline must be collected
•Typical for project level outcome indicators•For example, average Organizational Capacity
Assessment Score among Civil Society Orgs
Baselines are established on rolling basis
• Typical for outcome indicators for projects that are rolled-out across multiple sites at different times• For example, average score on pre-training test of
knowledge of accounting rules.
Baseline is zero• Typical for output indicators• For example, Number of Farmers Trained on new technology.
Baseline Scenarios
Setting Targets for Performance Indicators
A target is the specific, planned level of result to be achieved within an explicit timeframe with a given level of resources. (ADS 203.3.9)
• Ambitious yet achievable (consider resources)
• Quantity, quality, time5% increase in primary school graduation rate in 3 years
• Document the rationale behind your targets
• Required for performance indicators, but not context
indicators
Setting Targets for Performance Indicators
Factors to consider when setting targets include:
• Historical trends
• Expert judgments
• Research findings
• Assessments
• Achievements of similar
programs
• Resource levels
• Stakeholder expectations
• Life cycle of the project
• Implementation approach
• Critical assumptions/risks
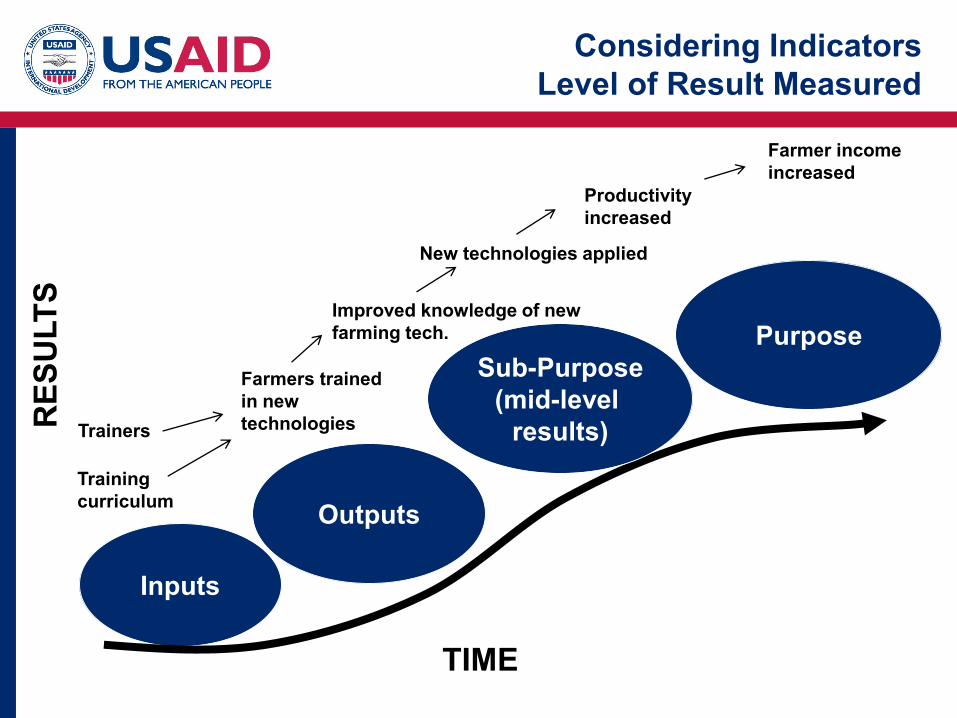
Considering IndicatorsLevel of Result Measured
Inputs
Outputs
TIME
Sub-Purpose(mid-level
results)
Purpose
Farmer income increased
New technologies applied
Farmers trained in new technologiesTrainers
Training curriculum
Improved knowledge of new farming tech.
Productivity increased
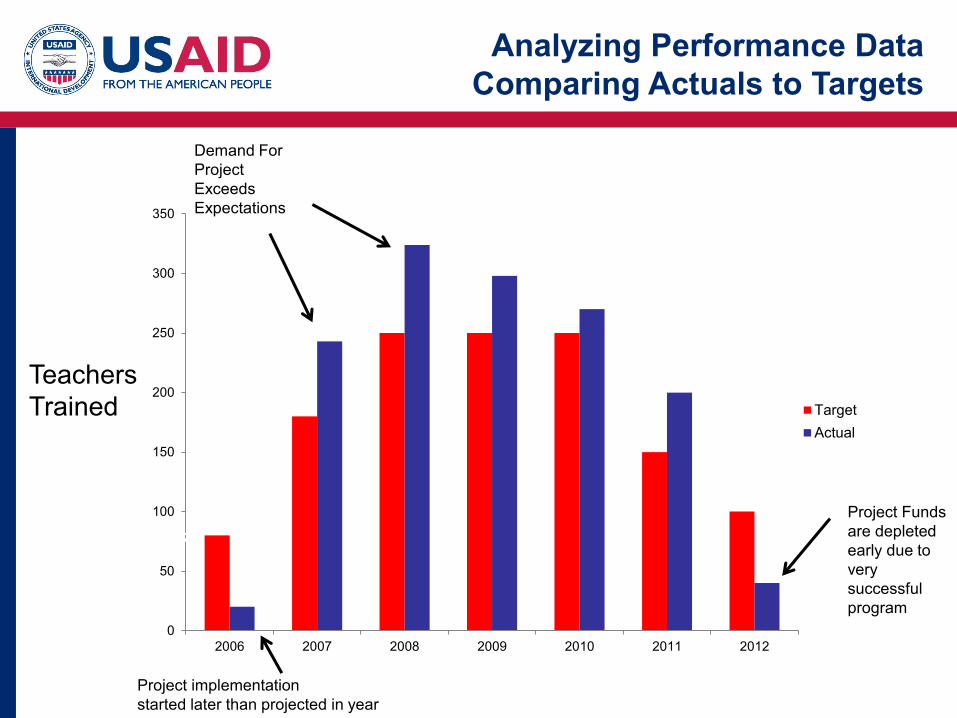
0
50
100
150
200
250
300
350
2006 2007 2008 2009 2010 2011 2012
TargetActual
Program expected to wined down
TeachersTrained
Low target for program ramp-up
Project implementationstarted later than projected in year
Demand For Project Exceeds Expectations
Project Funds are depleted early due to very successful program
Analyzing Performance DataComparing Actuals to Targets
Discussion
How can you use the PIRS to ensure that indicator data is collected
consistently and accurately across implementers?
…So What’s Next?
Session 6: Performance Indicator Tracking Tables and Systems