serbia: assessment of financing needs of smes in the ...purchasing power p arity . rsd ... with a...
TRANSCRIPT

Serbia Assessment of financing needs of SMEs
in the Western Balkans countriesAugust 2016


August 2016
BFC Max-Högger-Strasse 6 Phone: +41 44 784 22 22 [email protected] CH-8048 Zurich, Switzerland Fax: +41 44 784 23 23 www.bfconsulting.com
Assessment of financing needs of SMEs in the Western Balkans countries
Country report: Serbia

Acknowledgements We would like to acknowledge the support of BFC – Business and Financing Consulting for all their work in conducting the country scoping missions and reports. Without their work, this study would not have been possible. We would also like to thank all of those who participated in interviews, including regula-tors, donors, providers and other stakeholders across the all involved countries. Finally, the European Investment Bank and Western Balkans Enterprise Development and Innovation Facility (EDIF) would like to extend special thanks to the authors; Peter Hauser, Tatyana Dolgaya, Sorin Revenko, Michael Kortenbusch and to the editors for their contributions; Luca Gattini and Dragan Soljan. This document has been produced with the financial support of Western Balkans Enterprise Develop-ment and Innovation Facility (EDIF), and managed by the European Investment Bank. BFC consultans EIB Editors Peter Hauser Luca Gattini Tatyana Dolgaya Dragan Soljan Sorin Revenko Michael Kortenbusch EIB’s Economics Department: The mission of the EIB’s Economics Department is to provide economic analyses and studies to support the Bank in its operations and in its positioning, strategy and policy. The Department, a team of 30 economists and assistants, is headed by Debora Revoltella, Director of Eco-nomics. Disclaimer The views expressed in this document are those of the authors and do not necessarily reflect the position of the European Investment Bank or its shareholders. The authors take full responsibility for the contents of this report. The opinions expressed do not necessarily reflect the view of the European Investment Bank.

Table of contents About this report ................................................................................................................... 5
1 Executive summary ......................................................................................................... 6 1.1 Macroeconomic environment .......................................................................................................6 1.2 Demand for SME finance ...............................................................................................................6 1.3 Supply of SME finance ...................................................................................................................6 1.4 Supply and demand gaps ..............................................................................................................6
2 Macroeconomic environment ......................................................................................... 8 2.1 Economic development and growth .............................................................................................8 2.2 The structure of the economy .......................................................................................................9 2.3 Inflation and asset prices...............................................................................................................9 2.4 Balance of payments .....................................................................................................................9 2.5 The fiscal and political situation ................................................................................................. 10
3 Demand analysis ........................................................................................................... 11 3.1 Size and growth of the segment ................................................................................................. 11 3.2 Characteristics of SMEs .............................................................................................................. 12 3.3 Performance ............................................................................................................................... 13 3.4 Institutional and regulatory issues ............................................................................................. 13 3.5 Innovation .................................................................................................................................. 15 3.6 Demand for finance .................................................................................................................... 16
4 Supply analysis ............................................................................................................. 19 4.1 Number and type of intermediaries ........................................................................................... 19 4.2 Type of funding instruments ...................................................................................................... 20 4.3 Characteristics of funding recipients .......................................................................................... 22 4.4 Institutional and regulatory issues ............................................................................................. 23 4.5 Funding of intermediaries .......................................................................................................... 23 4.6 Supply estimate .......................................................................................................................... 25
5 Gaps in private sector financing .................................................................................... 27 5.1 Gaps by instrument .................................................................................................................... 27 5.2 Gaps by type of SME ................................................................................................................... 28 5.3 Gaps in funding of intermediaries .............................................................................................. 29 5.4 Potential and capability of IFIs to fill gaps .................................................................................. 29 5.5 Recommendations ..................................................................................................................... 30
Annex 1: Macroeconomic indicators .................................................................................... 32
Annex 2: Financial sector indicators ..................................................................................... 33
Annex 3: The largest lending institutions .............................................................................. 34
Annex 4: World Bank Doing Business Indicators ................................................................... 35

List of Acronyms BFC Business & Finance Consulting
CAR Capital Adequacy Ratio
CPI Consumer Price Index
EBRD European Bank for Reconstruction and Development
EDIF Enterprise Development & Innovation Facility EFSE European Fund For Southeast Europe
EIB European Investment Bank
ENIF Enterprise Innovation Fund
EU European Union
EUR Euro currency
FAO Food and Agriculture Organization of the United Nations FDI Foreign Direct Investment
FI Financial Institution
GDP Gross Domestic Product
GIZ Deutsche Gesellschaft für Internationale Zusammenarbeit
IFC International Finance Corporation
IFI International Financial Institutions KfW German Development Bank
MSME Micro, Small and Medium Enterprises
NARD National Agency for Regional Economic Development
NES National Employment Service
NPL Non-performing Loan
OECD Organization for Economic Co-operation and Development PPP Purchasing Power Parity
RSD Serbian Dinar
SBA Small Business Act
SeVeN Serbian Venture Network
SME Small and Medium Enterprises
SOB State-owned Bank USAID United States Agency for International Development
USD United States Dollars
WB World Bank End of period exchange rates used in this report 9/30/2015 2014 2013 2012 2011 2010 RSD to EUR 119.4 120.6 114.3 113.4 104.3 105.2 Source: National Bank of Serbia

August 2016
BFC Max-Högger-Strasse 6 Phone: +41 44 784 22 22 [email protected] CH-8048 Zurich, Switzerland Fax: +41 44 784 23 23 www.bfconsulting.com
About this report This report is one of a series of reports produced by Business & Finance Consulting GmbH (BFC) for Eu-ropean Investment Bank (EIB) as part of the project “Assessment of financing needs of SMEs in Western Balkans countries.” The series of reports includes individual reports on Albania, Bosnia and Herzegovina, Kosovo, Macedonia, Montenegro, and Serbia as well as a synthesis report which considers the results of all six reports. The purpose of the project is to assess the financing needs of SMEs in the Western Bal-kans and identify market failures that prevent SME access to finance. The project was carried out from October 2015 to April 2016 by a team of three experts from BFC. On-site visits were conducted for each country in order to meet with representatives from financial institu-tions, development institutions, government organizations, and other relevant experts who can provide insights into the SME sector. The visit to Serbia took place from January 14th through January 22nd, 2016, during which time meetings were held with representatives from 28 organizations, including banks, SMEs, investment funds, multi-national donors, startup ecosystem members, and government agencies. The authors take full responsibility for the contents of this report. The opinions expressed do not neces-sarily reflect the view of the European Investment Bank.
BFC. Assessment of financing needs of SMEs in Western Balkans countries. Country report: Serbia
6
1 Executive summary The SME sector accounts for over half of Serbia’s economic activity and is a major source of jobs. The success of the country’s budding economic recovery therefore largely depends on the success of SMEs which, while generally having access to loan finance, need additional support in the form of longer term loans with lower collateral requirements and better funding options for microenterprises and startups. The equity finance market in Serbia is in its early stages, with a few existing funds supporting the grow-ing technology sector and a small number of larger consumer oriented SMEs. Though many SMEs cur-rently lack the awareness and sophistication needed to obtain equity funding, future success stories may encourage SMEs to develop their capacities and grow in order to become more investable.
1.1 Macroeconomic environment Serbia’s economy has suffered lackluster and sometimes negative growth over the past decade, reflect-ing the negative effects of the global financial crisis and, more recently, catastrophic flooding occurring in 2014. The weak economic performance has, in turn, stifled the growth of the SME sector, which was negatively affected by stagnant consumption and declining investment. The dominant export-oriented manufacturing sector, which is less reliant on domestic performance, has been more resilient to the economic downturn while the trade and service sectors, the top sectors for participation of SMEs, have suffered more. Since 2015, the economy has shown a low level of positive growth, but future fiscal tightening intended to curb budget deficits may cause further slowdowns. Upcoming large-scale layoffs of public sector employees and potential growth in unemployment will make job creation by SMEs es-pecially important going forward.
1.2 Demand for SME finance Serbia’s SME sector is an important pillar of the economy as it accounts for 70.4% of the country’s em-ployment and 53.0% of value added. Though the number of enterprises in the country has not grown over the past decade, and traditional family-owned SMEs have shown a reluctance to use leverage to grow due to economic and political uncertainty, the innovative technology sector has performed well, both in terms of value added and employment generation. Enterprises working in software develop-ment and technology hardware have begun to see success in growing customer bases both domestically and abroad, and a small startup scene has emerged in Serbia. Startup support structures, including ac-celerators, grant programs, and networking events, have begun to emerge. As a result, technology startups have begun to show demand for equity finance. On the other hand, demand for financing among traditional, family owned SMEs is concentrated in shorter-term working capital loans.
1.3 Supply of SME finance Banks are the predominant source of funding for SMEs, and generally provide a wide range of products to the sector through their nationwide branch networks, though the most commonly offered product is term working capital loans. Though bank loan portfolios have not grown in recent years during a period of risk aversion driven by high NPLs, the government’s 2014 working capital loan interest rate subsidy program has driven an increase in SME lending and competition for clients, with ever-improving borrow-ing conditions. The primary beneficiaries of this dynamic have been larger SMEs, as banks have compet-ed for their business while largely shunning micro enterprises. The virtual absence of a microfinance sec-tor has left the supply of microloans low. Because the few equity funds active in the country target ei-ther technology startups or larger consumer oriented businesses, microenterprises and non-technology startups are essentially left without a source of funding.
1.4 Supply and demand gaps Aside from the shortage of funding for microenterprises and startups discussed above, several addition-al supply and demand gaps in SME finance exist in Serbia. The supply of longer-term loans is limited by the short-term nature of bank liability structures, especially in the case of local currency lending. Though investment appetites among SMEs are low, businesses have reported using working capital loans for

BFC. Assessment of financing needs of SMEs in Western Balkans countries. Country report: Serbia
7
investment purposes. Unsecured loans are also insufficiently supplied, though collateral requirements in Serbia are less stringent than those in neighboring economies. The equity finance market is too new for measurable supply and demand gaps to materialize as existing funds are currently busy deploying their capital. Sufficient leasing finance appears to be available to meet the low level of demand for the prod-uct, and both the supply and demand of trade finance products is very low, pointing to the underdevel-oped state of the trade finance market in Serbia.

BFC. Assessment of financing needs of SMEs in Western Balkans countries. Country report: Serbia
8
2 Macroeconomic environment Key findings: • Serbia’s lackluster growth and periodic GDP contraction over the past decade have reduced the con-
sumption base for SMEs and stifled their investment appetite • Though the economy has begun to stabilize, with marginally positive GDP growth recorded for 2015,
fiscal tightening may keep strong growth from materializing • Because fiscal tightening plans include significant layoffs in the public sector, already high unem-
ployment rates may increase in the near term • Serbia’s core export-oriented manufacturing sector, rooted in the automotive industry, has fared
better than trade, which is dominant among SMEs and reliant on domestic consumption • Local currency devaluation has historically driven high Serbian dinar lending rates, but the dinar’s re-
cent stabilization has brought the rates down and made “dinarization” of the economy more feasible Key macroeconomic indicators for the country are presented in Annex 1.
2.1 Economic development and growth With a GDP of EUR 32.4 billion and purchasing power parity per capita GDP of over EUR 10,000 as of 2014, Serbia is considered to be an upper-middle income country. Serbia’s economy contracted drasti-cally as a result of the 2008–2010 global financial crisis and severe flooding in May of 2014, which has reduced domestic investment and consumption. In part due to post-flooding recovery efforts, the econ-omy expanded slightly in 2015 with growth estimated at 0.7% for the year, and 3.6% annual growth is estimated for 2016–20201. The economic recovery is a welcome prospect for SMEs, which have suffered due to decreased consumption driven by employment losses and are declining in number and stagnat-ing in terms of value added, as discussed in Section 3 of this report. Because Serbia’s income distribution is relatively even, with a Gini index of 29.7 as of 2010 (latest date available), consumption increases, and therefore revenues of SMEs serving the domestic market, can be expected to be substantial as the re-covery continues. Serbia’s high rate of unemployment, at 22.2% as of 2014, puts significant downward pressure on SME performance due to its effective reduction of the population’s buying power, and its effect could be fur-ther exacerbated in the short term as the large public sector lays off workers (as discussed later in this section). The high unemployment allows SMEs access to low wage labor, giving them the opportunity to scale up without investing in automation. Youth unemployment amounted to a high 49.5% in 2015.2 The youth unemployment rate was driven up by the financial crisis, which disproportionately reduced employment prospects for the younger popula-tion, and the economy has been unable to generate sufficient work opportunities for youth since that time. Systemic problems, such as an inability of the formal education system to adapt to the needs of the labor market and the lack of public sector jobs for younger workers, also contribute to the issue.3
1 Economist Intelligence Unit (2016), Serbia in Brief http://country.eiu.com/serbia 2 World Bank Data (2016), Unemployment, youth total (% of total labor force ages 15-24) http://data.worldbank.org/indicator/SL.UEM.1524.ZS 3 Spiric, Ljubica (2001), How to Deal with Youth Unemployment with Moderate Funds ec.europa.eu/social/BlobServlet?docId=10694&langId=en

BFC. Assessment of financing needs of SMEs in Western Balkans countries. Country report: Serbia
9
2.2 The structure of the economy Serbia’s economy is based on manufacturing, with the sector accounting for 25.7% of GDP as of 2015 in terms of gross value added. Trade and service, two important sectors for SMEs, account for a combined 18.1%; agriculture adds a notable 8.4%; and information and communication technology adds 5.1%.4 The manufacturing sector is the primary driver of the country’s exports. Manufacturing exports consist of motor vehicles (13.6% of exports), food products (12.6% of exports) and, to a lesser extent, electrical equipment, rubber and plastic products, and basic metals.5 Automotive production is driven by the presence of large Fiat manufacturing facilities in Serbia, and the SME sector benefits from this by manu-facturing automotive inputs and providing post-production services for vehicles (for example, a success-ful SME interviewed for this study was involved in customization of vehicle interiors and temperature control systems for commercial fleets). Serbia’s power, telecommunications, and energy sectors remain under control of state owned enter-prises, leaving little room for SME participation in these sectors. As a result, SMEs are concentrated in the trade, service, manufacturing, and technology sectors. State-owned enterprises are widely viewed as a drain on public finances and are currently being restructured, with large employee layoffs planned within the public companies. This may eventually help privatize economic activity in the publicly domi-nated sectors, creating more opportunities for SMEs.
2.3 Inflation and asset prices Serbia’s relatively high inflation rates, which reached an 11.1% recent peak in 2011 and tapered to 2.1% in 2014, have created a growth barrier for SMEs. Consumer price growth has put downward pressure on demand, particularly affecting enterprises involved in trade. Inflation rates appear to have stabilized with recent economic improvements, with the central bank targeting a 4.0% consumer price index in-crease for 2016. The Serbian dinar has gradually lost value against the euro over the past several years, but the central bank generally intervenes to prevent short-term exchange rate fluctuations. The highest devaluation occurred in 2010, when the dinar fell against the euro by 10%, rebounding slightly the following year. Exchange rates have stabilized in the recent past, causing interest rates for local currency loans to de-cline and increasing demand for local currency loans. Banks interviewed for this study reported that cur-rency devaluation-related credit risk has not materialized in their portfolios despite the devaluation trends and the predominance of foreign currency lending in the country.
2.4 Balance of payments Serbia consistently operates with a negative current account balance, driven by its trade deficit (12.4% of GDP as of 2014, down from 17.7% in 2012). The trade deficit highlights the significant room for export growth among SMEs, especially given that exports are dominated by the automotive sector due to the presence of Fiat manufacturing facilities in Serbia. Foreign direct investment in Serbia fell in the after-math of the global financial crisis, and has not recovered, ending 2014 at 3.7% of GDP. The development of non-trade oriented sectors, especially information technology and other highly-technical sectors, will be instrumental in boosting exports and attracting more foreign investment into the country, helping to improve the balance of payments.
4 Statistical Office of the Republic of Serbia (2016), Quarterly Gross Domestic Product in the Republic of Serbia, 4th Quarter 2015 http://webrzs.stat.gov.rs/WebSite/repository/documents/00/02/03/89/NR40-Q4-2015-eng.pdf 5 Statistical Office of the Republic of Serbia (2015), Monthly Statistical Bulletin http://webrzs.stat.gov.rs/WebSite/repository/documents/00/02/01/85/MSB-11-2015.pdf

BFC. Assessment of financing needs of SMEs in Western Balkans countries. Country report: Serbia
10
2.5 The fiscal and political situation Serbia followed a loose, consumption-oriented fiscal policy until 2014 when a recession forced the gov-ernment to enact budget-balancing measures reducing public employment and other spending. The fis-cal deficit has ranged between 4.7% and 7.2% of GDP during the 2010–2014 time period, exacerbated by periodic economic contraction. The government’s drive for fiscal consolidation has had a negative effect on consumption, reducing demand for SMEs serving the local market. Austerity measures drove a 3.2% reduction in public salaries in 2014, and further cuts are planned, with a target to reduce the num-ber of public employees by 5% each year through 2017 and the decision not to index public sector sala-ries to inflation. The fiscal deficit amounted to 6.7% of GDP in 2014, up from the previous year due in part to the recapitalization of banks, but is expected to stop growing in 2017 according to the govern-ment’s fiscal consolidation plan. Public debt and government expenditures amounted to 79.3% and 18.2% of GDP in 2014, respectively. Serbia’s increased efforts to reform its inefficient public sector, improve public administration, and in-crease fiscal responsibility, as well as steps to normalize its relationship with Kosovo, have helped its progress toward European Union membership. On the negative side, political fragmentation and fre-quent elections have had the effect of tempering investment appetites and slowing economic growth and political reform. The anticipated public sector layoffs associated with the planned contraction of the public sector could cause further political instability if the private sector, including SMEs, is not able to generate the jobs needed to make up for the employment shortfall.

BFC. Assessment of financing needs of SMEs in Western Balkans countries. Country report: Serbia
11
3 Demand analysis Key findings: • Serbia’s SME sector has suffered from the economic difficulties of the recent decade, with stagnation
in the overall number of enterprises and level of employment provided by the sector • The trade sector has been the least successful in the downturn while the manufacturing sector has
been more resilient • The technology sector has shown the healthiest growth trajectory, both in terms of value added and
employment • Innovation in the technology sector is seen in both software and hardware companies; several
startup success stories are gaining attention in the market • While SMEs are generally risk averse and reluctant to grow through additional leverage, startups
have begun to embrace the idea of growing through outside capital
3.1 Size and growth of the segment 3.1.1 Size and definition of sector Based on 2013 data from Serbia’s statistical service (the latest available), the SME sector consists of 280,845 enterprises, 96.1% of which belong in the micro segment with up to 9 persons employed. Small (10–49 employees) and medium (50–249 employees) enterprises total 8,903 and 2,011, respectively, and there are just 489 large enterprises with over 250 employees in the country6. At 99.8% of total en-terprises, the SME sector is on par with the EU average in terms of enterprise size distribution7. Though the number of unregistered enterprises in Serbia is unknown, a 2013 USAID study estimated the size of the country’s shadow economy at a very substantial 21.0% to 30.1% of GDP, depending on the method of calculation. The study identified the shadow economy as one of the most important obstacles to cor-porate sector development in Serbia.8
Table 1. Number of MSMEs by size, 2013 Size Definition Number of enterprises Micro 0–9 employees 269,931 Small 10–49 employees 8,903 Medium 50–249 employees 2,011 TOTAL n/a 280,845
Source: Statistical Office of the Republic of Serbia via the European Commission
3.1.2 Importance of the sector The SME sector is very important to Serbia, as it provides 70.4% of the country’s employment, above the European Union’s average of 66.9%. The sector’s contribution to value added, at 53.0% of the total, falls behind the European Union’s average of 58.1%, highlighting the sector’s relative inefficiency and oppor-tunity for improvement.
3.1.3 Other estimates The National Agency for Regional Economic Development (NARD) estimated the number of enterprises to be about 12% higher in 2011 compared with figures from the national statistical service, quoted above. Statistical service figures were used because more recent data was available from that source.
6 The figures reported exclude the agricultural sector. 7 European Commission (2015), Serbia, 2015 SBA Fact Sheet http://ec.europa.eu/growth/smes/business-friendly-environment/performance-review/files/countries-sheets/2015/serbia_en.pdf 8 USAID (2013), The Shadow Economy in Serbia http://pdf.usaid.gov/pdf_docs/pnaec461.pdf

BFC. Assessment of financing needs of SMEs in Western Balkans countries. Country report: Serbia
12
3.1.4 Growth rate The number of enterprises declined between 2011 and 2013 (the last two years with available statistical data), reflecting the economic stagnation experienced during the time period. The number of micro, small, and medium enterprises declined by 4.7%, 0.9%, and 4.4%, respectively between the two years. Employment by SMEs has also shown a negative trend, declining by 8.0% between 2009 and 2013, and the value added by the sector stagnated during the same time period. According to World Bank data, just over 8,000 enterprises were registered in the country between 2011 and 2014, which has not made up for the number of enterprises going out of business9.
3.2 Characteristics of SMEs The most important economic sectors for SMEs are trade, at 30.2% of 2011 enterprises, and manufac-turing, at 16.2% of enterprises. Enterprises involved in professional, scientific, innovation, and engineer-ing activities, which include Serbia’s growing information technology sector, also made up a notable 11.6% of SMEs that same year, though it has not provided the same level of employment or value added as the other two dominant sectors, as shown in the table below. The importance of the trade sector is reflective of Serbia’s historical consumption-focused economic growth model, and the size of the manu-facturing sector is driven by the country’s automotive industry. Table 2. SME Indicators by Economic Sector, 201110
Sector Proportion of Enterprises
Proportion of Employment
Proportion of Value Added
Trade 30.2% 18.2% 15.4% Manufacturing 16.2% 18.6% 14.2% Professional, scientific, innova-tion and engineering activities 11.6% 4.7% 5.1%
Construction 7.4% 5.0% 3.9% Other SME 34.4% 21.6% 17.2% TOTAL SME 99.8% 65.1% 55.8% Source: National Agency for Regional Economic Development Agricultural enterprises. Agricultural enterprises, included in the “other SME” total above, account for 1.7% of enterprises in Serbia as of 2012, and consist primarily of sole proprietors and microenterprises (91.2% of the total).11 There is a large concentration of agricultural enterprises in the Vojvodina region, with many commercially oriented farms located there. 3.2.1 Regional distribution SMEs are somewhat concentrated in Northern Serbia, with the district surrounding the capitol city of Belgrade accounting for 31.0% of enterprises and the agriculture-rich Vojvodina region (7 districts) tak-ing up another 22.3% as of 2011. The remaining 17 southern districts share the remaining 46.7% of the enterprises.12
3.2.2 SMEs and trade SMEs accounted for 55.8% of imports but only 48.5% of exports by enterprises in Serbia, making them important drivers of the country’s trade deficit in 2011. This is largely the result of the predominance of
9 European Commission (2015), Serbia, 2015 SBA Fact Sheet http://ec.europa.eu/growth/smes/business-friendly-environment/performance-review/files/countries-sheets/2015/serbia_en.pdf 10 National Agency for Regional Economic Development (2012), Report on Small and Medium-Sized Enterprises and Entrepre-neurship 2012 11 IBID 12 IBID

BFC. Assessment of financing needs of SMEs in Western Balkans countries. Country report: Serbia
13
trading enterprises among SMEs. Insufficient international competitiveness is frequently viewed as a key challenge for the SME sector.13
3.3 Performance 3.3.1 Economic performance The SME sector as a whole has had performance difficulties over the past decade, having suffered major setbacks during the time of economic instability following the global financial crisis. Traders were espe-cially hurt, with the employment in the trade sector falling by 12.0% between 2009 and 2013. The in-formation and communication sector has shown the best performance in recent years, growing by 53% between 2009 and 2013 in terms of value added and increasing its employees by 11% during the same time period.14 Agricultural SMEs incurred significant losses as a result of the catastrophic flooding that occurred in 2014. Banks reported that the riskiest economic sectors driving NPLs are trade and construc-tion.
3.3.2 Entrepreneurial drive With the exception of the technology sector, SMEs in Serbia are generally considered to be risk averse and satisfied with maintaining stable family business structures, foregoing ambitious growth plans. Equi-ty finance providers described SMEs as suspicious of outside investors and concerned with being swin-dled, highlighting their lack of familiarity with this financing source. Stakeholders also frequently men-tioned that business planning, financial reporting and corporate governance capacities of SMEs tend to be lacking, reducing their attractiveness to financiers. The above phenomenon can partially be explained by the demographic profile of Serbia’s entrepre-neurs. About half of the self-employed population in Serbia is over 50 (based on 2004-2011 data), and less than a quarter is under the age of 4015. This highlights the possibility that many Serbians choose en-trepreneurship out of necessity, due to the lack of paid employment opportunities. Attitudes displayed by SMEs interviewed for this study confirmed their risk aversion, and the continued political uncertainty in the country has further deterred non-technical SMEs from investing. Enterprises working in technology, on the other hand, have exhibited a healthy degree of entrepreneurial drive, boosted by programs such as the national Innovation Fund, as described in Section 4 of this report. Ser-bia outscored EU averages in entrepreneurship performance on the European Commission’s Small Busi-ness Act for Europe’s assessment in 2015, highlighting this trend.16
3.4 Institutional and regulatory issues Serbia’s institutional environment for business is relatively favorable and improving, with the 2012 OECD Policy Index for the Western Balkans listing the country as a regional leader in SME policy devel-opment, second only to Croatia. The country’s efforts to restructure its SME policy and redesign its main policy tools were assessed favorably by the OECD17. Following OECD’s evaluation, mostly during 2014, the government adopted and amended a series of laws in order to improve the business climate, cover-ing subjects such as labor, planning and construction, bankruptcy, investment funds, tax procedures, and pension and disability insurance.
13 IBID 14 European Commission (2015), Serbia, 2015 SBA Fact Sheet http://ec.europa.eu/growth/smes/business-friendly-environment/performance-review/files/countries-sheets/2015/serbia_en.pdf 15 15 Suzana Stefanovic, Daniela Stosic (2012), Age and Education as Determinants of Entrepreneurship http://facta.junis.ni.ac.rs/eao/eao201203/eao201203-04.pdf 16 European Commission (2015), Serbia, 2015 SBA Fact Sheet http://ec.europa.eu/growth/smes/business-friendly-environment/performance-review/files/countries-sheets/2015/serbia_en.pdf 17 OECD (2012), Western Balkans and Turkey SME Policy Index 2012

BFC. Assessment of financing needs of SMEs in Western Balkans countries. Country report: Serbia
14
SME attitudes toward the business environment appear to be improving: a survey conducted by Pro-Credit Bank in 2015 on the sentiments of Serbian SMEs on the business climate in the country showed that attitudes improved from the previous year, with the number of companies reporting a positive out-look increasing from 46.7% to 52.7%18. The World Bank ranked the country an overall 59th on its 2016 Doing Business scale, representing a nine-point improvement in rank from the previous year.
3.4.1 Ease of starting a business Starting a business in Serbia takes an average of 12 days, six procedures, and costs 6.6% of per capita income, all of which are above the averages for Europe and Central Asia based on the Doing Business scale. Serbia ranks 65th on the scale for the overall ease of starting a business, and registration with local tax authorities, at 5 days, is the most time consuming activity.
3.4.2 Taxation Taxation issues are one of the two main factors bringing down Serbia’s ranking on the Doing Business scale, with a rank of 143 for 2016. Paying taxes is a rather cumbersome activity with 42 payments per year required, compared to an average of 19.2 payments in Europe and Central Asia according to Doing Business. Profits are taxed at a relatively high 16% compared to Europe and Central Asia’s average of 10.8%, and corporate income taxes are required to be paid monthly. 3.4.3 Female entrepreneurship Serbia’s entrepreneurship support programs, covering both startups and existing business scale-up sup-port, have specifically targeted female entrepreneurs. Supporting female entrepreneurship is also one of the major stated goals of Serbia’s new SME support strategy for 2015–2020.19 3.4.4 Support services The OECD ranks Serbia’s innovation policy the highest among the countries in the region except EU-member Croatia, giving it 3.2 out of 5 possible points, and praising the country for enforcement of intel-lectual property rights.20 Enterprise skill development support is generally available, but donors inter-viewed for this study mentioned a continued gap in both skills transfer initiatives and capacity building in areas such as corporate governance and financial management for SMEs.
3.4.5 Support for access to markets and external trade Market access support appears to be well developed. Serbia was rated a high 4.2 out of 5 points on OECD’s best practices scale for internationalization of SMEs, beating even EU-member Croatia in this measure. Serbia ranks a high 23rd for the ease of cross-border trade on the Doing Business scale, in large part due to its rapid border and documentary procedures (6 hours total for both imports and exports). Technical regulations and alignment with EU sanitary and phytosanitary standards are ranked 3.8 out of 5 on OECD’s best practices scale, indicating a relatively favorable environment for trading with the EU.21
3.4.6 Environmental issues Though supporting the green economy is not emphasized in the country’s overall SME strategy, Serbia has made strides in developing policy measures concerning environmental matters. Awareness-raising 18 ProCredit Bank (2015), SMEs in Serbia are More Optimistic https://procreditbank.rs/en/vest/661/sme-in-serbia-are-more-optimistic 19 European Commission (2015), 2015 SBA Fact Sheet http://ec.europa.eu/growth/smes/business-friendly-environment/performance-review/files/countries-sheets/2015/serbia_en.pdf 20 OECD (2012), Western Balkans and Turkey SME Policy Index 2012 21 IBID

BFC. Assessment of financing needs of SMEs in Western Balkans countries. Country report: Serbia
15
efforts on the importance of green production have been made, and a labeling system for environmen-tally friendly products has been introduced22.
3.4.7 Public procurement SMEs’ participation in public procurement has been encouraged by national policy23, and enterprises interviewed for this study listed public organizations among their customers. However, both SMEs and donors interviewed for this study have indicated that private companies sometimes have trouble col-lecting receivables from state firms, negatively affecting their performance.
3.4.8 Attracting talent SMEs working in the technology sector reported that it is difficult to attract qualified software develop-ers given competition from high-paying international companies like Microsoft, which has a develop-ment center in Belgrade. This issue is exacerbated by the fact that Serbia does not have a legal basis for issuing employee stock options, a common compensation vehicle for startups elsewhere.
3.5 Innovation Serbia’s technology sector exhibits a healthy degree of innovation, with several startups working in en-terprise software, e-commerce, and technology hardware succeeding in obtaining investment in the re-gion and in Western Europe and entering the revenue stage. A small number of local success stories, most notably that of the Facebook-based fantasy soccer platform Nordeus with its 11 million active us-ers per month, have worked to encourage technological entrepreneurship and build the country’s startup community. Technological innovations developed through Novi Sad University, including several health and agriculture related technology hardware projects, have had some success with commerciali-zation, and software development outsourcing companies have also had success in Serbia. Innovation can also be observed in agricultural development with enterprises beginning to adopt tech-nology such as anti-hail nets and drip irrigation systems in order to boost production. Improvements in agriculture modernization were most recently made in the aftermath of the 2014 catastrophic floods when significant donor funds became available for recovery efforts.24 Organic agriculture is also emerg-ing as a trend in Serbia. The number of support service providers for SMEs in Serbia was estimated to be about 500 by the Euro-pean Union funded Improved SME Competitiveness and Innovation Project, with services from the pub-lic sector accounting for about a third of the total. The National Employment Service (NES), the National Agency for Regional Development (NARD), along with chamber organizations and rural development agencies, were the main promoters of SME development in the country.25 During 2015 the government adopted a new National Strategy for SME development, which transitions the SME support function to the Development Fund of the Republic of Serbia and the Export Credit and Insurance Agency, which will focus on providing direct loans and grants to SMEs in a similar fashion to the 2015 production equipment grant program, which used a EUR 4 million budget to subsidize the pur-chases and loans on new equipment for SMEs. The specifics of the new strategy’s access to finance pillar were under development during the Ministry of Economy interview conducted for this study. The Innovation Fund, amounting to EUR 6 million provided by the EU’s Instrument for Pre-Accession Assistance, is the main government-sponsored startup assistance program, though it does not receive
22 European Commission (2015), 2015 SBA Fact Sheet http://ec.europa.eu/growth/smes/business-friendly-environment/performance-review/files/countries-sheets/2015/serbia_en.pdf 23 IBID 24 FAO (2015), Serbian Agriculture is Getting Back on Track http://fao.org/europe/news/detail-news/en/c/358928/ 25 Improved Competitiveness and Innovation Project (2015), Mapping of Business Support Services

BFC. Assessment of financing needs of SMEs in Western Balkans countries. Country report: Serbia
16
any funding from the Serbian government. The fund provides capacity building services, small grants (EUR 8,000) to startups, and larger grants (up to EUR 300,000) to later-stage, revenue producing startups. Though 60% of the startups funded through the program belong to the information technology sector, all industries are eligible for the program, and technology hardware projects are also widely rep-resented among grant recipients. A fully transparent review process is used to select fund recipients. Since the program has successfully allocated all of its grant funding, it is now searching for additional funds to continue the initiative. In the meantime, it continues to monitor the existing grantees and ad-vocates for the commercialization of intellectual property developed within Serbian universities. Other notable startup and equity finance support organizations include the Serbian Venture Network (SeVeN) and the Private Equity Association:
• SeVeN’s main activity is organizing an annual forum and pitch competition that brings together startups and potential angel investors (120 investors attended the 2015 forum), as well as put-ting on smaller educational meet-ups for startups throughout the year;
• The Private Equity Association works to improve the investment readiness of SMEs, collaborat-ing with chambers of commerce to organize seminars on topics such as financial reporting and governance.
Among multinational donors, EBRD, USAID (through its Business Enabling Project), the EU (through its Improved Competitiveness and Innovation Project), GIZ, and EFSE provide SME support services. Support services from the public sector as well as from donors are concentrated in the cities of Bel-grade, Nis, Kragujevac, and Novi Sad, with services outside of these regions being very limited (2–15 providers per region in the remaining 17 regions). Business planning, organizational management, HR services, marketing and public relations, and startup advice are the most common services offered. Box 1. Example of innovative SME Strawberry Energy (senergy.rs) is a Belgrade-based company that designs and builds urban devices that provide solar-powered mobile phone charging, environmental sensing, emergency calling, and local in-formation in public spaces. Its products include “Strawberry Tree” urban installations as well as smart urban benches of various sizes and feature sets. The company was founded in 2011 and bootstrapped its operations, reaching positive revenue prior to receiving outside funding, which came in the form of a grant from the national Innovation Fund. The company manufactures its installations in Serbia, outsourcing only the manufacturing of steel parts and performing assembly and electronic wiring in-house by the company’s eight-member team. Munici-palities, public utilities, and real estate developers are the target customers for the products. Several of Strawberry Energy’s installations are currently placed around Belgrade, but the company is currently working on selling to customers in the United Kingdom, Switzerland, and the United States.
3.6 Demand for finance 3.6.1 Overview Demand for finance among Serbia’s SMEs appears to be healthy, but concentrated in short term work-ing capital finance, though enterprises in the technology sector have developed an appetite for equity financing, especially venture capital and seed-stage angel funds. The uncertain political and economic environment in the country has exerted downward pressure on demand for finance as SMEs, especially established family owned companies involved in sectors such as manufacturing, have been reluctant to take on additional liabilities to invest. The 2013 World Bank Enterprise Survey revealed that Serbian enterprises use outside financing more than their Eastern European and Central Asian peers, with 40.0% of firms having loans or lines of credit

BFC. Assessment of financing needs of SMEs in Western Balkans countries. Country report: Serbia
17
(vs. 36.5% average), 27.0% of firms using banks to finance investment (vs. 24.2% average), and 8.1% of business investments financed by equity sales (vs. 6.1% average).
3.6.2 Estimate of demand Demand for loans by the SME sector is estimated at about EUR 4.5 billion, which amounts to 13.9% of 2014 GDP and 28.5% of 2014 aggregate bank loans. Table 3. Calculation of demand for loans from MSEs Step in Calculation Value Source A. Number of SMEs 280,845 Statistical Office of the Republic of Serbia 2013
data via the European Commission‘s 2015 SBA Fact Sheet
B. Average loan size demanded (EUR) 25,753 BFC survey of local lenders C. % of enterprises needing a loan 61.8 World Bank Enterprise Surveys26 D. Total demand (EUR) 4.5 billion = A * B * C Demand was estimated by multiplying the existing average outstanding SME loan size by the number of SMEs in the country, discounting the proportion of enterprises not needing a loan as per the World Bank Enterprise Survey for Serbia. The average loan size was calculated by dividing the aggregate MSME loan volume at five banks surveyed by BFC by the aggregate number of MSME loans issued by these banks. The number of SMEs in the country was taken from 2013 data reported by the Serbian statistical service, which excluded agricultural enterprises. The demand estimate may be overstated because overrepresentation of larger SMEs in the average loan size estimate skews the figure upward. Banks have a strong preference for financing larger SMEs with loans of EUR 50,000 or more, and the larger SME market appears to be well supplied, based on inter-views conducted for this study. Loans to microenterprises, on the other hand, are underrepresented in the average due to the absence of a microfinance industry despite the presence of strong demand for such loans. The absence of agricultural enterprises in the estimate, on the other hand, skews the esti-mate downward.
3.6.3 By type of SME Economic sector Banks reported healthy demand for finance in the growing agricultural sector, with manufacturing com-panies showing low to steady demand due to their limited growth plans. SMEs working in trade contin-ue to exhibit demand for loans due to the sheer size of the sector despite the economic difficulties expe-rienced by these enterprises, as discussed above. The technology sector exhibits demand for growth capital with hundreds of early stage companies actively seeking funding. Enterprise size Demand for finance among larger formalized SMEs is limited by their small number, with banks report-ing having to actively compete for a small number of qualified clients. Smaller enterprises with undocu-mented income are reported to exhibit strong demand for finance, especially for loans with looser col-lateral requirements. Geographic distribution Much of the SME finance demand is located in the capitol city of Belgrade, as its region accounts for about a third of the enterprises in the country. The city of Novi Sad, in the Vojvodina region, was also frequently mentioned as an important source of demand for finance in part due to the strength of tech- 26 The World Bank surveys report the % of enterprises not needing a loan, from which the percent of enterprises needing a loan is inferred as 100% minus the % not needing a loan.

BFC. Assessment of financing needs of SMEs in Western Balkans countries. Country report: Serbia
18
nological education and innovation in that region. Demand for agricultural loans is also concentrated in Vojvodina, as the region is strong in agricultural production. The southern regions of Serbia, which are relatively less developed, appear to exhibit lower demand for finance.
3.6.4 By instrument Loans Demand for loans is healthy but concentrated in short-term working capital credits and credit lines. Only 38.2% of enterprises reported not needing a loan, which is well below the 51.1% average for Eastern Europe and Central Asia, highlighting Serbian SMEs’ overall comfort level with using credit for business purposes. Banks interviewed for this study also reported specific demand for unsecured loans. Demand for investment loans is limited by the uncertain political and economic climate in the country, with SMEs showing reluctance to take on additional credit to invest in business expansion. SMEs have historically exhibited a preference for euro-denominated loans due to their significant rate discount compared to local currency loans, but demand for dinar loans has begun to increase as rates in the two currencies have begun to converge in the recent past. The availability of government-subsidized loans significantly influences SME loan demand conditions in the country. Temporary interest rate reductions drive major demand spikes, and the absence of subsi-dies creates unnatural breaks in demand, with customers waiting for the launching of the next subsidy round. Leases Demand for leasing products is low but steady, with a lack of awareness acting as a barrier to demand. Enterprises that use vehicle fleets, including those interviewed for this study, have a greater familiarity and comfort level with leasing, while others prefer loans to leases because of the perception that loans are cheaper. Equity and quasi-equity Demand for equity finance is skewed toward angel and venture capital investments, with early stage startups looking for capital to scale their businesses. Demand for private equity finance is limited by the family-owned nature of Serbian businesses. Guarantees and letters of credit Demand for domestic guarantee products is steady as SMEs regularly use guarantees for public procure-ment bidding. Demand for international trade finance among SMEs is lower, as companies prefer to use advance payments and generally display a low level of familiarity with the benefits of letters of credit.

BFC. Assessment of financing needs of SMEs in Western Balkans countries. Country report: Serbia
19
4 Supply analysis Key findings: • Banks provide the vast majority of the financing to SMEs, though a small but successful leasing sec-
tor is primarily directed at SMEs • The banking sector has suffered from a heavy burden of non-performing loans, tightening lending
conditions for SMEs and other clients, especially when it comes to collateral requirements • Government interest rate subsidies and other support programs have worked to improve lending
conditions for SMEs • The supply of loans for microenterprises is low due to the absence of a microfinance sector • An equity finance industry has emerged during the past five-year time period, with both private equi-
ty and venture capital now available on the local market at a low level • Financing targeting startups outside of the technology sector is very limited, as neither banks nor
equity funds target the sector
4.1 Number and type of intermediaries 4.1.1 Banks Banks are the predominant source of SME finance in Serbia. Of the 29 banks present in the country, roughly ten were estimated to compete intensively for SME business by one of financial institutions in-terviewed for this study. With the exception of one retail-focused bank, all other Serbian banks offer loans to SMEs. Though a heavy load of NPLs (almost a quarter of corporate loans in 2014) has curtailed lending appetites in recent years, many banks have pursued SMEs as a substitute for beleaguered large enterprises.
4.1.2 Microfinance The microfinance sector consists of two small organizations with a combined loan portfolio of less than EUR 20 million (see Annex 1 for details) that must issue loans in partnership with banks due to the ab-sence of a legal basis for non-bank financial institutions in Serbia.
4.1.3 Leasing companies Serbia’s leasing sector is small, with leasing assets equivalent to just 1.9% of banking assets as of Sep-tember 2015, but exists primarily to serve enterprises, which accounted for 85.0% of outstanding leases as of the same date. As of September 2015, Serbia has 16 leasing companies, 14 of which are subsidiar-ies of banks. With the exception of the resolution entity for Hypo Alpe Leasing, a previous market leader that has exited the business, all of the companies offer leasing services to SMEs, though some are re-stricted to financing vehicle fleets (financing of freight vehicles such as buses accounts for over a third of the leasing sector, and passenger vehicles take up another quarter). Leasing sector assets declined by 13.0% between 2014 and 2015, indicating a contraction of the sector27, due to the exit of Hypo Alpe Leasing, which held over a quarter of the sector’s assets in 2014.
4.1.4 Equity funds Intermediaries offering equity finance in Serbia consist of one local private equity fund, one privately funded early stage venture capital firm and accelerator, SC Ventures (a regional venture capital fund), and a small number of individual private equity investors. All of the local equity funds have been in ex-istence for less than five years, highlighting the emerging nature of this financing source.
27 National Bank of Serbia (2015) Financial Leasing Sector in Serbia, Third Quarter Report 2015

BFC. Assessment of financing needs of SMEs in Western Balkans countries. Country report: Serbia
20
4.1.5 Government programs Government programs, estimated at around 500 in number as discussed in section 3.5, support SMEs through interest rate subsidies on loans and small grants for equipment investment, as well as direct lending to targeted industries such as manufacturing. The latest example of such a program is the Na-tional Agency for Regional Development’s equipment grant and loan program, as discussed in section 5.5.1. Government funding is available both on the national and regional levels. 4.1.6 Guarantee programs Serbia does not currently have an active guarantee program. Please refer to section 5.5.1 for a discus-sion of the 2013 Vojvodina regional agricultural guarantee program and to section 6.4 for a discussion of KfW’s guarantee program from the early 2000’s.
4.2 Type of funding instruments 4.2.1 Loans Though lending activity in Serbia has been somewhat weak in the recent past due to performance prob-lems in the banking sector, loan financing is widely available to MSMEs. Sector-wide loans to private businesses declined by 4.7% during 2014, and continued to shrink in the first part of 2015 before re-bounding in the latter part of the year.28 Term working capital loans are the most widely supplied prod-uct, but other loan types, including longer term investment loans, credit lines, and overdrafts are also available. The supply of longer-term loans is somewhat restricted by the short-term funding structure of banks, as discussed in the Funding of Intermediaries section below. Agriculture-specific loan products, including seasonal loans with uneven repayment and grace periods, are also widely available, with some banks beginning to develop value chain finance and warehouse receipt-based lending products. Maturity structures of loans tend to be short, as most of the loans issued are for working capital pur-poses (the popularity of working capital loans was also boosted by the government interest rate subsidy program, which targeted these products). One of the banks interviewed for this study mentioned that SME loans of EUR 50,000 and above tend to be the primary target of most Serbian banks, following a general trend of increasing average loan size. For example, ProCredit Bank, which previously focused on microfinance, has stopped targeting this segment. Following the stabilization of the dinar, the government interest rate subsidy program, and the decline in global interest rates, SME loan rates in Serbia have fallen to rather low levels. At the time of the inter-views conducted for this report (January 2016), loans in Euros could be obtained at as low as 3%, but were typically priced at 5–10% depending on the institution and loan type, while dinar-denominated loans were priced at around 8–15%. Collateral requirements are substantially looser than regional averages, with the 2013 World Bank En-terprise Survey finding that only 66.4% of loans require collateral, compared to 82.7% for Eastern Eu-rope and Central Asia on average. Additionally, only 149.8% of the loan value is required to be covered by collateral, compared to the 206.7% average requirement for Eastern Europe and Central Asia accord-ing to the report. The Central Bank believes that inadequate collateral evaluation practices, driven in part by the lack of quality appraisers and a property valuation database, may result in higher collateral requirements once corrected29.
4.2.2 Leases The supply of leasing in Serbia has contracted due to the shutdown of Hypo Alpe leasing, the previous market leader, but the SME leasing portfolios of the remaining important leasing companies have been
28 National Bank of Serbia (2015) Banking Sector – First Quarter 2015 Statistical Annex 29 National Bank of Serbia (2015) Annual Financial Stability Report 2014

BFC. Assessment of financing needs of SMEs in Western Balkans countries. Country report: Serbia
21
growing in the recent past. Though the leasing sector operates on a small scale, most lease types rele-vant to enterprises are available in Serbia, including those for production machinery, construction ma-chinery, agricultural equipment, service provision equipment, commercial real estate, and transporta-tion including aircraft and vehicles (as mentioned above).30 Leasing costs are typically equivalent to bank interest rates, and maturities average 36 months. The leas-ing company interviewed for this study stated that longer leases are generally available, but are not popular with customers. Typical lease contracts require a customer down payment of 20% of the leased asset value. Leases are primarily offered in euros.
4.2.3 Letters of credit and trade finance guarantees Trade finance products, especially letters of credit, are not a focus for Serbian banks because banks view demand for the products to be low. Among five banks surveyed for the purpose of this study, only one reported any letter of credit volume to SMEs, and the amount was negligible, at 0.1% of total loans as of September 2015. Guarantees to SMEs averaged 1.9% of total loans for the banks surveyed. The leading trade finance bank in the country, which actively pursues the business, reported a lack of letter of credit volumes, with stronger use of guarantees. Guarantee products are primarily used domes-tically, as a part of public procurement bids.
4.2.4 Risk capital Equity finance for several stages of SME growth is available in Serbia, albeit on a limited basis:
• Start Labs (http://startlabs.co/), a seed funding provider and acceleration program, offers in-vestments of roughly EUR 50,000 for 10–15% stakes to early stage startups and aims to help them obtain their next funding rounds from angel and venture capital investments domestically and abroad. Over half of the companies supported by Start Labs have obtained funding from sources such as SC Ventures, as well as foreign angel investors and funds. The fund aims to ex-pand its capital base of around EUR 4 million in order to scale up its program.
• The Enterprise Innovation Fund (ENIF, http://wbedif.eu/about-wb-edif/enterprise-innovation-fund-enif ), the EDIF-funded regional fund managed by SC Ventures, with EUR 19 million in capi-tal31, aims to make technology sector investments of EUR 1–2 million, though smaller invest-ments are also possible. Having begun operations in 2015, the fund was in the process of closing its first investment in Serbia at the time of the interviews conducted for this study (January 2016). Both equity and quasi-equity investment structures are available from this fund.
• Blue Sea Capital (http://blueseacap.com ) provides private equity funding to consumer-oriented businesses, and has chosen to focus its first fund, established in 2011, on the private health care industry. The current fund size is EUR 43 million, and 5 of its 8 investments are in the private health care sector, with the other 3 working in consumer food and beverage production (the fund has also made one investment in Croatia). The fund typically takes majority stakes in its companies, and offers a combination of debt and equity financing for each investment.
Serbian startups also benefit from equity finance from regional players, especially funds and startup ac-celerators from Bulgaria. Unfortunately, many of the early stage equity providers from abroad require relocation of the startups, effectively moving the businesses out of Serbia. Public equity markets are not a common source of funding for SMEs. The Belgrade Stock Exchange has a market capitalization of EUR 2.4 billion, and covers both debt and equity securities. Typical monthly turnover for the exchange amounts to EUR 15–20 million32. The exchange has just 42 listings from 30 National Bank of Serbia (2015) Financial Leasing Sector in Serbia, Third Quarter Report 2015 31 Current capital figure as reported by SC Ventures during the onsite interview. The target fund size, as reported by ENIF, is EUR 40 million. 32 Beogradska Berza (2016), Bulletin http://belex.rs/eng/proizvodi_i_usluge/bilten

BFC. Assessment of financing needs of SMEs in Western Balkans countries. Country report: Serbia
22
40 issuers (large corporates).33 In February 2016 the Belgrade Stock Exchange became a member of the EBRD-sponsored SEE Link, a regional network for securities trading, which also includes Bulgaria, Mace-donia, and Croatia.34
4.3 Characteristics of funding recipients 4.3.1 Loans Access to loans is the strongest for larger SMEs, especially those working in the capital-intensive manu-facturing sector, which tend to have stronger collateral profiles and officially report more of their in-comes. Banks tend to view the trade and construction sectors as more risky, and while loans to these sectors are available, these borrowers are less preferred. Nonetheless, the breakdown of SME loans by economic sector roughly reflects the makeup of the SME sector overall. The following table shows the average breakdown of MSME loans by economic sector as of June 2015, based on data collected through a survey of five banks conducted for this study:
Table 4. SME lending by economic sector, June 2015 Sector Proportion of SME loans Agriculture 13% Manufacturing 33% Services 19% Trade 26% Other 10% TOTAL 100%
Source: BFC survey of five banks Startups and microenterprises have the lowest level of access to loan funding. Banks typically require at least one year of financial statements in order to finance an enterprise. Microenterprises lack access to loans due to the virtual absence of a microfinance industry in Serbia, and banks’ general discomfort with underwriting loans based on undocumented income. With the exit of ProCredit Bank from the micro-finance market, Opportunity Bank is the only bank serving microenterprises at scale. During interviews conducted for this study, banks displayed a high level of awareness of the lack of microfinance supply, and some have begun to develop products in order to target this market. Though banking services are somewhat concentrated in the capital of Belgrade, the country is well cov-ered with bank branches. Banks interviewed for this study reported that most, if not all, branches in their networks have dedicated SME lending specialists on staff. Development-oriented Opportunity Bank specifically focuses on less developed regions in the center and south of Serbia.
4.3.2 Equity finance Venture capital funds target primarily technology firms, with little overall funding available to startups outside of the technology sector. Private equity firms, as well as potential private equity investors from abroad, prefer to invest in consumer businesses, especially the fast-growing private health care sector. The small number of equity finance providers is concentrated in Belgrade.
4.3.3 Leasing Due to the predominance of vehicle fleet leasing, the transport sector (grouped with warehousing and information and communications in national statistics) accounts for over a third of Serbia’s outstanding leases, with the trade sector holding another 16.0%, manufacturing (along with mining and water sup-
33 Beogradska Berza (2016), Open Market http://belex.rs/eng/trzista_i_hartije/trzista/open/akcije 34 SEE Link (2016), Ljubljana and Belgrade Stock Exchanged and 14 Investment Companies Admitted to See Link http://see-link.net/news/current-news/ljubljana-and-belgrade-stock-exchanges-and-14-investment-companies-admitted-to-see-link/64

BFC. Assessment of financing needs of SMEs in Western Balkans countries. Country report: Serbia
23
ply) at 14.4%, agriculture at 10.4%, and construction at 6.0%35 (it should be noted that national statistics cover enterprises of all sizes, and are not only reflective of SME financing). Because leasing companies operate alongside banks owned by their parent companies, they are able to leverage bank branches to distribute leasing products throughout the country.
4.4 Institutional and regulatory issues 4.4.1 Issues for banks Banks interviewed for this study reported being somewhat restricted by tight central bank regulations enacted to curb non-performing loans, decrease reliance on foreign currency funding, and encourage lending in order to boost economic growth:
• The central bank’s policies to encourage local currency lending, including restrictions on the cur-rency used for transaction accounts (and therefore overdraft loans), have created dinar liquidity problems for banks. Though dinar reserve requirements are very low compared to foreign cur-rency reserve requirements (5% vs. 20% as of March 2016), banks still sometimes have trouble meeting them, and some reported regularly obtaining overnight funds at above-market rates in order to meet the requirements.
• Several banks complained that the government interest rate subsidies cannibalized SME loans that would have otherwise been made at market rates, and created a major drop in demand in 2015 when clients waited for the next tranche of the program to borrow.
4.4.2 Issues for microfinance institutions Microfinance providers, and other non-bank financial institutions, are not able to function without rout-ing their transactions through commercial banks due to the absence of a law allowing such institutions to exist. The central bank has expressed a hesitance to pass a non-bank financial institution law in fear of exacerbating the problem with non-performing loans in the banking system, as well as due to the negative experience of the Bosnian market with non-bank financial institutions. USAID has been actively promoting the establishment of a non-bank financial institution law in order to improve access to fi-nance for micro-entrepreneurs, and has sponsored a working group on the subject.
4.5 Funding of intermediaries 4.5.1 Banks Banks are funded primarily through deposits (63.7% of total assets as of 2014) and capital (20.7% of as-sets at 2014), with deposits fully covering outstanding loans, keeping the funding of intermediaries from becoming a major constraint to loan financing for SMEs. This is especially the case for banks that are subsidiaries of international financial institutions, which have access to additional liquidity from abroad. Domestic banks, which are beginning to more aggressively pursue growth as they work through their legacy non-performing loan portfolios, are somewhat more concerned with access to funding. Driven by the central bank’s push to “dinarize” the economy (certain loan types such as overdrafts and loans under the national subsidy programs must be issued in dinars), banks have recently become con-strained by a lack of access to local currency funding, the sources of which are essentially restricted to transaction deposit accounts of businesses and equity capital.
4.5.2 Leasing companies Because most of the leasing companies in Serbia are subsidiaries of international banking organizations, they obtain the majority of their funding from parent companies, as well as from development financial institutions for special programs such as energy efficient equipment leases.
35 National Bank of Serbia (2015) Financial Leasing Sector in Serbia, Third Quarter Report 2015

BFC. Assessment of financing needs of SMEs in Western Balkans countries. Country report: Serbia
24
4.5.3 Equity funds With the exception of ENIF, equity funds are financed primarily through private individuals. Blue Sea Capital, the only local private equity fund, is funded entirely by international and local private individu-als, and Start Labs, the only local venture capital firm, is funded by individuals from the technology sec-tor. The fund managers interviewed for this study mentioned having an interest in receiving funding from development financial institutions, but have thus far been unable to obtain such funds. Because the pipelines of equity funds are currently small, with few investable organizations identified in Serbia, access to additional funding for the funds is not a large constraint for SME access to equity fi-nance; however, the situation may change as the market rapidly evolves. The government Innovation Fund, a startup grant provider, was previously financed by the European Union’s Instrument for Pre-accession Assistance, but has since lost this source of funding having fully used up its grant budget. The organization was looking for a new source of financing during the time of the interview conducted for this study.
4.5.4 Government The government is a source of funding for banks, but not for other financial intermediaries, providing funding primarily in the form of deposits from government agencies and public companies. Government SME lending programs have had a significant effect on improving the borrowing conditions for SMEs in the recent past. The following loan programs are especially noteworthy:
• The government used a broad-based interest rate subsidy for businesses to spur lending in 2014, offering term working capital loans with rates capped at 3.0% including fees with an 18-month maturity and six-month grace period. The loans were issued through commercial banks in local currency. A total of EUR 150 million in loans was generated through the 2014 program, and the central bank reported that another EUR 100 million tranche is planned for 2016. Not all banks interviewed for this study believed that the subsidy increased lending volumes, stating that the discounted loans largely cannibalized market rate loans; however, banks felt pressure to offer non-subsidized products with conditions more closely resembling the program (lower interest rates and longer maturities for working capital) after the program’s end in order to con-tinue lending.
• Agricultural loan guarantees in the Vojvodina region (around EUR 10 million of guaranteed loans outstanding in 2013), subsidized loans for agricultural producers in Vojvodina by the Vojvodina Provincial Fund for Agricultural Development (EUR 15 million outstanding in 2013) through two partner banks, and warehouse receipt-backed loans by the Indemnity Fund of Serbia utilizing public commodity warehouses have encouraged the private financing market to develop prod-ucts specifically for agriculture.36
• The 2015 government’s small but effective enterprise equipment purchase program, which in-cluded an interest rate subsidy component and a grant component (the lower of 25% of the purchase price or EUR 20,000 with total grant funding of EUR 4 million) effectively increased the supply of affordable investment loans through banks.
4.5.5 Development finance institutions Development finance institutions actively provide funding for lending and sometimes leasing, to SMEs with EIB, EBRD, EFSE, IFC, and KfW actively providing credit lines for on lending to SMEs as well as more targeted business groups such as farmers. Given the falling interest rate environment, sufficient level of market liquidity, and influence of government subsidy programs mentioned above, development fi-nance institution funding is less important in Serbia under present conditions. Banks interviewed for this study complained that due in part to the slow processing of credit agreements with the development
36 USAID (2013), Agricultural Finance in Serbia – Status and Recommendations
BFC. Assessment of financing needs of SMEs in Western Balkans countries. Country report: Serbia
25
finance institutions, the terms of the agreements struggle to keep up with market conditions and bor-rowing line capacities frequently go unused for this reason. The most notable involvement of a development finance institutions in funding equity finance is EDIF’s backing of SC Ventures, as described earlier in this section.
4.5.6 Parent banks Among the 29 banks located in Serbia, 21 are owned by foreign parent companies, allowing them access to a steady source of liquidity from these larger parent institutions. Four of Serbia’s five largest banks are subsidiaries of foreign banks. This creates a strong backup funding source for the banking system overall. Parent bank funding is estimated to account for 6.7% of the total assets of the five largest for-eign-owned banks, based on figures reported in the banks’ audited financial statements, and has de-clined from an estimated 8.6% in 201337.
4.5.7 Local commercial sources Deposits are the main local source of funding for banks, making up 63.7% of the sector’s assets38, with deposits from local households representing the greatest portion of this at 58.0% of the total as of 2014. Most deposits are very short term (64.0% up to 6 months and only 9.0% over a year) and are denomi-nated in euros (66.0% of the total), largely reflecting the preference of households for short term-euro denominated deposits. Borrowings, at 0.1% of assets as of 2014, are essentially not used and subordi-nated debt, at 2.4%, is also relatively low.
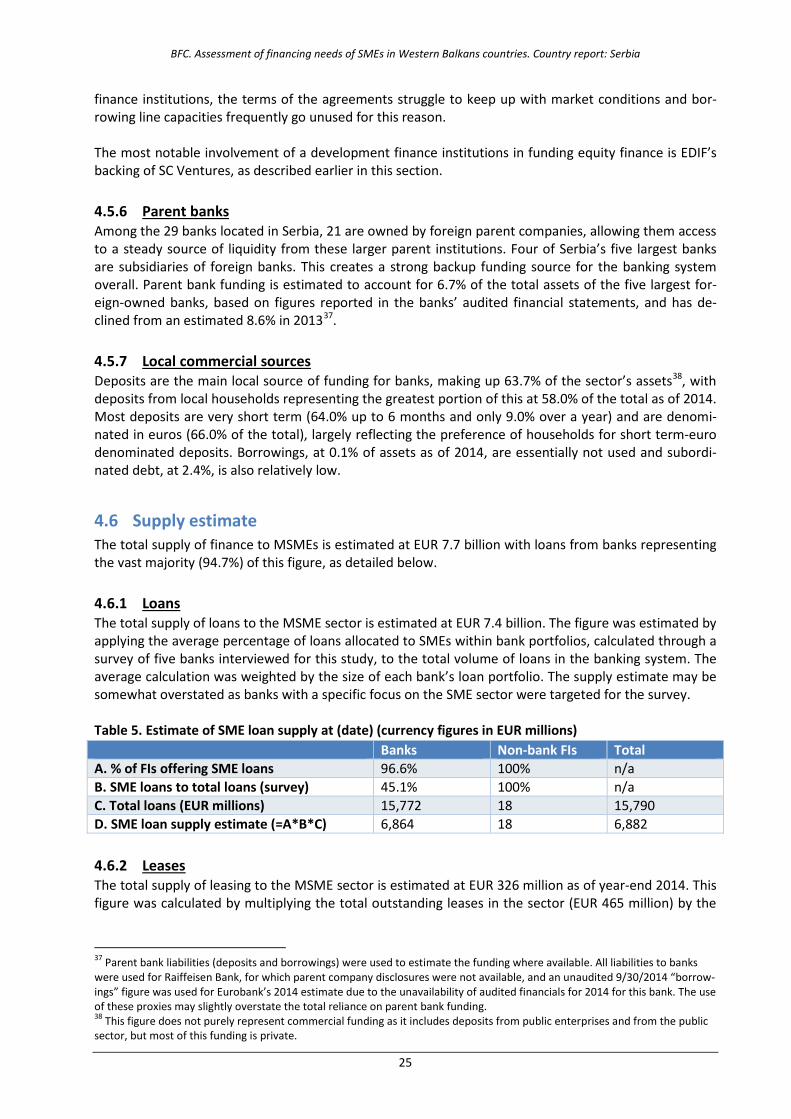
4.6 Supply estimate The total supply of finance to MSMEs is estimated at EUR 7.7 billion with loans from banks representing the vast majority (94.7%) of this figure, as detailed below.
4.6.1 Loans The total supply of loans to the MSME sector is estimated at EUR 7.4 billion. The figure was estimated by applying the average percentage of loans allocated to SMEs within bank portfolios, calculated through a survey of five banks interviewed for this study, to the total volume of loans in the banking system. The average calculation was weighted by the size of each bank’s loan portfolio. The supply estimate may be somewhat overstated as banks with a specific focus on the SME sector were targeted for the survey. Table 5. Estimate of SME loan supply at (date) (currency figures in EUR millions) Banks Non-bank FIs Total A. % of FIs offering SME loans 96.6% 100% n/a B. SME loans to total loans (survey) 45.1% 100% n/a C. Total loans (EUR millions) 15,772 18 15,790 D. SME loan supply estimate (=A*B*C) 6,864 18 6,882
4.6.2 Leases The total supply of leasing to the MSME sector is estimated at EUR 326 million as of year-end 2014. This figure was calculated by multiplying the total outstanding leases in the sector (EUR 465 million) by the
37 Parent bank liabilities (deposits and borrowings) were used to estimate the funding where available. All liabilities to banks were used for Raiffeisen Bank, for which parent company disclosures were not available, and an unaudited 9/30/2014 “borrow-ings” figure was used for Eurobank’s 2014 estimate due to the unavailability of audited financials for 2014 for this bank. The use of these proxies may slightly overstate the total reliance on parent bank funding. 38 This figure does not purely represent commercial funding as it includes deposits from public enterprises and from the public sector, but most of this funding is private.

BFC. Assessment of financing needs of SMEs in Western Balkans countries. Country report: Serbia
26
estimated proportion of leases allocated to SMEs (70%) as reported by the market-leading leasing com-pany interviewed for this study.
4.6.3 Equity The supply of equity and quasi-equity finance for SMEs can be estimated at roughly EUR 66 million, which represents the sum of the three venture capital and private equity funds active in the Serbian market, as discussed in section 5.2 above. This figure is somewhat overstated by the fact that these funds make investments in other countries in the region, but because most investments have thus far been in Serbia and because the estimate excludes individual equity providers (for example, members of Serbia’s Private Equity Association), the rough estimate is an acceptable benchmark.

BFC. Assessment of financing needs of SMEs in Western Balkans countries. Country report: Serbia
27
5 Gaps in private sector financing Key findings: • While a sufficient overall volume of loans is available, the demand for longer term and local currency
loans outweighs supply • Microenterprises do not have sufficient access to finance due to the absence of a microfinance indus-
try and the lack of interest of banks in the sector • There is a supply and demand gap for loans without collateral requirements, especially for startups • Because the equity finance industry has only recently emerged in Serbia, with a small amount of eq-
uity capital available, a supply and demand gap for equity finance is not apparent; however, demand may begin to outweigh supply as awareness of the financing option spreads.
• The most significant gap in intermediary financing is for longer term and local currency funds in banks
• The supply of leasing finance appears to meet demand at its current low level Based on the quantitative analysis conducted for this study, no overall gap in the supply of financing of MSMEs was identified (the supply estimate amounted to EUR 6.8 billion, while demand was estimated at EUR 4.5 billion). Nonetheless, qualitative analysis and interviews revealed that there is a financing gap due to the absence of micro lending, as banks prefer making larger loans, historically microfinance-focused ProCredit bank has moved away from the micro business sector, and the MFIs do not generate any meaningful loan volumes due to regulatory restrictions. Additionally, gaps in startup funding for in-dustries other than technology exist, as banks generally do not lend to startups and early stage equity and grant financing sources favor the technology industry. While supply and demand gaps for non-loan products such as leasing, equity finance and trade finance were not identified in spite of the low supply of these services, the lack of gaps appears to be driven by limited awareness of these products in the market. Increased supply of these products coupled with tar-geted awareness building and financial education efforts for SMEs would likely drive significant growth in the use of these products by the sector.
5.1 Gaps by instrument Summary of gaps by instrument
Small Moderate Large
Loans
Leases
Equity
Trade finance
5.1.1 Loans A sufficient volume of loans is available to SMEs overall, with banks competing aggressively for loans to the segment. Loan rejections are rather infrequent – the 2013 World Bank Enterprise Survey found that only 2.4% of enterprises have been rejected for a loan compared to an 8.5% average in Eastern Europe and Central Asia. Nonetheless, supply and demand gaps exist in the following loan types:
• SME loans of less than EUR 50,000 are offered on a limited basis, and the supply is not sufficient to meet demand.

BFC. Assessment of financing needs of SMEs in Western Balkans countries. Country report: Serbia
28
• The availability of unsecured loans does not meet demand due to the growing popularity of this product.
• Local currency loans, though not in high demand, are limited by the low availability of local cur-rency funding to banks.
• Long term loans, especially in local currency, are limited by the very short-term nature of bank funding. Stakeholders reported instances of SMEs using working capital loans for investment purposes due to the unavailability of other funding.
5.1.2 Leasing The current supply of leasing products appears to be sufficient to cover the modest demand for the products, which is kept at a low level by the limited awareness of the product.
5.1.3 Equity finance Financing gaps in equity finance are difficult to estimate because of the new and dynamic nature of this financing source and its target market:
• The number of startups in Serbia has grown in the past few years, and venture capital (early and slightly later stage) funds have emerged along with the startups, but the ecosystem is only about three years old. Sufficient equity financing is currently available as the new equity provid-ers attempt to deploy their capital, but additional funding may become needed at a later stage.
• Private equity, which targets later stage companies, has been available for less than 5 years, and the only local fund present on the market has not yet begun to exit from its initial set of invest-ments. Due to the historic lack of supply of private equity in the market, awareness of it is low, driving the lack of comfort level with this financing type among SMEs. As stakeholders continue to pursue awareness-raising activities and success stories of private equity investments emerge, demand for it is likely to increase, creating more space for additional funds.
5.2 Gaps by type of SME Summary of gaps by SME type
Small Moderate Large
Medium
Small
Micro
Agriculture
Startups
Remote areas
Informal
The two largest SME groups that lack access to finance are microenterprises, especially those with lack-ing collateral and undocumented income, and non-technical startups:
• The smallest SMEs with unreported income have the weakest access to loans due to the lack of interest of the banking sector and the absence of a microfinance industry, creating the most im-portant gap in lending. Low access to collateral among this group exacerbates its financing gap, as banks are generally reluctant to make unsecured loans. Though onsite interviews showed an increased awareness of this gap by banks, additional donor support to spur lending to smaller companies may be warranted.

BFC. Assessment of financing needs of SMEs in Western Balkans countries. Country report: Serbia
29
• Startups outside of the technology sector do not have access to funding aside from equity from informal sources. Banks generally do not lend to companies less than a year old, and venture capital funds focus on technology exclusively. The lack of collateral availability for this group fur-ther exacerbates the issue.
Aside from the financing gap for non-technology sector startups and microenterprises mentioned above, economic sector-specific financing gaps are not apparent.
5.3 Gaps in funding of intermediaries 5.3.1 Banks Though banks have adequate access to funding in absolute terms, the funding available to them tends to be too short term to adequately fund longer-term loans without taking on undue maturity gap risk, and funding in local currency is insufficient. A change in the funding structure of banks is needed to en-able them to provide longer-term loans at scale.
5.3.2 Leasing companies Because leasing companies operate on a small scale, do not face currency restrictions, and have access to funding from their parent companies, they have access to sufficient financing to meet the limited demand for leasing in the country.
5.3.3 Equity funds At less than five years old, the equity fund industry is still in its pilot stage, with the small number of funds on the market just beginning to place money and build awareness of equity as a financing mecha-nism in the country. Given the dynamic nature of the industry, it is difficult to estimate a financing gap for equity funds at a given point in time. Nonetheless, both of the non-donor supported funds expressed an intention to seek additional funding in the near future. In addition, there is a need for an additional source of small grant financing for early stage startups, such as the grants previously offered by the In-novation Fund.
5.4 Potential and capability of IFIs to fill gaps Current donor programs, in conjunction with the government, are making major strides in improving SME finance, both through improving lending conditions and through building an equity finance market. International donor support programs for SME finance are detailed below:
• EBRD provides financing to SMEs through targeted credit lines to banks and leasing companies, as well as a risk sharing mechanism for loans to rural businesses via a microfinance institution. EBRD also provides financing directly to Serbian agricultural businesses, but these investments benefit larger agricultural producers and processors. Through its Advice for Small Business pro-gram, EBRD also offers direct technical assistance to SMEs in the food and beverage, trade, re-tail distribution, construction, and engineering sectors by providing them with consulting ser-vices for a range of topics, including governance and process improvement.
• The EIB Group provides MSME financing to banks in Serbia both through dedicated bank loans, as well as through apex facilities administered by the central bank (the most recent apex loan was for EUR 150 million). Most of the bank’s EUR 1.5 billion in funding to the country is targeted toward SME finance. EIB is involved in the leasing sector, having provided loan funding to Raif-feisen Leasing and UniCredit Leasing. EIB also invests in other SME support facilities, including EFSE (described below), and the EDIF (as discussed earlier in this report). The guarantee facility within EDIF is working with ProCredit Bank Serbia with a guaranteed portfolio amount of EUR 30 million. In addition, a new (2016) agreement between EIF and ProCredit Bank as part of the Eu-

BFC. Assessment of financing needs of SMEs in Western Balkans countries. Country report: Serbia
30
ropean Commission’s InnovFin program will facilitate the funding of innovative SMEs in Serbia and other countries in the region by providing a loan portfolio guarantee.39 The EIB Group is also involved in financing projects not related to access to finance, such as a road repair and safety project.
• EFSE offers funding to banks and a leasing for on-lending to MSMEs, with a total of EUR 120 mil-lion in MSME funding provided. The EFSE Development Facility provides technical assistance to partner financial institutions to develop operational capacities and professional management. EFSE has a special focus on microenterprise support, and has partnered with institutions such as Opportunity Bank in Serbia to help the organization reach MSMEs in rural areas.
• IFC provides funding to SMEs through credit lines to commercial banks and leasing companies, including lines specifically intended for agriculture and energy efficiency. Like EBRD, IFC also provides direct funding to agricultural and other large enterprises. IFC’s technical assistance pro-jects in Serbia target financial institution capacity building in energy efficiency lending and cor-porate governance, provide energy efficiency improvement advisory directly to businesses, help with agricultural business food safety capacity building, and work with the public sector to im-prove trade logistics and tax administration procedures.
• KfW finances SMEs through credit lines to banks, including agriculture-specific and energy effi-ciency focused credit lines. Technical assistance projects for KfW typically involve financial insti-tution capacity building provided along with credit lines. KfW also helped set up ProCredit bank, a market leader in SME finance. KfW also offered a credit guarantee fund to three partner insti-tutions in the early 2000’s, but the guarantees were not utilized due to the market dynamics at the time, and the funds were transferred to EFSE.
• USAID’s direct financial assistance to SMEs is limited to its support of Opportunity Bank, totaling USD 11.9 million. USAID also supports SME finance through its Business Enabling Project, which was effective in lobbying to improve the liquidity positions of leasing companies and speed up tax refund timelines for SMEs. Guarantees under USAID’s Development Credit Authority pro-gram are not used in Serbia. Technical assistance to SMEs is provided primarily through USAID’s Private Sector Development Project, which provides consulting and mentoring services to com-panies in the less developed southern regions with the aim of increasing sales and creating addi-tional jobs. The Private Sector Development Project includes a special component for female en-trepreneurship support.
5.5 Recommendations Serbia has strong potential for SME development, especially when it comes to technology (both soft-ware and hardware), but also in other sectors. Given that Serbia is a middle-income economy with a relatively healthy consumer base, supporting startups outside of the technology sector could be instru-mental for job growth and local economic development. By contrast, technology startups have exhibit-ed a tendency to leave the country for larger economic hubs abroad, and local technology companies tend to only provide employment to already sought-after computer science professionals. Youth unem-ployment could particularly be alleviated through support of non-technology entrepreneurship pro-grams. Specifically, IFIs should consider the following interventions for Serbia:
• Support early-stage startups through supplying grant funds similar to those provided by the In-novation Fund, or leverage the existing Innovation Fund infrastructure to provide early stage startup grant funding. The eligibility criteria for such a program should be kept broad enough to not only include software companies, but also cover technology hardware and non-technical businesses.
39 Previously, EIF was managing the European Commission’s Competitiveness and Innovation Programme (CIP), which issued a loan guarantee to Cacanska Banka (now Halk Bank). That programme has since ended.

BFC. Assessment of financing needs of SMEs in Western Balkans countries. Country report: Serbia
31
• Support the development of youth entrepreneurship resulting from new technology developed through universities. The development of a stronger legal basis for public to private intellectual property transfers would be a key to the success of such an effort. Technical assistance funding for the development of business skills among young technology professionals would also be cru-cial to such a program’s success.
• Invest in credit guarantee programs, to allow banks to lend to startups with less than one year
of financial statements and limited collateral.
• To address the financing gap for non-startup microenterprises, provide capacity building assis-tance and a risk-reduction mechanism, such as a guarantee facility, to encourage banks to lend to existing smaller businesses with limited collateral.
• To address the gap in longer-term local currency funding, provide credit lines to banks in a man-
ner that encourages them to make longer-term loans, ideally in local currency.

BFC. Assessment of financing needs of SMEs in Western Balkans countries. Country report: Serbia
32
Annex 1: Macroeconomic indicators Indicator 2015** 2014 2013 2012 2011 GDP (nominal, EUR millions) 33,094.1* 32,408.5 33,914.3 31,607.0 32,670.8 Population (thousands) n/a 7,164.1 7,199.1 7,234.1 7,291.4 GDP (nominal) per capita (EUR) n/a 4,523.7 4,710.9 4,369.2 4,480.7 GDP (PPP) per capita (EUR) n/a 10,427.8 9,440.7 9,705.4 9,716.8 Real GDP growth rate 0.8%* –1.8 2.6 –1.0 1.4 Inflation rate (CPI) 1.9 2.1 7.7 7.3 11.1 Exchange rate (EUR, end of period) 121.6 120.6 114.3 113.4 104.3 Change in exchange rate 0.6 5.5 0.8 8.7 –0.9 Unemployment rate (official) 16.7 22.2 22.1 23.9 23.0 Poverty rate (WB, $1.90 per day) n/a n/a n/a n/a n/a Current account balance (% of GDP) –4.1 –6.0 –6.1 –11.5 –8.3 Trade balance (% of GDP) –13.2 –12.4 –12.1 –17.7 –18.0 Capital account balance (% of GDP) n/a n/a 3.0 –3.3 –0.9 FDI (% of GDP) 4.7 3.7 3.6 2.1 5.5 Central bank reserves (% of GDP) 31.4 35.9 35.7 37.9 39.4 Public debt (% of GDP) n/a 79.3 75.9 81.1 73.8 Fiscal balance (% of GDP) n/a –6.7 –5.6 –7.2 –4.9 Sources: National Bank of Serbia, World Bank Data *Ministry of Finance estimate **As reported by the Ministry of Finance http://mfin.gov.rs/pages/article.php?id=10658
Sectoral distribution of GDP (% of total by value added) Sector/activity 2015 Manufacturing 25.4% Trade and services 18.1% Public administration and defense 13.6% Real estate 10.9% Agriculture 8.4% Construction 5.7% Professional and scientific services 5.7% Information and communication services 5.1% Financial services and insurance 3.8% Arts and entertainment 3.1% TOTAL 100%
Source: Statistical Office of the Republic of Serbia (2016), Quarterly Gross Domestic Product in the Republic of Serbia, 4th Quarter 2015

BFC. Assessment of financing needs of SMEs in Western Balkans countries. Country report: Serbia
33
Annex 2: Financial sector indicators Banking sector indicators
Indicator 2015 2014 2013 Structure of the sector Number of banks by type:
Foreign n/a 21 21 Domestic – state owned n/a 6 6 Domestic – privately owned n/a 2 3 Total banks n/a 29 30
Number of state-owned banks: Assets of SOBs to total bank assets n/a 17.8 18.8 5-bank concentration ratio n/a 53.5 51.7 Bank branches per 100,000 adults40 n/a 30.3 33.6
Financial indicators (EUR millions) Total assets 28,183.7 24,610.3 24,899.4 Total gross loans 16,256.3 15,772.4 14,751.3 Total net loans n/a n/a n/a Total deposits 14,790.6 15,519.9 15,111.8 Total equity 5,022.7 5,089.5 5,201 Total regulatory capital n/a 2,812.6 3,036.8 Total net profit n/a 29.0 –18.5 Financial ratios Capital adequacy:
Tier 1 CAR n/a 17.6 19.3 Total CAR n/a 20.0 20.9 Equity to total assets 17.8 20.7 20.9
Liquidity: Loans to deposits 109.9 101.6 97.6 Growth rate of deposits -4.7 8.4 1.7 Regulatory liquidity ratio n/a 2.2 2.4 Cash and equivalents to assets n/a 16.4 5.8
Profitability: Return on average assets n/a 0.1 –0.1 Return on average equity n/a 0.6 –0.4 Net interest margin n/a 4.3 4.2 Cost-income ratio n/a n/a 66.1
Asset quality: Growth rate of loan portfolio 3.1 12.8 –7.4 NPL ratio n/a 21.4 21.5
Others: Growth rate of total assets 14.5 4.3 –1.2 Bank assets to financial sector assets (%) n/a n/a n/a
40 World Bank Data

BFC. Assessment of financing needs of SMEs in Western Balkans countries. Country report: Serbia
34
Annex 3: The largest lending institutions The largest banks by asset size at December 31, 2014
Bank name Website Assets (EUR 000s) 1 Banca Intesa http://bancaintesa.rs 3,427,280.3 2 Komercijalna Banka http://kombank.com 2,688,126.0 3 Unicredit Bank Serbia http://unicreditbank.rs 2,019,071.3 4 Raiffeisen Banka http://raiffeisenbank.rs 1,654,975.1 5 Societe Generale Banka Srbija http://societegenerale.rs 1,682,628.5 6 AIK banka http://aikbanka.rs 1,279,436.2 7 Eurobank http://eurobank.rs 1,400,729.7 8 Vojvođanska banka http://voban.co.rs 862,885.6 9 Hypo Alpe Adria Bank http://hypo-alpe-adria.rs 1,397,014.9
10 Banka Postanska Stedionica http://posted.co.rs 625,862.4 11 Sberbank http://sberbank.rs 844,809.3 12 Erste Bank http://erstebank.rs 669,071.3 13 Alpha Bank http://alphabankserbia.com 756,517.4 14 ProCredit Bank http://sberbank.rs 562,404.6 15 Credit Agricole Banka Srbija http://creditagricole.rs 528,946.9 16 Piraeus bank http://piraeusbank.rs 513,167.5
Source: National Bank of Serbia The largest MFIs by asset size at 2014 (unspecified month) MFI name Website Assets (EUR 000s)
1 Agro Invest http://agroinvest.org 15,550 2 Micro Development http://mikrorazvoj.rs 2,90441
Source: MixMarket The largest leasing companies by asset size at September 30, 2015 MFI name Website Assets (EUR 000s)
1 UniCredit Leasing https://unicreditbank.rs/en/leasing.html 63,505.7 2 Intesa Leasing http://intesaleasing.rs 60,237.1 3 Sogelease Srbija http://sogelease.rs 50,170.0 4 VB Leasing d.o.o Beograd http://vbleasing.rs 49,642.5 5 Raiffeisen Leasing http://raiffeisen-leasing.rs 46,095.0
Source: National Bank of Serbia
41 As of 2013, latest Mix Market data

BFC. Assessment of financing needs of SMEs in Western Balkans countries. Country report: Serbia
35
Annex 4: World Bank Doing Business Indicators Source: World Bank Group Doing Business 2016
Indicator Rank Ease of doing business 59 Starting a business 65 Dealing with construction permits 139 Getting electricity 63 Registering property 73 Getting credit 59 Protecting investors 81 Paying taxes 143 Trading across borders 23 Enforcing contracts 73 Resolving insolvency 50
Getting credit indicators
Indicator Value Strength of legal rights index (0–10) 5.0 Depth of credit information index (0–6) 7.0 Public registry coverage (% of adults) 0.0 Private bureau coverage 100.0


Economics DepartmentU [email protected]/economics
Information Desk3 +352 4379-220005 +352 4379-62000U [email protected]
European Investment Bank98-100, boulevard Konrad AdenauerL-2950 Luxembourg3 +352 4379-15 +352 437704www.eib.org
© EIB 08/2016 EN © EIB GraphicTeam