september 2017 crisil performance report · 2 housing development finance corporation ... madhya...
TRANSCRIPT
September 2017
CRISIL Performance Report ABS & MBS Pools
CRISIL Performance Report
2
Structured Finance Ratings
Business Development
Krishnan Sitaraman
Senior Director
Tel: +91 22 3342 8070
Email: [email protected]
Apurva Sharma
Senior Rating Analyst
Tel: +91 22 3342 3528
Email: [email protected]
Hitesh Lingwal
CCAP Associate
Tel: +91 22 33423039
Email: [email protected]
Ajit Velonie
Director
Tel: +91 22 4097 8209
Email: [email protected]
Deepanshu Singla
Rating Analyst
Tel: +91 22 3342 3402
Email: [email protected]
Vikram Raj Iyer
CCAP Associate
Tel: +91 22 33423252
Email: [email protected]
Divya Chandran K
Associate Director
Tel: +91 22 3342 3135
Email: [email protected]
Shanu Kumar
Management Trainee
Tel: +91 22 4254 4153
Email: [email protected]
Atal Agarwal
Senior Director
Tel: +91 22 4097 8052
Email: [email protected]
Dolly Parmar
Associate Director
Email: [email protected]
Ruchita Pandya
Associate Director
Email: [email protected]
Hoshil Thapar
Senior Business Development Manager
Email: [email protected]
Pallavi Mitra
Regional Manager
Email: [email protected]
Amit Khare
Regional Manager
Email: [email protected]
Rohit Chugh
Director
Tel: +91 124 672 2117
Email: [email protected]
Hemant J Bilay
Associate Director
Email: [email protected]
Bhawmik Mehta
Associate Director
Email: [email protected]
Abhishek Tandon
Business Development Manager
Email: [email protected]
Subhasree Mitra
Regional Manager
Email: [email protected]
Reema Doshi
Regional Manager
Email: [email protected]
Anand Agarwal
Director
Tel: +91 124 672 2118
Email: [email protected]
Jasmine Arish Chaney
Associate Director
Email: [email protected]
Arihant A Dudhodia
Associate Director
Email: [email protected]
Rupali Pipil
Business Development Officer/Retainer
Email: [email protected]
Sunanda Agarwal
Regional Manager
Email: [email protected]
Bharadwaja Panchagnula
Regional Manager
Email: [email protected]
Viral Malia
Director
Tel: +91 22 3342 3497
Email: [email protected]
Kruti Kaushik Rawal
Associate Director
Email: [email protected]
Rakesh Kumar Seal
Senior Business Development Manager
Email: [email protected]
Pankaj Sharma
Regional Manager
Email: [email protected]
Sanyukta Nagesh Bandekar
Regional Manager
Email: [email protected]
V Rajesh N Rao
Regional Manager
Email: [email protected]
Shruti Bodhankar
Manager
Tel: +91 22 3342 3156
Email: [email protected]
Thara Varghese
Management Trainee
Tel: +91 22 3342 3447
Email: [email protected]
1
Index
Sr. no Contents Page no
1 Review of CRISIL-rated ABS and MBS pools 04
2 Rating Actions 11
3 Commercial Mortage-backed Securities (CMBS) Ratings 16
4 Glossary of Terms Used 17
5 ABS Pools (Initial Pool Details & Pool Performance, as of September 2017 payouts) 20
6 MBS Pools (Initial Pool Details & Pool Performance, as of September 2017 payouts) 44
7 CRISIL Rating Scales 56
CRISIL Performance Report
2
List of ABS originators covered in this publication
Sr. no Originator Name Page no
1 AU Small Finance Bank Limited 22
2 Cholamandalam Investment & Finance Company Limited 23
3 Equitas Small Finance Bank Limited 24
4 ESAF Microfinance and Investments Private Limited 26
5 HDB Financial Services Limited 27
6 Janalakshmi Financial Services Limited 28
7 Magma Fincorp Limited 30
8 Magma ITL Finance Limited 32
9 Mahindra & Mahindra Financial Services Limited 33
10 Multi Originator 34
11 Muthoot Capital Services Limited 35
12 Muthoot Microfin Limited 36
13 Shriram Transport Finance Company Limited 38
14 SREI Equipment Finance Limited 41
15 Tata Motors Finance Limited 42
16 Ujjivan Financial Services Limited 43
List of MBS originators covered in this publication
Sr. no Name of originator Page no
1 Dewan Housing Finance Corporation Limited 46
2 Housing Development Finance Corporation Limited 47
4 ICICI Bank Limited 48
3 Indiabulls Housing Finance Limited 50
5 Reliance Capital Limited 52
6 Reliance Home Finance Private Limited 53
7 Standard Chartered Bank 54
8 Sundaram BNP Paribas Home Finance Limited 55
3
DISCLAIMER
The ratings/credit opinions are not a recommendation to purchase, sell or hold the payouts/facilities in as much as the opinions do
not comment on the market price of the payouts/facilities or its suitability for a particular investor. CRISIL reserves the right to
suspend, withdraw or revise the credit opinions assigned to the payouts/facilities at any time on the basis of new information, or
unavailability of information or other circumstances, which CRISIL believes, may have an impact on the opinions.
The performance update presented in this publication is based on payouts made till June 2017. The ratings/credit opinions
mentioned in this publication are outstanding as on September 30, 2017.
CRISIL has taken due care and caution in preparing this report. Information has been obtained by CRISIL from sources which
considers reliable. However, CRISIL does not guarantee the accuracy, adequacy or completeness of any information, and is not
responsible for any errors in transmission, and especially states that it has no financial liability whatsoever to the subscribers/
users/ transmitters/ distributors of this report.
No part of this report may be reproduced in any form or any means without permission of the publisher.
Contents may be used by news media with due credit to CRISIL.
© CRISIL. All rights reserved.
CRISIL COMPLEXITY LEVELS
CRISIL assigns complexity levels to various types of financial instruments on a voluntary basis. This is a pro-bono exercise aimed
at strengthening Indian capital markets through greater transparency. CRISIL Complexity Levels reflect the ease of understanding
and analysing the risk elements in these instruments and allow investors to gauge the level of sophistication and due diligence
required before investing in any financial product. Instruments are classified into three categories: simple, complex, and highly
complex. This is done using four parameters: ease of calculation of payout and returns, clarity on timing of cash flows, number of
counterparties involved in the transaction, and familiarity of market participants with the instrument. Complexity is distinct from
risk: saying that an instrument is simple is not to say that it is less risky, but the risk will be easier to understand in a simple
instrument than in a complex one. Accordingly, the complexity level applicable to PTC instrument / direct assignment indicated in
the above report is ‘Highly Complex’.
Investors can refer to http://crisil.com/ratings/crisil-complexity-levels-of-financial-instruments.html for more details and a
comprehensive list of CRISIL Complexity Levels or call the Customer Service Helpdesk Toll free number: 1800 267 1301.
CRISIL Performance Report
4
Review of CRISIL-rated securitisation transactions
Executive Summary
CRISIL has analysed the collection performance of 82 asset-backed securities (ABS), 37 mortgage backed securities (MBS) and 2
commercial mortgage backed securities (CMBS), across 28 originators in the securitsation market. The transactions are backed by
commercial vehicles (CV), cars, tractors, construction equipment (CE), secured business loans, two wheeler loans (TW),
microfinance (MFI) loans, home loans (HL) and loan against property (LAP). CRISIL has analysed the performance of the pools at the
asset class level. Key observations after the June 2017 payouts are as below:
Collection performance of CV pools remain resilient
In spite of increased fleet availability and slower economic growth, truck rentals remained resilient between March 2017 and
May 2017 supported by the healthy movement of agricultural produce given the near-record rabi output. Consequently,
collections in CV pools were healthy during the first quarter of fiscal 2018. Performance of newer vintage pools is superior to
that of the pools belonging to earlier vintages. Median 3-month average monthly collection ratio (MCR) for the quarter ended
June 30, 2017 was at ~97%.
Performance of microfinance pools vary based on geographic exposure; a few pools undergoing severe collection stress
Collection efficiencies in microfinance pools, which have limited exposure to poorly performing geographies of Uttar Pradesh,
Maharashtra, Madhya Pradesh and Karnataka, have bounced back from the lows posted in the immediate aftermath of
demonetization. However, pools originated by certain NBFC-MFIs remain under severe collection stress, even several months
post-demonetisation. MCR of these pools have remained persistently low at 70%-75%.
Prepayments on an up-trend in mortgage pools
Higher levels of prepayments were observed in mortgage pools in the first quarter of fiscal 2018 compared to earlier periods.
Overdues remain negligible.
Other asset-backed pools show stable performance
Collections across other asset backed pools like small business loans, car, CE and tractor remain stable.
CMBS transactions continue to enjoy healthy interest coverage ratio
So far in fiscal 2018, CRISIL has upgraded ratings on 22 instruments issued under securitisation transactions due to improving
credit collateral cover with higher amortization. Ratings on 15 instruments backed by microfinance loan receivables have been
downgraded / placed on watch, because of weak asset quality and stressed performance.
5
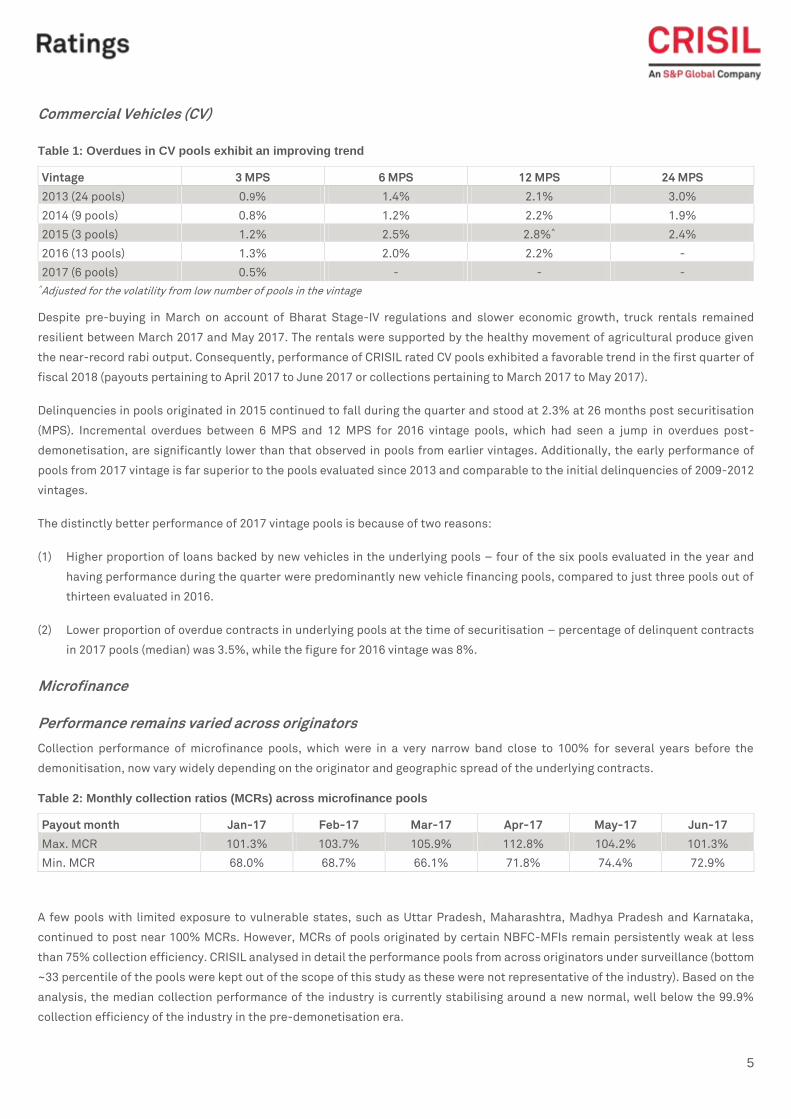
Commercial Vehicles (CV)
Table 1: Overdues in CV pools exhibit an improving trend
Vintage 3 MPS 6 MPS 12 MPS 24 MPS
2013 (24 pools) 0.9% 1.4% 2.1% 3.0%
2014 (9 pools) 0.8% 1.2% 2.2% 1.9%
2015 (3 pools) 1.2% 2.5% 2.8%^ 2.4%
2016 (13 pools) 1.3% 2.0% 2.2% -
2017 (6 pools) 0.5% - - -
^Adjusted for the volatility from low number of pools in the vintage
Despite pre-buying in March on account of Bharat Stage-IV regulations and slower economic growth, truck rentals remained
resilient between March 2017 and May 2017. The rentals were supported by the healthy movement of agricultural produce given
the near-record rabi output. Consequently, performance of CRISIL rated CV pools exhibited a favorable trend in the first quarter of
fiscal 2018 (payouts pertaining to April 2017 to June 2017 or collections pertaining to March 2017 to May 2017).
Delinquencies in pools originated in 2015 continued to fall during the quarter and stood at 2.3% at 26 months post securitisation
(MPS). Incremental overdues between 6 MPS and 12 MPS for 2016 vintage pools, which had seen a jump in overdues post-
demonetisation, are significantly lower than that observed in pools from earlier vintages. Additionally, the early performance of
pools from 2017 vintage is far superior to the pools evaluated since 2013 and comparable to the initial delinquencies of 2009-2012
vintages.
The distinctly better performance of 2017 vintage pools is because of two reasons:
(1) Higher proportion of loans backed by new vehicles in the underlying pools – four of the six pools evaluated in the year and
having performance during the quarter were predominantly new vehicle financing pools, compared to just three pools out of
thirteen evaluated in 2016.
(2) Lower proportion of overdue contracts in underlying pools at the time of securitisation – percentage of delinquent contracts
in 2017 pools (median) was 3.5%, while the figure for 2016 vintage was 8%.
Microfinance
Performance remains varied across originators
Collection performance of microfinance pools, which were in a very narrow band close to 100% for several years before the
demonitisation, now vary widely depending on the originator and geographic spread of the underlying contracts.
Table 2: Monthly collection ratios (MCRs) across microfinance pools
Payout month Jan-17 Feb-17 Mar-17 Apr-17 May-17 Jun-17
Max. MCR 101.3% 103.7% 105.9% 112.8% 104.2% 101.3%
Min. MCR 68.0% 68.7% 66.1% 71.8% 74.4% 72.9%
A few pools with limited exposure to vulnerable states, such as Uttar Pradesh, Maharashtra, Madhya Pradesh and Karnataka,
continued to post near 100% MCRs. However, MCRs of pools originated by certain NBFC-MFIs remain persistently weak at less
than 75% collection efficiency. CRISIL analysed in detail the performance pools from across originators under surveillance (bottom
~33 percentile of the pools were kept out of the scope of this study as these were not representative of the industry). Based on the
analysis, the median collection performance of the industry is currently stabilising around a new normal, well below the 99.9%
collection efficiency of the industry in the pre-demonetisation era.
CRISIL Performance Report
6
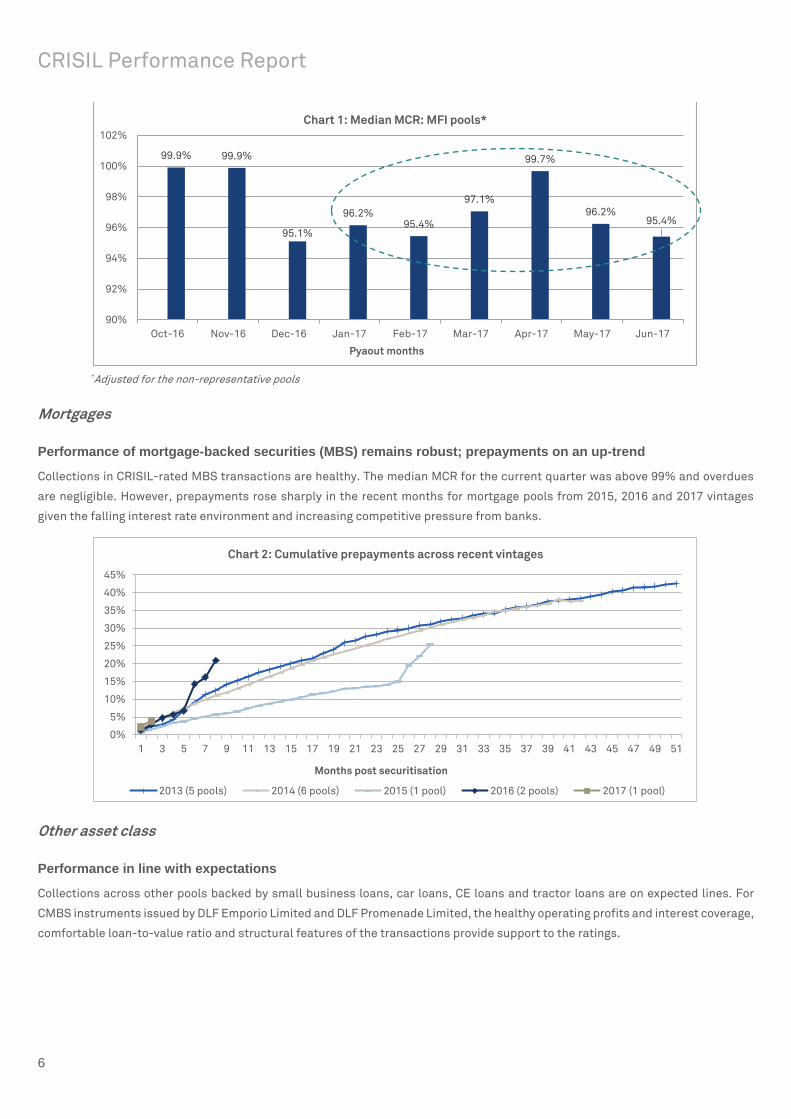
*Adjusted for the non-representative pools
Mortgages
Performance of mortgage-backed securities (MBS) remains robust; prepayments on an up-trend
Collections in CRISIL-rated MBS transactions are healthy. The median MCR for the current quarter was above 99% and overdues
are negligible. However, prepayments rose sharply in the recent months for mortgage pools from 2015, 2016 and 2017 vintages
given the falling interest rate environment and increasing competitive pressure from banks.
Other asset class
Performance in line with expectations
Collections across other pools backed by small business loans, car loans, CE loans and tractor loans are on expected lines. For
CMBS instruments issued by DLF Emporio Limited and DLF Promenade Limited, the healthy operating profits and interest coverage,
comfortable loan-to-value ratio and structural features of the transactions provide support to the ratings.
99.9% 99.9%
95.1%
96.2%95.4%
97.1%
99.7%
96.2%95.4%
90%
92%
94%
96%
98%
100%
102%
Oct-16 Nov-16 Dec-16 Jan-17 Feb-17 Mar-17 Apr-17 May-17 Jun-17
Pyaout months
Chart 1: Median MCR: MFI pools*
0%
5%
10%
15%
20%
25%
30%
35%
40%
45%
1 3 5 7 9 11 13 15 17 19 21 23 25 27 29 31 33 35 37 39 41 43 45 47 49 51
Months post securitisation
Chart 2: Cumulative prepayments across recent vintages
2013 (5 pools) 2014 (6 pools) 2015 (1 pool) 2016 (2 pools) 2017 (1 pool)
7
Conclusion
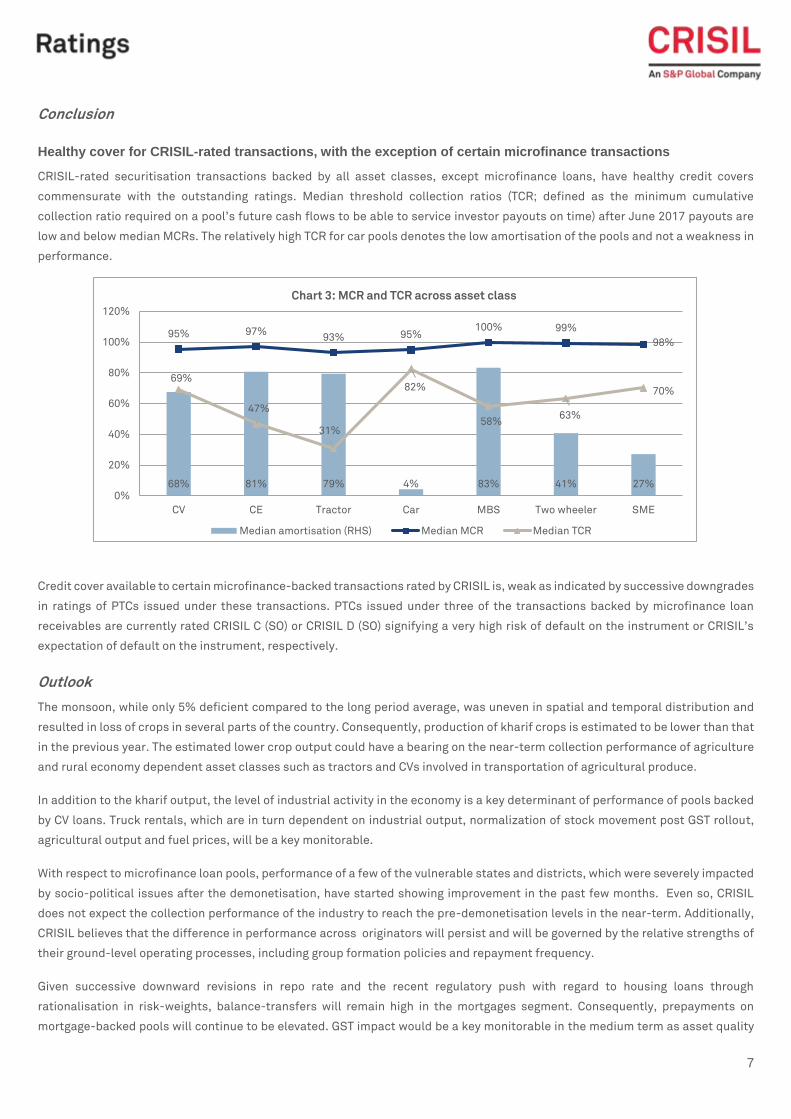
Healthy cover for CRISIL-rated transactions, with the exception of certain microfinance transactions
CRISIL-rated securitisation transactions backed by all asset classes, except microfinance loans, have healthy credit covers
commensurate with the outstanding ratings. Median threshold collection ratios (TCR; defined as the minimum cumulative
collection ratio required on a pool’s future cash flows to be able to service investor payouts on time) after June 2017 payouts are
low and below median MCRs. The relatively high TCR for car pools denotes the low amortisation of the pools and not a weakness in
performance.
Credit cover available to certain microfinance-backed transactions rated by CRISIL is, weak as indicated by successive downgrades
in ratings of PTCs issued under these transactions. PTCs issued under three of the transactions backed by microfinance loan
receivables are currently rated CRISIL C (SO) or CRISIL D (SO) signifying a very high risk of default on the instrument or CRISIL’s
expectation of default on the instrument, respectively.
Outlook
The monsoon, while only 5% deficient compared to the long period average, was uneven in spatial and temporal distribution and
resulted in loss of crops in several parts of the country. Consequently, production of kharif crops is estimated to be lower than that
in the previous year. The estimated lower crop output could have a bearing on the near-term collection performance of agriculture
and rural economy dependent asset classes such as tractors and CVs involved in transportation of agricultural produce.
In addition to the kharif output, the level of industrial activity in the economy is a key determinant of performance of pools backed
by CV loans. Truck rentals, which are in turn dependent on industrial output, normalization of stock movement post GST rollout,
agricultural output and fuel prices, will be a key monitorable.
With respect to microfinance loan pools, performance of a few of the vulnerable states and districts, which were severely impacted
by socio-political issues after the demonetisation, have started showing improvement in the past few months. Even so, CRISIL
does not expect the collection performance of the industry to reach the pre-demonetisation levels in the near-term. Additionally,
CRISIL believes that the difference in performance across originators will persist and will be governed by the relative strengths of
their ground-level operating processes, including group formation policies and repayment frequency.
Given successive downward revisions in repo rate and the recent regulatory push with regard to housing loans through
rationalisation in risk-weights, balance-transfers will remain high in the mortgages segment. Consequently, prepayments on
mortgage-backed pools will continue to be elevated. GST impact would be a key monitorable in the medium term as asset quality
68% 81% 79% 4% 83% 41% 27%
95% 97%93% 95%
100% 99%
98%
69%
47%
31%
82%
58%63%
70%
0%
20%
40%
60%
80%
100%
120%
CV CE Tractor Car MBS Two wheeler SME
Chart 3: MCR and TCR across asset class
Median amortisation (RHS) Median MCR Median TCR

CRISIL Performance Report
8
challenges could arise in the LAP segment as Small & Medium Enterprises (SMEs) align their business processes to conform to the
GST regime.
CRISIL closely monitors the performance of all the rated pools until investor payouts are made in full, and disseminates the
ratings/credit opinions through its quarterly publications and press releases in a timely manner. The ratings/credit opinions
represent CRISIL’s view on the transactions as on September 30, 2017.
9
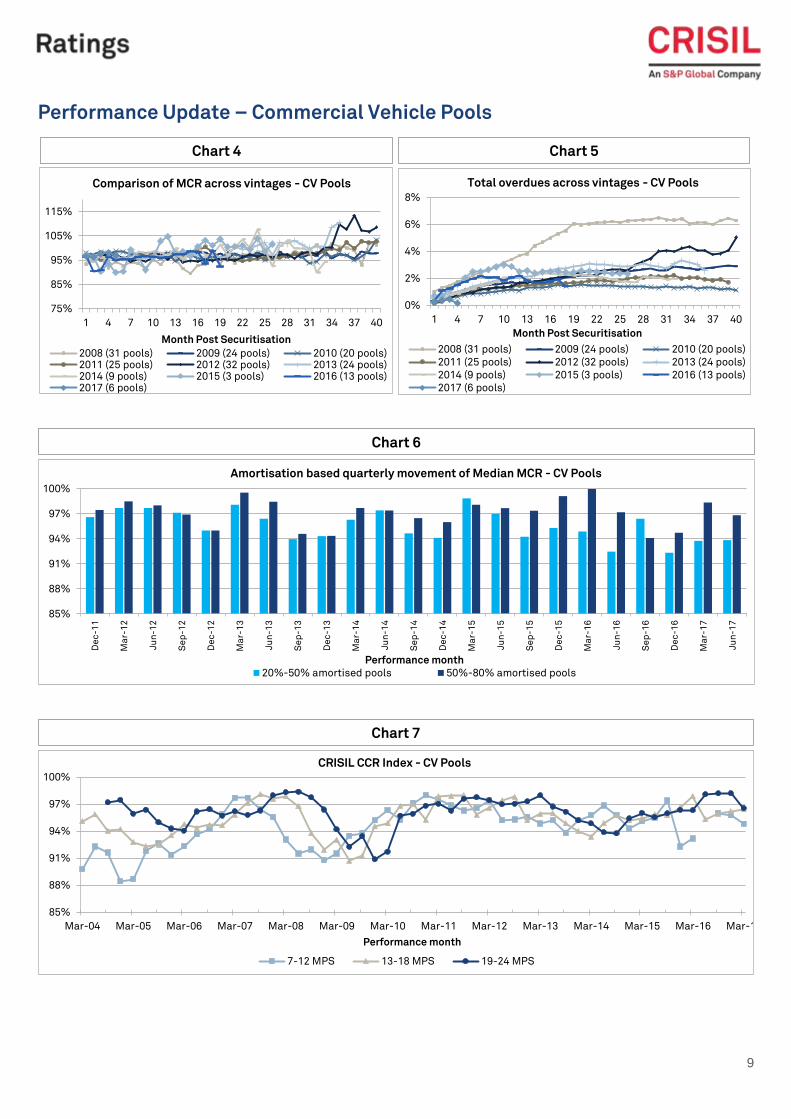
Performance Update – Commercial Vehicle Pools
Chart 4
75%
85%
95%
105%
115%
1 4 7 10 13 16 19 22 25 28 31 34 37 40
Comparison of MCR across vintages - CV Pools
2008 (31 pools) 2009 (24 pools) 2010 (20 pools)2011 (25 pools) 2012 (32 pools) 2013 (24 pools)2014 (9 pools) 2015 (3 pools) 2016 (13 pools)2017 (6 pools)
Month Post Securitisation
Chart 5
0%
2%
4%
6%
8%
1 4 7 10 13 16 19 22 25 28 31 34 37 40
Total overdues across vintages - CV Pools
2008 (31 pools) 2009 (24 pools) 2010 (20 pools)
2011 (25 pools) 2012 (32 pools) 2013 (24 pools)
2014 (9 pools) 2015 (3 pools) 2016 (13 pools)
2017 (6 pools)
Month Post Securitisation
Chart 6
85%
88%
91%
94%
97%
100%
De
c-1
1
Ma
r-1
2
Ju
n-1
2
Se
p-1
2
De
c-1
2
Ma
r-1
3
Ju
n-1
3
Se
p-1
3
De
c-1
3
Ma
r-1
4
Ju
n-1
4
Se
p-1
4
De
c-1
4
Ma
r-1
5
Ju
n-1
5
Se
p-1
5
De
c-1
5
Ma
r-1
6
Ju
n-1
6
Se
p-1
6
De
c-1
6
Ma
r-1
7
Ju
n-1
7
Performance month
Amortisation based quarterly movement of Median MCR - CV Pools
20%-50% amortised pools 50%-80% amortised pools
85%
88%
91%
94%
97%
100%
Mar-04 Mar-05 Mar-06 Mar-07 Mar-08 Mar-09 Mar-10 Mar-11 Mar-12 Mar-13 Mar-14 Mar-15 Mar-16 Mar-17
Performance month
CRISIL CCR Index - CV Pools
7-12 MPS 13-18 MPS 19-24 MPS
Chart 7
CRISIL Performance Report
10
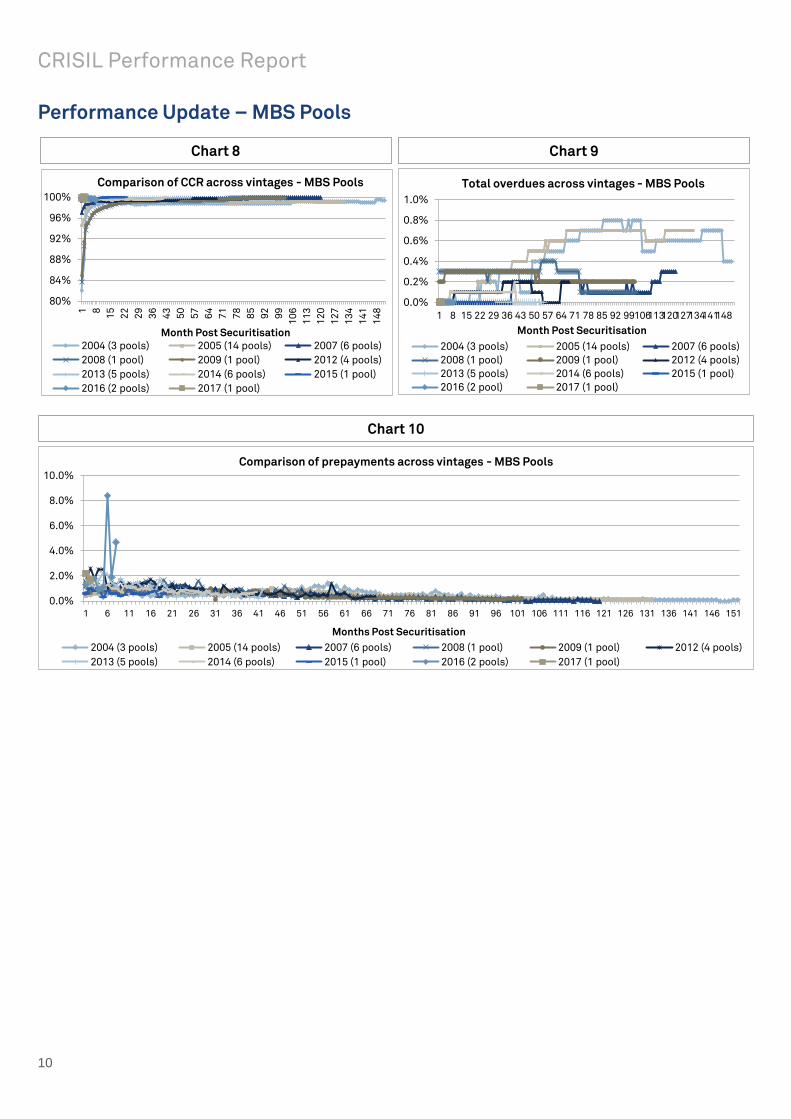
Performance Update – MBS Pools
Chart 8
80%
84%
88%
92%
96%
100%
1 8
15
22
29
36
43
50
57
64
71
78
85
92
99
10
6
11
3
12
0
12
7
13
4
14
1
14
8
Comparison of CCR across vintages - MBS Pools
2004 (3 pools) 2005 (14 pools) 2007 (6 pools)
2008 (1 pool) 2009 (1 pool) 2012 (4 pools)
2013 (5 pools) 2014 (6 pools) 2015 (1 pool)
2016 (2 pools) 2017 (1 pool)
Month Post Securitisation
Chart 9
0.0%
0.2%
0.4%
0.6%
0.8%
1.0%
1 8 15 22 29 36 43 50 57 64 71 78 85 92 99106113120127134141148
Total overdues across vintages - MBS Pools
2004 (3 pools) 2005 (14 pools) 2007 (6 pools)
2008 (1 pool) 2009 (1 pool) 2012 (4 pools)
2013 (5 pools) 2014 (6 pools) 2015 (1 pool)
2016 (2 pool) 2017 (1 pool)
Month Post Securitisation
Chart 10
0.0%
2.0%
4.0%
6.0%
8.0%
10.0%
1 6 11 16 21 26 31 36 41 46 51 56 61 66 71 76 81 86 91 96 101 106 111 116 121 126 131 136 141 146 151
Comparison of prepayments across vintages - MBS Pools
2004 (3 pools) 2005 (14 pools) 2007 (6 pools) 2008 (1 pool) 2009 (1 pool) 2012 (4 pools)
2013 (5 pools) 2014 (6 pools) 2015 (1 pool) 2016 (2 pools) 2017 (1 pool)
Months Post Securitisation
11
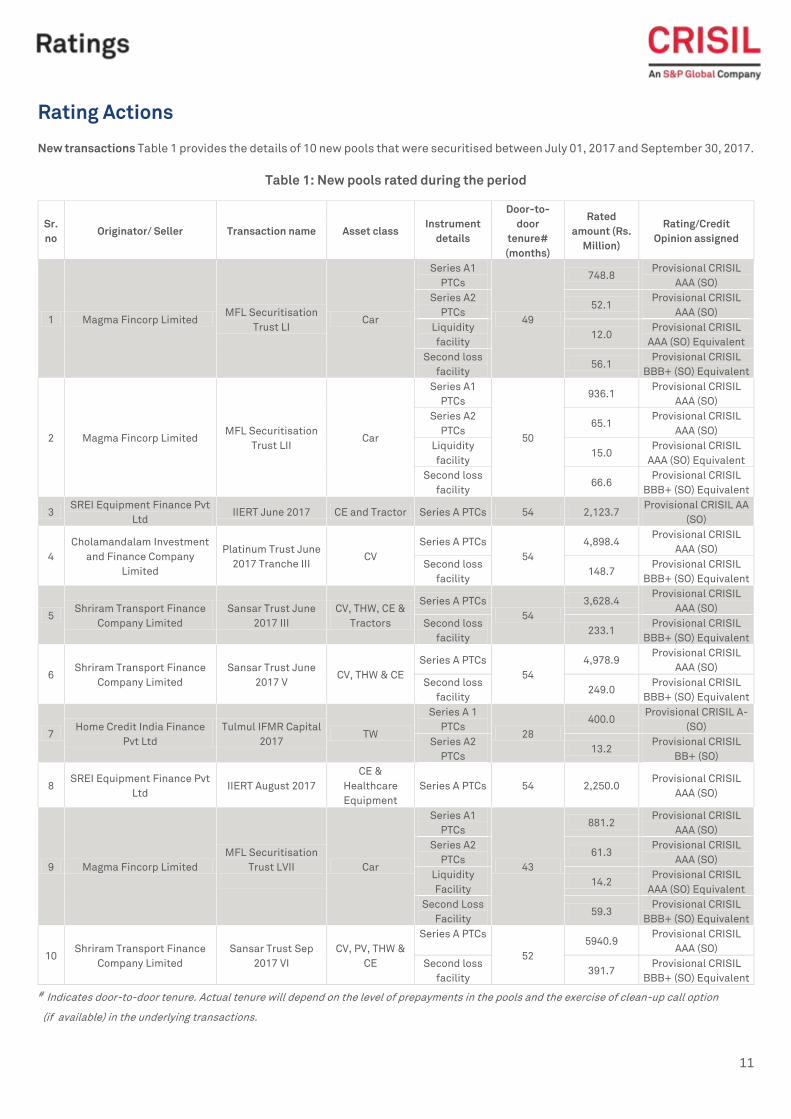
Rating Actions
New transactions Table 1 provides the details of 10 new pools that were securitised between July 01, 2017 and September 30, 2017.
Table 1: New pools rated during the period
# Indicates door-to-door tenure. Actual tenure will depend on the level of prepayments in the pools and the exercise of clean-up call option
(if available) in the underlying transactions.
Sr.
no Originator/ Seller Transaction name Asset class
Instrument
details
Door-to-
door
tenure#
(months)
Rated
amount (Rs.
Million)
Rating/Credit
Opinion assigned
1 Magma Fincorp Limited MFL Securitisation
Trust LI Car
Series A1
PTCs
49
748.8 Provisional CRISIL
AAA (SO)
Series A2
PTCs 52.1
Provisional CRISIL
AAA (SO)
Liquidity
facility 12.0
Provisional CRISIL
AAA (SO) Equivalent
Second loss
facility 56.1
Provisional CRISIL
BBB+ (SO) Equivalent
2 Magma Fincorp Limited MFL Securitisation
Trust LII Car
Series A1
PTCs
50
936.1 Provisional CRISIL
AAA (SO)
Series A2
PTCs 65.1
Provisional CRISIL
AAA (SO)
Liquidity
facility 15.0
Provisional CRISIL
AAA (SO) Equivalent
Second loss
facility 66.6
Provisional CRISIL
BBB+ (SO) Equivalent
3 SREI Equipment Finance Pvt
Ltd IIERT June 2017 CE and Tractor Series A PTCs 54 2,123.7
Provisional CRISIL AA
(SO)
4
Cholamandalam Investment
and Finance Company
Limited
Platinum Trust June
2017 Tranche III CV
Series A PTCs
54
4,898.4 Provisional CRISIL
AAA (SO)
Second loss
facility 148.7
Provisional CRISIL
BBB+ (SO) Equivalent
5 Shriram Transport Finance
Company Limited
Sansar Trust June
2017 III
CV, THW, CE &
Tractors
Series A PTCs
54
3,628.4 Provisional CRISIL
AAA (SO)
Second loss
facility 233.1
Provisional CRISIL
BBB+ (SO) Equivalent
6 Shriram Transport Finance
Company Limited
Sansar Trust June
2017 V CV, THW & CE
Series A PTCs
54
4,978.9 Provisional CRISIL
AAA (SO)
Second loss
facility 249.0
Provisional CRISIL
BBB+ (SO) Equivalent
7 Home Credit India Finance
Pvt Ltd
Tulmul IFMR Capital
2017 TW
Series A 1
PTCs 28
400.0 Provisional CRISIL A-
(SO)
Series A2
PTCs 13.2
Provisional CRISIL
BB+ (SO)
8 SREI Equipment Finance Pvt
Ltd IIERT August 2017
CE &
Healthcare
Equipment
Series A PTCs 54 2,250.0 Provisional CRISIL
AAA (SO)
9 Magma Fincorp Limited
MFL Securitisation
Trust LVII
Car
Series A1
PTCs
43
881.2 Provisional CRISIL
AAA (SO)
Series A2
PTCs 61.3
Provisional CRISIL
AAA (SO)
Liquidity
Facility 14.2
Provisional CRISIL
AAA (SO) Equivalent
Second Loss
Facility 59.3
Provisional CRISIL
BBB+ (SO) Equivalent
10 Shriram Transport Finance
Company Limited
Sansar Trust Sep
2017 VI
CV, PV, THW &
CE
Series A PTCs
52
5940.9 Provisional CRISIL
AAA (SO)
Second loss
facility 391.7
Provisional CRISIL
BBB+ (SO) Equivalent
CRISIL Performance Report
12
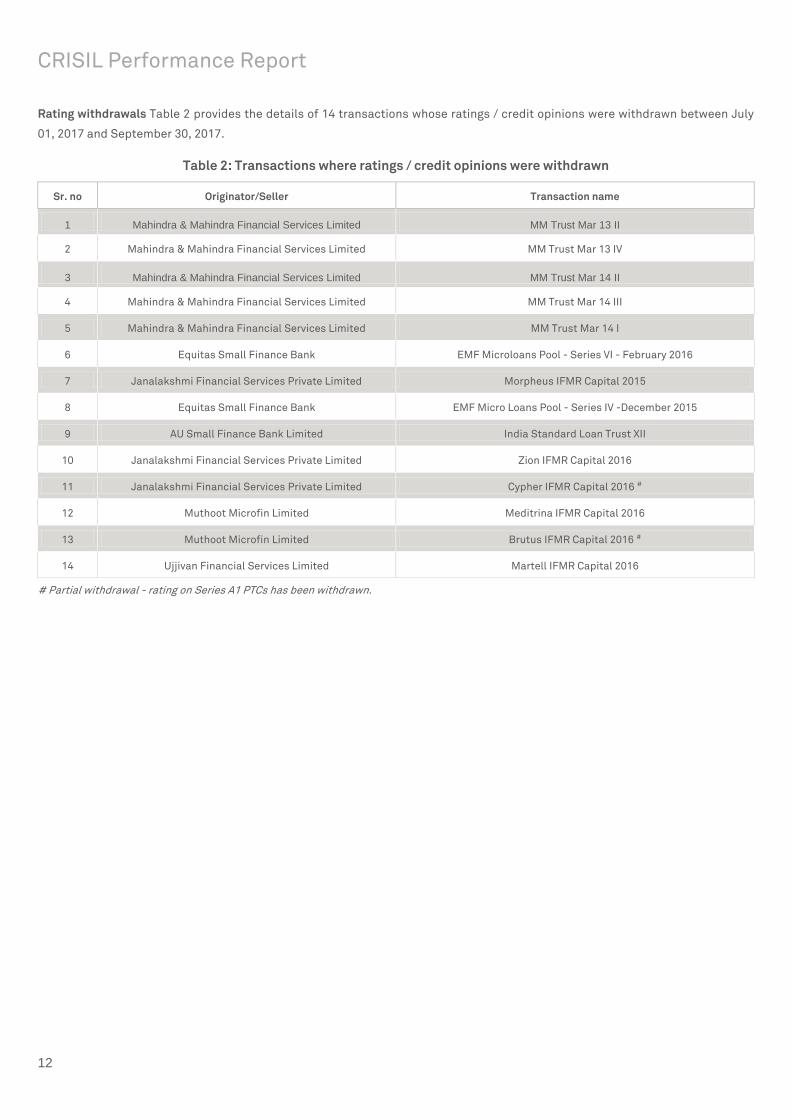
Rating withdrawals Table 2 provides the details of 14 transactions whose ratings / credit opinions were withdrawn between July
01, 2017 and September 30, 2017.
Table 2: Transactions where ratings / credit opinions were withdrawn
Sr. no Originator/Seller Transaction name
1 Mahindra & Mahindra Financial Services Limited MM Trust Mar 13 II
2 Mahindra & Mahindra Financial Services Limited MM Trust Mar 13 IV
3 Mahindra & Mahindra Financial Services Limited MM Trust Mar 14 II
4 Mahindra & Mahindra Financial Services Limited MM Trust Mar 14 III
5 Mahindra & Mahindra Financial Services Limited MM Trust Mar 14 I
6 Equitas Small Finance Bank EMF Microloans Pool - Series VI - February 2016
7 Janalakshmi Financial Services Private Limited Morpheus IFMR Capital 2015
8 Equitas Small Finance Bank EMF Micro Loans Pool - Series IV -December 2015
9 AU Small Finance Bank Limited India Standard Loan Trust XII
10 Janalakshmi Financial Services Private Limited Zion IFMR Capital 2016
11 Janalakshmi Financial Services Private Limited Cypher IFMR Capital 2016 #
12 Muthoot Microfin Limited Meditrina IFMR Capital 2016
13 Muthoot Microfin Limited Brutus IFMR Capital 2016 #
14 Ujjivan Financial Services Limited Martell IFMR Capital 2016
# Partial withdrawal - rating on Series A1 PTCs has been withdrawn.
13
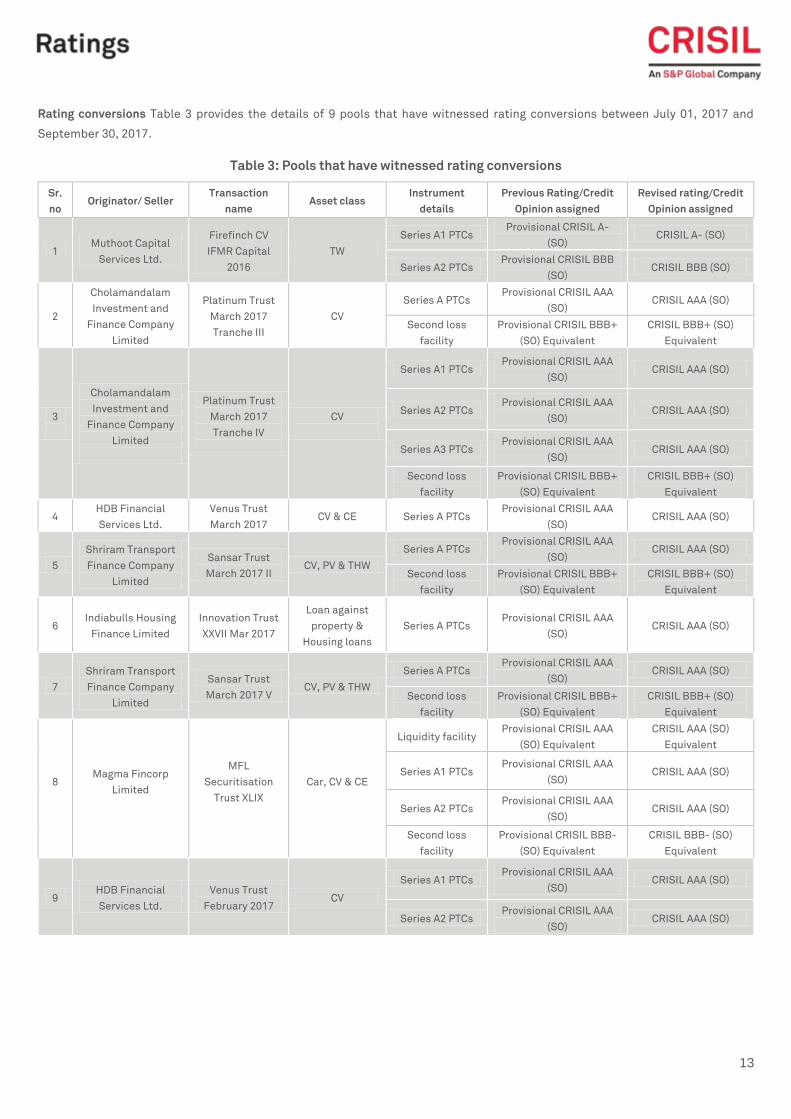
Rating conversions Table 3 provides the details of 9 pools that have witnessed rating conversions between July 01, 2017 and
September 30, 2017.
Table 3: Pools that have witnessed rating conversions
Sr.
no Originator/ Seller
Transaction
name Asset class
Instrument
details
Previous Rating/Credit
Opinion assigned
Revised rating/Credit
Opinion assigned
1 Muthoot Capital
Services Ltd.
Firefinch CV
IFMR Capital
2016
TW
Series A1 PTCs Provisional CRISIL A-
(SO) CRISIL A- (SO)
Series A2 PTCs Provisional CRISIL BBB
(SO) CRISIL BBB (SO)
2
Cholamandalam
Investment and
Finance Company
Limited
Platinum Trust
March 2017
Tranche III
CV
Series A PTCs Provisional CRISIL AAA
(SO) CRISIL AAA (SO)
Second loss
facility
Provisional CRISIL BBB+
(SO) Equivalent
CRISIL BBB+ (SO)
Equivalent
3
Cholamandalam
Investment and
Finance Company
Limited
Platinum Trust
March 2017
Tranche IV
CV
Series A1 PTCs Provisional CRISIL AAA
(SO) CRISIL AAA (SO)
Series A2 PTCs Provisional CRISIL AAA
(SO) CRISIL AAA (SO)
Series A3 PTCs Provisional CRISIL AAA
(SO) CRISIL AAA (SO)
Second loss
facility
Provisional CRISIL BBB+
(SO) Equivalent
CRISIL BBB+ (SO)
Equivalent
4 HDB Financial
Services Ltd.
Venus Trust
March 2017 CV & CE Series A PTCs
Provisional CRISIL AAA
(SO) CRISIL AAA (SO)
5
Shriram Transport
Finance Company
Limited
Sansar Trust
March 2017 II CV, PV & THW
Series A PTCs Provisional CRISIL AAA
(SO) CRISIL AAA (SO)
Second loss
facility
Provisional CRISIL BBB+
(SO) Equivalent
CRISIL BBB+ (SO)
Equivalent
6 Indiabulls Housing
Finance Limited
Innovation Trust
XXVII Mar 2017
Loan against
property &
Housing loans
Series A PTCs Provisional CRISIL AAA
(SO) CRISIL AAA (SO)
7
Shriram Transport
Finance Company
Limited
Sansar Trust
March 2017 V CV, PV & THW
Series A PTCs Provisional CRISIL AAA
(SO) CRISIL AAA (SO)
Second loss
facility
Provisional CRISIL BBB+
(SO) Equivalent
CRISIL BBB+ (SO)
Equivalent
8
Magma Fincorp
Limited
MFL
Securitisation
Trust XLIX
Car, CV & CE
Liquidity facility Provisional CRISIL AAA
(SO) Equivalent
CRISIL AAA (SO)
Equivalent
Series A1 PTCs Provisional CRISIL AAA
(SO) CRISIL AAA (SO)
Series A2 PTCs Provisional CRISIL AAA
(SO) CRISIL AAA (SO)
Second loss
facility
Provisional CRISIL BBB-
(SO) Equivalent
CRISIL BBB- (SO)
Equivalent
9 HDB Financial
Services Ltd.
Venus Trust
February 2017 CV
Series A1 PTCs Provisional CRISIL AAA
(SO) CRISIL AAA (SO)
Series A2 PTCs Provisional CRISIL AAA
(SO) CRISIL AAA (SO)
CRISIL Performance Report
14
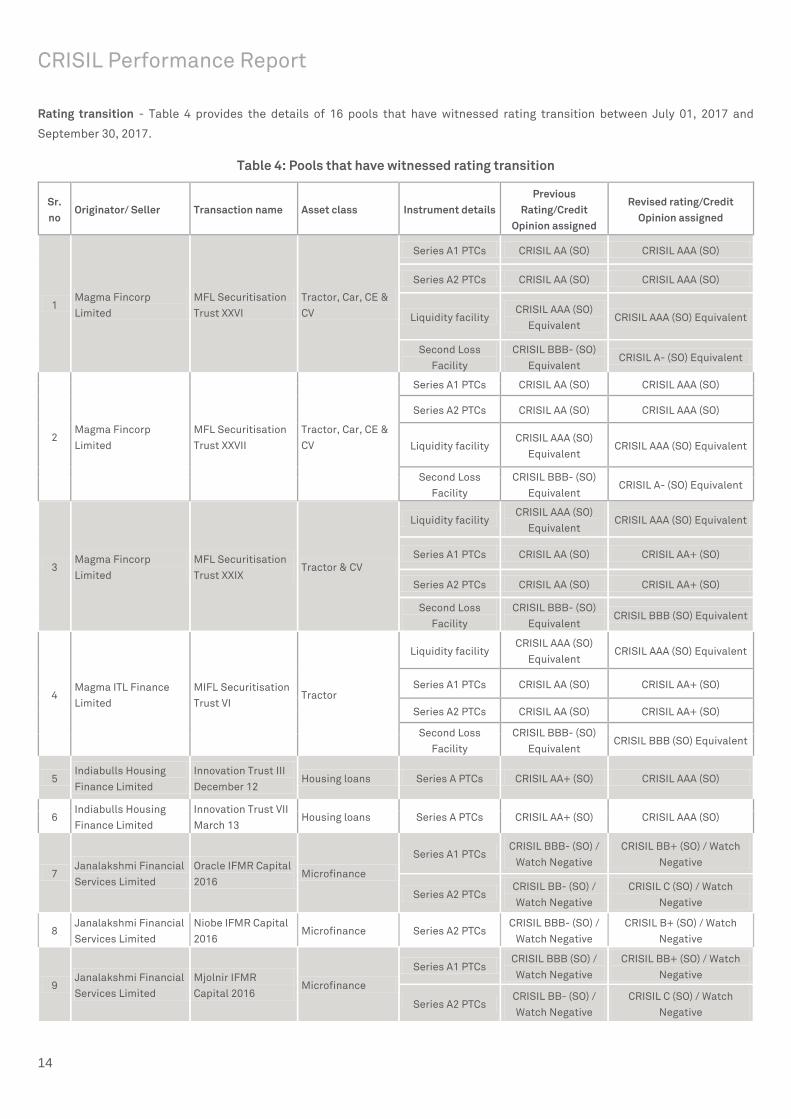
Rating transition - Table 4 provides the details of 16 pools that have witnessed rating transition between July 01, 2017 and
September 30, 2017.
Table 4: Pools that have witnessed rating transition
Sr.
no Originator/ Seller Transaction name Asset class Instrument details
Previous
Rating/Credit
Opinion assigned
Revised rating/Credit
Opinion assigned
1 Magma Fincorp
Limited
MFL Securitisation
Trust XXVI
Tractor, Car, CE &
CV
Series A1 PTCs CRISIL AA (SO) CRISIL AAA (SO)
Series A2 PTCs CRISIL AA (SO) CRISIL AAA (SO)
Liquidity facility CRISIL AAA (SO)
Equivalent CRISIL AAA (SO) Equivalent
Second Loss
Facility
CRISIL BBB- (SO)
Equivalent CRISIL A- (SO) Equivalent
2 Magma Fincorp
Limited
MFL Securitisation
Trust XXVII
Tractor, Car, CE &
CV
Series A1 PTCs CRISIL AA (SO) CRISIL AAA (SO)
Series A2 PTCs CRISIL AA (SO) CRISIL AAA (SO)
Liquidity facility CRISIL AAA (SO)
Equivalent CRISIL AAA (SO) Equivalent
Second Loss
Facility
CRISIL BBB- (SO)
Equivalent CRISIL A- (SO) Equivalent
3 Magma Fincorp
Limited
MFL Securitisation
Trust XXIX Tractor & CV
Liquidity facility CRISIL AAA (SO)
Equivalent CRISIL AAA (SO) Equivalent
Series A1 PTCs CRISIL AA (SO) CRISIL AA+ (SO)
Series A2 PTCs CRISIL AA (SO) CRISIL AA+ (SO)
Second Loss
Facility
CRISIL BBB- (SO)
Equivalent CRISIL BBB (SO) Equivalent
4 Magma ITL Finance
Limited
MIFL Securitisation
Trust VI Tractor
Liquidity facility CRISIL AAA (SO)
Equivalent CRISIL AAA (SO) Equivalent
Series A1 PTCs CRISIL AA (SO) CRISIL AA+ (SO)
Series A2 PTCs CRISIL AA (SO) CRISIL AA+ (SO)
Second Loss
Facility
CRISIL BBB- (SO)
Equivalent CRISIL BBB (SO) Equivalent
5 Indiabulls Housing
Finance Limited
Innovation Trust III
December 12 Housing loans Series A PTCs CRISIL AA+ (SO) CRISIL AAA (SO)
6 Indiabulls Housing
Finance Limited
Innovation Trust VII
March 13 Housing loans Series A PTCs CRISIL AA+ (SO) CRISIL AAA (SO)
7 Janalakshmi Financial
Services Limited
Oracle IFMR Capital
2016 Microfinance
Series A1 PTCs CRISIL BBB- (SO) /
Watch Negative
CRISIL BB+ (SO) / Watch
Negative
Series A2 PTCs CRISIL BB- (SO) /
Watch Negative
CRISIL C (SO) / Watch
Negative
8 Janalakshmi Financial
Services Limited
Niobe IFMR Capital
2016 Microfinance Series A2 PTCs
CRISIL BBB- (SO) /
Watch Negative
CRISIL B+ (SO) / Watch
Negative
9 Janalakshmi Financial
Services Limited
Mjolnir IFMR
Capital 2016 Microfinance
Series A1 PTCs CRISIL BBB (SO) /
Watch Negative
CRISIL BB+ (SO) / Watch
Negative
Series A2 PTCs CRISIL BB- (SO) /
Watch Negative
CRISIL C (SO) / Watch
Negative
15
Sr.
no Originator/ Seller Transaction name Asset class Instrument details
Previous
Rating/Credit
Opinion assigned
Revised rating/Credit
Opinion assigned
10 Janalakshmi Financial
Services Limited
Icharus IFMR
Capital 2016 Microfinance
Series A1 PTCs CRISIL BB (SO) /
Watch Negative
CRISIL B- (SO) / Watch
Negative
Series A2 PTCs CRISIL B (SO) /
Watch Negative CRISIL D (SO)
11 Janalakshmi Financial
Services Limited
Architect IFMR
Capital 2016 Microfinance Series A2 PTCs
CRISIL BBB- (SO) /
Watch Negative
CRISIL BB (SO) / Watch
Negative
12 Janalakshmi Financial
Services Limited
Frey IFMR Capital
2016 Microfinance
Series A1 PTCs CRISIL A-
(SO)/Watch negative CRISIL A- (SO)
Series A2 PTCs CRISIL BBB (SO)/
Watch negative CRISIL BBB (SO)
13 Janalakshmi Financial
Services Limited
Sentinel IFMR
Capital 2016 Microfinance
Series A1 PTCs CRISIL BBB+ (SO)/
Watch negative CRISIL BBB+ (SO)
Series A2 PTCs CRISIL BBB (SO)/
Watch negative CRISIL BBB (SO)
14 Equitas Finance Ltd. SME - Pool II -
October 2015
Secured business
loans Series A PTCs CRISIL A- (SO) CRISIL A(SO)
15 Equitas Finance Ltd. SME - Pool III -
February 2016
Secured business
loans Series A1 PTCs CRISIL A- (SO) CRISIL A(SO)
16 Equitas Finance Ltd. SME - Pool Series IV
- March 2016
Secured business
loans Series A PTCs CRISIL A- (SO) CRISIL A(SO)
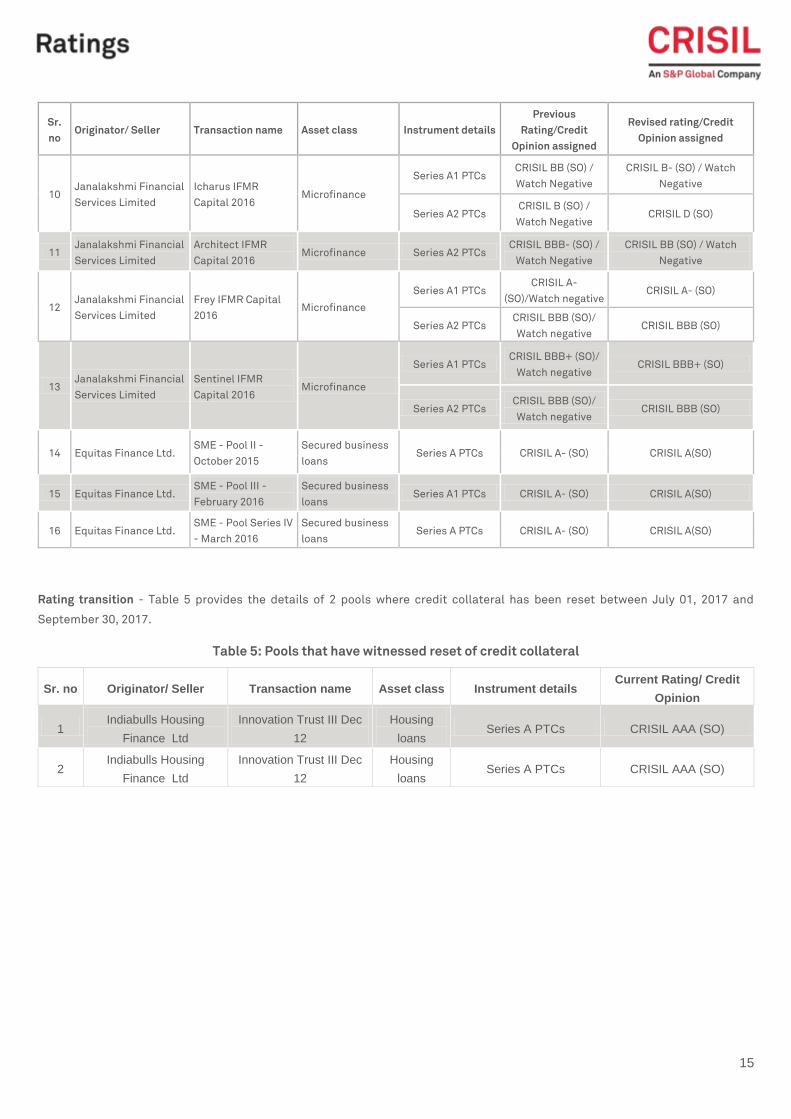
Rating transition - Table 5 provides the details of 2 pools where credit collateral has been reset between July 01, 2017 and
September 30, 2017.
Table 5: Pools that have witnessed reset of credit collateral
Sr. no Originator/ Seller Transaction name Asset class Instrument details Current Rating/ Credit
Opinion
1 Indiabulls Housing
Finance Ltd
Innovation Trust III Dec
12
Housing
loans Series A PTCs CRISIL AAA (SO)
2 Indiabulls Housing
Finance Ltd
Innovation Trust III Dec
12
Housing
loans Series A PTCs CRISIL AAA (SO)
CRISIL Performance Report
16
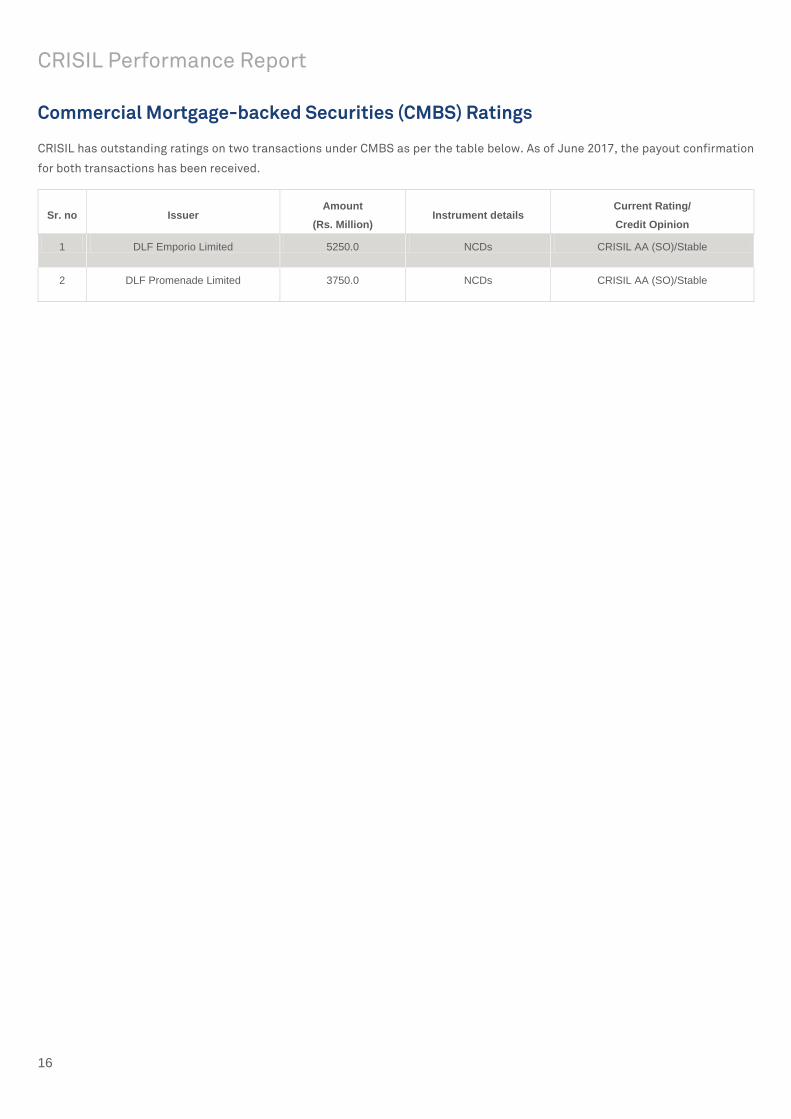
Commercial Mortgage-backed Securities (CMBS) Ratings
CRISIL has outstanding ratings on two transactions under CMBS as per the table below. As of June 2017, the payout confirmation
for both transactions has been received.
Sr. no Issuer Amount
(Rs. Million) Instrument details
Current Rating/
Credit Opinion
1 DLF Emporio Limited 5250.0 NCDs CRISIL AA (SO)/Stable
2 DLF Promenade Limited 3750.0 NCDs CRISIL AA (SO)/Stable
17
Glossary of Terms Used
Originator: The bank or finance company that has originated the pool of receivables.
Pool principal: The sum of principal outstanding for all loans present in the pool at the time of securitisation.
Pool cashflows: The sum of principal and interest outstanding for all loans present in the pool at the time of securitisation.
Investor payouts: The sum of expected principal and interest obligations towards the PTC holders or the acquirer at the time of
securitisation.
Structure: Structure of a transaction can either be at par or at a premium, depending on whether the pool principal is sold at par or
at a premium to investors. Other structural features present in the transaction are appropriately mentioned, for example par with
turbo amortisation, par with Excess interest spread (EIS), par with trapped EIS, par with interest only (IO) strips, etc.
Asset class: The asset(s) that back the securitised receivables.
Asset type: The proportion of new and used assets in the pool at the time of securitisation.
Pool duration: The weighted average balance maturity of cashflows in months. Pool cashflows are taken as weights for the purpose
of calculating the average. In Mortgage-backed securities (MBS) transactions, principal amounts are used as weights.
Weighted average seasoning (WAS): Indicates the weighted average seasoning (in months) of the pool at the time of securitisation.
Weighted average loan-to-value ratio (WAL): The weighted average loan to value (LTV) ratio of the pool at the time of securitisation.
Weighted average yield (WAY): The pool yield at the time of securitisation.
Average yield: The current pool yield, calculated as the internal rate of return (IRR) of the pool cash flows.
Overdue composition: Indicates the proportion of cashflows pertaining to current contracts, one-month overdue contracts and so
on at the time of securitisation.
Weighted average residual maturity (WAM): The weighted average balance maturity of the instrument in months. Monthly payouts to
investors are taken as weights for the purpose of calculating the average.
Credit collateral as % of pool cashflows: The credit collateral stipulated at the time of securitisation as a percentage of future pool
cashflows. In case of MBS transactions, the credit collateral is expressed as a percentage of pool principal.
First loss facility as % of pool cashflows: The first loss credit facilty stipulated at the time of securitisation as a percentage of total
pool cashflows. In case of MBS transactions, the first loss credit facility is expressed as a percentage of pool principal.
Second loss facility as % of pool cashflows: The second loss credit facilty stipulated at the time of securitisation as a percentage
of total pool cashflows. In case of MBS transactions, the second loss credit facility is expressed as a percentage of pool principal.
Liquidity facility as % of pool cashflows: Indicates the liquidity support available to the transaction, expressed as a percentage of
pool cashflows. Some transactions also have an advance payment mechanism, wherein monthly payouts are funded by the liquidity
facility, which will be reflected in a high level of utilisation of liquidity facility. In case of MBS transactions, the liquidity facility is
expressed as a percentage of pool principal.
Scheduled EIS as % of Initial pool cashflows: The embedded cushion available in a transaction on account of the differential between
the pool yield and pass-through rate. This is only available in par structures and is expressed as a percentage of the pool cashflows.
However, in a few structures, this cushion is diluted as the spread is utilised to make certain payouts like charge-offs, servicing
CRISIL Performance Report
18
fees, fees to liquidity provider etc. In such cases the actual cushion available to investors due to EIS may be lower than the amount
stated herein. In case of MBS transactions, the EIS is expressed as a percentage of pool principal.
Subordinated cashflows as % of pool cashflows: In certain transactions, the initial pool cash flows are higher than the total payouts
promised to the investors. This could be on account of either over-collateralisation (initial pool principal being higher than the
principal payouts promised to the investors) or EIS (pool yield being higher than the investor yield). The subordinated cash flows
are computed as the difference between the initial pool cash flows and the total payouts promised to the investors expressed as a
percentage of initial pool cash flows. In case of transactions structured at par with EIS (either flow-back or trapped), the credit
support available in the form of subordinated EIS is reported under Scheduled EIS. However, in case of transactions having over-
collateral and in case of transactions structured at par with turbo amortisation (wherein excess cash flows from the pool are used
to prepay the investor’s principal), the credit support available in the form of subordinated cash flows is reported in this section.
Current rating/credit opinion: The current rating assigned by CRISIL to pass-through certificates (PTCs) issued by the SPV, or the
opinion provided by CRISIL on the credit profile of the acquirer payouts in transactions under the assignment of receivables
programme. The ratings/credit opinions mentioned represent CRISIL’s view on the transactions as on February 28, 2017.
Months post securitisation (MPS): The number of payouts elapsed since securitisation
Pool amortisation: The amortised pool principal, as a percentage of pool principal at the time of securitisation.
Cumulative collection ratio (CCR): The ratio of total collections till date to total billings till date. These billings include initial
overdues in the pool at the time of securitisation except in cases where these overdues are not subordinated. In such cases, the
CCR will be understated to that extent in comparison with other pools.
3 month average monthly collection ratio (MCR): The average of the ratio of monthly collections to monthly billings for the last 3
months. These billings and collections do not include prepayments.
Total Collection Efficiency (TCE): The ratio of monthly collections to monthly billings inclusive of overdue billings. These billings
and collections do not include prepayments.
Cumulative prepayments: The ratio of cumulative prepayments (including partial prepayments, wherever available) in a pool to the
pool principal at the time of securitisation.
90+ delinquencies: The unamortised principal plus the overdues on contracts delinquent for more than 90 days plus loss on sale of
repossessed assets (wherever available) as a percentage of pool principal at the time of securitisation.
180+ delinquencies: The unamortised principal plus the overdues on contracts delinquent for more than 180 days plus loss on sale
of repossessed assets (wherever available) as a percentage of pool principal at the time of securitisation.
1+ overdues: The total overdues in the pool plus loss on sale of repossessed assets (wherever available) as a percentage of pool
principal at the time of securitisation.
90+ overdues: The overdues on contracts delinquent for more than 90 days plus loss on sale of repossessed assets (wherever
available) as a percentage of pool principal at the time of securitisation.
Loss on repossession and sale: Cumulative loss/profit on sale of repossessed asset expressed as a percentage of pool principal at
the time of securitisation.
Credit collateral utilisation: The cumulative credit collateral utilised as a percentage of credit collateral stipulated at the time of
initial rating. In case of transactions that have witnessed reset of credit collateral, the utilisation is expressed as a percentage of
credit collateral available in the transaction subsequent to reset.
19
Current credit collateral as % of future payouts: The credit collateral outstanding outstanding as a percentage of future investor payouts.
In case of MBS transactions, the credit collateral is expressed as a percentage of pool principal.
EIS as % of future payouts: The EIS outstanding as a percentage of future investor payouts. In case of MBS transactions, the credit collateral
is expressed as a percentage of pool principal.
Threshold collection ratio (TCR): The minimum cumulative collection ratio required on a pool’s future cash flows, to be able to service
the investor payouts on time. The lower the TCR, the lesser will be the degree of credit risk in the pool.
Threshold credit coverage (TCC): TCC represents the ratio of threshold credit loss in a pool (1-TCR) to the actual credit loss as on
date, as indicated by the number of contracts/principal outstanding in respect of contracts overdue for more than 180 days
(excluding charged off contracts).
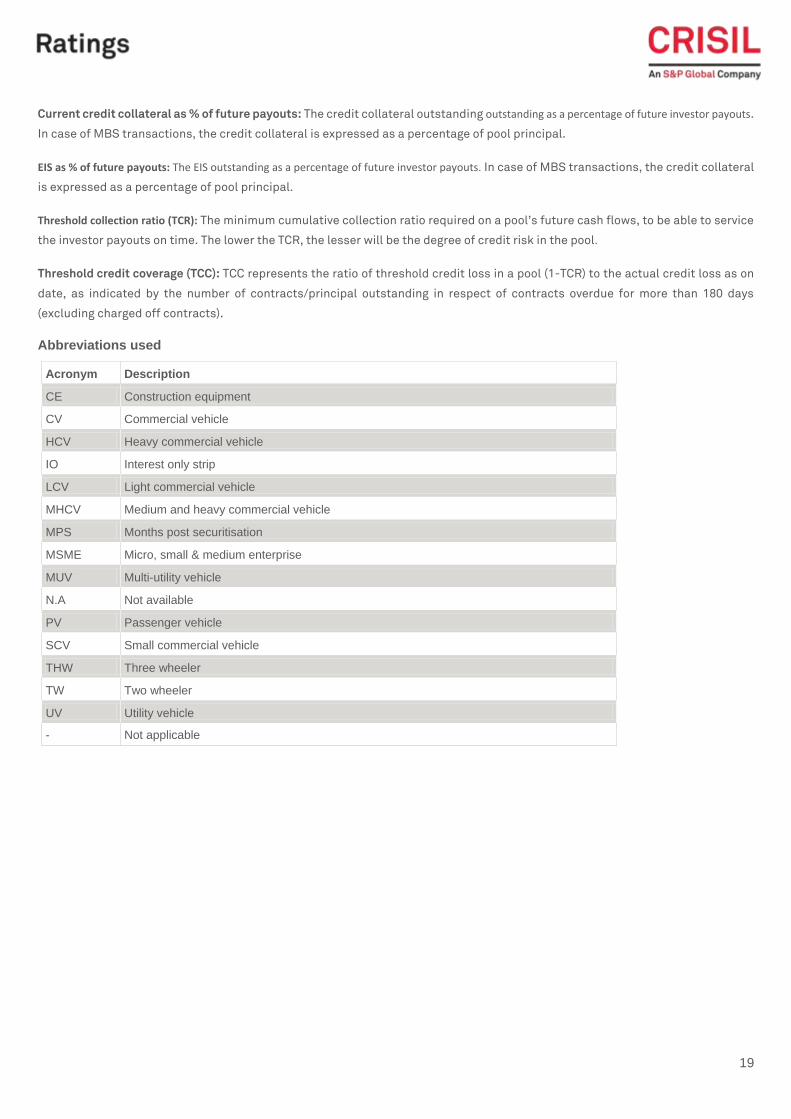
Abbreviations used
Acronym Description
CE Construction equipment
CV Commercial vehicle
HCV Heavy commercial vehicle
IO Interest only strip
LCV Light commercial vehicle
MHCV Medium and heavy commercial vehicle
MPS Months post securitisation
MSME Micro, small & medium enterprise
MUV Multi-utility vehicle
N.A Not available
PV Passenger vehicle
SCV Small commercial vehicle
THW Three wheeler
TW Two wheeler
UV Utility vehicle
- Not applicable

CRISIL Performance Report
20
Asset – backed Securities

19
19
Classification: INTERNAL: CONFIDENTIAL
This page has been intentionally left blank
22
Classification: INTERNAL: CONFIDENTIAL
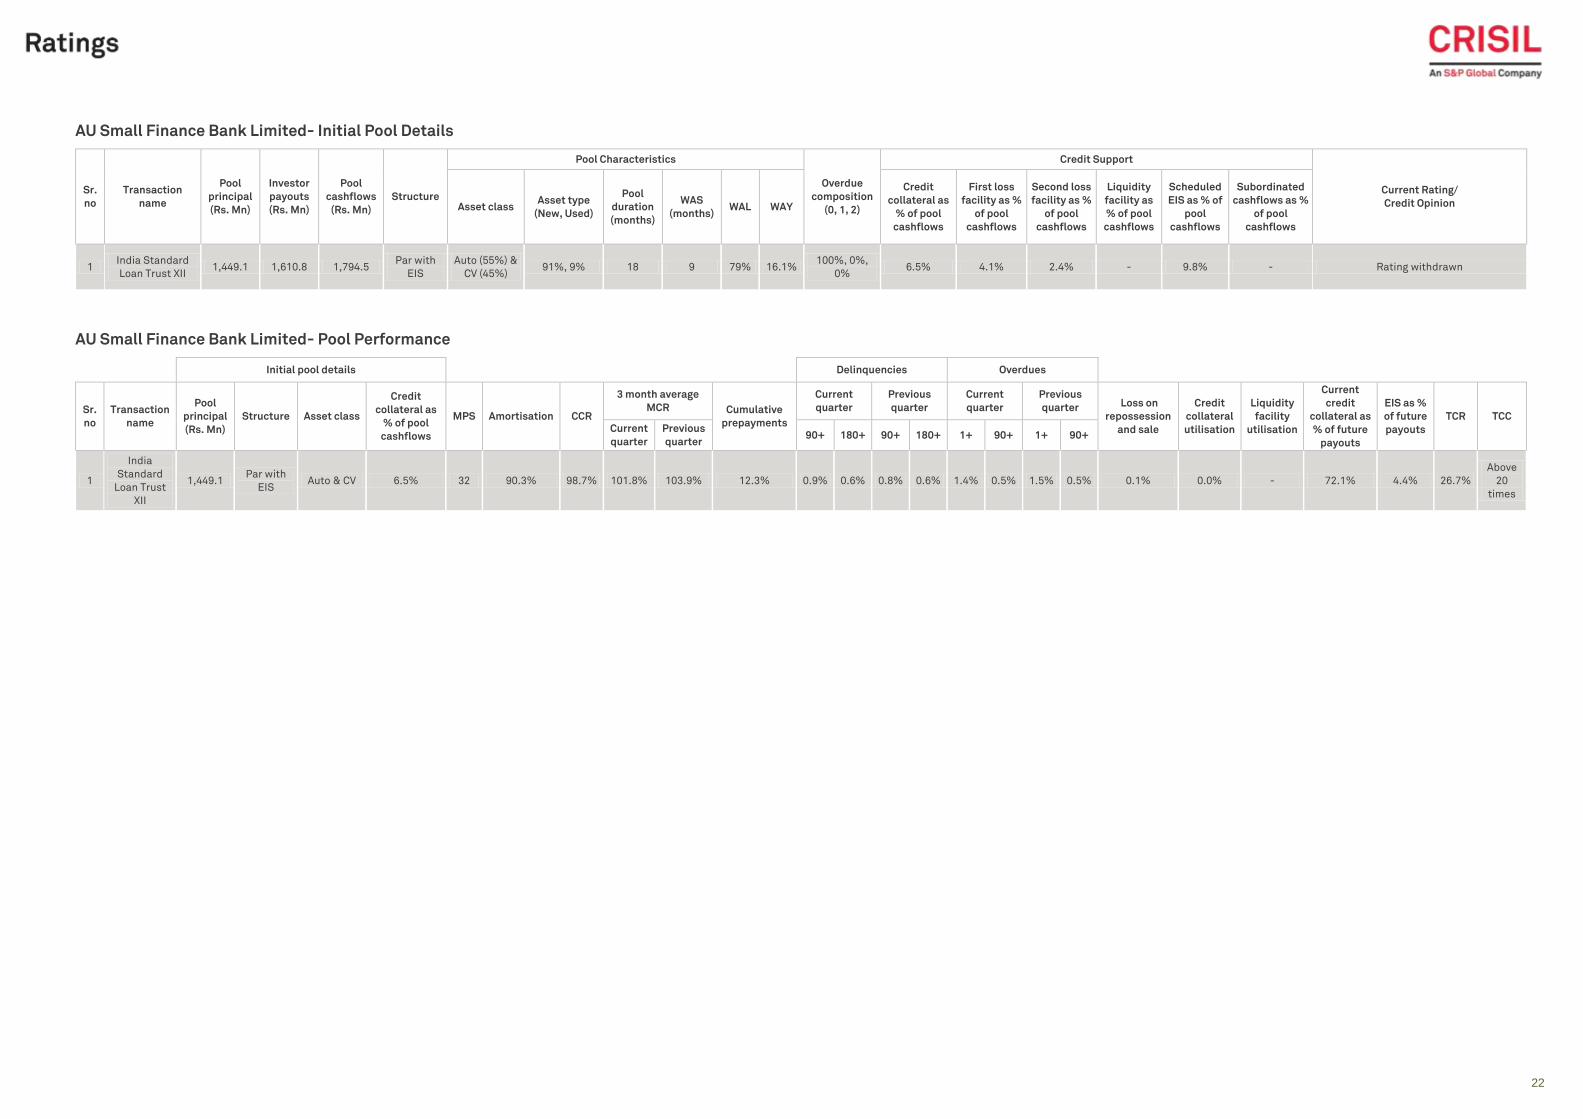
AU Small Finance Bank Limited- Initial Pool Details
Sr.
no
Transaction
name
Pool
principal
(Rs. Mn)
Investor
payouts
(Rs. Mn)
Pool
cashflows
(Rs. Mn)
Structure
Pool Characteristics
Overdue
composition
(0, 1, 2)
Credit Support
Current Rating/
Credit Opinion Asset class Asset type
(New, Used)
Pool
duration
(months)
WAS
(months) WAL WAY
Credit
collateral as
% of pool
cashflows
First loss
facility as %
of pool
cashflows
Second loss
facility as %
of pool
cashflows
Liquidity
facility as
% of pool
cashflows
Scheduled
EIS as % of
pool
cashflows
Subordinated
cashflows as %
of pool
cashflows
1 India Standard
Loan Trust XII 1,449.1 1,610.8 1,794.5
Par with
EIS
Auto (55%) &
CV (45%) 91%, 9% 18 9 79% 16.1%
100%, 0%,
0% 6.5% 4.1% 2.4% - 9.8% - Rating withdrawn
AU Small Finance Bank Limited- Pool Performance
Initial pool details Delinquencies Overdues
Sr.
no
Transaction
name
Pool
principal
(Rs. Mn)
Structure Asset class
Credit
collateral as
% of pool
cashflows
MPS Amortisation CCR
3 month average
MCR Cumulative
prepayments
Current
quarter
Previous
quarter
Current
quarter
Previous
quarter Loss on
repossession
and sale
Credit
collateral
utilisation
Liquidity
facility
utilisation
Current
credit
collateral as
% of future
payouts
EIS as %
of future
payouts
TCR TCC Current
quarter
Previous
quarter 90+ 180+ 90+ 180+ 1+ 90+ 1+ 90+
1
India
Standard
Loan Trust
XII
1,449.1 Par with
EIS Auto & CV 6.5% 32 90.3% 98.7% 101.8% 103.9% 12.3% 0.9% 0.6% 0.8% 0.6% 1.4% 0.5% 1.5% 0.5% 0.1% 0.0% - 72.1% 4.4% 26.7%
Above
20
times
23
Classification: INTERNAL: CONFIDENTIAL
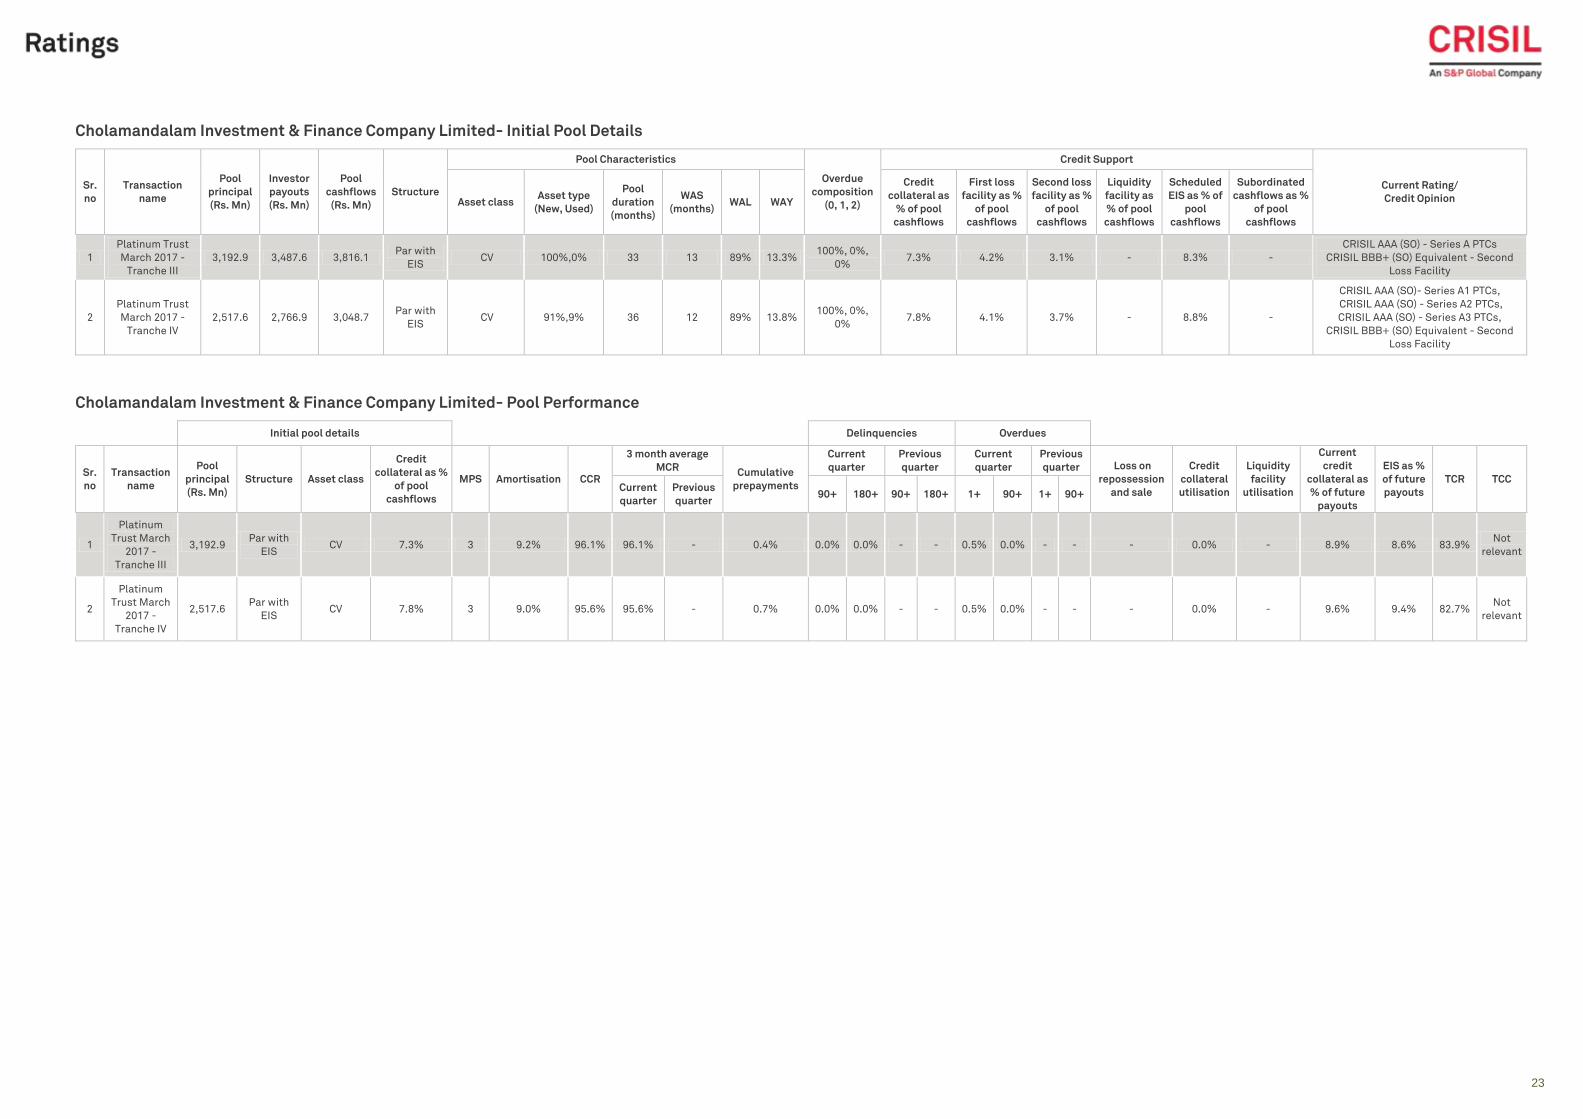
Cholamandalam Investment & Finance Company Limited- Initial Pool Details
Sr.
no
Transaction
name
Pool
principal
(Rs. Mn)
Investor
payouts
(Rs. Mn)
Pool
cashflows
(Rs. Mn)
Structure
Pool Characteristics
Overdue
composition
(0, 1, 2)
Credit Support
Current Rating/
Credit Opinion Asset class Asset type
(New, Used)
Pool
duration
(months)
WAS
(months) WAL WAY
Credit
collateral as
% of pool
cashflows
First loss
facility as %
of pool
cashflows
Second loss
facility as %
of pool
cashflows
Liquidity
facility as
% of pool
cashflows
Scheduled
EIS as % of
pool
cashflows
Subordinated
cashflows as %
of pool
cashflows
1
Platinum Trust
March 2017 -
Tranche III
3,192.9 3,487.6 3,816.1 Par with
EIS CV 100%,0% 33 13 89% 13.3%
100%, 0%,
0% 7.3% 4.2% 3.1% - 8.3% -
CRISIL AAA (SO) - Series A PTCs
CRISIL BBB+ (SO) Equivalent - Second
Loss Facility
2
Platinum Trust
March 2017 -
Tranche IV
2,517.6 2,766.9 3,048.7 Par with
EIS CV 91%,9% 36 12 89% 13.8%
100%, 0%,
0% 7.8% 4.1% 3.7% - 8.8% -
CRISIL AAA (SO)- Series A1 PTCs,
CRISIL AAA (SO) - Series A2 PTCs,
CRISIL AAA (SO) - Series A3 PTCs,
CRISIL BBB+ (SO) Equivalent - Second
Loss Facility
Cholamandalam Investment & Finance Company Limited- Pool Performance
Initial pool details Delinquencies Overdues
Sr.
no
Transaction
name
Pool
principal
(Rs. Mn)
Structure Asset class
Credit
collateral as %
of pool
cashflows
MPS Amortisation CCR
3 month average
MCR Cumulative
prepayments
Current
quarter
Previous
quarter
Current
quarter
Previous
quarter Loss on
repossession
and sale
Credit
collateral
utilisation
Liquidity
facility
utilisation
Current
credit
collateral as
% of future
payouts
EIS as %
of future
payouts
TCR TCC Current
quarter
Previous
quarter 90+ 180+ 90+ 180+ 1+ 90+ 1+ 90+
1
Platinum
Trust March
2017 -
Tranche III
3,192.9 Par with
EIS CV 7.3% 3 9.2% 96.1% 96.1% - 0.4% 0.0% 0.0% - - 0.5% 0.0% - - - 0.0% - 8.9% 8.6% 83.9%
Not
relevant
2
Platinum
Trust March
2017 -
Tranche IV
2,517.6 Par with
EIS CV 7.8% 3 9.0% 95.6% 95.6% - 0.7% 0.0% 0.0% - - 0.5% 0.0% - - - 0.0% - 9.6% 9.4% 82.7%
Not
relevant
24
Classification: INTERNAL: CONFIDENTIAL
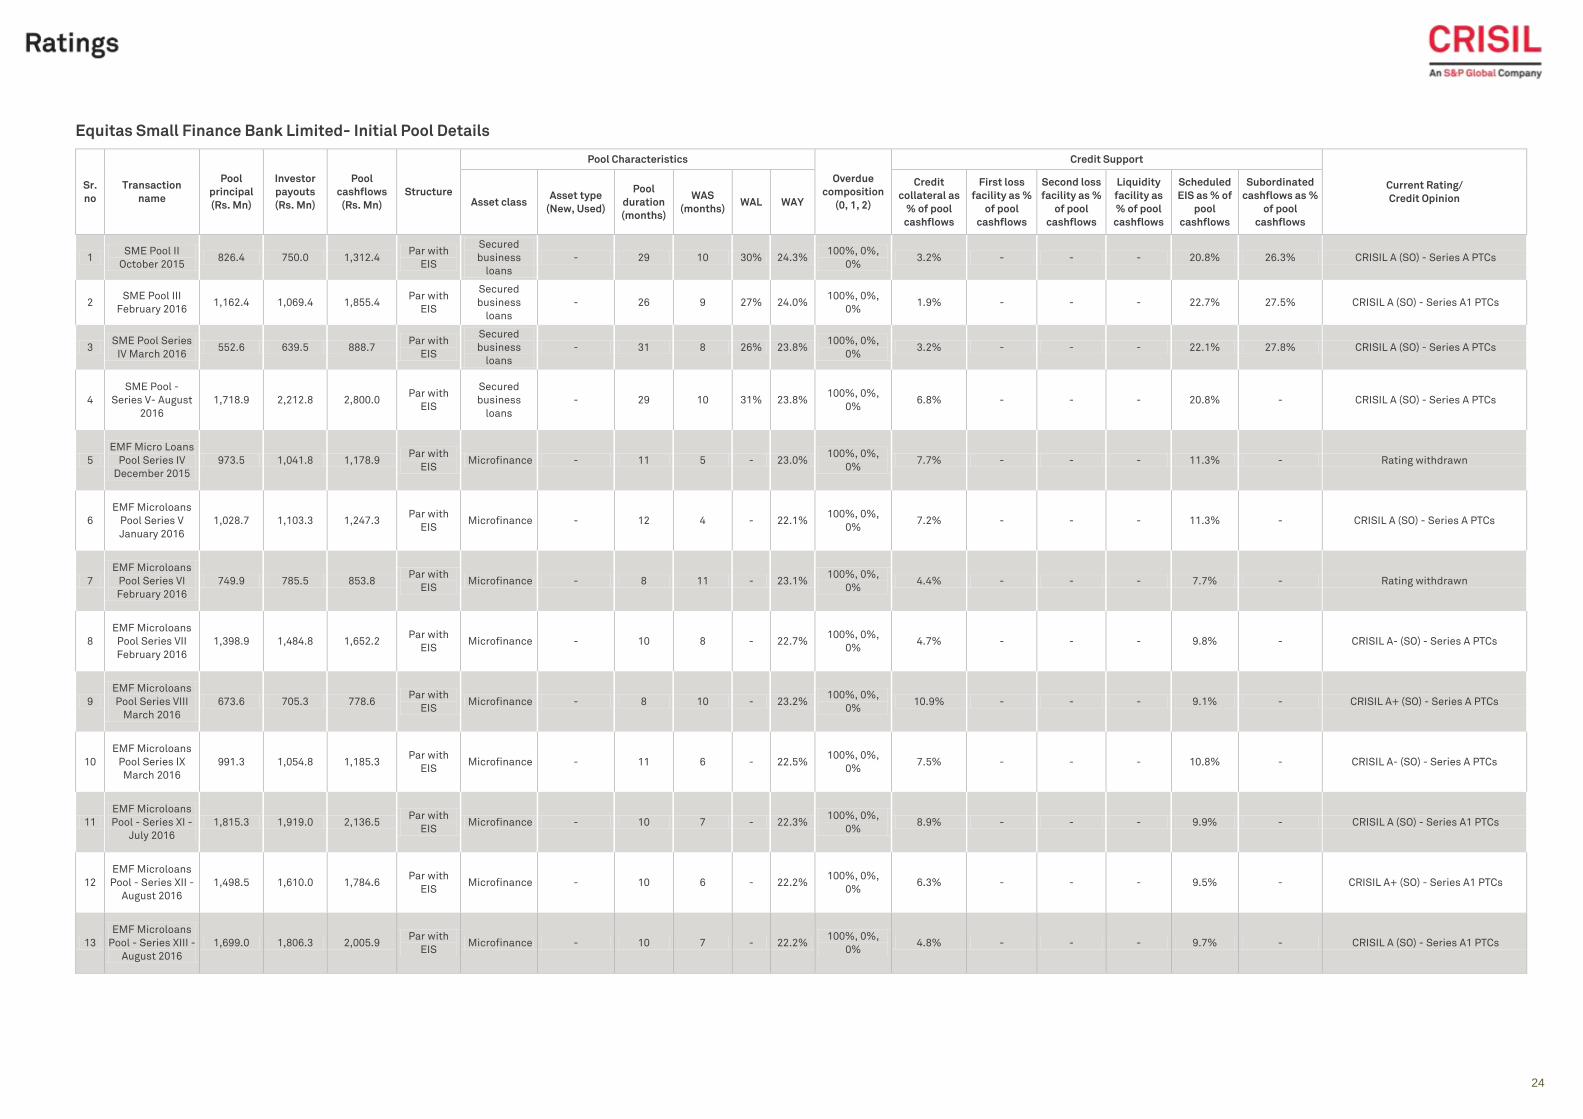
Equitas Small Finance Bank Limited- Initial Pool Details
Sr.
no
Transaction
name
Pool
principal
(Rs. Mn)
Investor
payouts
(Rs. Mn)
Pool
cashflows
(Rs. Mn)
Structure
Pool Characteristics
Overdue
composition
(0, 1, 2)
Credit Support
Current Rating/
Credit Opinion Asset class Asset type
(New, Used)
Pool
duration
(months)
WAS
(months) WAL WAY
Credit
collateral as
% of pool
cashflows
First loss
facility as %
of pool
cashflows
Second loss
facility as %
of pool
cashflows
Liquidity
facility as
% of pool
cashflows
Scheduled
EIS as % of
pool
cashflows
Subordinated
cashflows as %
of pool
cashflows
1 SME Pool II
October 2015 826.4 750.0 1,312.4
Par with
EIS
Secured
business
loans
- 29 10 30% 24.3% 100%, 0%,
0% 3.2% - - - 20.8% 26.3% CRISIL A (SO) - Series A PTCs
2 SME Pool III
February 2016 1,162.4 1,069.4 1,855.4
Par with
EIS
Secured
business
loans
- 26 9 27% 24.0% 100%, 0%,
0% 1.9% - - - 22.7% 27.5% CRISIL A (SO) - Series A1 PTCs
3 SME Pool Series
IV March 2016 552.6 639.5 888.7
Par with
EIS
Secured
business
loans
- 31 8 26% 23.8% 100%, 0%,
0% 3.2% - - - 22.1% 27.8% CRISIL A (SO) - Series A PTCs
4
SME Pool -
Series V- August
2016
1,718.9 2,212.8 2,800.0 Par with
EIS
Secured
business
loans
- 29 10 31% 23.8% 100%, 0%,
0% 6.8% - - - 20.8% - CRISIL A (SO) - Series A PTCs
5
EMF Micro Loans
Pool Series IV
December 2015
973.5 1,041.8 1,178.9 Par with
EIS Microfinance - 11 5 - 23.0%
100%, 0%,
0% 7.7% - - - 11.3% - Rating withdrawn
6
EMF Microloans
Pool Series V
January 2016
1,028.7 1,103.3 1,247.3 Par with
EIS Microfinance - 12 4 - 22.1%
100%, 0%,
0% 7.2% - - - 11.3% - CRISIL A (SO) - Series A PTCs
7
EMF Microloans
Pool Series VI
February 2016
749.9 785.5 853.8 Par with
EIS Microfinance - 8 11 - 23.1%
100%, 0%,
0% 4.4% - - - 7.7% - Rating withdrawn
8
EMF Microloans
Pool Series VII
February 2016
1,398.9 1,484.8 1,652.2 Par with
EIS Microfinance - 10 8 - 22.7%
100%, 0%,
0% 4.7% - - - 9.8% - CRISIL A- (SO) - Series A PTCs
9
EMF Microloans
Pool Series VIII
March 2016
673.6 705.3 778.6 Par with
EIS Microfinance - 8 10 - 23.2%
100%, 0%,
0% 10.9% - - - 9.1% - CRISIL A+ (SO) - Series A PTCs
10
EMF Microloans
Pool Series IX
March 2016
991.3 1,054.8 1,185.3 Par with
EIS Microfinance - 11 6 - 22.5%
100%, 0%,
0% 7.5% - - - 10.8% - CRISIL A- (SO) - Series A PTCs
11
EMF Microloans
Pool - Series XI -
July 2016
1,815.3 1,919.0 2,136.5 Par with
EIS Microfinance - 10 7 - 22.3%
100%, 0%,
0% 8.9% - - - 9.9% - CRISIL A (SO) - Series A1 PTCs
12
EMF Microloans
Pool - Series XII -
August 2016
1,498.5 1,610.0 1,784.6 Par with
EIS Microfinance - 10 6 - 22.2%
100%, 0%,
0% 6.3% - - - 9.5% - CRISIL A+ (SO) - Series A1 PTCs
13
EMF Microloans
Pool - Series XIII -
August 2016
1,699.0 1,806.3 2,005.9 Par with
EIS Microfinance - 10 7 - 22.2%
100%, 0%,
0% 4.8% - - - 9.7% - CRISIL A (SO) - Series A1 PTCs
25
Classification: INTERNAL: CONFIDENTIAL
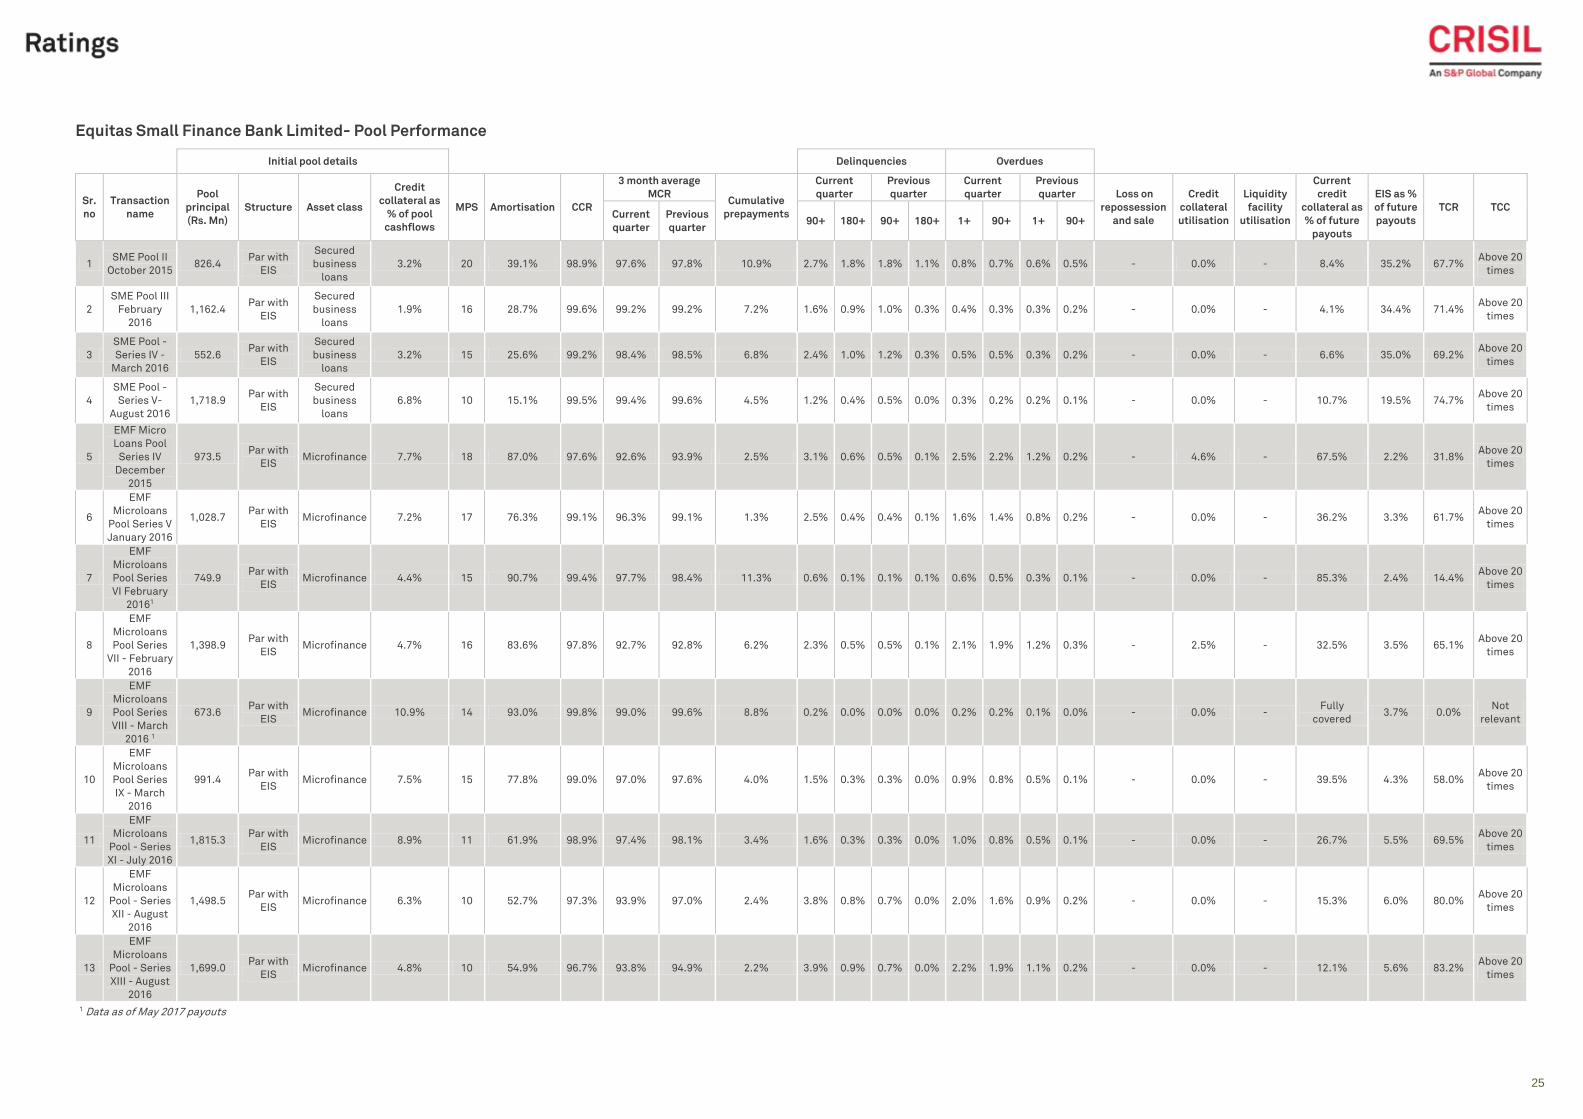
Equitas Small Finance Bank Limited- Pool Performance
Initial pool details Delinquencies Overdues
Sr.
no
Transaction
name
Pool
principal
(Rs. Mn)
Structure Asset class
Credit
collateral as
% of pool
cashflows
MPS Amortisation CCR
3 month average
MCR Cumulative
prepayments
Current
quarter
Previous
quarter
Current
quarter
Previous
quarter Loss on
repossession
and sale
Credit
collateral
utilisation
Liquidity
facility
utilisation
Current
credit
collateral as
% of future
payouts
EIS as %
of future
payouts
TCR TCC Current
quarter
Previous
quarter 90+ 180+ 90+ 180+ 1+ 90+ 1+ 90+
1 SME Pool II
October 2015 826.4
Par with
EIS
Secured
business
loans
3.2% 20 39.1% 98.9% 97.6% 97.8% 10.9% 2.7% 1.8% 1.8% 1.1% 0.8% 0.7% 0.6% 0.5% - 0.0% - 8.4% 35.2% 67.7% Above 20
times
2
SME Pool III
February
2016
1,162.4 Par with
EIS
Secured
business
loans
1.9% 16 28.7% 99.6% 99.2% 99.2% 7.2% 1.6% 0.9% 1.0% 0.3% 0.4% 0.3% 0.3% 0.2% - 0.0% - 4.1% 34.4% 71.4% Above 20
times
3
SME Pool -
Series IV -
March 2016
552.6 Par with
EIS
Secured
business
loans
3.2% 15 25.6% 99.2% 98.4% 98.5% 6.8% 2.4% 1.0% 1.2% 0.3% 0.5% 0.5% 0.3% 0.2% - 0.0% - 6.6% 35.0% 69.2% Above 20
times
4
SME Pool -
Series V-
August 2016
1,718.9 Par with
EIS
Secured
business
loans
6.8% 10 15.1% 99.5% 99.4% 99.6% 4.5% 1.2% 0.4% 0.5% 0.0% 0.3% 0.2% 0.2% 0.1% - 0.0% - 10.7% 19.5% 74.7% Above 20
times
5
EMF Micro
Loans Pool
Series IV
December
2015
973.5 Par with
EIS Microfinance 7.7% 18 87.0% 97.6% 92.6% 93.9% 2.5% 3.1% 0.6% 0.5% 0.1% 2.5% 2.2% 1.2% 0.2% - 4.6% - 67.5% 2.2% 31.8%
Above 20
times
6
EMF
Microloans
Pool Series V
January 2016
1,028.7 Par with
EIS Microfinance 7.2% 17 76.3% 99.1% 96.3% 99.1% 1.3% 2.5% 0.4% 0.4% 0.1% 1.6% 1.4% 0.8% 0.2% - 0.0% - 36.2% 3.3% 61.7%
Above 20
times
7
EMF
Microloans
Pool Series
VI February
20161
749.9 Par with
EIS Microfinance 4.4% 15 90.7% 99.4% 97.7% 98.4% 11.3% 0.6% 0.1% 0.1% 0.1% 0.6% 0.5% 0.3% 0.1% - 0.0% - 85.3% 2.4% 14.4%
Above 20
times
8
EMF
Microloans
Pool Series
VII - February
2016
1,398.9 Par with
EIS Microfinance 4.7% 16 83.6% 97.8% 92.7% 92.8% 6.2% 2.3% 0.5% 0.5% 0.1% 2.1% 1.9% 1.2% 0.3% - 2.5% - 32.5% 3.5% 65.1%
Above 20
times
9
EMF
Microloans
Pool Series
VIII - March
2016 1
673.6 Par with
EIS Microfinance 10.9% 14 93.0% 99.8% 99.0% 99.6% 8.8% 0.2% 0.0% 0.0% 0.0% 0.2% 0.2% 0.1% 0.0% - 0.0% -
Fully
covered 3.7% 0.0%
Not
relevant
10
EMF
Microloans
Pool Series
IX - March
2016
991.4 Par with
EIS Microfinance 7.5% 15 77.8% 99.0% 97.0% 97.6% 4.0% 1.5% 0.3% 0.3% 0.0% 0.9% 0.8% 0.5% 0.1% - 0.0% - 39.5% 4.3% 58.0%
Above 20
times
11
EMF
Microloans
Pool - Series
XI - July 2016
1,815.3 Par with
EIS Microfinance 8.9% 11 61.9% 98.9% 97.4% 98.1% 3.4% 1.6% 0.3% 0.3% 0.0% 1.0% 0.8% 0.5% 0.1% - 0.0% - 26.7% 5.5% 69.5%
Above 20
times
12
EMF
Microloans
Pool - Series
XII - August
2016
1,498.5 Par with
EIS Microfinance 6.3% 10 52.7% 97.3% 93.9% 97.0% 2.4% 3.8% 0.8% 0.7% 0.0% 2.0% 1.6% 0.9% 0.2% - 0.0% - 15.3% 6.0% 80.0%
Above 20
times
13
EMF
Microloans
Pool - Series
XIII - August
2016
1,699.0 Par with
EIS Microfinance 4.8% 10 54.9% 96.7% 93.8% 94.9% 2.2% 3.9% 0.9% 0.7% 0.0% 2.2% 1.9% 1.1% 0.2% - 0.0% - 12.1% 5.6% 83.2%
Above 20
times
1 Data as of May 2017 payouts
26
Classification: INTERNAL: CONFIDENTIAL
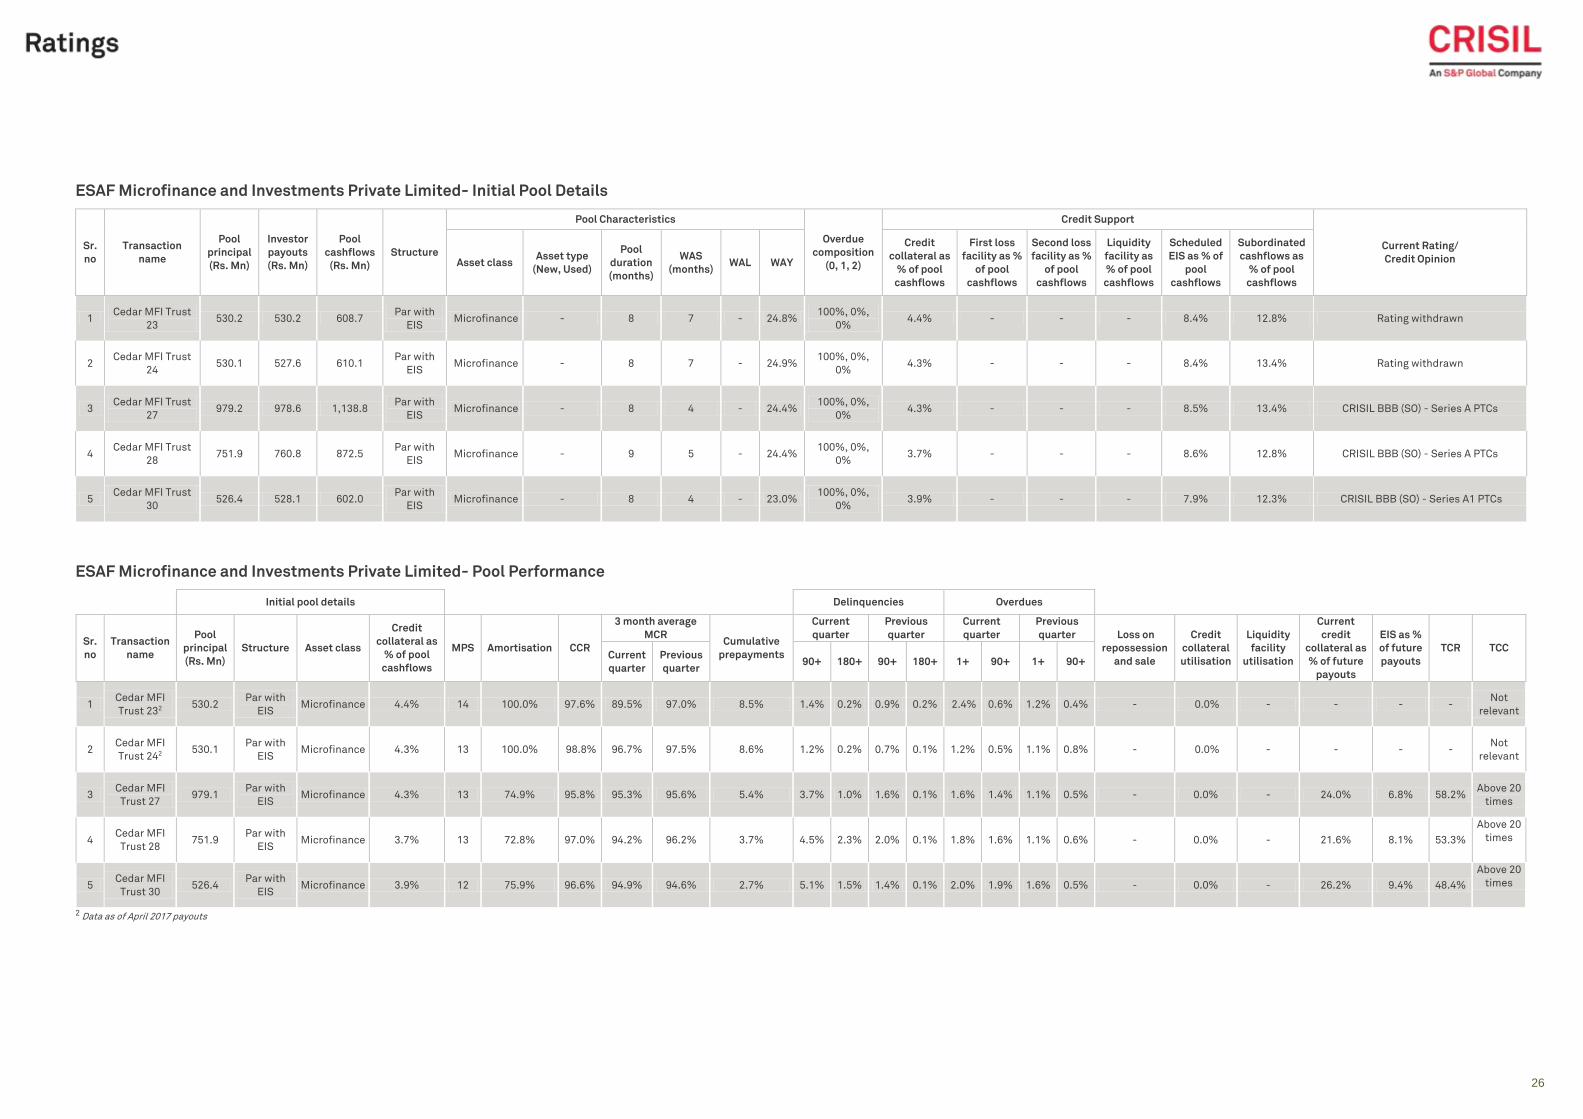
ESAF Microfinance and Investments Private Limited- Initial Pool Details
Sr.
no
Transaction
name
Pool
principal
(Rs. Mn)
Investor
payouts
(Rs. Mn)
Pool
cashflows
(Rs. Mn)
Structure
Pool Characteristics
Overdue
composition
(0, 1, 2)
Credit Support
Current Rating/
Credit Opinion Asset class Asset type
(New, Used)
Pool
duration
(months)
WAS
(months) WAL WAY
Credit
collateral as
% of pool
cashflows
First loss
facility as %
of pool
cashflows
Second loss
facility as %
of pool
cashflows
Liquidity
facility as
% of pool
cashflows
Scheduled
EIS as % of
pool
cashflows
Subordinated
cashflows as
% of pool
cashflows
1 Cedar MFI Trust
23 530.2 530.2 608.7
Par with
EIS Microfinance - 8 7 - 24.8%
100%, 0%,
0% 4.4% - - - 8.4% 12.8% Rating withdrawn
2 Cedar MFI Trust
24 530.1 527.6 610.1
Par with
EIS Microfinance - 8 7 - 24.9%
100%, 0%,
0% 4.3% - - - 8.4% 13.4% Rating withdrawn
3 Cedar MFI Trust
27 979.2 978.6 1,138.8
Par with
EIS Microfinance - 8 4 - 24.4%
100%, 0%,
0% 4.3% - - - 8.5% 13.4% CRISIL BBB (SO) - Series A PTCs
4 Cedar MFI Trust
28 751.9 760.8 872.5
Par with
EIS Microfinance - 9 5 - 24.4%
100%, 0%,
0% 3.7% - - - 8.6% 12.8% CRISIL BBB (SO) - Series A PTCs
5 Cedar MFI Trust
30 526.4 528.1 602.0
Par with
EIS Microfinance - 8 4 - 23.0%
100%, 0%,
0% 3.9% - - - 7.9% 12.3% CRISIL BBB (SO) - Series A1 PTCs
ESAF Microfinance and Investments Private Limited- Pool Performance
Initial pool details Delinquencies Overdues
Sr.
no
Transaction
name
Pool
principal
(Rs. Mn)
Structure Asset class
Credit
collateral as
% of pool
cashflows
MPS Amortisation CCR
3 month average
MCR Cumulative
prepayments
Current
quarter
Previous
quarter
Current
quarter
Previous
quarter Loss on
repossession
and sale
Credit
collateral
utilisation
Liquidity
facility
utilisation
Current
credit
collateral as
% of future
payouts
EIS as %
of future
payouts
TCR TCC Current
quarter
Previous
quarter 90+ 180+ 90+ 180+ 1+ 90+ 1+ 90+
1 Cedar MFI
Trust 232 530.2
Par with
EIS Microfinance 4.4% 14 100.0% 97.6% 89.5% 97.0% 8.5% 1.4% 0.2% 0.9% 0.2% 2.4% 0.6% 1.2% 0.4% - 0.0% - - - -
Not
relevant
2 Cedar MFI
Trust 242 530.1
Par with
EIS Microfinance 4.3% 13 100.0% 98.8% 96.7% 97.5% 8.6% 1.2% 0.2% 0.7% 0.1% 1.2% 0.5% 1.1% 0.8% - 0.0% - - - -
Not
relevant
3 Cedar MFI
Trust 27 979.1
Par with
EIS Microfinance 4.3% 13 74.9% 95.8% 95.3% 95.6% 5.4% 3.7% 1.0% 1.6% 0.1% 1.6% 1.4% 1.1% 0.5% - 0.0% - 24.0% 6.8% 58.2%
Above 20
times
4 Cedar MFI
Trust 28 751.9
Par with
EIS Microfinance 3.7% 13 72.8% 97.0% 94.2% 96.2% 3.7% 4.5% 2.3% 2.0% 0.1% 1.8% 1.6% 1.1% 0.6% - 0.0% - 21.6% 8.1% 53.3%
Above 20
times
5 Cedar MFI
Trust 30 526.4
Par with
EIS Microfinance 3.9% 12 75.9% 96.6% 94.9% 94.6% 2.7% 5.1% 1.5% 1.4% 0.1% 2.0% 1.9% 1.6% 0.5% - 0.0% - 26.2% 9.4% 48.4%
Above 20
times
2 Data as of April 2017 payouts
27
Classification: INTERNAL: CONFIDENTIAL
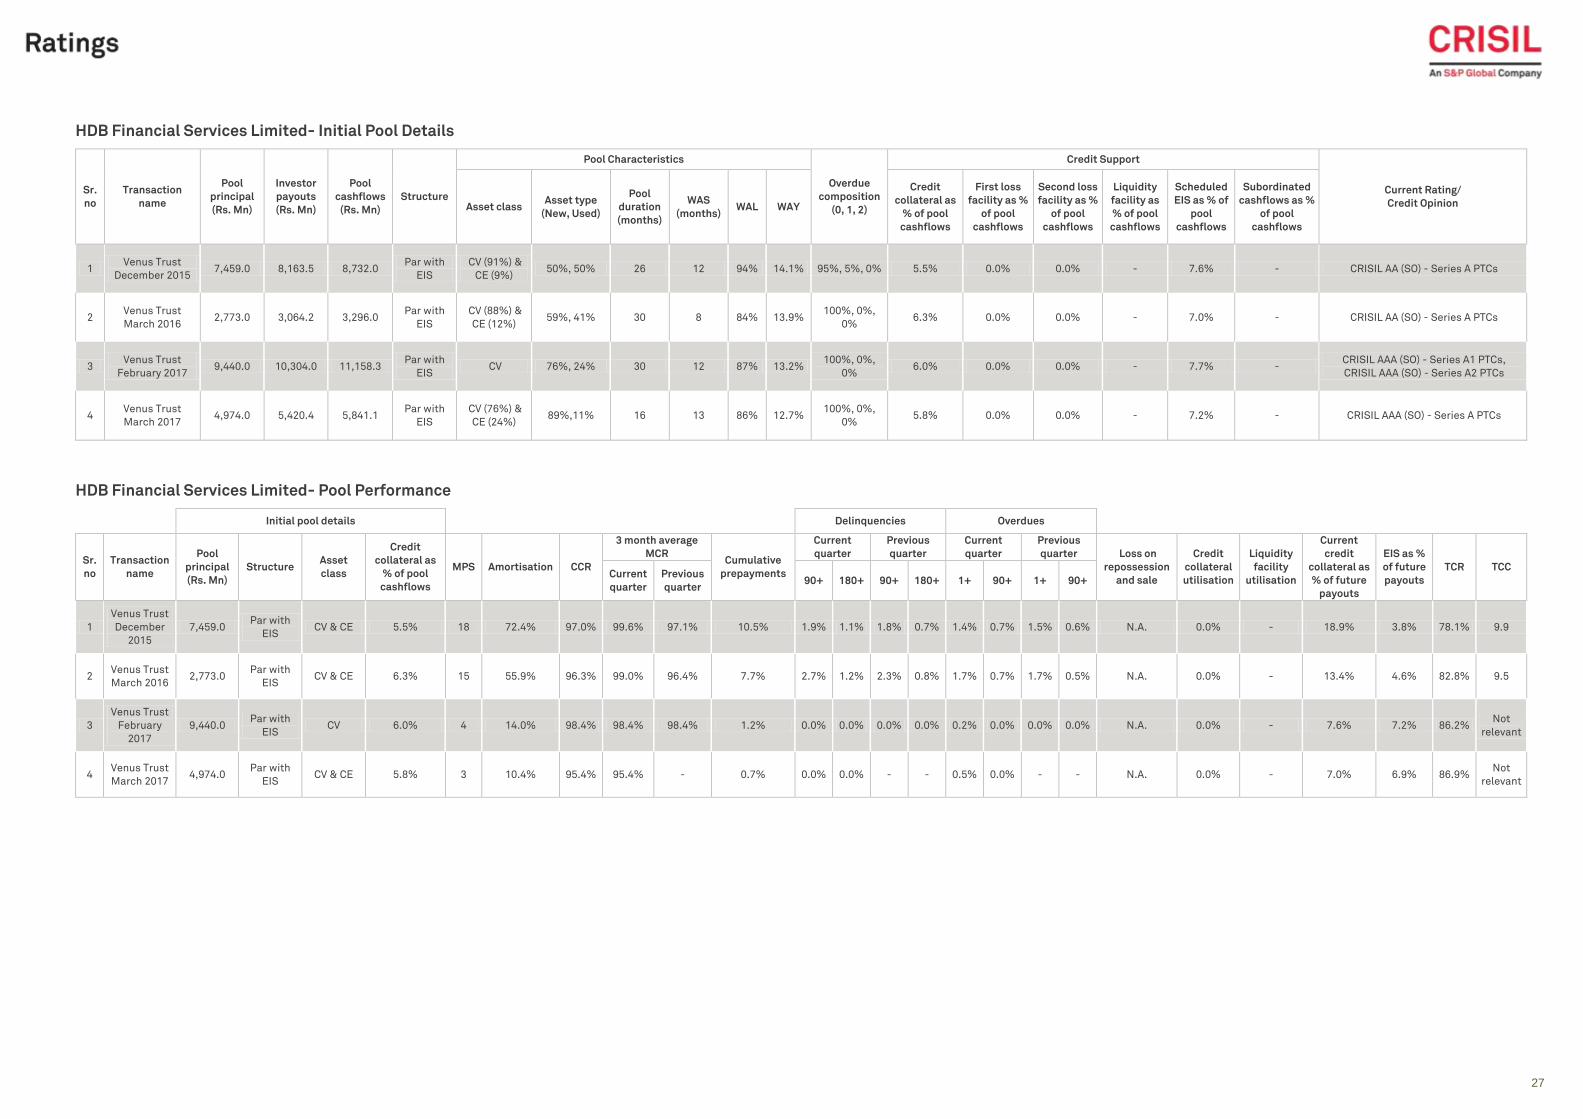
HDB Financial Services Limited- Initial Pool Details
Sr.
no
Transaction
name
Pool
principal
(Rs. Mn)
Investor
payouts
(Rs. Mn)
Pool
cashflows
(Rs. Mn)
Structure
Pool Characteristics
Overdue
composition
(0, 1, 2)
Credit Support
Current Rating/
Credit Opinion Asset class Asset type
(New, Used)
Pool
duration
(months)
WAS
(months) WAL WAY
Credit
collateral as
% of pool
cashflows
First loss
facility as %
of pool
cashflows
Second loss
facility as %
of pool
cashflows
Liquidity
facility as
% of pool
cashflows
Scheduled
EIS as % of
pool
cashflows
Subordinated
cashflows as %
of pool
cashflows
1 Venus Trust
December 2015 7,459.0 8,163.5 8,732.0
Par with
EIS
CV (91%) &
CE (9%) 50%, 50% 26 12 94% 14.1% 95%, 5%, 0% 5.5% 0.0% 0.0% - 7.6% - CRISIL AA (SO) - Series A PTCs
2 Venus Trust
March 2016 2,773.0 3,064.2 3,296.0
Par with
EIS
CV (88%) &
CE (12%) 59%, 41% 30 8 84% 13.9%
100%, 0%,
0% 6.3% 0.0% 0.0% - 7.0% - CRISIL AA (SO) - Series A PTCs
3 Venus Trust
February 2017 9,440.0 10,304.0 11,158.3
Par with
EIS CV 76%, 24% 30 12 87% 13.2%
100%, 0%,
0% 6.0% 0.0% 0.0% - 7.7% -
CRISIL AAA (SO) - Series A1 PTCs,
CRISIL AAA (SO) - Series A2 PTCs
4 Venus Trust
March 2017 4,974.0 5,420.4 5,841.1
Par with
EIS
CV (76%) &
CE (24%) 89%,11% 16 13 86% 12.7%
100%, 0%,
0% 5.8% 0.0% 0.0% - 7.2% - CRISIL AAA (SO) - Series A PTCs
HDB Financial Services Limited- Pool Performance
Initial pool details Delinquencies Overdues
Sr.
no
Transaction
name
Pool
principal
(Rs. Mn)
Structure Asset
class
Credit
collateral as
% of pool
cashflows
MPS Amortisation CCR
3 month average
MCR Cumulative
prepayments
Current
quarter
Previous
quarter
Current
quarter
Previous
quarter Loss on
repossession
and sale
Credit
collateral
utilisation
Liquidity
facility
utilisation
Current
credit
collateral as
% of future
payouts
EIS as %
of future
payouts
TCR TCC Current
quarter
Previous
quarter 90+ 180+ 90+ 180+ 1+ 90+ 1+ 90+
1
Venus Trust
December
2015
7,459.0 Par with
EIS CV & CE 5.5% 18 72.4% 97.0% 99.6% 97.1% 10.5% 1.9% 1.1% 1.8% 0.7% 1.4% 0.7% 1.5% 0.6% N.A. 0.0% - 18.9% 3.8% 78.1% 9.9
2 Venus Trust
March 2016 2,773.0
Par with
EIS CV & CE 6.3% 15 55.9% 96.3% 99.0% 96.4% 7.7% 2.7% 1.2% 2.3% 0.8% 1.7% 0.7% 1.7% 0.5% N.A. 0.0% - 13.4% 4.6% 82.8% 9.5
3
Venus Trust
February
2017
9,440.0 Par with
EIS CV 6.0% 4 14.0% 98.4% 98.4% 98.4% 1.2% 0.0% 0.0% 0.0% 0.0% 0.2% 0.0% 0.0% 0.0% N.A. 0.0% - 7.6% 7.2% 86.2%
Not
relevant
4 Venus Trust
March 2017 4,974.0
Par with
EIS CV & CE 5.8% 3 10.4% 95.4% 95.4% - 0.7% 0.0% 0.0% - - 0.5% 0.0% - - N.A. 0.0% - 7.0% 6.9% 86.9%
Not
relevant
28
Classification: INTERNAL: CONFIDENTIAL
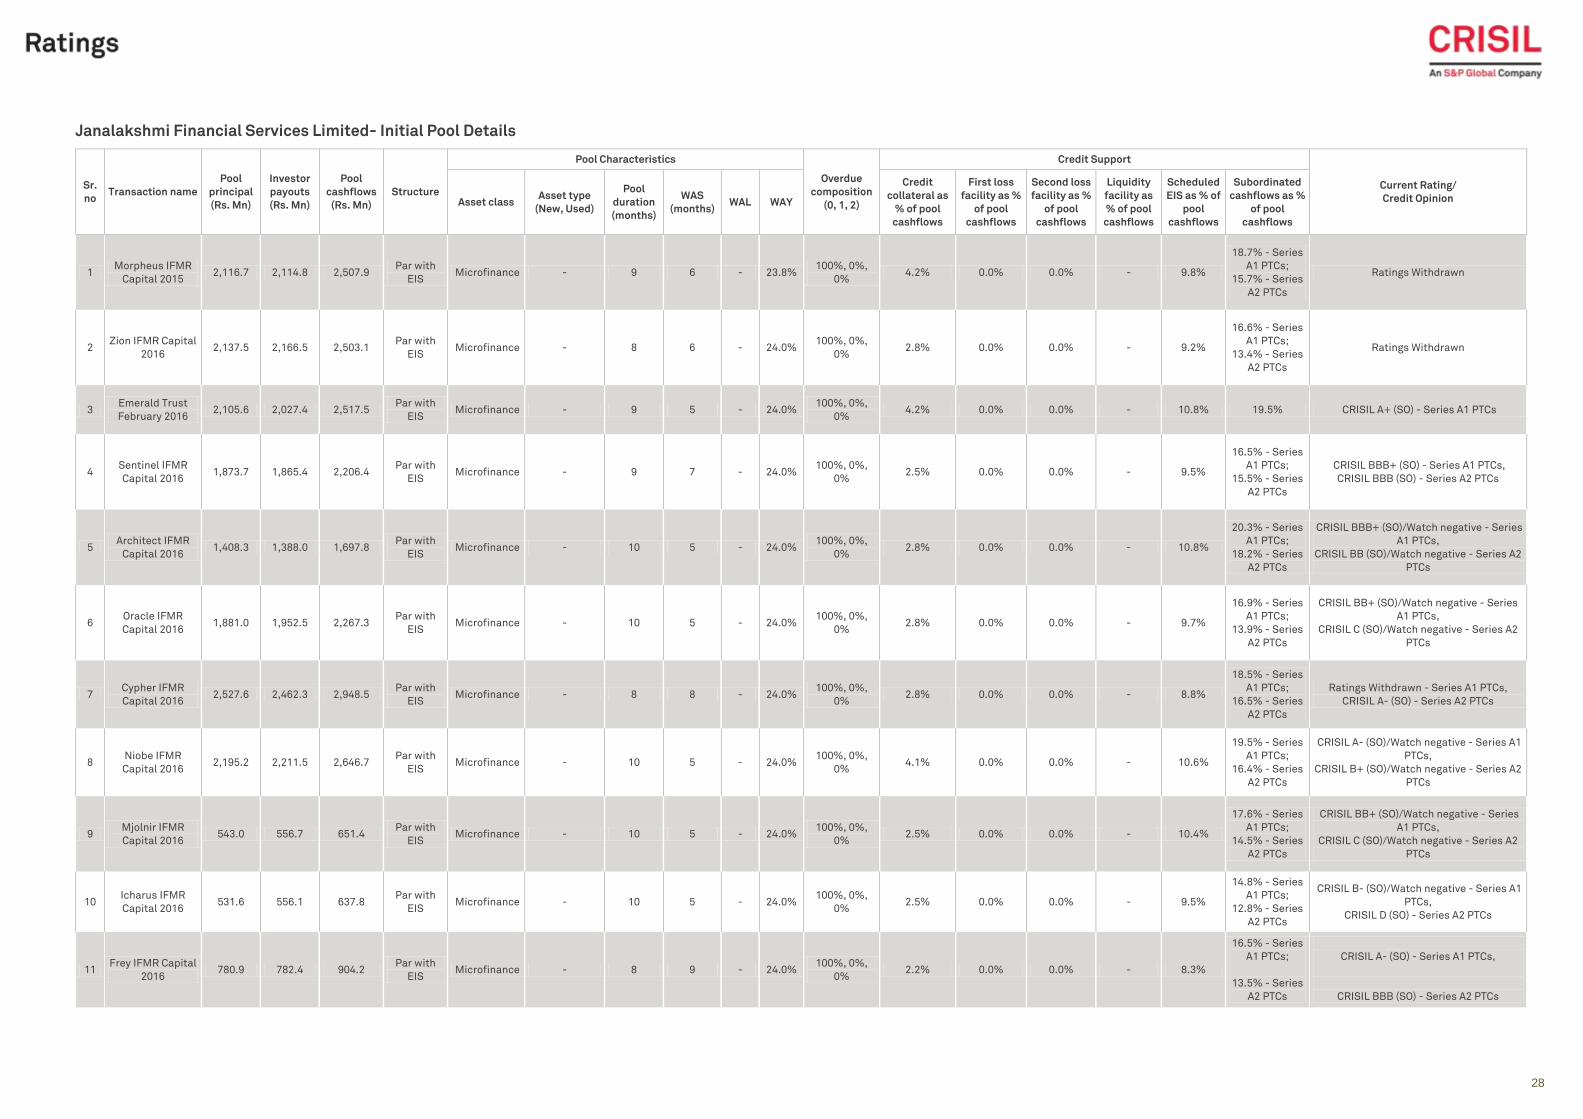
Janalakshmi Financial Services Limited- Initial Pool Details
Sr.
no Transaction name
Pool
principal
(Rs. Mn)
Investor
payouts
(Rs. Mn)
Pool
cashflows
(Rs. Mn)
Structure
Pool Characteristics
Overdue
composition
(0, 1, 2)
Credit Support
Current Rating/
Credit Opinion Asset class Asset type
(New, Used)
Pool
duration
(months)
WAS
(months) WAL WAY
Credit
collateral as
% of pool
cashflows
First loss
facility as %
of pool
cashflows
Second loss
facility as %
of pool
cashflows
Liquidity
facility as
% of pool
cashflows
Scheduled
EIS as % of
pool
cashflows
Subordinated
cashflows as %
of pool
cashflows
1 Morpheus IFMR
Capital 2015 2,116.7 2,114.8 2,507.9
Par with
EIS Microfinance - 9 6 - 23.8%
100%, 0%,
0% 4.2% 0.0% 0.0% - 9.8%
18.7% - Series
A1 PTCs;
15.7% - Series
A2 PTCs
Ratings Withdrawn
2 Zion IFMR Capital
2016 2,137.5 2,166.5 2,503.1
Par with
EIS Microfinance - 8 6 - 24.0%
100%, 0%,
0% 2.8% 0.0% 0.0% - 9.2%
16.6% - Series
A1 PTCs;
13.4% - Series
A2 PTCs
Ratings Withdrawn
3 Emerald Trust
February 2016 2,105.6 2,027.4 2,517.5
Par with
EIS Microfinance - 9 5 - 24.0%
100%, 0%,
0% 4.2% 0.0% 0.0% - 10.8% 19.5% CRISIL A+ (SO) - Series A1 PTCs
4 Sentinel IFMR
Capital 2016 1,873.7 1,865.4 2,206.4
Par with
EIS Microfinance - 9 7 - 24.0%
100%, 0%,
0% 2.5% 0.0% 0.0% - 9.5%
16.5% - Series
A1 PTCs;
15.5% - Series
A2 PTCs
CRISIL BBB+ (SO) - Series A1 PTCs,
CRISIL BBB (SO) - Series A2 PTCs
5 Architect IFMR
Capital 2016 1,408.3 1,388.0 1,697.8
Par with
EIS Microfinance - 10 5 - 24.0%
100%, 0%,
0% 2.8% 0.0% 0.0% - 10.8%
20.3% - Series
A1 PTCs;
18.2% - Series
A2 PTCs
CRISIL BBB+ (SO)/Watch negative - Series
A1 PTCs,
CRISIL BB (SO)/Watch negative - Series A2
PTCs
6 Oracle IFMR
Capital 2016 1,881.0 1,952.5 2,267.3
Par with
EIS Microfinance - 10 5 - 24.0%
100%, 0%,
0% 2.8% 0.0% 0.0% - 9.7%
16.9% - Series
A1 PTCs;
13.9% - Series
A2 PTCs
CRISIL BB+ (SO)/Watch negative - Series
A1 PTCs,
CRISIL C (SO)/Watch negative - Series A2
PTCs
7 Cypher IFMR
Capital 2016 2,527.6 2,462.3 2,948.5
Par with
EIS Microfinance - 8 8 - 24.0%
100%, 0%,
0% 2.8% 0.0% 0.0% - 8.8%
18.5% - Series
A1 PTCs;
16.5% - Series
A2 PTCs
Ratings Withdrawn - Series A1 PTCs,
CRISIL A- (SO) - Series A2 PTCs
8 Niobe IFMR
Capital 2016 2,195.2 2,211.5 2,646.7
Par with
EIS Microfinance - 10 5 - 24.0%
100%, 0%,
0% 4.1% 0.0% 0.0% - 10.6%
19.5% - Series
A1 PTCs;
16.4% - Series
A2 PTCs
CRISIL A- (SO)/Watch negative - Series A1
PTCs,
CRISIL B+ (SO)/Watch negative - Series A2
PTCs
9 Mjolnir IFMR
Capital 2016 543.0 556.7 651.4
Par with
EIS Microfinance - 10 5 - 24.0%
100%, 0%,
0% 2.5% 0.0% 0.0% - 10.4%
17.6% - Series
A1 PTCs;
14.5% - Series
A2 PTCs
CRISIL BB+ (SO)/Watch negative - Series
A1 PTCs,
CRISIL C (SO)/Watch negative - Series A2
PTCs
10 Icharus IFMR
Capital 2016 531.6 556.1 637.8
Par with
EIS Microfinance - 10 5 - 24.0%
100%, 0%,
0% 2.5% 0.0% 0.0% - 9.5%
14.8% - Series
A1 PTCs;
12.8% - Series
A2 PTCs
CRISIL B- (SO)/Watch negative - Series A1
PTCs,
CRISIL D (SO) - Series A2 PTCs
11 Frey IFMR Capital
2016 780.9 782.4 904.2
Par with
EIS Microfinance - 8 9 - 24.0%
100%, 0%,
0% 2.2% 0.0% 0.0% - 8.3%
16.5% - Series
A1 PTCs;
13.5% - Series
A2 PTCs
CRISIL A- (SO) - Series A1 PTCs,
CRISIL BBB (SO) - Series A2 PTCs
29
Classification: INTERNAL: CONFIDENTIAL
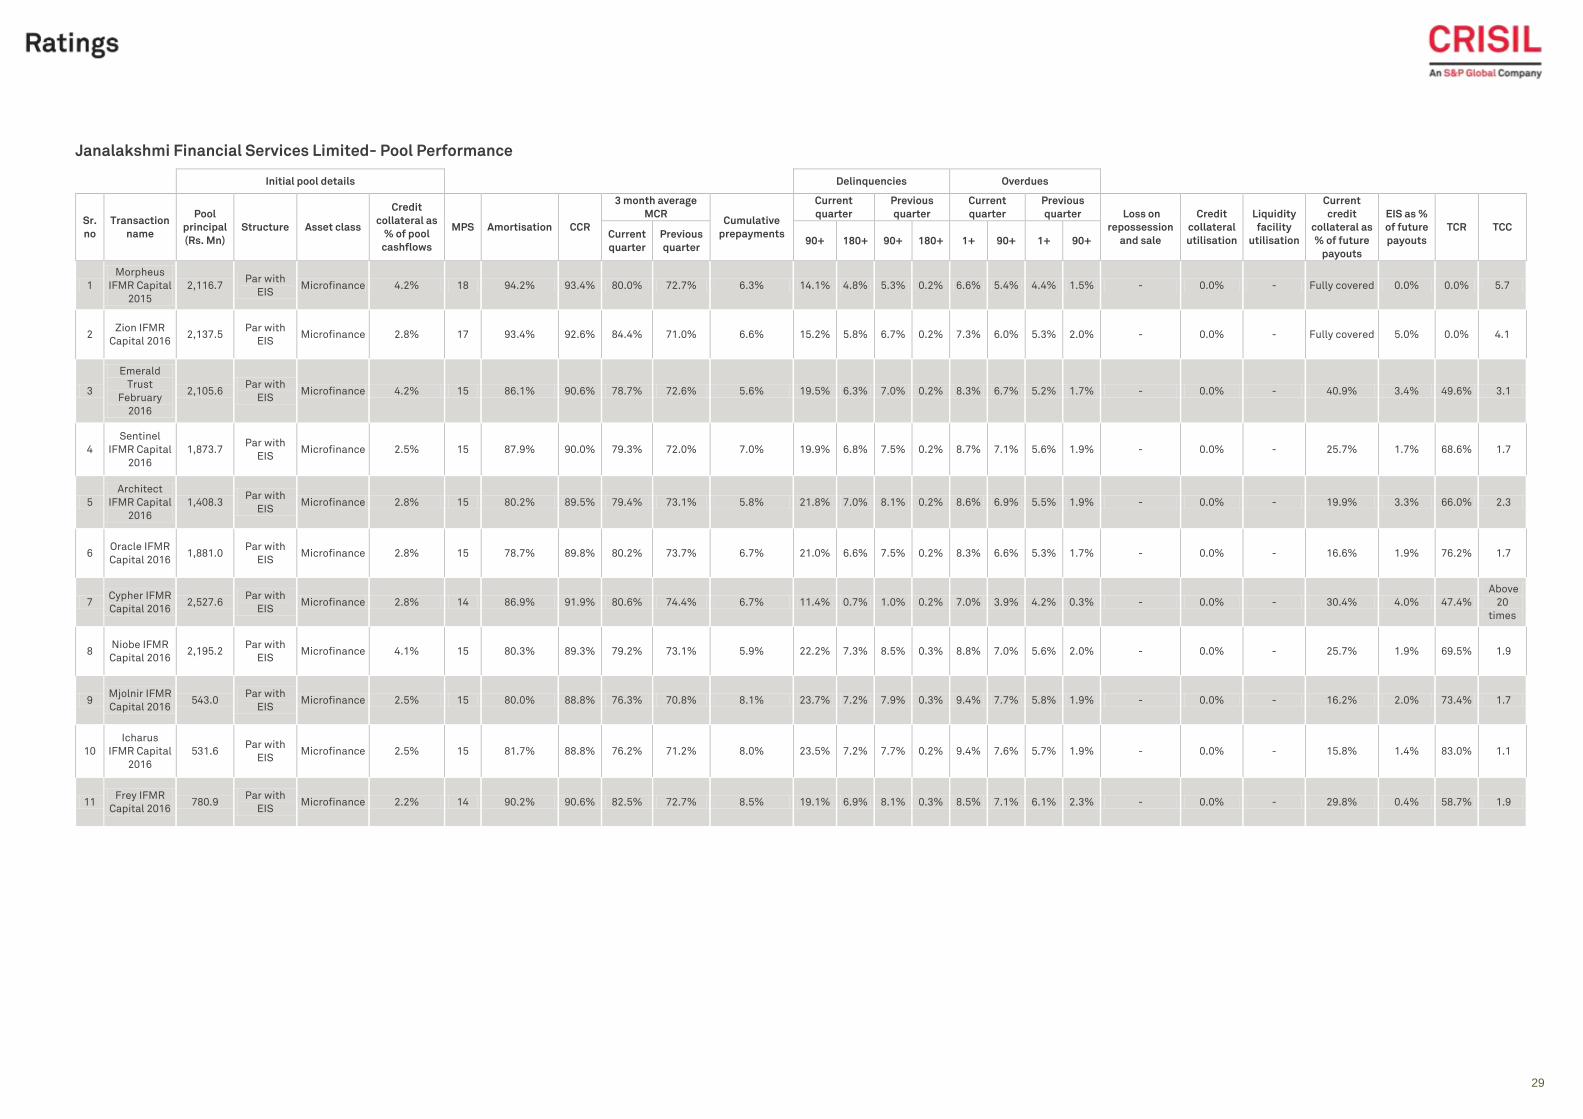
Janalakshmi Financial Services Limited- Pool Performance
Initial pool details Delinquencies Overdues
Sr.
no
Transaction
name
Pool
principal
(Rs. Mn)
Structure Asset class
Credit
collateral as
% of pool
cashflows
MPS Amortisation CCR
3 month average
MCR Cumulative
prepayments
Current
quarter
Previous
quarter
Current
quarter
Previous
quarter Loss on
repossession
and sale
Credit
collateral
utilisation
Liquidity
facility
utilisation
Current
credit
collateral as
% of future
payouts
EIS as %
of future
payouts
TCR TCC Current
quarter
Previous
quarter 90+ 180+ 90+ 180+ 1+ 90+ 1+ 90+
1
Morpheus
IFMR Capital
2015
2,116.7 Par with
EIS Microfinance 4.2% 18 94.2% 93.4% 80.0% 72.7% 6.3% 14.1% 4.8% 5.3% 0.2% 6.6% 5.4% 4.4% 1.5% - 0.0% - Fully covered 0.0% 0.0% 5.7
2 Zion IFMR
Capital 2016 2,137.5
Par with
EIS Microfinance 2.8% 17 93.4% 92.6% 84.4% 71.0% 6.6% 15.2% 5.8% 6.7% 0.2% 7.3% 6.0% 5.3% 2.0% - 0.0% - Fully covered 5.0% 0.0% 4.1
3
Emerald
Trust
February
2016
2,105.6 Par with
EIS Microfinance 4.2% 15 86.1% 90.6% 78.7% 72.6% 5.6% 19.5% 6.3% 7.0% 0.2% 8.3% 6.7% 5.2% 1.7% - 0.0% - 40.9% 3.4% 49.6% 3.1
4
Sentinel
IFMR Capital
2016
1,873.7 Par with
EIS Microfinance 2.5% 15 87.9% 90.0% 79.3% 72.0% 7.0% 19.9% 6.8% 7.5% 0.2% 8.7% 7.1% 5.6% 1.9% - 0.0% - 25.7% 1.7% 68.6% 1.7
5
Architect
IFMR Capital
2016
1,408.3 Par with
EIS Microfinance 2.8% 15 80.2% 89.5% 79.4% 73.1% 5.8% 21.8% 7.0% 8.1% 0.2% 8.6% 6.9% 5.5% 1.9% - 0.0% - 19.9% 3.3% 66.0% 2.3
6 Oracle IFMR
Capital 2016 1,881.0
Par with
EIS Microfinance 2.8% 15 78.7% 89.8% 80.2% 73.7% 6.7% 21.0% 6.6% 7.5% 0.2% 8.3% 6.6% 5.3% 1.7% - 0.0% - 16.6% 1.9% 76.2% 1.7
7 Cypher IFMR
Capital 2016 2,527.6
Par with
EIS Microfinance 2.8% 14 86.9% 91.9% 80.6% 74.4% 6.7% 11.4% 0.7% 1.0% 0.2% 7.0% 3.9% 4.2% 0.3% - 0.0% - 30.4% 4.0% 47.4%
Above
20
times
8 Niobe IFMR
Capital 2016 2,195.2
Par with
EIS Microfinance 4.1% 15 80.3% 89.3% 79.2% 73.1% 5.9% 22.2% 7.3% 8.5% 0.3% 8.8% 7.0% 5.6% 2.0% - 0.0% - 25.7% 1.9% 69.5% 1.9
9 Mjolnir IFMR
Capital 2016 543.0
Par with
EIS Microfinance 2.5% 15 80.0% 88.8% 76.3% 70.8% 8.1% 23.7% 7.2% 7.9% 0.3% 9.4% 7.7% 5.8% 1.9% - 0.0% - 16.2% 2.0% 73.4% 1.7
10
Icharus
IFMR Capital
2016
531.6 Par with
EIS Microfinance 2.5% 15 81.7% 88.8% 76.2% 71.2% 8.0% 23.5% 7.2% 7.7% 0.2% 9.4% 7.6% 5.7% 1.9% - 0.0% - 15.8% 1.4% 83.0% 1.1
11 Frey IFMR
Capital 2016 780.9
Par with
EIS Microfinance 2.2% 14 90.2% 90.6% 82.5% 72.7% 8.5% 19.1% 6.9% 8.1% 0.3% 8.5% 7.1% 6.1% 2.3% - 0.0% - 29.8% 0.4% 58.7% 1.9
30
Classification: INTERNAL: CONFIDENTIAL
Magma Fincorp Limited- Initial Pool Details
Sr.
no
Transaction
name
Pool
principal
(Rs. Mn)
Investor
payouts
(Rs. Mn)
Pool
cashflows
(Rs. Mn)
Structure
Pool Characteristics
Overdue
composition
(0, 1, 2)
Credit Support
Current Rating/
Credit Opinion Asset class Asset type
(New, Used)
Pool
duration
(months)
WAS
(months) WAL WAY
Credit
collateral as
% of pool
cashflows
First loss
facility as %
of pool
cashflows
Second loss
facility as %
of pool
cashflows
Liquidity
facility as
% of pool
cashflows
Scheduled
EIS as % of
pool
cashflows
Subordinated
cashflows as %
of pool
cashflows
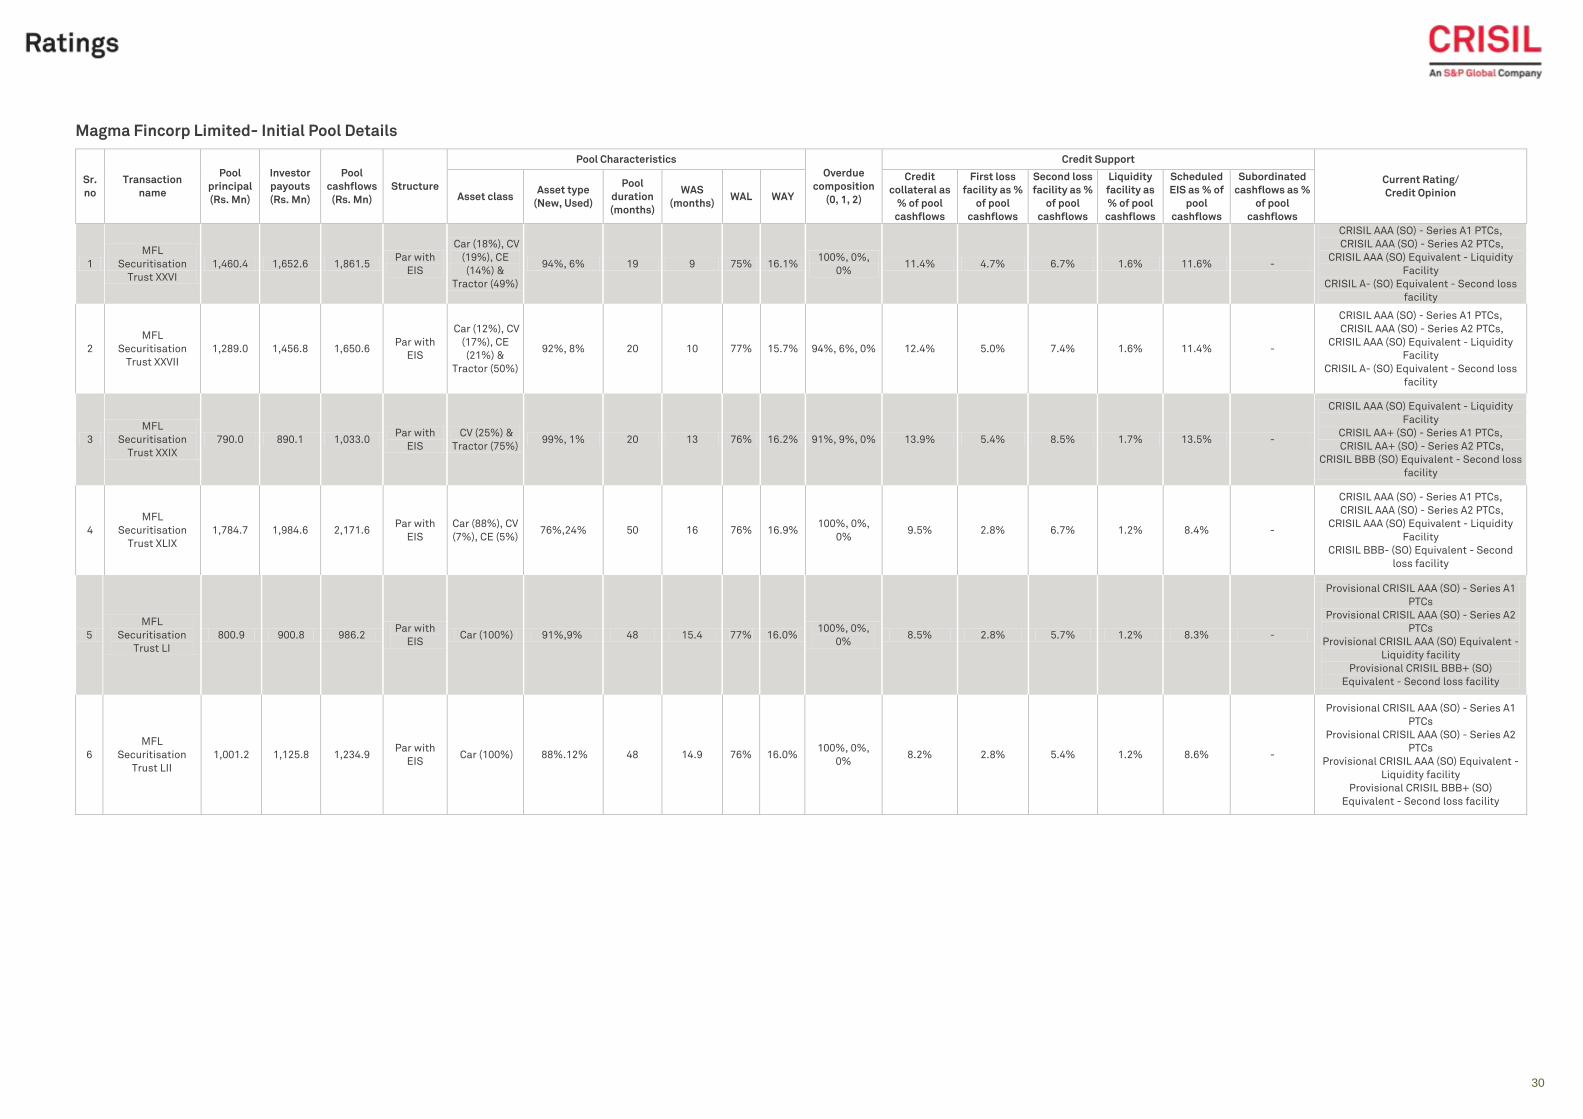
1
MFL
Securitisation
Trust XXVI
1,460.4 1,652.6 1,861.5 Par with
EIS
Car (18%), CV
(19%), CE
(14%) &
Tractor (49%)
94%, 6% 19 9 75% 16.1% 100%, 0%,
0% 11.4% 4.7% 6.7% 1.6% 11.6% -
CRISIL AAA (SO) - Series A1 PTCs,
CRISIL AAA (SO) - Series A2 PTCs,
CRISIL AAA (SO) Equivalent - Liquidity
Facility
CRISIL A- (SO) Equivalent - Second loss
facility
2
MFL
Securitisation
Trust XXVII
1,289.0 1,456.8 1,650.6 Par with
EIS
Car (12%), CV
(17%), CE
(21%) &
Tractor (50%)
92%, 8% 20 10 77% 15.7% 94%, 6%, 0% 12.4% 5.0% 7.4% 1.6% 11.4% -
CRISIL AAA (SO) - Series A1 PTCs,
CRISIL AAA (SO) - Series A2 PTCs,
CRISIL AAA (SO) Equivalent - Liquidity
Facility
CRISIL A- (SO) Equivalent - Second loss
facility
3
MFL
Securitisation
Trust XXIX
790.0 890.1 1,033.0 Par with
EIS
CV (25%) &
Tractor (75%) 99%, 1% 20 13 76% 16.2% 91%, 9%, 0% 13.9% 5.4% 8.5% 1.7% 13.5% -
CRISIL AAA (SO) Equivalent - Liquidity
Facility
CRISIL AA+ (SO) - Series A1 PTCs,
CRISIL AA+ (SO) - Series A2 PTCs,
CRISIL BBB (SO) Equivalent - Second loss
facility
4
MFL
Securitisation
Trust XLIX
1,784.7 1,984.6 2,171.6 Par with
EIS
Car (88%), CV
(7%), CE (5%) 76%,24% 50 16 76% 16.9%
100%, 0%,
0% 9.5% 2.8% 6.7% 1.2% 8.4% -
CRISIL AAA (SO) - Series A1 PTCs,
CRISIL AAA (SO) - Series A2 PTCs,
CRISIL AAA (SO) Equivalent - Liquidity
Facility
CRISIL BBB- (SO) Equivalent - Second
loss facility
5
MFL
Securitisation
Trust LI
800.9 900.8 986.2 Par with
EIS Car (100%) 91%,9% 48 15.4 77% 16.0%
100%, 0%,
0% 8.5% 2.8% 5.7% 1.2% 8.3% -
Provisional CRISIL AAA (SO) - Series A1
PTCs
Provisional CRISIL AAA (SO) - Series A2
PTCs
Provisional CRISIL AAA (SO) Equivalent -
Liquidity facility
Provisional CRISIL BBB+ (SO)
Equivalent - Second loss facility
6
MFL
Securitisation
Trust LII
1,001.2 1,125.8 1,234.9 Par with
EIS Car (100%) 88%.12% 48 14.9 76% 16.0%
100%, 0%,
0% 8.2% 2.8% 5.4% 1.2% 8.6% -
Provisional CRISIL AAA (SO) - Series A1
PTCs
Provisional CRISIL AAA (SO) - Series A2
PTCs
Provisional CRISIL AAA (SO) Equivalent -
Liquidity facility
Provisional CRISIL BBB+ (SO)
Equivalent - Second loss facility
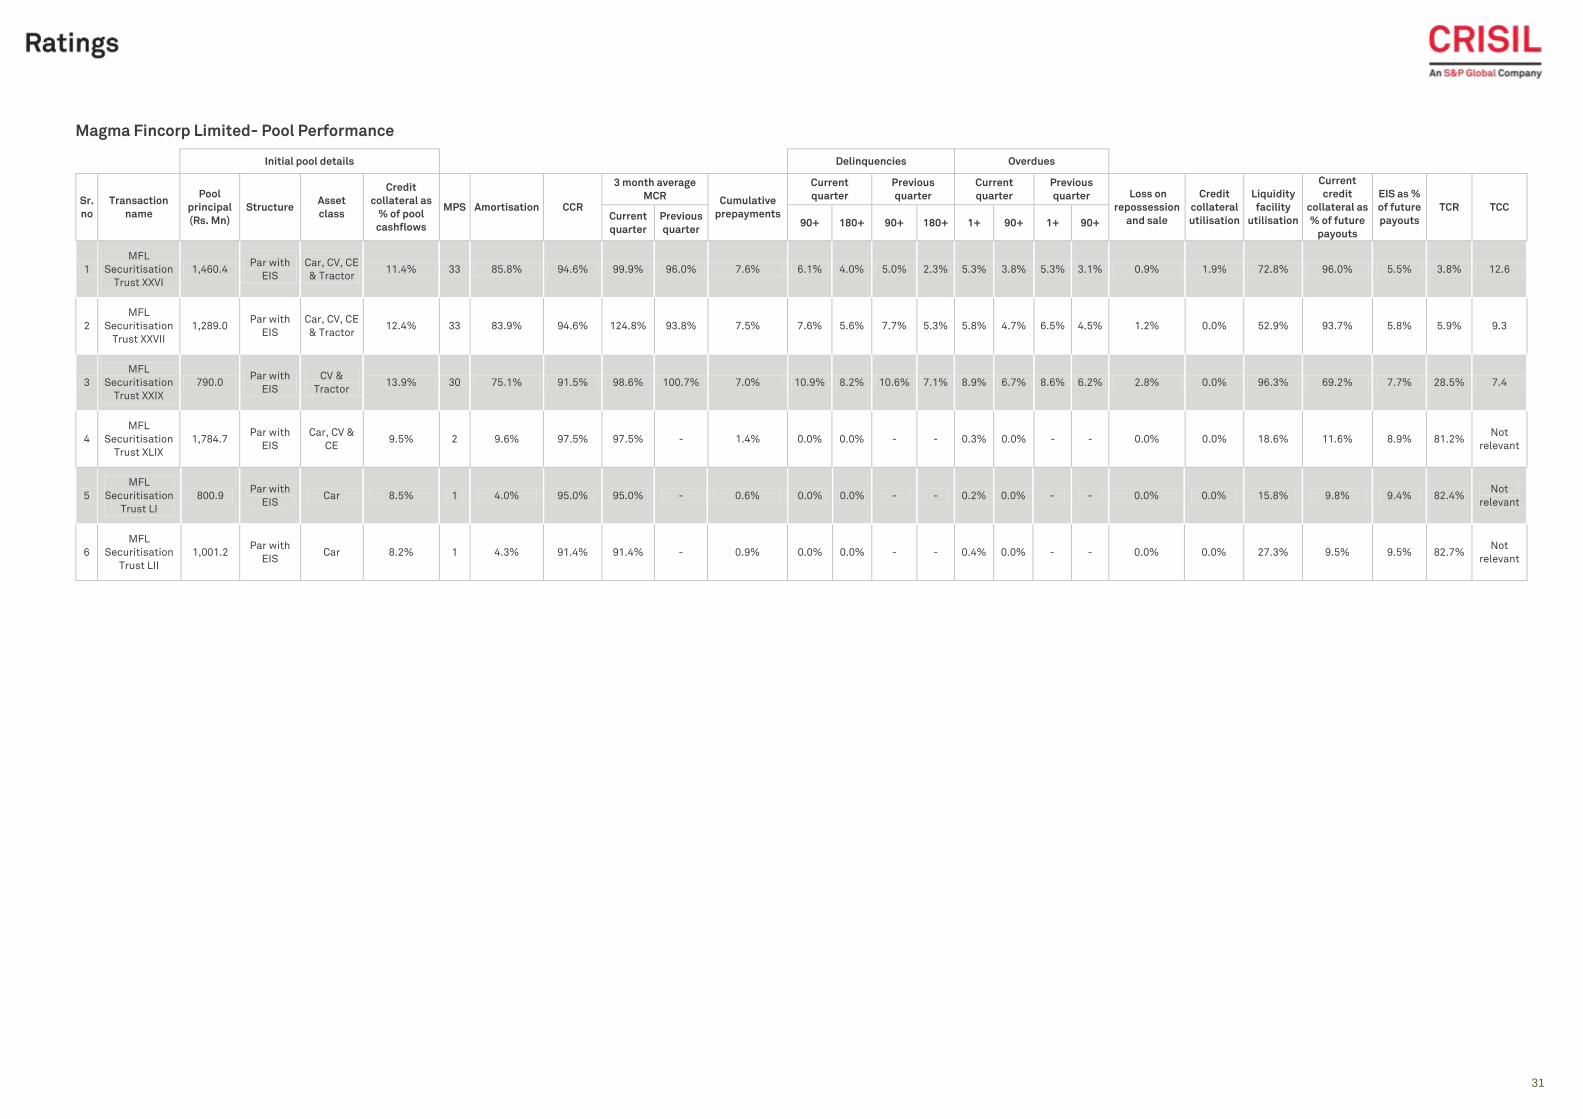
31
Classification: INTERNAL: CONFIDENTIAL
Magma Fincorp Limited- Pool Performance
Initial pool details Delinquencies Overdues
Sr.
no
Transaction
name
Pool
principal
(Rs. Mn)
Structure Asset
class
Credit
collateral as
% of pool
cashflows
MPS Amortisation CCR
3 month average
MCR Cumulative
prepayments
Current
quarter
Previous
quarter
Current
quarter
Previous
quarter Loss on
repossession
and sale
Credit
collateral
utilisation
Liquidity
facility
utilisation
Current
credit
collateral as
% of future
payouts
EIS as %
of future
payouts
TCR TCC Current
quarter
Previous
quarter 90+ 180+ 90+ 180+ 1+ 90+ 1+ 90+
1
MFL
Securitisation
Trust XXVI
1,460.4 Par with
EIS
Car, CV, CE
& Tractor 11.4% 33 85.8% 94.6% 99.9% 96.0% 7.6% 6.1% 4.0% 5.0% 2.3% 5.3% 3.8% 5.3% 3.1% 0.9% 1.9% 72.8% 96.0% 5.5% 3.8% 12.6
2
MFL
Securitisation
Trust XXVII
1,289.0 Par with
EIS
Car, CV, CE
& Tractor 12.4% 33 83.9% 94.6% 124.8% 93.8% 7.5% 7.6% 5.6% 7.7% 5.3% 5.8% 4.7% 6.5% 4.5% 1.2% 0.0% 52.9% 93.7% 5.8% 5.9% 9.3
3
MFL
Securitisation
Trust XXIX
790.0 Par with
EIS
CV &
Tractor 13.9% 30 75.1% 91.5% 98.6% 100.7% 7.0% 10.9% 8.2% 10.6% 7.1% 8.9% 6.7% 8.6% 6.2% 2.8% 0.0% 96.3% 69.2% 7.7% 28.5% 7.4
4
MFL
Securitisation
Trust XLIX
1,784.7 Par with
EIS
Car, CV &
CE 9.5% 2 9.6% 97.5% 97.5% - 1.4% 0.0% 0.0% - - 0.3% 0.0% - - 0.0% 0.0% 18.6% 11.6% 8.9% 81.2%
Not
relevant
5
MFL
Securitisation
Trust LI
800.9 Par with
EIS Car 8.5% 1 4.0% 95.0% 95.0% - 0.6% 0.0% 0.0% - - 0.2% 0.0% - - 0.0% 0.0% 15.8% 9.8% 9.4% 82.4%
Not
relevant
6
MFL
Securitisation
Trust LII
1,001.2 Par with
EIS Car 8.2% 1 4.3% 91.4% 91.4% - 0.9% 0.0% 0.0% - - 0.4% 0.0% - - 0.0% 0.0% 27.3% 9.5% 9.5% 82.7%
Not
relevant
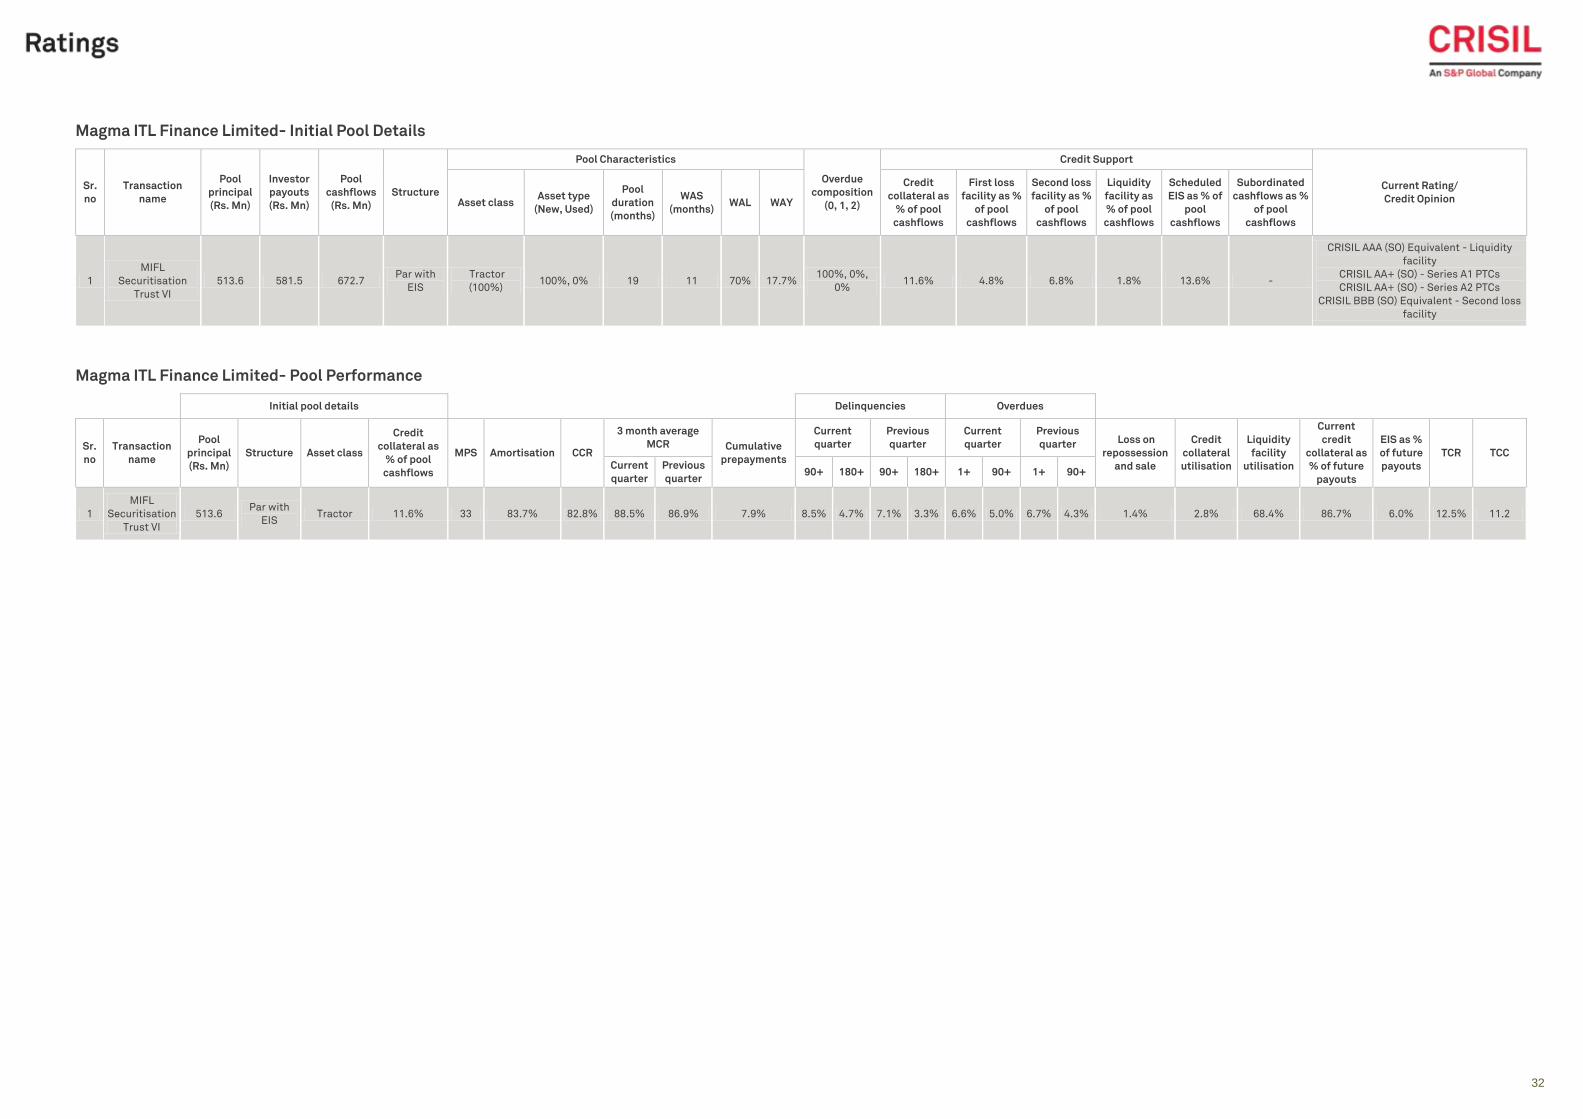
32
Classification: INTERNAL: CONFIDENTIAL
Magma ITL Finance Limited- Initial Pool Details
Sr.
no
Transaction
name
Pool
principal
(Rs. Mn)
Investor
payouts
(Rs. Mn)
Pool
cashflows
(Rs. Mn)
Structure
Pool Characteristics
Overdue
composition
(0, 1, 2)
Credit Support
Current Rating/
Credit Opinion Asset class Asset type
(New, Used)
Pool
duration
(months)
WAS
(months) WAL WAY
Credit
collateral as
% of pool
cashflows
First loss
facility as %
of pool
cashflows
Second loss
facility as %
of pool
cashflows
Liquidity
facility as
% of pool
cashflows
Scheduled
EIS as % of
pool
cashflows
Subordinated
cashflows as %
of pool
cashflows
1
MIFL
Securitisation
Trust VI
513.6 581.5 672.7 Par with
EIS
Tractor
(100%) 100%, 0% 19 11 70% 17.7%
100%, 0%,
0% 11.6% 4.8% 6.8% 1.8% 13.6% -
CRISIL AAA (SO) Equivalent - Liquidity
facility
CRISIL AA+ (SO) - Series A1 PTCs
CRISIL AA+ (SO) - Series A2 PTCs
CRISIL BBB (SO) Equivalent - Second loss
facility
Magma ITL Finance Limited- Pool Performance
Initial pool details Delinquencies Overdues
Sr.
no
Transaction
name
Pool
principal
(Rs. Mn)
Structure Asset class
Credit
collateral as
% of pool
cashflows
MPS Amortisation CCR
3 month average
MCR Cumulative
prepayments
Current
quarter
Previous
quarter
Current
quarter
Previous
quarter Loss on
repossession
and sale
Credit
collateral
utilisation
Liquidity
facility
utilisation
Current
credit
collateral as
% of future
payouts
EIS as %
of future
payouts
TCR TCC
Current
quarter
Previous
quarter 90+ 180+ 90+ 180+ 1+ 90+ 1+ 90+
1
MIFL
Securitisation
Trust VI
513.6 Par with
EIS Tractor 11.6% 33 83.7% 82.8% 88.5% 86.9% 7.9% 8.5% 4.7% 7.1% 3.3% 6.6% 5.0% 6.7% 4.3% 1.4% 2.8% 68.4% 86.7% 6.0% 12.5% 11.2
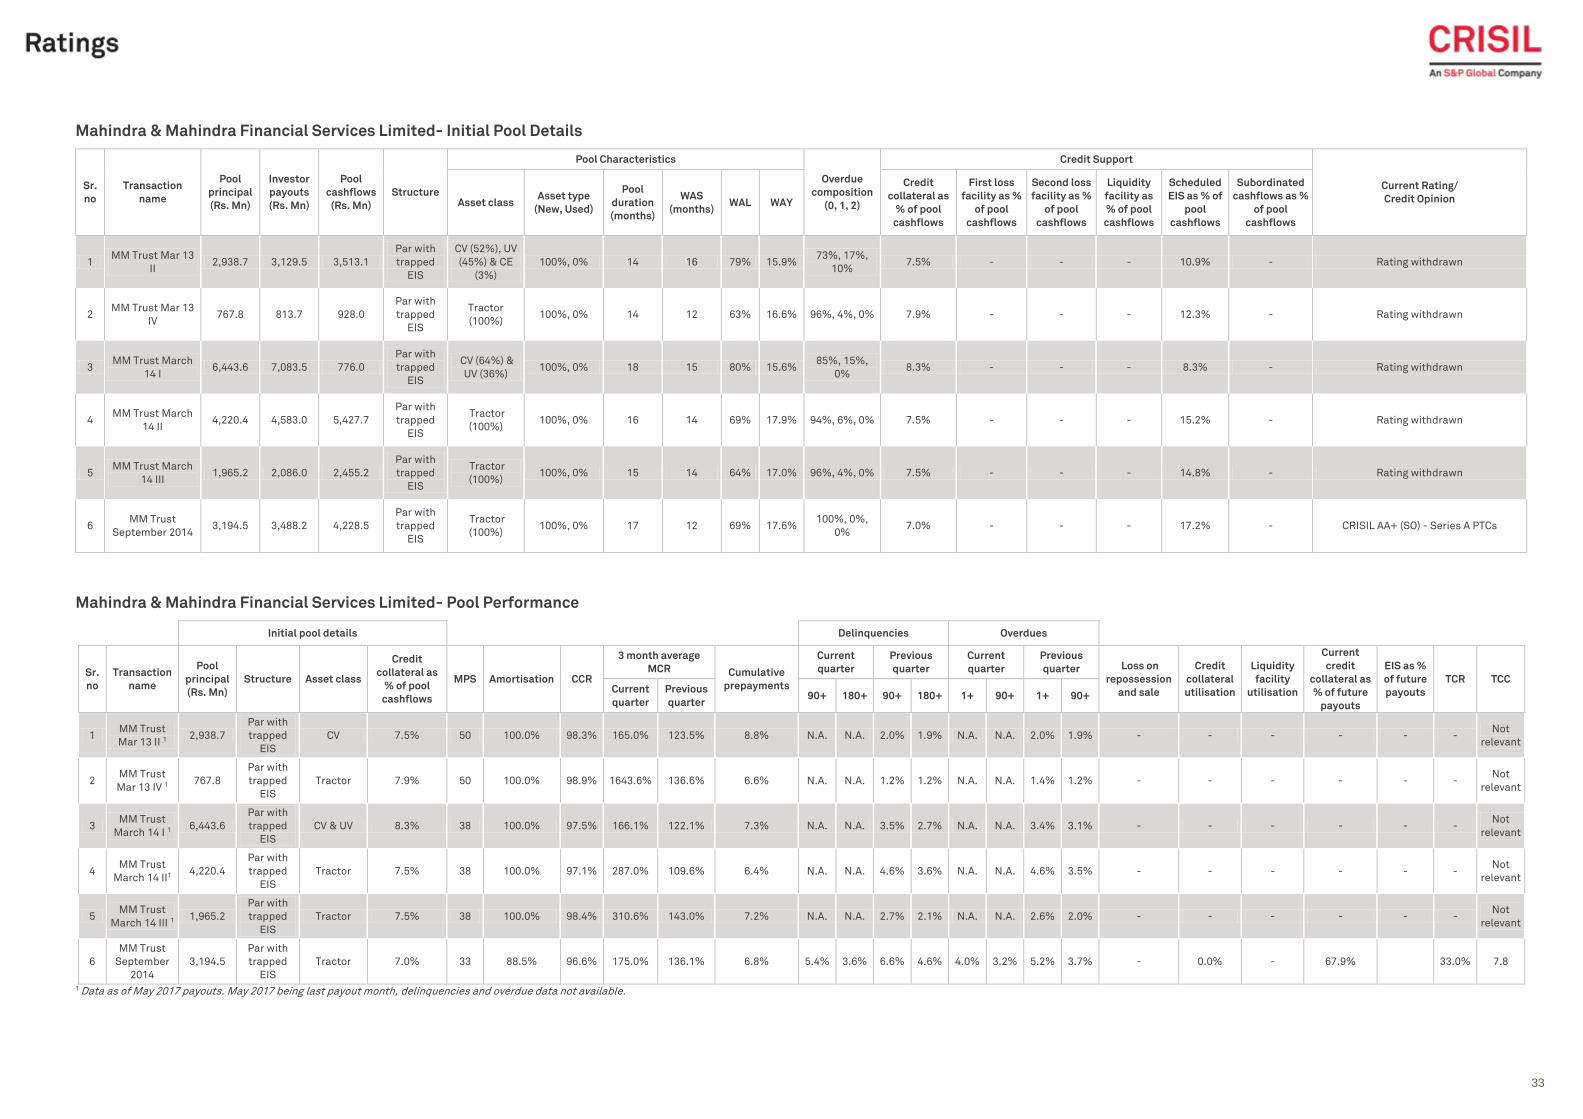
33
Classification: INTERNAL: CONFIDENTIAL
Mahindra & Mahindra Financial Services Limited- Initial Pool Details
Sr.
no
Transaction
name
Pool
principal
(Rs. Mn)
Investor
payouts
(Rs. Mn)
Pool
cashflows
(Rs. Mn)
Structure
Pool Characteristics
Overdue
composition
(0, 1, 2)
Credit Support
Current Rating/
Credit Opinion Asset class Asset type
(New, Used)
Pool
duration
(months)
WAS
(months) WAL WAY
Credit
collateral as
% of pool
cashflows
First loss
facility as %
of pool
cashflows
Second loss
facility as %
of pool
cashflows
Liquidity
facility as
% of pool
cashflows
Scheduled
EIS as % of
pool
cashflows
Subordinated
cashflows as %
of pool
cashflows
1 MM Trust Mar 13
II 2,938.7 3,129.5 3,513.1
Par with
trapped
EIS
CV (52%), UV
(45%) & CE
(3%)
100%, 0% 14 16 79% 15.9% 73%, 17%,
10% 7.5% - - - 10.9% - Rating withdrawn
2 MM Trust Mar 13
IV 767.8 813.7 928.0
Par with
trapped
EIS
Tractor
(100%) 100%, 0% 14 12 63% 16.6% 96%, 4%, 0% 7.9% - - - 12.3% - Rating withdrawn
3 MM Trust March
14 I 6,443.6 7,083.5 776.0
Par with
trapped
EIS
CV (64%) &
UV (36%) 100%, 0% 18 15 80% 15.6%
85%, 15%,
0% 8.3% - - - 8.3% - Rating withdrawn
4 MM Trust March
14 II 4,220.4 4,583.0 5,427.7
Par with
trapped
EIS
Tractor
(100%) 100%, 0% 16 14 69% 17.9% 94%, 6%, 0% 7.5% - - - 15.2% - Rating withdrawn
5 MM Trust March
14 III 1,965.2 2,086.0 2,455.2
Par with
trapped
EIS
Tractor
(100%) 100%, 0% 15 14 64% 17.0% 96%, 4%, 0% 7.5% - - - 14.8% - Rating withdrawn
6 MM Trust
September 2014 3,194.5 3,488.2 4,228.5
Par with
trapped
EIS
Tractor
(100%) 100%, 0% 17 12 69% 17.6%
100%, 0%,
0% 7.0% - - - 17.2% - CRISIL AA+ (SO) - Series A PTCs
Mahindra & Mahindra Financial Services Limited- Pool Performance
Initial pool details Delinquencies Overdues
Sr.
no
Transaction
name
Pool
principal
(Rs. Mn)
Structure Asset class
Credit
collateral as
% of pool
cashflows
MPS Amortisation CCR
3 month average
MCR Cumulative
prepayments
Current
quarter
Previous
quarter
Current
quarter
Previous
quarter Loss on
repossession
and sale
Credit
collateral
utilisation
Liquidity
facility
utilisation
Current
credit
collateral as
% of future
payouts
EIS as %
of future
payouts
TCR TCC Current
quarter
Previous
quarter 90+ 180+ 90+ 180+ 1+ 90+ 1+ 90+
1 MM Trust
Mar 13 II 1 2,938.7
Par with
trapped
EIS
CV 7.5% 50 100.0% 98.3% 165.0% 123.5% 8.8% N.A. N.A. 2.0% 1.9% N.A. N.A. 2.0% 1.9% - - - - - - Not
relevant
2 MM Trust
Mar 13 IV 1 767.8
Par with
trapped
EIS
Tractor 7.9% 50 100.0% 98.9% 1643.6% 136.6% 6.6% N.A. N.A. 1.2% 1.2% N.A. N.A. 1.4% 1.2% - - - - - - Not
relevant
3 MM Trust
March 14 I 1 6,443.6
Par with
trapped
EIS
CV & UV 8.3% 38 100.0% 97.5% 166.1% 122.1% 7.3% N.A. N.A. 3.5% 2.7% N.A. N.A. 3.4% 3.1% - - - - - - Not
relevant
4 MM Trust
March 14 II1 4,220.4
Par with
trapped
EIS
Tractor 7.5% 38 100.0% 97.1% 287.0% 109.6% 6.4% N.A. N.A. 4.6% 3.6% N.A. N.A. 4.6% 3.5% - - - - - - Not
relevant
5 MM Trust
March 14 III 1 1,965.2
Par with
trapped
EIS
Tractor 7.5% 38 100.0% 98.4% 310.6% 143.0% 7.2% N.A. N.A. 2.7% 2.1% N.A. N.A. 2.6% 2.0% - - - - - - Not
relevant
6
MM Trust
September
2014
3,194.5
Par with
trapped
EIS
Tractor 7.0% 33 88.5% 96.6% 175.0% 136.1% 6.8% 5.4% 3.6% 6.6% 4.6% 4.0% 3.2% 5.2% 3.7% - 0.0% - 67.9% 33.0% 7.8
1 Data as of May 2017 payouts. May 2017 being last payout month, delinquencies and overdue data not available.
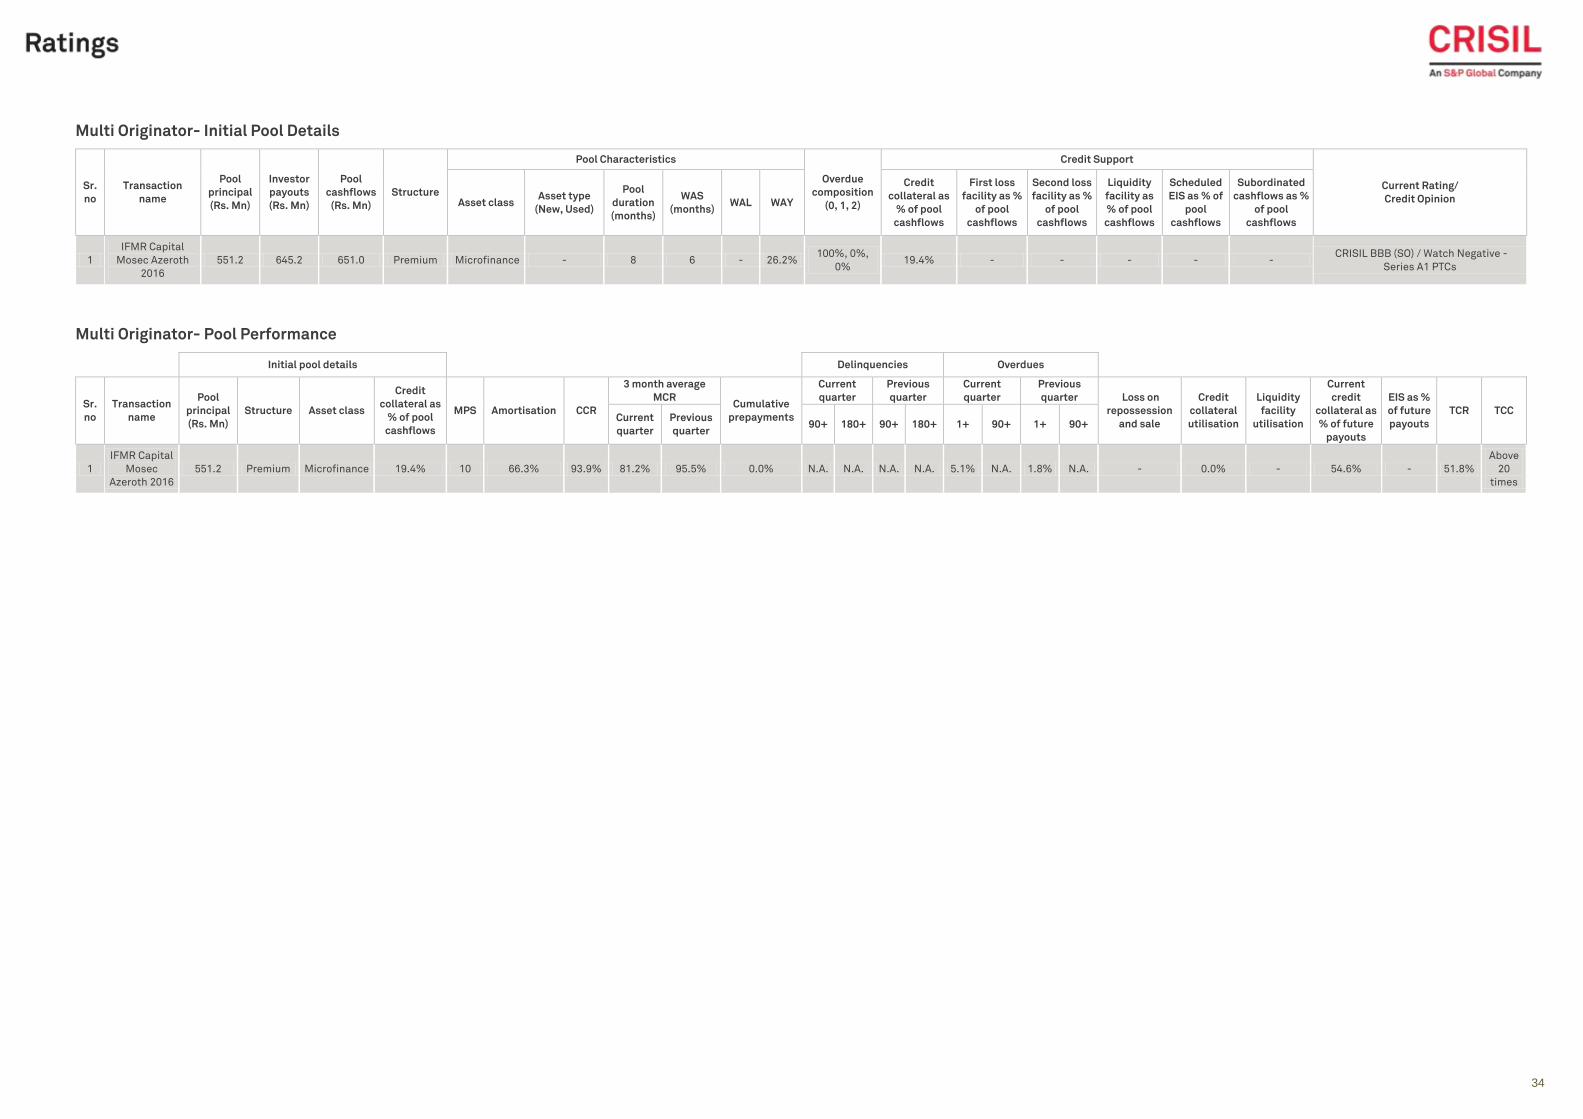
34
Classification: INTERNAL: CONFIDENTIAL
Multi Originator- Initial Pool Details
Sr.
no
Transaction
name
Pool
principal
(Rs. Mn)
Investor
payouts
(Rs. Mn)
Pool
cashflows
(Rs. Mn)
Structure
Pool Characteristics
Overdue
composition
(0, 1, 2)
Credit Support
Current Rating/
Credit Opinion Asset class Asset type
(New, Used)
Pool
duration
(months)
WAS
(months) WAL WAY
Credit
collateral as
% of pool
cashflows
First loss
facility as %
of pool
cashflows
Second loss
facility as %
of pool
cashflows
Liquidity
facility as
% of pool
cashflows
Scheduled
EIS as % of
pool
cashflows
Subordinated
cashflows as %
of pool
cashflows
1
IFMR Capital
Mosec Azeroth
2016
551.2 645.2 651.0 Premium Microfinance - 8 6 - 26.2% 100%, 0%,
0% 19.4% - - - - -
CRISIL BBB (SO) / Watch Negative -
Series A1 PTCs
Multi Originator- Pool Performance
Initial pool details Delinquencies Overdues
Sr.
no
Transaction
name
Pool
principal
(Rs. Mn)
Structure Asset class
Credit
collateral as
% of pool
cashflows
MPS Amortisation CCR
3 month average
MCR Cumulative
prepayments
Current
quarter
Previous
quarter
Current
quarter
Previous
quarter Loss on
repossession
and sale
Credit
collateral
utilisation
Liquidity
facility
utilisation
Current
credit
collateral as
% of future
payouts
EIS as %
of future
payouts
TCR TCC Current
quarter
Previous
quarter 90+ 180+ 90+ 180+ 1+ 90+ 1+ 90+
1
IFMR Capital
Mosec
Azeroth 2016
551.2 Premium Microfinance 19.4% 10 66.3% 93.9% 81.2% 95.5% 0.0% N.A. N.A. N.A. N.A. 5.1% N.A. 1.8% N.A. - 0.0% - 54.6% - 51.8%
Above
20
times
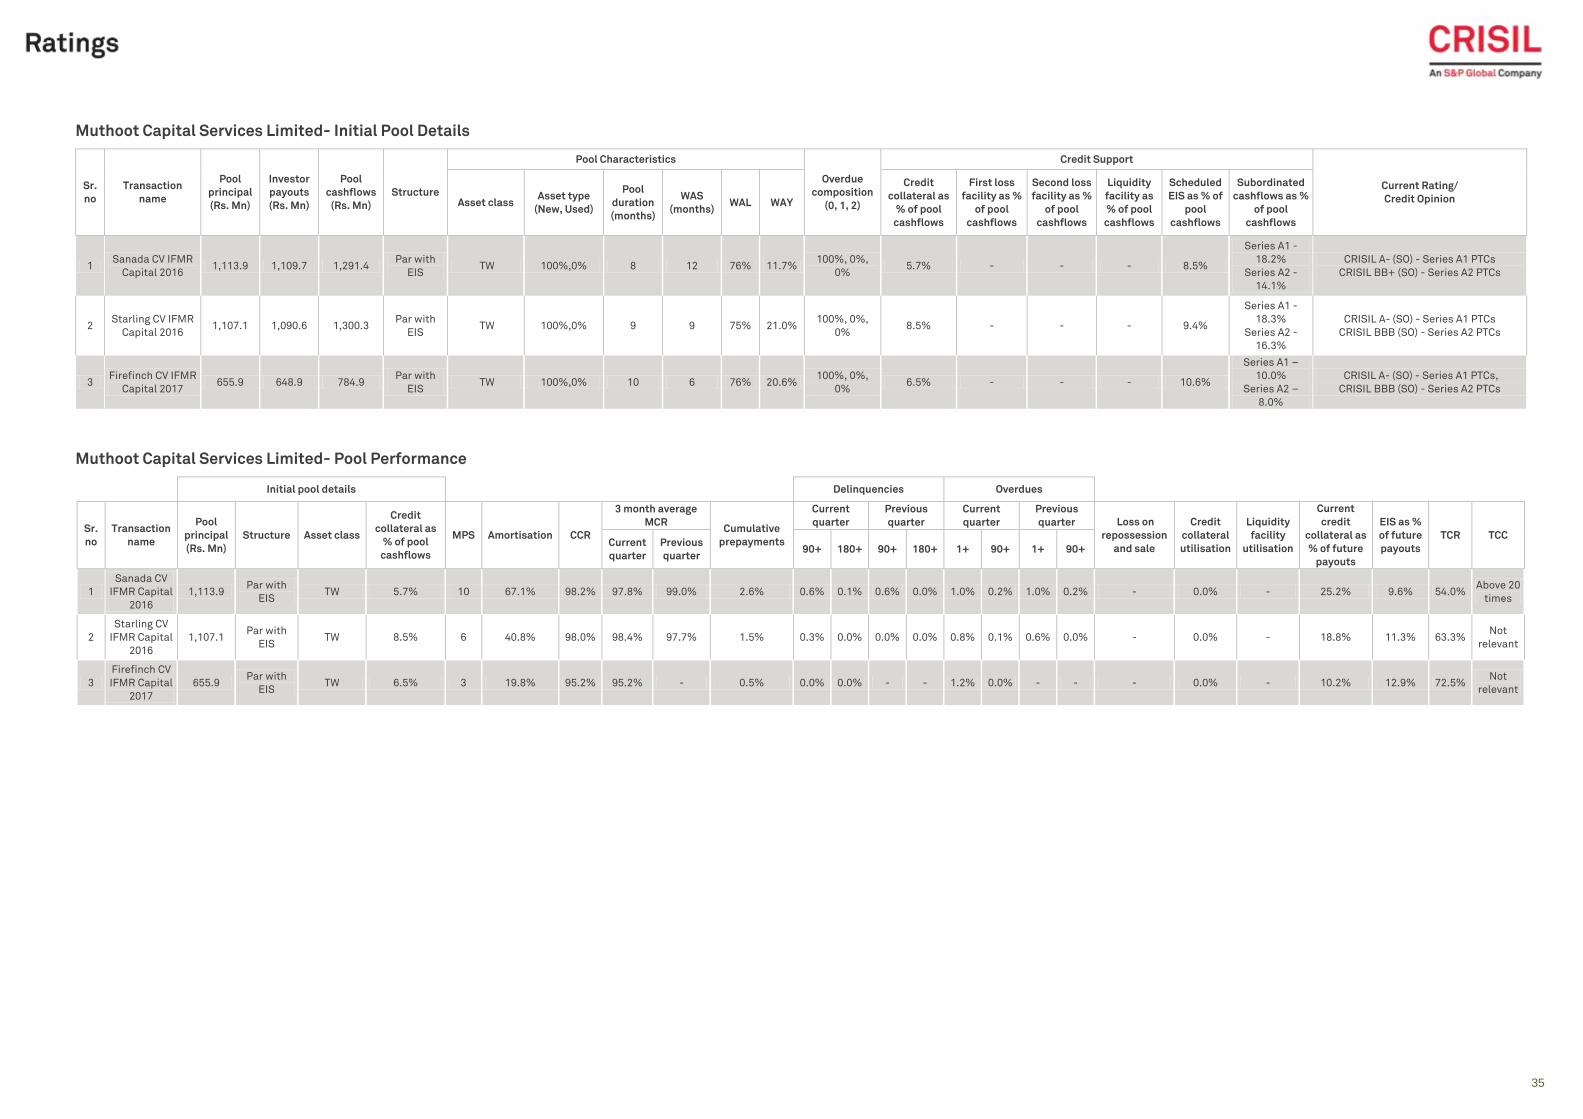
35
Classification: INTERNAL: CONFIDENTIAL
Muthoot Capital Services Limited- Initial Pool Details
Sr.
no
Transaction
name
Pool
principal
(Rs. Mn)
Investor
payouts
(Rs. Mn)
Pool
cashflows
(Rs. Mn)
Structure
Pool Characteristics
Overdue
composition
(0, 1, 2)
Credit Support
Current Rating/
Credit Opinion Asset class Asset type
(New, Used)
Pool
duration
(months)
WAS
(months) WAL WAY
Credit
collateral as
% of pool
cashflows
First loss
facility as %
of pool
cashflows
Second loss
facility as %
of pool
cashflows
Liquidity
facility as
% of pool
cashflows
Scheduled
EIS as % of
pool
cashflows
Subordinated
cashflows as %
of pool
cashflows
1 Sanada CV IFMR
Capital 2016 1,113.9 1,109.7 1,291.4
Par with
EIS TW 100%,0% 8 12 76% 11.7%
100%, 0%,
0% 5.7% - - - 8.5%
Series A1 -
18.2%
Series A2 -
14.1%
CRISIL A- (SO) - Series A1 PTCs
CRISIL BB+ (SO) - Series A2 PTCs
2 Starling CV IFMR
Capital 2016 1,107.1 1,090.6 1,300.3
Par with
EIS TW 100%,0% 9 9 75% 21.0%
100%, 0%,
0% 8.5% - - - 9.4%
Series A1 -
18.3%
Series A2 -
16.3%
CRISIL A- (SO) - Series A1 PTCs
CRISIL BBB (SO) - Series A2 PTCs
3 Firefinch CV IFMR
Capital 2017 655.9 648.9 784.9
Par with
EIS TW 100%,0% 10 6 76% 20.6%
100%, 0%,
0% 6.5% - - - 10.6%
Series A1 –
10.0%
Series A2 –
8.0%
CRISIL A- (SO) - Series A1 PTCs,
CRISIL BBB (SO) - Series A2 PTCs
Muthoot Capital Services Limited- Pool Performance
Initial pool details Delinquencies Overdues
Sr.
no
Transaction
name
Pool
principal
(Rs. Mn)
Structure Asset class
Credit
collateral as
% of pool
cashflows
MPS Amortisation CCR
3 month average
MCR Cumulative
prepayments
Current
quarter
Previous
quarter
Current
quarter
Previous
quarter Loss on
repossession
and sale
Credit
collateral
utilisation
Liquidity
facility
utilisation
Current
credit
collateral as
% of future
payouts
EIS as %
of future
payouts
TCR TCC Current
quarter
Previous
quarter 90+ 180+ 90+ 180+ 1+ 90+ 1+ 90+
1
Sanada CV
IFMR Capital
2016
1,113.9 Par with
EIS TW 5.7% 10 67.1% 98.2% 97.8% 99.0% 2.6% 0.6% 0.1% 0.6% 0.0% 1.0% 0.2% 1.0% 0.2% - 0.0% - 25.2% 9.6% 54.0%
Above 20
times
2
Starling CV
IFMR Capital
2016
1,107.1 Par with
EIS TW 8.5% 6 40.8% 98.0% 98.4% 97.7% 1.5% 0.3% 0.0% 0.0% 0.0% 0.8% 0.1% 0.6% 0.0% - 0.0% - 18.8% 11.3% 63.3%
Not
relevant
3
Firefinch CV
IFMR Capital
2017
655.9 Par with
EIS TW 6.5% 3 19.8% 95.2% 95.2% - 0.5% 0.0% 0.0% - - 1.2% 0.0% - - - 0.0% - 10.2% 12.9% 72.5%
Not
relevant
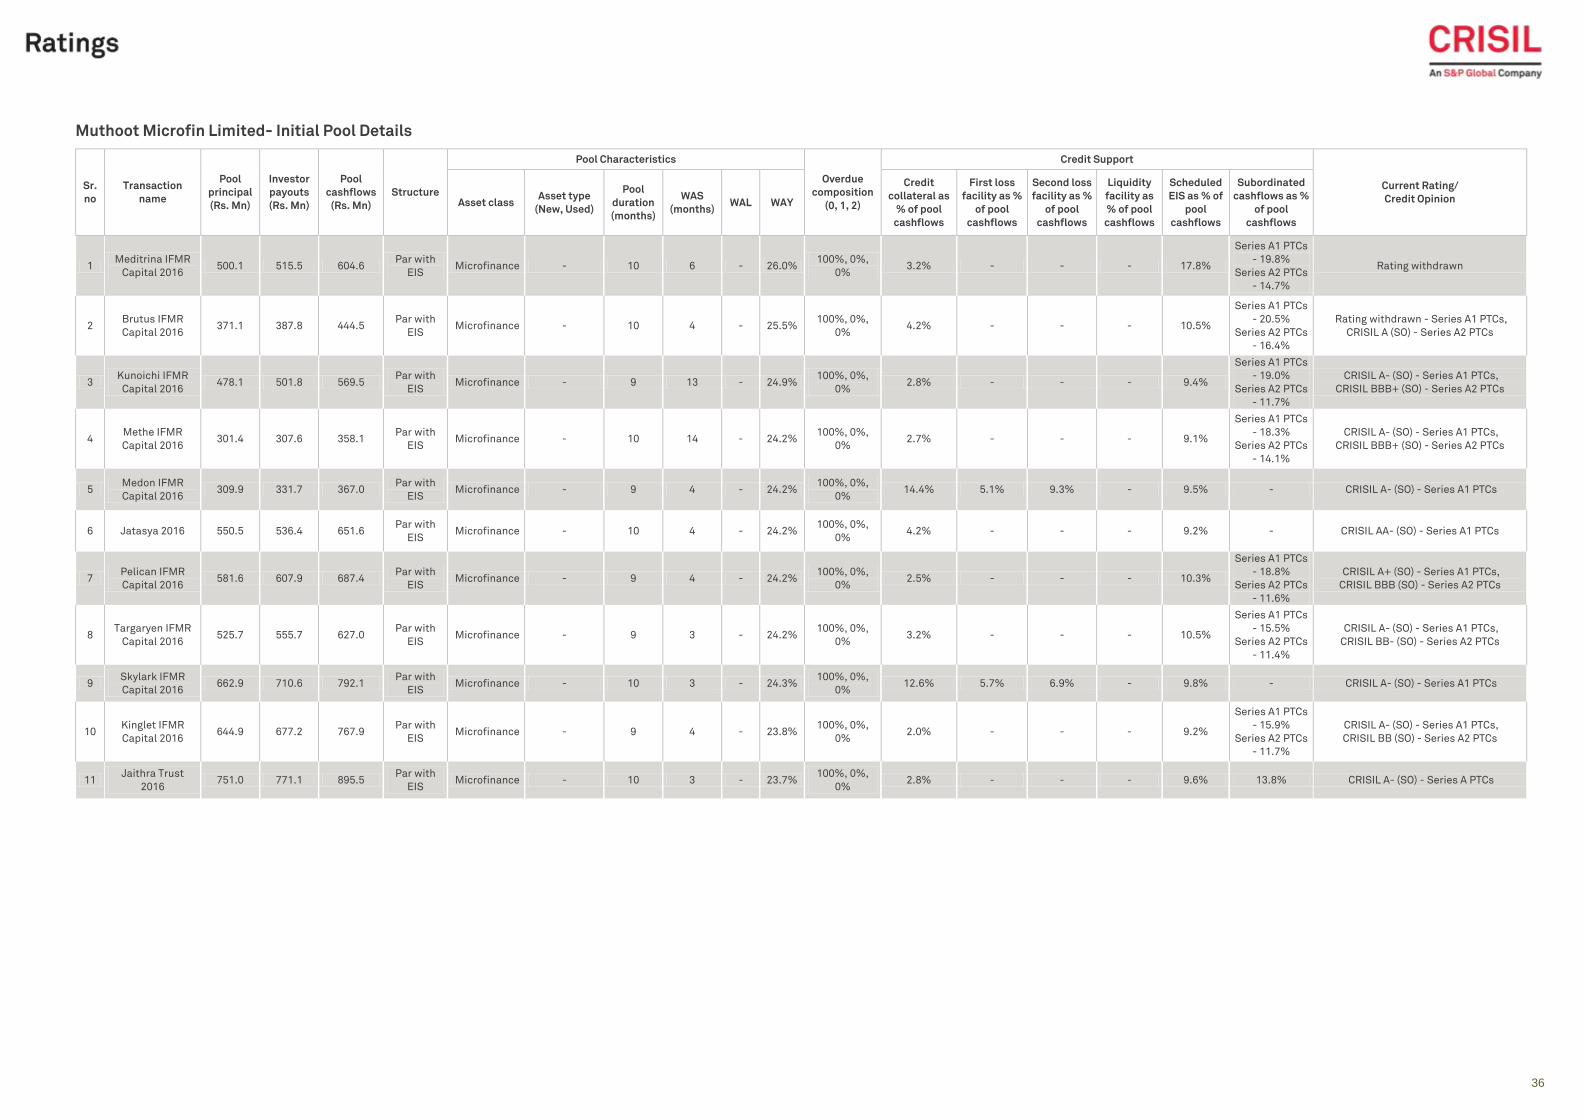
36
Classification: INTERNAL: CONFIDENTIAL
Muthoot Microfin Limited- Initial Pool Details
Sr.
no
Transaction
name
Pool
principal
(Rs. Mn)
Investor
payouts
(Rs. Mn)
Pool
cashflows
(Rs. Mn)
Structure
Pool Characteristics
Overdue
composition
(0, 1, 2)
Credit Support
Current Rating/
Credit Opinion Asset class Asset type
(New, Used)
Pool
duration
(months)
WAS
(months) WAL WAY
Credit
collateral as
% of pool
cashflows
First loss
facility as %
of pool
cashflows
Second loss
facility as %
of pool
cashflows
Liquidity
facility as
% of pool
cashflows
Scheduled
EIS as % of
pool
cashflows
Subordinated
cashflows as %
of pool
cashflows
1 Meditrina IFMR
Capital 2016 500.1 515.5 604.6
Par with
EIS Microfinance - 10 6 - 26.0%
100%, 0%,
0% 3.2% - - - 17.8%
Series A1 PTCs
- 19.8%
Series A2 PTCs
- 14.7%
Rating withdrawn
2 Brutus IFMR
Capital 2016 371.1 387.8 444.5
Par with
EIS Microfinance - 10 4 - 25.5%
100%, 0%,
0% 4.2% - - - 10.5%
Series A1 PTCs
- 20.5%
Series A2 PTCs
- 16.4%
Rating withdrawn - Series A1 PTCs,
CRISIL A (SO) - Series A2 PTCs
3 Kunoichi IFMR
Capital 2016 478.1 501.8 569.5
Par with
EIS Microfinance - 9 13 - 24.9%
100%, 0%,
0% 2.8% - - - 9.4%
Series A1 PTCs
- 19.0%
Series A2 PTCs
- 11.7%
CRISIL A- (SO) - Series A1 PTCs,
CRISIL BBB+ (SO) - Series A2 PTCs
4 Methe IFMR
Capital 2016 301.4 307.6 358.1
Par with
EIS Microfinance - 10 14 - 24.2%
100%, 0%,
0% 2.7% - - - 9.1%
Series A1 PTCs
- 18.3%
Series A2 PTCs
- 14.1%
CRISIL A- (SO) - Series A1 PTCs,
CRISIL BBB+ (SO) - Series A2 PTCs
5 Medon IFMR
Capital 2016 309.9 331.7 367.0
Par with
EIS Microfinance - 9 4 - 24.2%
100%, 0%,
0% 14.4% 5.1% 9.3% - 9.5% - CRISIL A- (SO) - Series A1 PTCs
6 Jatasya 2016 550.5 536.4 651.6 Par with
EIS Microfinance - 10 4 - 24.2%
100%, 0%,
0% 4.2% - - - 9.2% - CRISIL AA- (SO) - Series A1 PTCs
7 Pelican IFMR
Capital 2016 581.6 607.9 687.4
Par with
EIS Microfinance - 9 4 - 24.2%
100%, 0%,
0% 2.5% - - - 10.3%
Series A1 PTCs
- 18.8%
Series A2 PTCs
- 11.6%
CRISIL A+ (SO) - Series A1 PTCs,
CRISIL BBB (SO) - Series A2 PTCs
8 Targaryen IFMR
Capital 2016 525.7 555.7 627.0
Par with
EIS Microfinance - 9 3 - 24.2%
100%, 0%,
0% 3.2% - - - 10.5%
Series A1 PTCs
- 15.5%
Series A2 PTCs
- 11.4%
CRISIL A- (SO) - Series A1 PTCs,
CRISIL BB- (SO) - Series A2 PTCs
9 Skylark IFMR
Capital 2016 662.9 710.6 792.1
Par with
EIS Microfinance - 10 3 - 24.3%
100%, 0%,
0% 12.6% 5.7% 6.9% - 9.8% - CRISIL A- (SO) - Series A1 PTCs
10 Kinglet IFMR
Capital 2016 644.9 677.2 767.9
Par with
EIS Microfinance - 9 4 - 23.8%
100%, 0%,
0% 2.0% - - - 9.2%
Series A1 PTCs
- 15.9%
Series A2 PTCs
- 11.7%
CRISIL A- (SO) - Series A1 PTCs,
CRISIL BB (SO) - Series A2 PTCs
11 Jaithra Trust
2016 751.0 771.1 895.5
Par with
EIS Microfinance - 10 3 - 23.7%
100%, 0%,
0% 2.8% - - - 9.6% 13.8% CRISIL A- (SO) - Series A PTCs
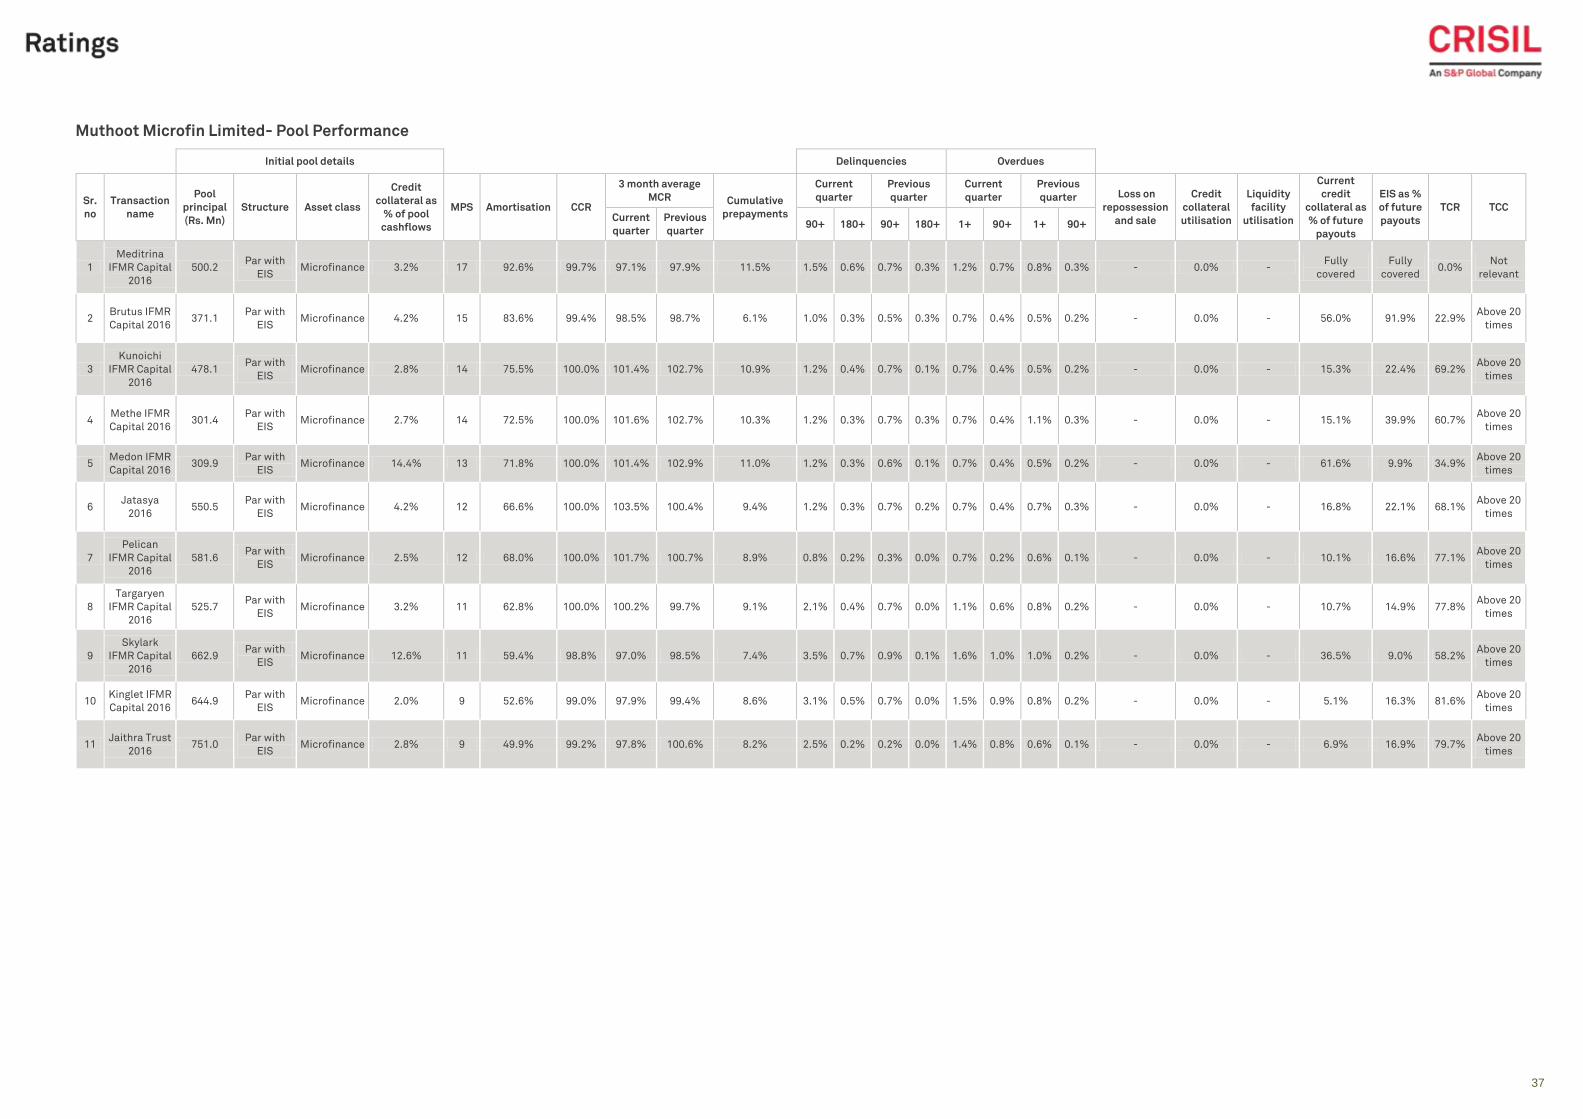
37
Classification: INTERNAL: CONFIDENTIAL
Muthoot Microfin Limited- Pool Performance
Initial pool details Delinquencies Overdues
Sr.
no
Transaction
name
Pool
principal
(Rs. Mn)
Structure Asset class
Credit
collateral as
% of pool
cashflows
MPS Amortisation CCR
3 month average
MCR Cumulative
prepayments
Current
quarter
Previous
quarter
Current
quarter
Previous
quarter Loss on
repossession
and sale
Credit
collateral
utilisation
Liquidity
facility
utilisation
Current
credit
collateral as
% of future
payouts
EIS as %
of future
payouts
TCR TCC Current
quarter
Previous
quarter 90+ 180+ 90+ 180+ 1+ 90+ 1+ 90+
1
Meditrina
IFMR Capital
2016
500.2 Par with
EIS Microfinance 3.2% 17 92.6% 99.7% 97.1% 97.9% 11.5% 1.5% 0.6% 0.7% 0.3% 1.2% 0.7% 0.8% 0.3% - 0.0% -
Fully
covered
Fully
covered 0.0%
Not
relevant
2 Brutus IFMR
Capital 2016 371.1
Par with
EIS Microfinance 4.2% 15 83.6% 99.4% 98.5% 98.7% 6.1% 1.0% 0.3% 0.5% 0.3% 0.7% 0.4% 0.5% 0.2% - 0.0% - 56.0% 91.9% 22.9%
Above 20
times
3
Kunoichi
IFMR Capital
2016
478.1 Par with
EIS Microfinance 2.8% 14 75.5% 100.0% 101.4% 102.7% 10.9% 1.2% 0.4% 0.7% 0.1% 0.7% 0.4% 0.5% 0.2% - 0.0% - 15.3% 22.4% 69.2%
Above 20
times
4 Methe IFMR
Capital 2016 301.4
Par with
EIS Microfinance 2.7% 14 72.5% 100.0% 101.6% 102.7% 10.3% 1.2% 0.3% 0.7% 0.3% 0.7% 0.4% 1.1% 0.3% - 0.0% - 15.1% 39.9% 60.7%
Above 20
times
5 Medon IFMR
Capital 2016 309.9
Par with
EIS Microfinance 14.4% 13 71.8% 100.0% 101.4% 102.9% 11.0% 1.2% 0.3% 0.6% 0.1% 0.7% 0.4% 0.5% 0.2% - 0.0% - 61.6% 9.9% 34.9%
Above 20
times
6 Jatasya
2016 550.5
Par with
EIS Microfinance 4.2% 12 66.6% 100.0% 103.5% 100.4% 9.4% 1.2% 0.3% 0.7% 0.2% 0.7% 0.4% 0.7% 0.3% - 0.0% - 16.8% 22.1% 68.1%
Above 20
times
7
Pelican
IFMR Capital
2016
581.6 Par with
EIS Microfinance 2.5% 12 68.0% 100.0% 101.7% 100.7% 8.9% 0.8% 0.2% 0.3% 0.0% 0.7% 0.2% 0.6% 0.1% - 0.0% - 10.1% 16.6% 77.1%
Above 20
times
8
Targaryen
IFMR Capital
2016
525.7 Par with
EIS Microfinance 3.2% 11 62.8% 100.0% 100.2% 99.7% 9.1% 2.1% 0.4% 0.7% 0.0% 1.1% 0.6% 0.8% 0.2% - 0.0% - 10.7% 14.9% 77.8%
Above 20
times
9
Skylark
IFMR Capital
2016
662.9 Par with
EIS Microfinance 12.6% 11 59.4% 98.8% 97.0% 98.5% 7.4% 3.5% 0.7% 0.9% 0.1% 1.6% 1.0% 1.0% 0.2% - 0.0% - 36.5% 9.0% 58.2%
Above 20
times
10 Kinglet IFMR
Capital 2016 644.9
Par with
EIS Microfinance 2.0% 9 52.6% 99.0% 97.9% 99.4% 8.6% 3.1% 0.5% 0.7% 0.0% 1.5% 0.9% 0.8% 0.2% - 0.0% - 5.1% 16.3% 81.6%
Above 20
times
11 Jaithra Trust
2016 751.0
Par with
EIS Microfinance 2.8% 9 49.9% 99.2% 97.8% 100.6% 8.2% 2.5% 0.2% 0.2% 0.0% 1.4% 0.8% 0.6% 0.1% - 0.0% - 6.9% 16.9% 79.7%
Above 20
times
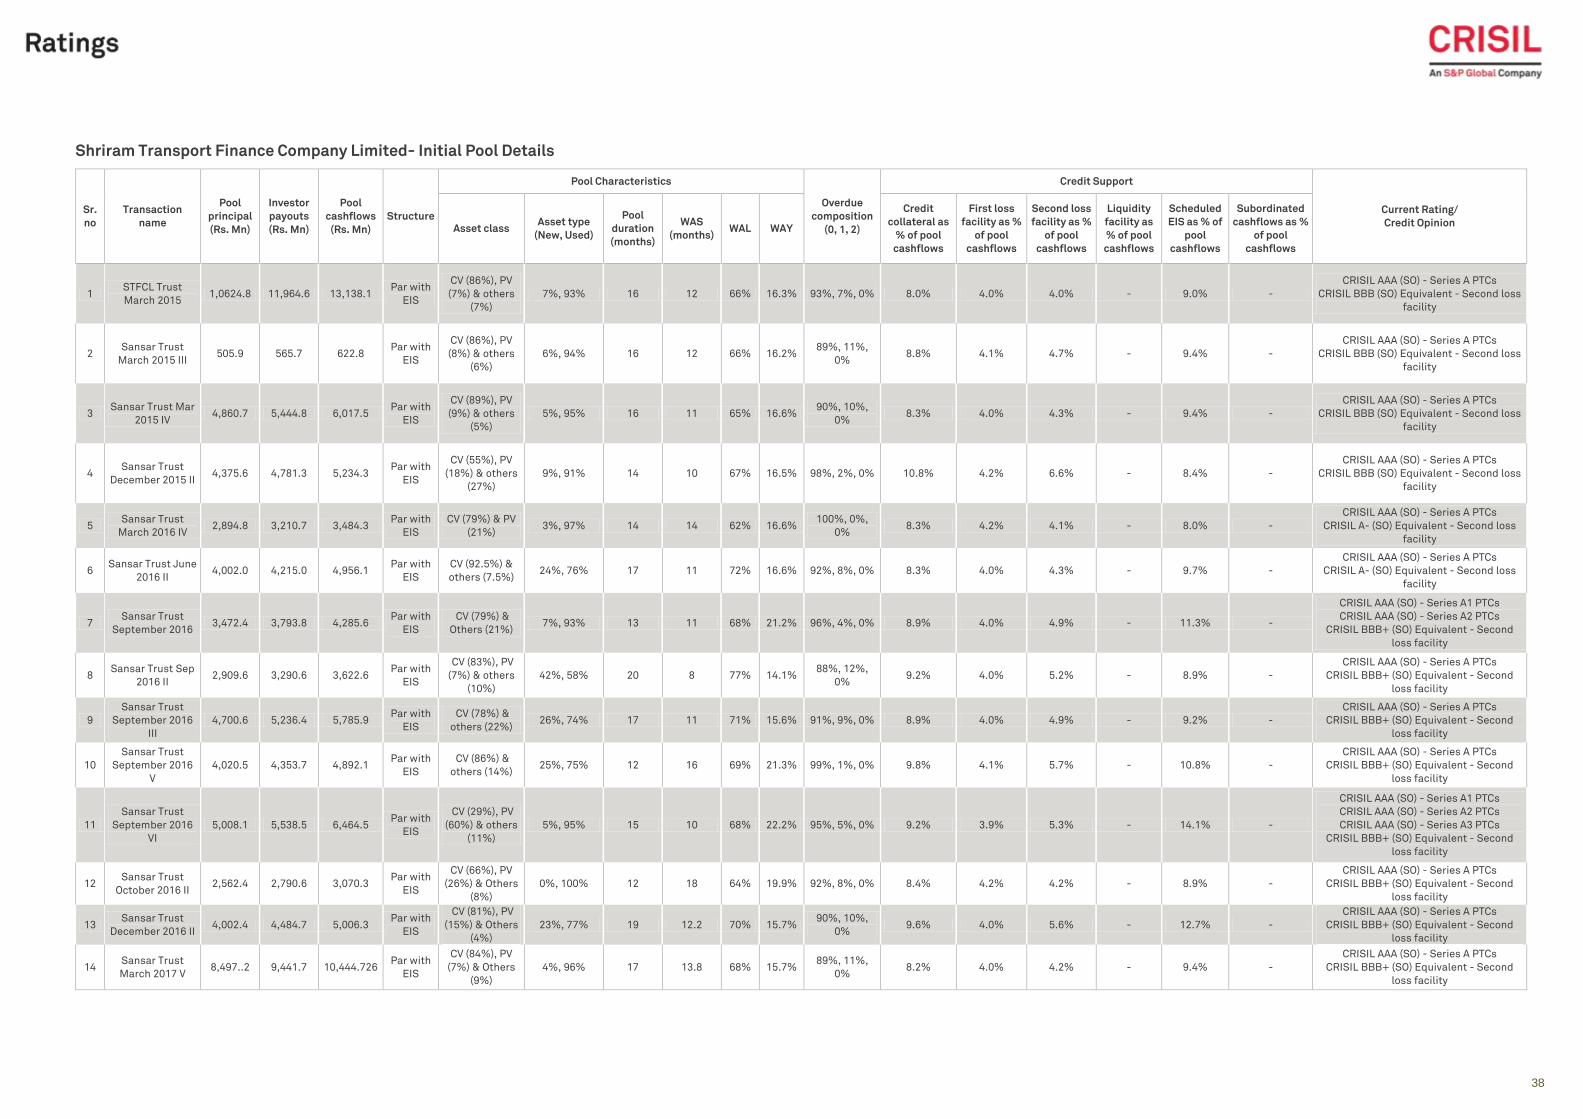
38
Classification: INTERNAL: CONFIDENTIAL
Shriram Transport Finance Company Limited- Initial Pool Details
Sr.
no
Transaction
name
Pool
principal
(Rs. Mn)
Investor
payouts
(Rs. Mn)
Pool
cashflows
(Rs. Mn)
Structure
Pool Characteristics
Overdue
composition
(0, 1, 2)
Credit Support
Current Rating/
Credit Opinion Asset class
Asset type
(New, Used)
Pool
duration
(months)
WAS
(months) WAL WAY
Credit
collateral as
% of pool
cashflows
First loss
facility as %
of pool
cashflows
Second loss
facility as %
of pool
cashflows
Liquidity
facility as
% of pool
cashflows
Scheduled
EIS as % of
pool
cashflows
Subordinated
cashflows as %
of pool
cashflows
1 STFCL Trust
March 2015 1,0624.8 11,964.6 13,138.1
Par with
EIS
CV (86%), PV
(7%) & others
(7%)
7%, 93% 16 12 66% 16.3% 93%, 7%, 0% 8.0% 4.0% 4.0% - 9.0% -
CRISIL AAA (SO) - Series A PTCs
CRISIL BBB (SO) Equivalent - Second loss
facility
2 Sansar Trust
March 2015 III 505.9 565.7 622.8
Par with
EIS
CV (86%), PV
(8%) & others
(6%)
6%, 94% 16 12 66% 16.2% 89%, 11%,
0% 8.8% 4.1% 4.7% - 9.4% -
CRISIL AAA (SO) - Series A PTCs
CRISIL BBB (SO) Equivalent - Second loss
facility
3 Sansar Trust Mar
2015 IV 4,860.7 5,444.8 6,017.5
Par with
EIS
CV (89%), PV
(9%) & others
(5%)
5%, 95% 16 11 65% 16.6% 90%, 10%,
0% 8.3% 4.0% 4.3% - 9.4% -
CRISIL AAA (SO) - Series A PTCs
CRISIL BBB (SO) Equivalent - Second loss
facility
4 Sansar Trust
December 2015 II 4,375.6 4,781.3 5,234.3
Par with
EIS
CV (55%), PV
(18%) & others
(27%)
9%, 91% 14 10 67% 16.5% 98%, 2%, 0% 10.8% 4.2% 6.6% - 8.4% -
CRISIL AAA (SO) - Series A PTCs
CRISIL BBB (SO) Equivalent - Second loss
facility
5 Sansar Trust
March 2016 IV 2,894.8 3,210.7 3,484.3
Par with
EIS
CV (79%) & PV
(21%) 3%, 97% 14 14 62% 16.6%
100%, 0%,
0% 8.3% 4.2% 4.1% - 8.0% -
CRISIL AAA (SO) - Series A PTCs
CRISIL A- (SO) Equivalent - Second loss
facility
6 Sansar Trust June
2016 II 4,002.0 4,215.0 4,956.1
Par with
EIS
CV (92.5%) &
others (7.5%) 24%, 76% 17 11 72% 16.6% 92%, 8%, 0% 8.3% 4.0% 4.3% - 9.7% -
CRISIL AAA (SO) - Series A PTCs
CRISIL A- (SO) Equivalent - Second loss
facility
7 Sansar Trust
September 2016 3,472.4 3,793.8 4,285.6
Par with
EIS
CV (79%) &
Others (21%) 7%, 93% 13 11 68% 21.2% 96%, 4%, 0% 8.9% 4.0% 4.9% - 11.3% -
CRISIL AAA (SO) - Series A1 PTCs
CRISIL AAA (SO) - Series A2 PTCs
CRISIL BBB+ (SO) Equivalent - Second
loss facility
8 Sansar Trust Sep
2016 II 2,909.6 3,290.6 3,622.6
Par with
EIS
CV (83%), PV
(7%) & others
(10%)
42%, 58% 20 8 77% 14.1% 88%, 12%,
0% 9.2% 4.0% 5.2% - 8.9% -
CRISIL AAA (SO) - Series A PTCs
CRISIL BBB+ (SO) Equivalent - Second
loss facility
9
Sansar Trust
September 2016
III
4,700.6 5,236.4 5,785.9 Par with
EIS
CV (78%) &
others (22%) 26%, 74% 17 11 71% 15.6% 91%, 9%, 0% 8.9% 4.0% 4.9% - 9.2% -
CRISIL AAA (SO) - Series A PTCs
CRISIL BBB+ (SO) Equivalent - Second
loss facility
10
Sansar Trust
September 2016
V
4,020.5 4,353.7 4,892.1 Par with
EIS
CV (86%) &
others (14%) 25%, 75% 12 16 69% 21.3% 99%, 1%, 0% 9.8% 4.1% 5.7% - 10.8% -
CRISIL AAA (SO) - Series A PTCs
CRISIL BBB+ (SO) Equivalent - Second
loss facility
11
Sansar Trust
September 2016
VI
5,008.1 5,538.5 6,464.5 Par with
EIS
CV (29%), PV
(60%) & others
(11%)
5%, 95% 15 10 68% 22.2% 95%, 5%, 0% 9.2% 3.9% 5.3% - 14.1% -
CRISIL AAA (SO) - Series A1 PTCs
CRISIL AAA (SO) - Series A2 PTCs
CRISIL AAA (SO) - Series A3 PTCs
CRISIL BBB+ (SO) Equivalent - Second
loss facility
12 Sansar Trust
October 2016 II 2,562.4 2,790.6 3,070.3
Par with
EIS
CV (66%), PV
(26%) & Others
(8%)
0%, 100% 12 18 64% 19.9% 92%, 8%, 0% 8.4% 4.2% 4.2% - 8.9% -
CRISIL AAA (SO) - Series A PTCs
CRISIL BBB+ (SO) Equivalent - Second
loss facility
13 Sansar Trust
December 2016 II 4,002.4 4,484.7 5,006.3
Par with
EIS
CV (81%), PV
(15%) & Others
(4%)
23%, 77% 19 12.2 70% 15.7% 90%, 10%,
0% 9.6% 4.0% 5.6% - 12.7% -
CRISIL AAA (SO) - Series A PTCs
CRISIL BBB+ (SO) Equivalent - Second
loss facility
14 Sansar Trust
March 2017 V 8,497..2 9,441.7 10,444.726
Par with
EIS
CV (84%), PV
(7%) & Others
(9%)
4%, 96% 17 13.8 68% 15.7% 89%, 11%,
0% 8.2% 4.0% 4.2% - 9.4% -
CRISIL AAA (SO) - Series A PTCs
CRISIL BBB+ (SO) Equivalent - Second
loss facility
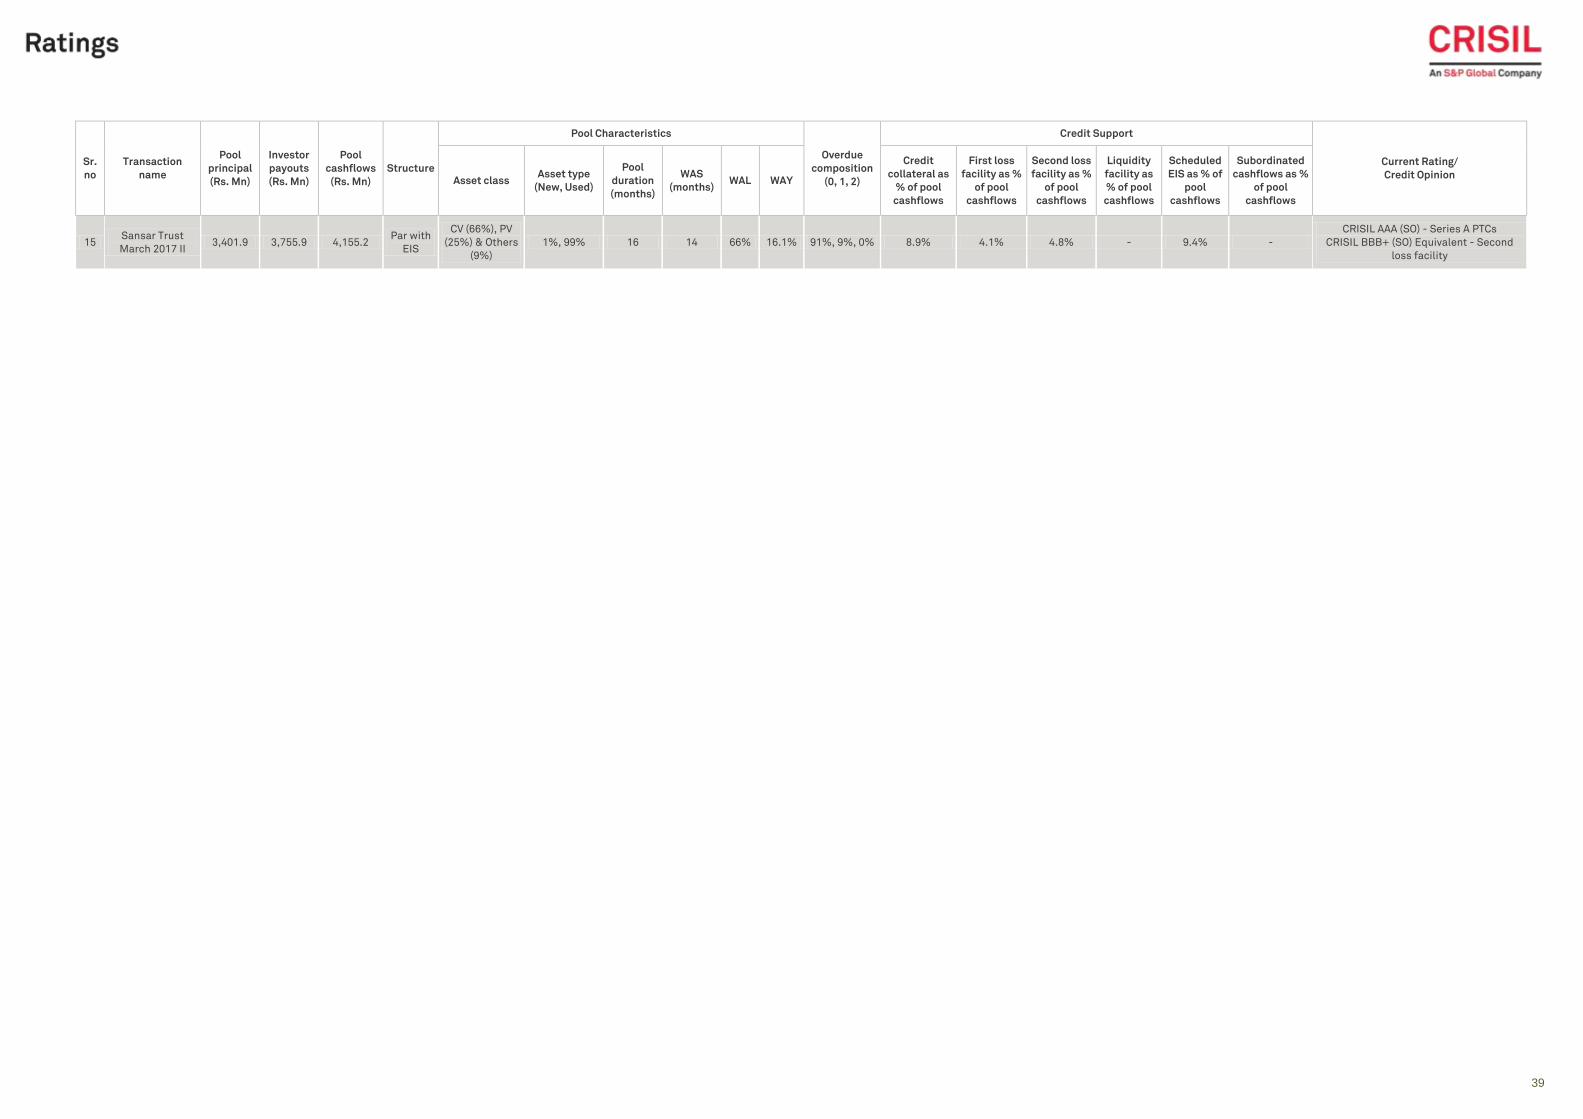
39
Classification: INTERNAL: CONFIDENTIAL
Sr.
no
Transaction
name
Pool
principal
(Rs. Mn)
Investor
payouts
(Rs. Mn)
Pool
cashflows
(Rs. Mn)
Structure
Pool Characteristics
Overdue
composition
(0, 1, 2)
Credit Support
Current Rating/
Credit Opinion Asset class
Asset type
(New, Used)
Pool
duration
(months)
WAS
(months) WAL WAY
Credit
collateral as
% of pool
cashflows
First loss
facility as %
of pool
cashflows
Second loss
facility as %
of pool
cashflows
Liquidity
facility as
% of pool
cashflows
Scheduled
EIS as % of
pool
cashflows
Subordinated
cashflows as %
of pool
cashflows
15 Sansar Trust
March 2017 II 3,401.9 3,755.9 4,155.2
Par with
EIS
CV (66%), PV
(25%) & Others
(9%)
1%, 99% 16 14 66% 16.1% 91%, 9%, 0% 8.9% 4.1% 4.8% - 9.4% -
CRISIL AAA (SO) - Series A PTCs
CRISIL BBB+ (SO) Equivalent - Second
loss facility
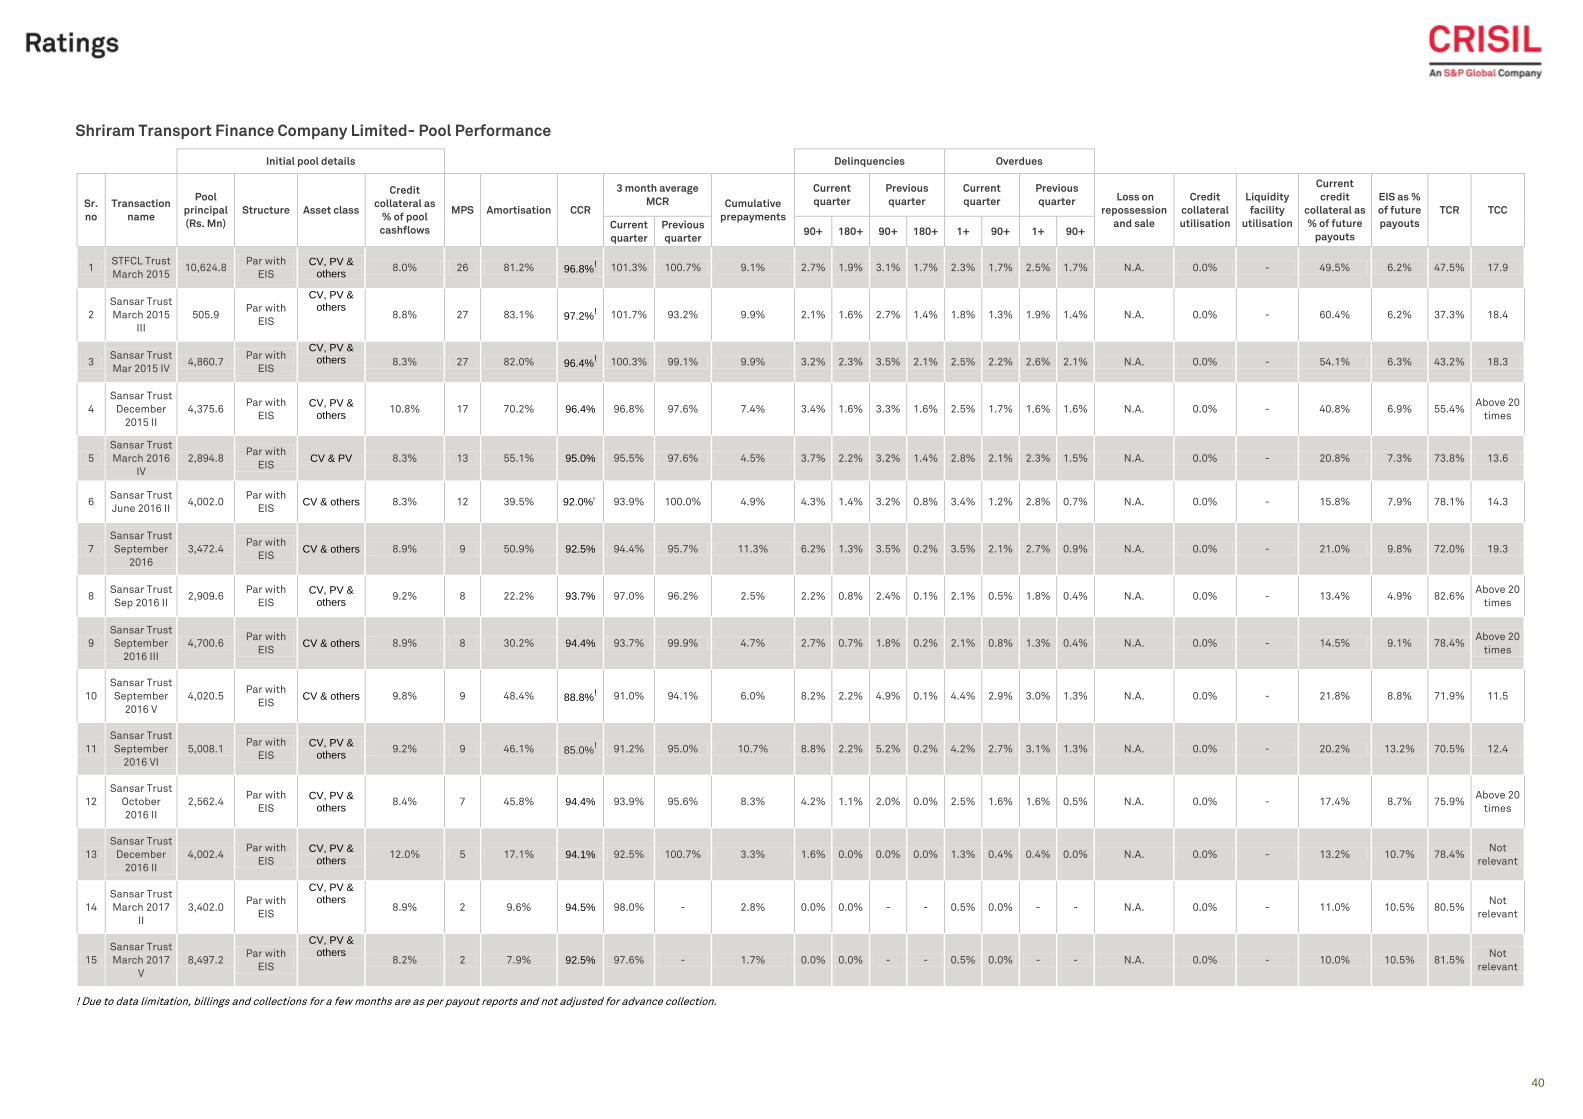
40
Classification: INTERNAL: CONFIDENTIAL
Shriram Transport Finance Company Limited- Pool Performance
Initial pool details Delinquencies Overdues
Sr.
no
Transaction
name
Pool
principal
(Rs. Mn)
Structure Asset class
Credit
collateral as
% of pool
cashflows
MPS Amortisation CCR
3 month average
MCR Cumulative
prepayments
Current
quarter
Previous
quarter
Current
quarter
Previous
quarter Loss on
repossession
and sale
Credit
collateral
utilisation
Liquidity
facility
utilisation
Current
credit
collateral as
% of future
payouts
EIS as %
of future
payouts
TCR TCC
Current
quarter
Previous
quarter 90+ 180+ 90+ 180+ 1+ 90+ 1+ 90+
1 STFCL Trust
March 2015 10,624.8
Par with
EIS
CV, PV & others
8.0% 26 81.2% 96.8%! 101.3% 100.7% 9.1% 2.7% 1.9% 3.1% 1.7% 2.3% 1.7% 2.5% 1.7% N.A. 0.0% - 49.5% 6.2% 47.5% 17.9
2
Sansar Trust
March 2015
III
505.9 Par with
EIS
CV, PV & others
8.8% 27 83.1% 97.2%! 101.7% 93.2% 9.9% 2.1% 1.6% 2.7% 1.4% 1.8% 1.3% 1.9% 1.4% N.A. 0.0% - 60.4% 6.2% 37.3% 18.4
3 Sansar Trust
Mar 2015 IV 4,860.7
Par with
EIS
CV, PV & others 8.3% 27 82.0% 96.4%
! 100.3% 99.1% 9.9% 3.2% 2.3% 3.5% 2.1% 2.5% 2.2% 2.6% 2.1% N.A. 0.0% - 54.1% 6.3% 43.2% 18.3
4
Sansar Trust
December
2015 II
4,375.6 Par with
EIS
CV, PV & others
10.8% 17 70.2% 96.4% 96.8% 97.6% 7.4% 3.4% 1.6% 3.3% 1.6% 2.5% 1.7% 1.6% 1.6% N.A. 0.0% - 40.8% 6.9% 55.4% Above 20
times
5
Sansar Trust
March 2016
IV
2,894.8 Par with
EIS CV & PV 8.3% 13 55.1% 95.0% 95.5% 97.6% 4.5% 3.7% 2.2% 3.2% 1.4% 2.8% 2.1% 2.3% 1.5% N.A. 0.0% - 20.8% 7.3% 73.8% 13.6
6 Sansar Trust
June 2016 II 4,002.0
Par with
EIS CV & others 8.3% 12 39.5% 92.0%! 93.9% 100.0% 4.9% 4.3% 1.4% 3.2% 0.8% 3.4% 1.2% 2.8% 0.7% N.A. 0.0% - 15.8% 7.9% 78.1% 14.3
7
Sansar Trust
September
2016
3,472.4 Par with
EIS CV & others 8.9% 9 50.9% 92.5% 94.4% 95.7% 11.3% 6.2% 1.3% 3.5% 0.2% 3.5% 2.1% 2.7% 0.9% N.A. 0.0% - 21.0% 9.8% 72.0% 19.3
8 Sansar Trust
Sep 2016 II 2,909.6
Par with
EIS
CV, PV & others
9.2% 8 22.2% 93.7% 97.0% 96.2% 2.5% 2.2% 0.8% 2.4% 0.1% 2.1% 0.5% 1.8% 0.4% N.A. 0.0% - 13.4% 4.9% 82.6% Above 20
times
9
Sansar Trust
September
2016 III
4,700.6 Par with
EIS CV & others 8.9% 8 30.2% 94.4% 93.7% 99.9% 4.7% 2.7% 0.7% 1.8% 0.2% 2.1% 0.8% 1.3% 0.4% N.A. 0.0% - 14.5% 9.1% 78.4%
Above 20
times
10
Sansar Trust
September
2016 V
4,020.5 Par with
EIS CV & others 9.8% 9 48.4% 88.8%
! 91.0% 94.1% 6.0% 8.2% 2.2% 4.9% 0.1% 4.4% 2.9% 3.0% 1.3% N.A. 0.0% - 21.8% 8.8% 71.9% 11.5
11
Sansar Trust
September
2016 VI
5,008.1 Par with
EIS
CV, PV & others
9.2% 9 46.1% 85.0%! 91.2% 95.0% 10.7% 8.8% 2.2% 5.2% 0.2% 4.2% 2.7% 3.1% 1.3% N.A. 0.0% - 20.2% 13.2% 70.5% 12.4
12
Sansar Trust
October
2016 II
2,562.4 Par with
EIS
CV, PV & others
8.4% 7 45.8% 94.4% 93.9% 95.6% 8.3% 4.2% 1.1% 2.0% 0.0% 2.5% 1.6% 1.6% 0.5% N.A. 0.0% - 17.4% 8.7% 75.9% Above 20
times
13
Sansar Trust
December
2016 II
4,002.4 Par with
EIS
CV, PV & others
12.0% 5 17.1% 94.1% 92.5% 100.7% 3.3% 1.6% 0.0% 0.0% 0.0% 1.3% 0.4% 0.4% 0.0% N.A. 0.0% - 13.2% 10.7% 78.4% Not
relevant
14
Sansar Trust
March 2017
II
3,402.0 Par with
EIS
CV, PV & others
8.9% 2 9.6% 94.5% 98.0% - 2.8% 0.0% 0.0% - - 0.5% 0.0% - - N.A. 0.0% - 11.0% 10.5% 80.5% Not
relevant
15
Sansar Trust
March 2017
V
8,497.2 Par with
EIS
CV, PV & others
8.2% 2 7.9% 92.5% 97.6% - 1.7% 0.0% 0.0% - - 0.5% 0.0% - - N.A. 0.0% - 10.0% 10.5% 81.5% Not
relevant
! Due to data limitation, billings and collections for a few months are as per payout reports and not adjusted for advance collection.
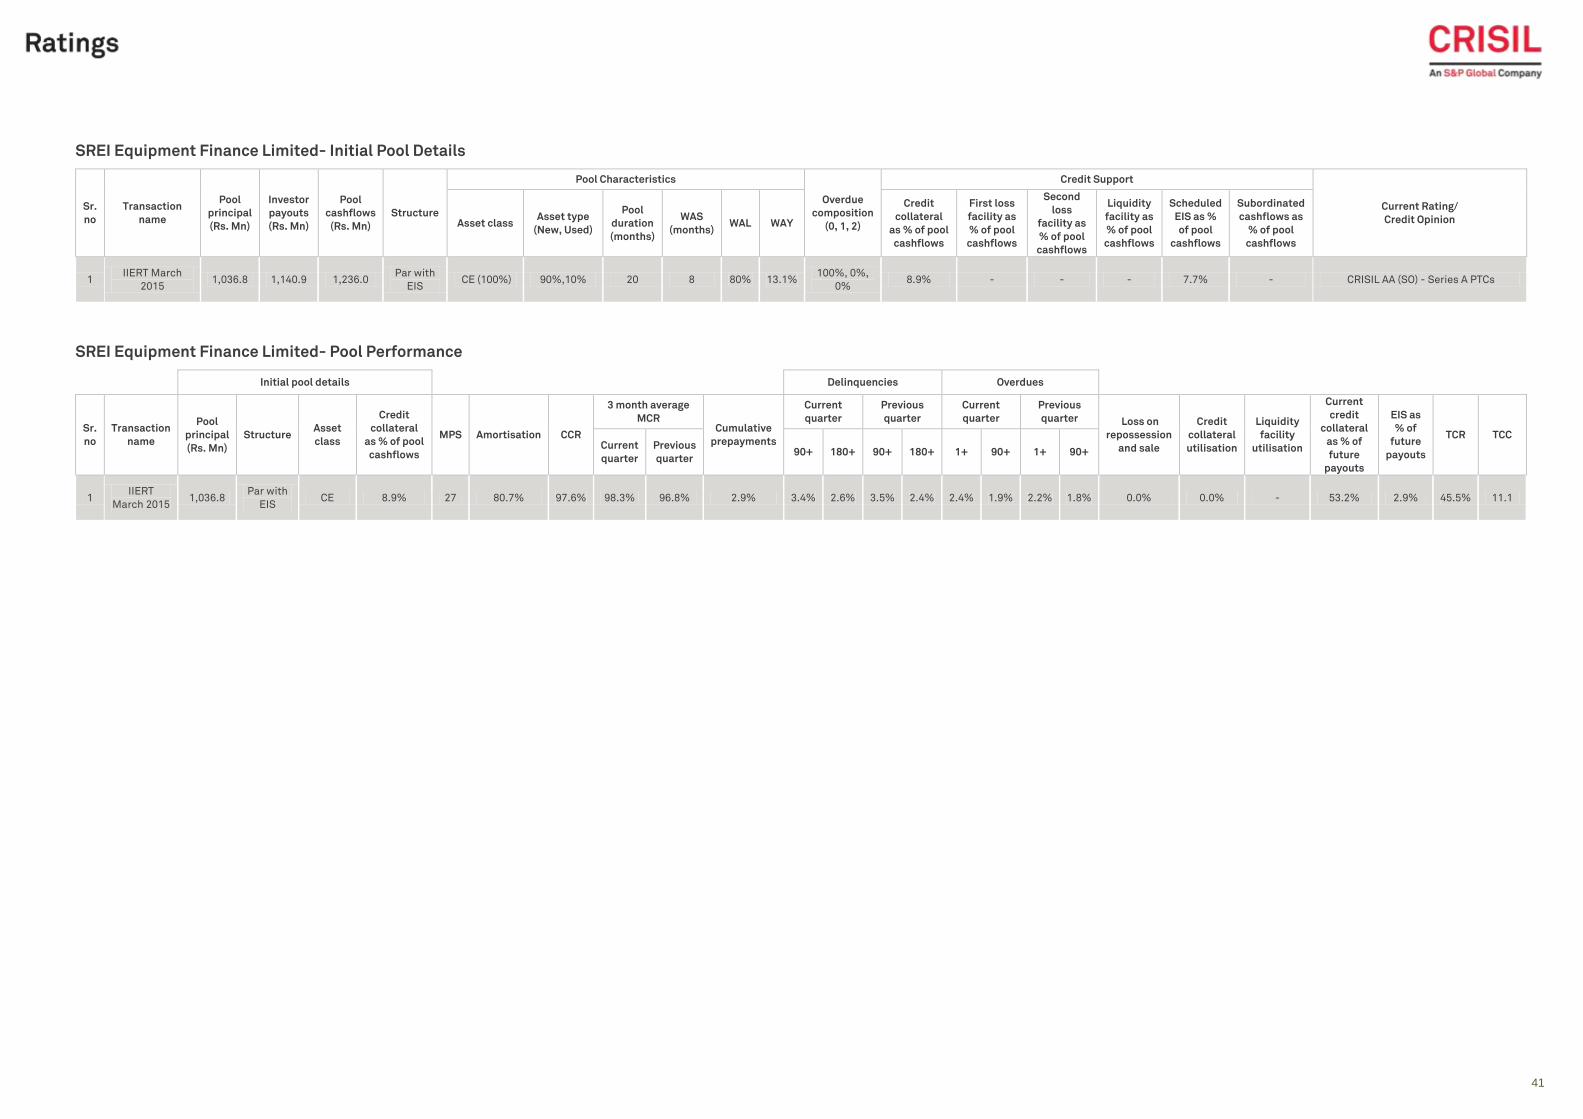
41
Classification: INTERNAL: CONFIDENTIAL
SREI Equipment Finance Limited- Initial Pool Details
Sr.
no
Transaction
name
Pool
principal
(Rs. Mn)
Investor
payouts
(Rs. Mn)
Pool
cashflows
(Rs. Mn)
Structure
Pool Characteristics
Overdue
composition
(0, 1, 2)
Credit Support
Current Rating/
Credit Opinion Asset class Asset type
(New, Used)
Pool
duration
(months)
WAS
(months) WAL WAY
Credit
collateral
as % of pool
cashflows
First loss
facility as
% of pool
cashflows
Second
loss
facility as
% of pool
cashflows
Liquidity
facility as
% of pool
cashflows
Scheduled
EIS as %
of pool
cashflows
Subordinated
cashflows as
% of pool
cashflows
1 IIERT March
2015 1,036.8 1,140.9 1,236.0
Par with
EIS CE (100%) 90%,10% 20 8 80% 13.1%
100%, 0%,
0% 8.9% - - - 7.7% - CRISIL AA (SO) - Series A PTCs
SREI Equipment Finance Limited- Pool Performance
Initial pool details Delinquencies Overdues
Sr.
no
Transaction
name
Pool
principal
(Rs. Mn)
Structure Asset
class
Credit
collateral
as % of pool
cashflows
MPS Amortisation CCR
3 month average
MCR Cumulative
prepayments
Current
quarter
Previous
quarter
Current
quarter
Previous
quarter Loss on
repossession
and sale
Credit
collateral
utilisation
Liquidity
facility
utilisation
Current
credit
collateral
as % of
future
payouts
EIS as
% of
future
payouts
TCR TCC Current
quarter
Previous
quarter 90+ 180+ 90+ 180+ 1+ 90+ 1+ 90+
1 IIERT
March 2015 1,036.8
Par with
EIS CE 8.9% 27 80.7% 97.6% 98.3% 96.8% 2.9% 3.4% 2.6% 3.5% 2.4% 2.4% 1.9% 2.2% 1.8% 0.0% 0.0% - 53.2% 2.9% 45.5% 11.1
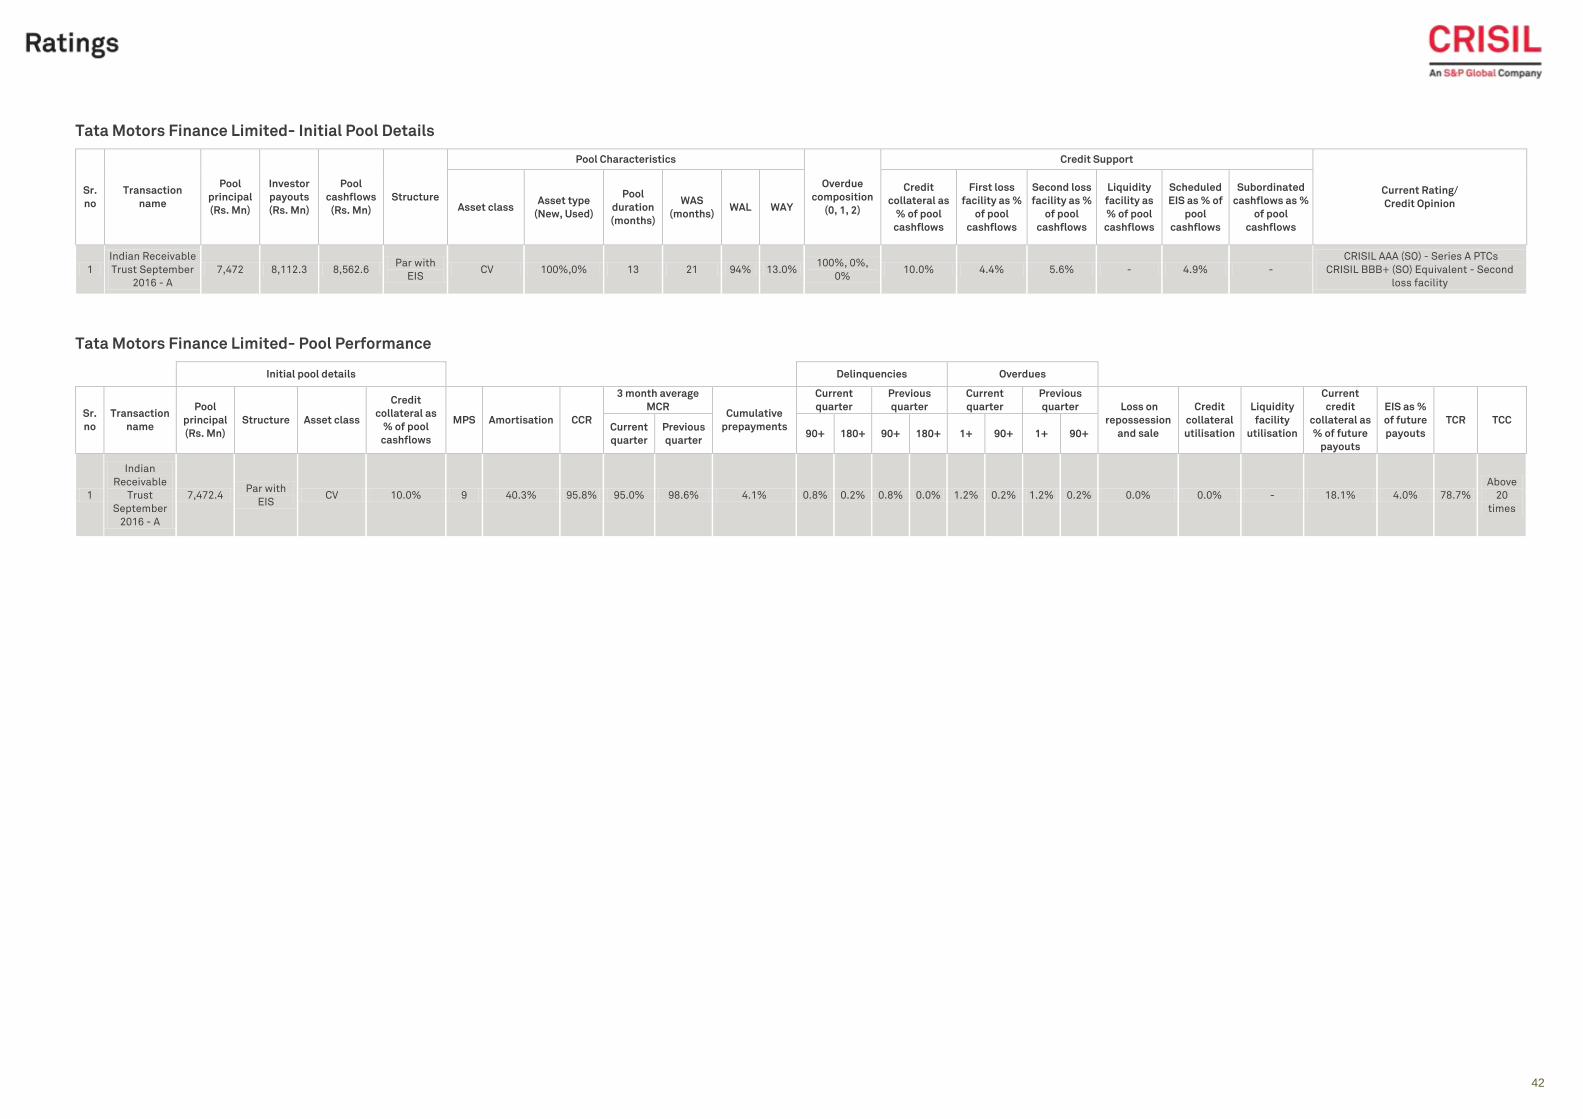
42
Classification: INTERNAL: CONFIDENTIAL
Tata Motors Finance Limited- Initial Pool Details
Sr.
no
Transaction
name
Pool
principal
(Rs. Mn)
Investor
payouts
(Rs. Mn)
Pool
cashflows
(Rs. Mn)
Structure
Pool Characteristics
Overdue
composition
(0, 1, 2)
Credit Support
Current Rating/
Credit Opinion Asset class Asset type
(New, Used)
Pool
duration
(months)
WAS
(months) WAL WAY
Credit
collateral as
% of pool
cashflows
First loss
facility as %
of pool
cashflows
Second loss
facility as %
of pool
cashflows
Liquidity
facility as
% of pool
cashflows
Scheduled
EIS as % of
pool
cashflows
Subordinated
cashflows as %
of pool
cashflows
1
Indian Receivable
Trust September
2016 - A
7,472 8,112.3 8,562.6 Par with
EIS CV 100%,0% 13 21 94% 13.0%
100%, 0%,
0% 10.0% 4.4% 5.6% - 4.9% -
CRISIL AAA (SO) - Series A PTCs
CRISIL BBB+ (SO) Equivalent - Second
loss facility
Tata Motors Finance Limited- Pool Performance
Initial pool details Delinquencies Overdues
Sr.
no
Transaction
name
Pool
principal
(Rs. Mn)
Structure Asset class
Credit
collateral as
% of pool
cashflows
MPS Amortisation CCR
3 month average
MCR Cumulative
prepayments
Current
quarter
Previous
quarter
Current
quarter
Previous
quarter Loss on
repossession
and sale
Credit
collateral
utilisation
Liquidity
facility
utilisation
Current
credit
collateral as
% of future
payouts
EIS as %
of future
payouts
TCR TCC Current
quarter
Previous
quarter 90+ 180+ 90+ 180+ 1+ 90+ 1+ 90+
1
Indian
Receivable
Trust
September
2016 - A
7,472.4 Par with
EIS CV 10.0% 9 40.3% 95.8% 95.0% 98.6% 4.1% 0.8% 0.2% 0.8% 0.0% 1.2% 0.2% 1.2% 0.2% 0.0% 0.0% - 18.1% 4.0% 78.7%
Above
20
times
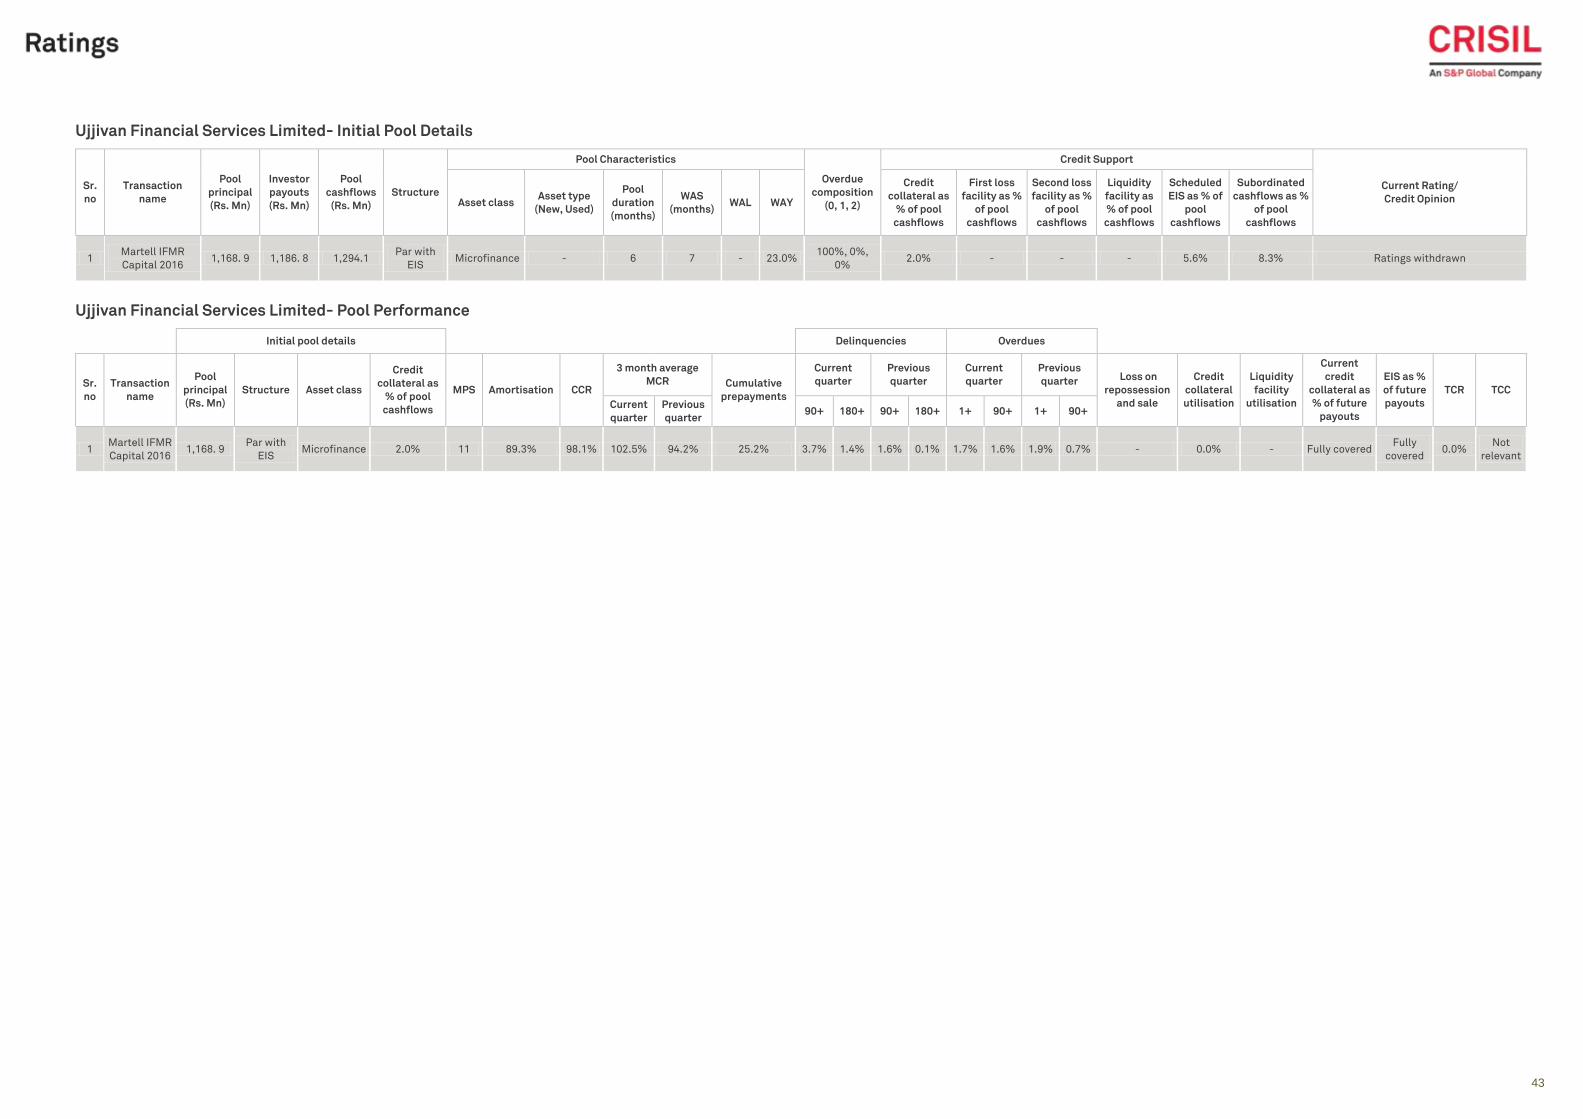
43
Classification: INTERNAL: CONFIDENTIAL
Ujjivan Financial Services Limited- Initial Pool Details
Sr.
no
Transaction
name
Pool
principal
(Rs. Mn)
Investor
payouts
(Rs. Mn)
Pool
cashflows
(Rs. Mn)
Structure
Pool Characteristics
Overdue
composition
(0, 1, 2)
Credit Support
Current Rating/
Credit Opinion Asset class Asset type
(New, Used)
Pool
duration
(months)
WAS
(months) WAL WAY
Credit
collateral as
% of pool
cashflows
First loss
facility as %
of pool
cashflows
Second loss
facility as %
of pool
cashflows
Liquidity
facility as
% of pool
cashflows
Scheduled
EIS as % of
pool
cashflows
Subordinated
cashflows as %
of pool
cashflows
1 Martell IFMR
Capital 2016 1,168. 9 1,186. 8 1,294.1
Par with
EIS Microfinance - 6 7 - 23.0%
100%, 0%,
0% 2.0% - - - 5.6% 8.3% Ratings withdrawn
Ujjivan Financial Services Limited- Pool Performance
Initial pool details Delinquencies Overdues
Sr.
no
Transaction
name
Pool
principal
(Rs. Mn)
Structure Asset class
Credit
collateral as
% of pool
cashflows
MPS Amortisation CCR
3 month average
MCR Cumulative
prepayments
Current
quarter
Previous
quarter
Current
quarter
Previous
quarter Loss on
repossession
and sale
Credit
collateral
utilisation
Liquidity
facility
utilisation
Current
credit
collateral as
% of future
payouts
EIS as %
of future
payouts
TCR TCC
Current
quarter
Previous
quarter 90+ 180+ 90+ 180+ 1+ 90+ 1+ 90+
1 Martell IFMR
Capital 2016 1,168. 9
Par with
EIS Microfinance 2.0% 11 89.3% 98.1% 102.5% 94.2% 25.2% 3.7% 1.4% 1.6% 0.1% 1.7% 1.6% 1.9% 0.7% - 0.0% - Fully covered
Fully
covered 0.0%
Not
relevant

44
Mortgage – backed Securities

45
This page has been intentionally left blank
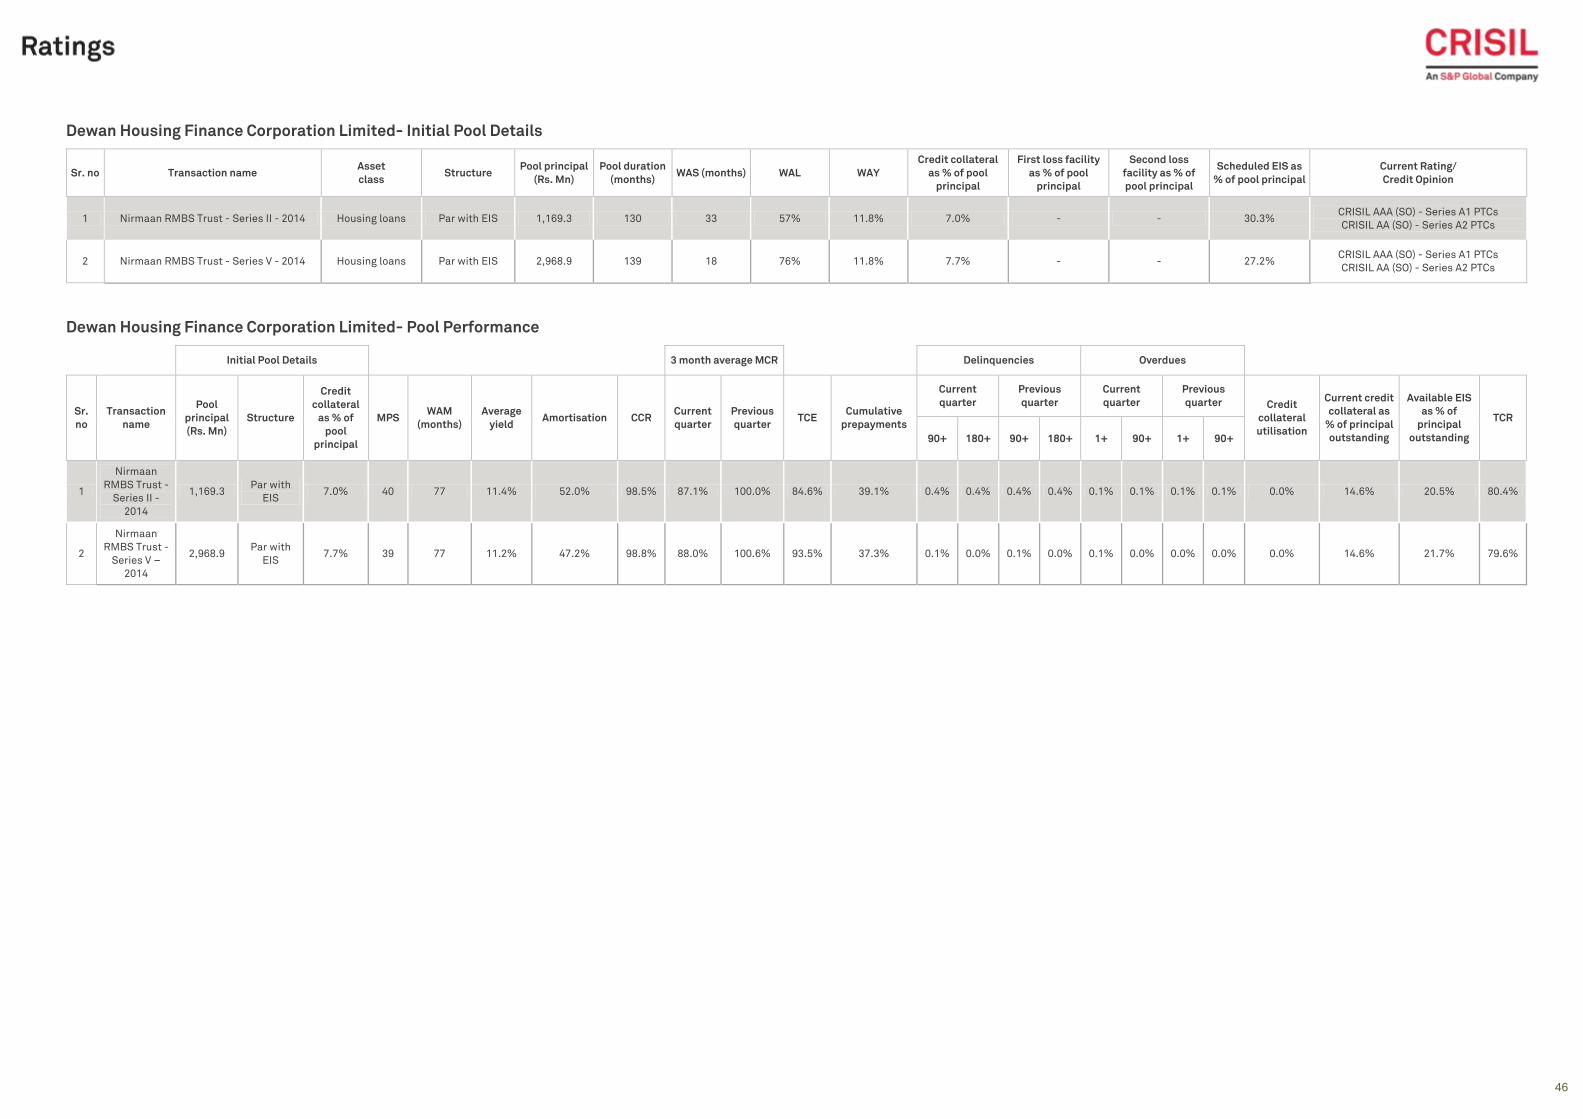
46
Dewan Housing Finance Corporation Limited- Initial Pool Details
Sr. no Transaction name Asset
class Structure
Pool principal
(Rs. Mn)
Pool duration
(months) WAS (months) WAL WAY
Credit collateral
as % of pool
principal
First loss facility
as % of pool
principal
Second loss
facility as % of
pool principal
Scheduled EIS as
% of pool principal
Current Rating/
Credit Opinion
1 Nirmaan RMBS Trust - Series II - 2014 Housing loans Par with EIS 1,169.3 130 33 57% 11.8% 7.0% - - 30.3% CRISIL AAA (SO) - Series A1 PTCs
CRISIL AA (SO) - Series A2 PTCs
2 Nirmaan RMBS Trust - Series V - 2014 Housing loans Par with EIS 2,968.9 139 18 76% 11.8% 7.7% - - 27.2% CRISIL AAA (SO) - Series A1 PTCs
CRISIL AA (SO) - Series A2 PTCs
Dewan Housing Finance Corporation Limited- Pool Performance
Initial Pool Details 3 month average MCR Delinquencies Overdues
Sr.
no
Transaction
name
Pool
principal
(Rs. Mn)
Structure
Credit
collateral
as % of
pool
principal
MPS WAM
(months)
Average
yield Amortisation CCR
Current
quarter
Previous
quarter TCE
Cumulative
prepayments
Current
quarter
Previous
quarter
Current
quarter
Previous
quarter Credit
collateral
utilisation
Current credit
collateral as
% of principal
outstanding
Available EIS
as % of
principal
outstanding
TCR
90+ 180+ 90+ 180+ 1+ 90+ 1+ 90+
1
Nirmaan
RMBS Trust -
Series II -
2014
1,169.3 Par with
EIS 7.0% 40 77 11.4% 52.0% 98.5% 87.1% 100.0% 84.6% 39.1% 0.4% 0.4% 0.4% 0.4% 0.1% 0.1% 0.1% 0.1% 0.0% 14.6% 20.5% 80.4%
2
Nirmaan
RMBS Trust -
Series V –
2014
2,968.9 Par with
EIS 7.7% 39 77 11.2% 47.2% 98.8% 88.0% 100.6% 93.5% 37.3% 0.1% 0.0% 0.1% 0.0% 0.1% 0.0% 0.0% 0.0% 0.0% 14.6% 21.7% 79.6%
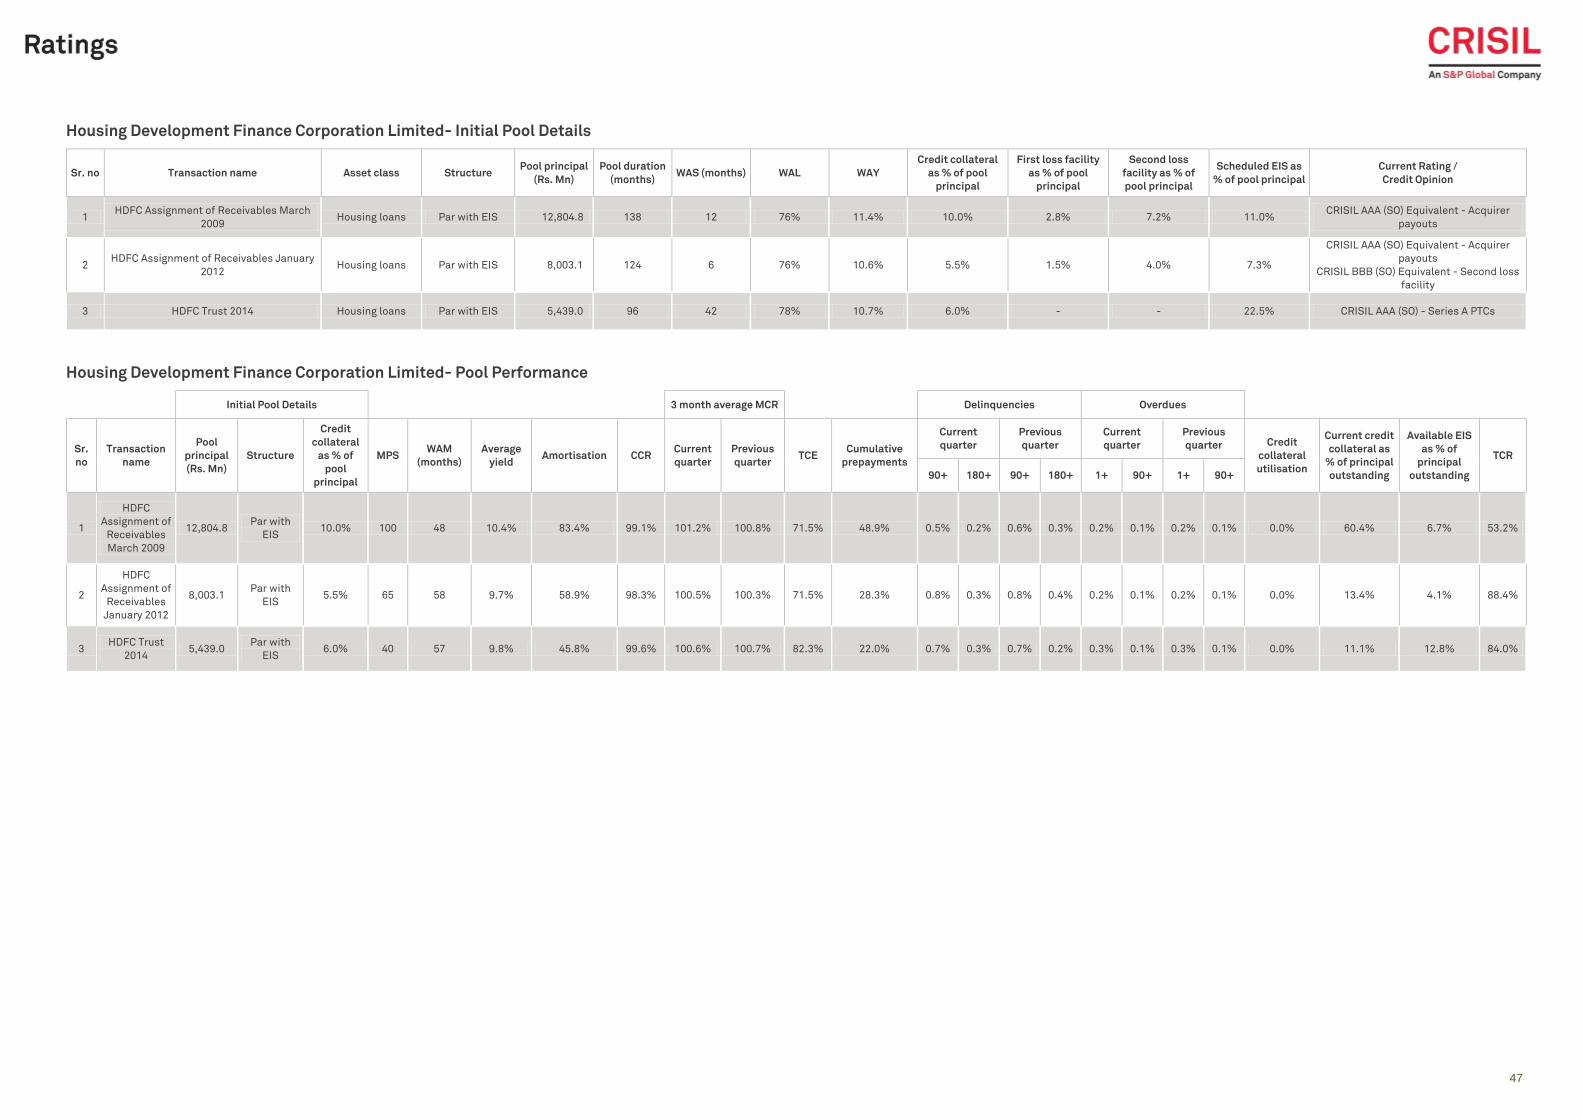
47
47
Housing Development Finance Corporation Limited- Initial Pool Details
Sr. no Transaction name Asset class Structure Pool principal
(Rs. Mn)
Pool duration
(months) WAS (months) WAL WAY
Credit collateral
as % of pool
principal
First loss facility
as % of pool
principal
Second loss
facility as % of
pool principal
Scheduled EIS as
% of pool principal
Current Rating /
Credit Opinion
1 HDFC Assignment of Receivables March
2009 Housing loans Par with EIS 12,804.8 138 12 76% 11.4% 10.0% 2.8% 7.2% 11.0%
CRISIL AAA (SO) Equivalent - Acquirer
payouts
2 HDFC Assignment of Receivables January
2012 Housing loans Par with EIS 8,003.1 124 6 76% 10.6% 5.5% 1.5% 4.0% 7.3%
CRISIL AAA (SO) Equivalent - Acquirer
payouts
CRISIL BBB (SO) Equivalent - Second loss
facility
3 HDFC Trust 2014 Housing loans Par with EIS 5,439.0 96 42 78% 10.7% 6.0% - - 22.5% CRISIL AAA (SO) - Series A PTCs
Housing Development Finance Corporation Limited- Pool Performance
Initial Pool Details 3 month average MCR Delinquencies Overdues
Sr.
no
Transaction
name
Pool
principal
(Rs. Mn)
Structure
Credit
collateral
as % of
pool
principal
MPS WAM
(months)
Average
yield Amortisation CCR
Current
quarter
Previous
quarter TCE
Cumulative
prepayments
Current
quarter
Previous
quarter
Current
quarter
Previous
quarter Credit
collateral
utilisation
Current credit
collateral as
% of principal
outstanding
Available EIS
as % of
principal
outstanding
TCR
90+ 180+ 90+ 180+ 1+ 90+ 1+ 90+
1
HDFC
Assignment of
Receivables
March 2009
12,804.8 Par with
EIS 10.0% 100 48 10.4% 83.4% 99.1% 101.2% 100.8% 71.5% 48.9% 0.5% 0.2% 0.6% 0.3% 0.2% 0.1% 0.2% 0.1% 0.0% 60.4% 6.7% 53.2%
2
HDFC
Assignment of
Receivables
January 2012
8,003.1 Par with
EIS 5.5% 65 58 9.7% 58.9% 98.3% 100.5% 100.3% 71.5% 28.3% 0.8% 0.3% 0.8% 0.4% 0.2% 0.1% 0.2% 0.1% 0.0% 13.4% 4.1% 88.4%
3 HDFC Trust
2014 5,439.0
Par with
EIS 6.0% 40 57 9.8% 45.8% 99.6% 100.6% 100.7% 82.3% 22.0% 0.7% 0.3% 0.7% 0.2% 0.3% 0.1% 0.3% 0.1% 0.0% 11.1% 12.8% 84.0%
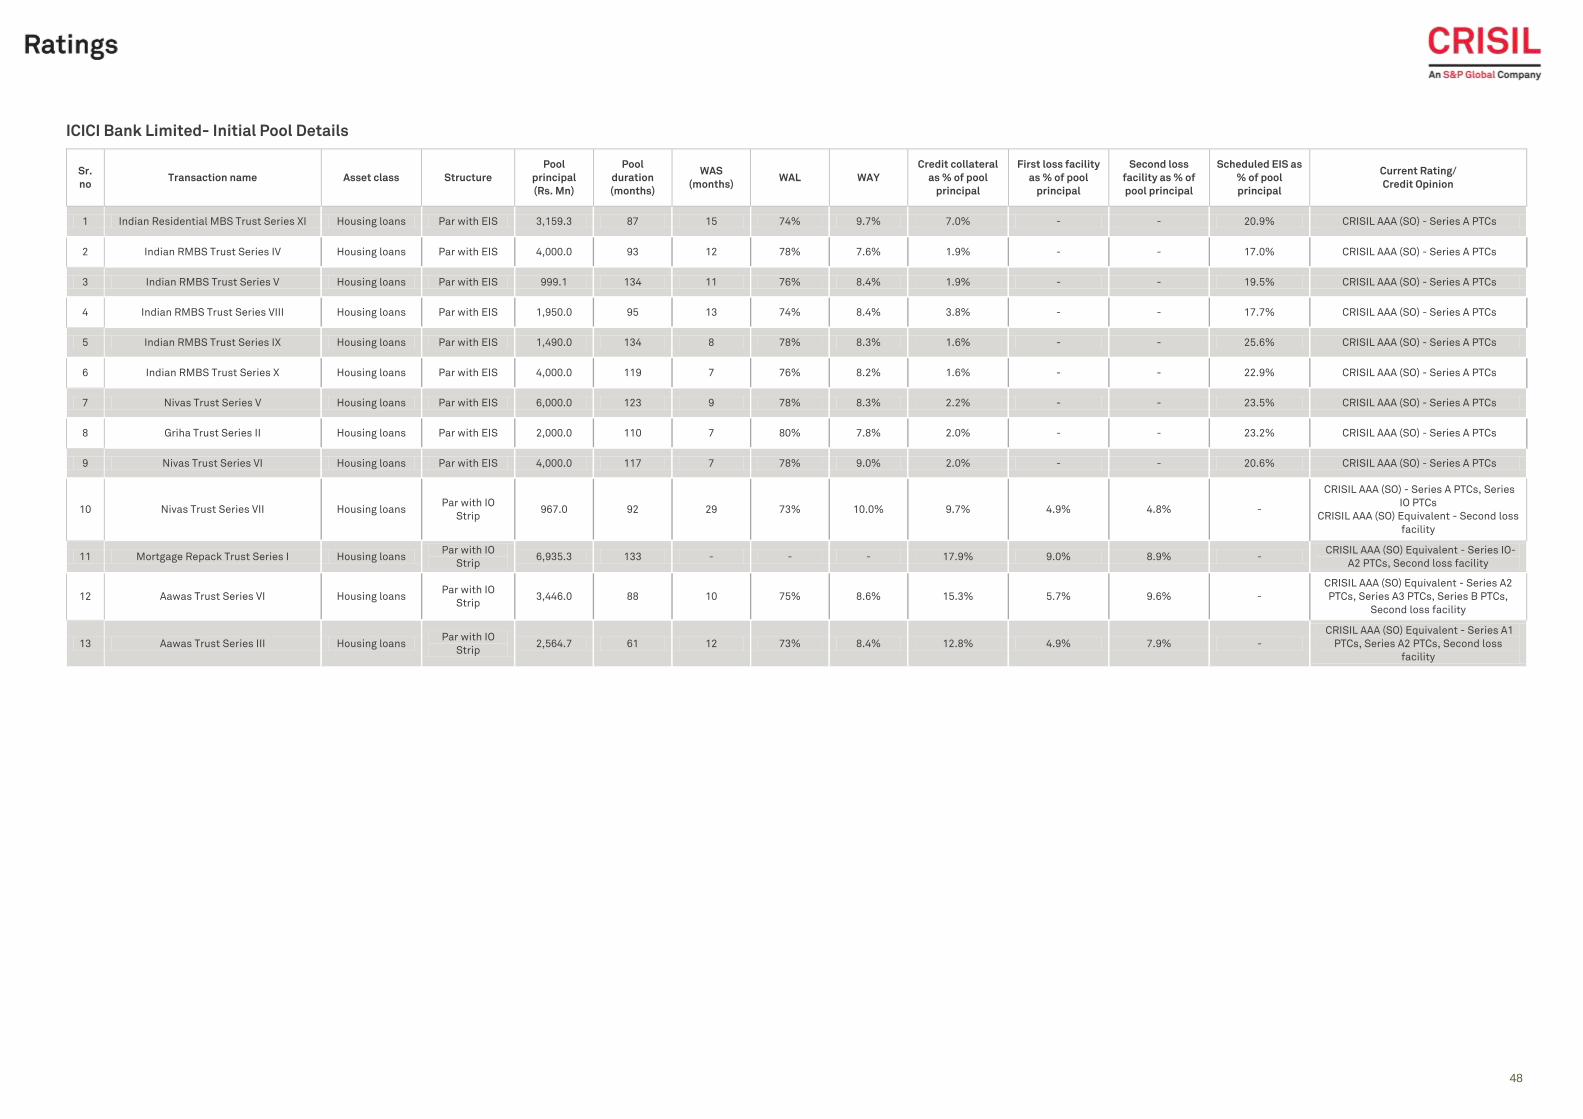
48
48
ICICI Bank Limited- Initial Pool Details
Sr.
no Transaction name Asset class Structure
Pool
principal
(Rs. Mn)
Pool
duration
(months)
WAS
(months) WAL WAY
Credit collateral
as % of pool
principal
First loss facility
as % of pool
principal
Second loss
facility as % of
pool principal
Scheduled EIS as
% of pool
principal
Current Rating/
Credit Opinion
1 Indian Residential MBS Trust Series XI Housing loans Par with EIS 3,159.3 87 15 74% 9.7% 7.0% - - 20.9% CRISIL AAA (SO) - Series A PTCs
2 Indian RMBS Trust Series IV Housing loans Par with EIS 4,000.0 93 12 78% 7.6% 1.9% - - 17.0% CRISIL AAA (SO) - Series A PTCs
3 Indian RMBS Trust Series V Housing loans Par with EIS 999.1 134 11 76% 8.4% 1.9% - - 19.5% CRISIL AAA (SO) - Series A PTCs
4 Indian RMBS Trust Series VIII Housing loans Par with EIS 1,950.0 95 13 74% 8.4% 3.8% - - 17.7% CRISIL AAA (SO) - Series A PTCs
5 Indian RMBS Trust Series IX Housing loans Par with EIS 1,490.0 134 8 78% 8.3% 1.6% - - 25.6% CRISIL AAA (SO) - Series A PTCs
6 Indian RMBS Trust Series X Housing loans Par with EIS 4,000.0 119 7 76% 8.2% 1.6% - - 22.9% CRISIL AAA (SO) - Series A PTCs
7 Nivas Trust Series V Housing loans Par with EIS 6,000.0 123 9 78% 8.3% 2.2% - - 23.5% CRISIL AAA (SO) - Series A PTCs
8 Griha Trust Series II Housing loans Par with EIS 2,000.0 110 7 80% 7.8% 2.0% - - 23.2% CRISIL AAA (SO) - Series A PTCs
9 Nivas Trust Series VI Housing loans Par with EIS 4,000.0 117 7 78% 9.0% 2.0% - - 20.6% CRISIL AAA (SO) - Series A PTCs
10 Nivas Trust Series VII Housing loans Par with IO
Strip 967.0 92 29 73% 10.0% 9.7% 4.9% 4.8% -
CRISIL AAA (SO) - Series A PTCs, Series
IO PTCs
CRISIL AAA (SO) Equivalent - Second loss
facility
11 Mortgage Repack Trust Series I Housing loans Par with IO
Strip 6,935.3 133 - - - 17.9% 9.0% 8.9% -
CRISIL AAA (SO) Equivalent - Series IO-
A2 PTCs, Second loss facility
12 Aawas Trust Series VI Housing loans Par with IO
Strip 3,446.0 88 10 75% 8.6% 15.3% 5.7% 9.6% -
CRISIL AAA (SO) Equivalent - Series A2
PTCs, Series A3 PTCs, Series B PTCs,
Second loss facility
13 Aawas Trust Series III Housing loans Par with IO
Strip 2,564.7 61 12 73% 8.4% 12.8% 4.9% 7.9% -
CRISIL AAA (SO) Equivalent - Series A1
PTCs, Series A2 PTCs, Second loss
facility
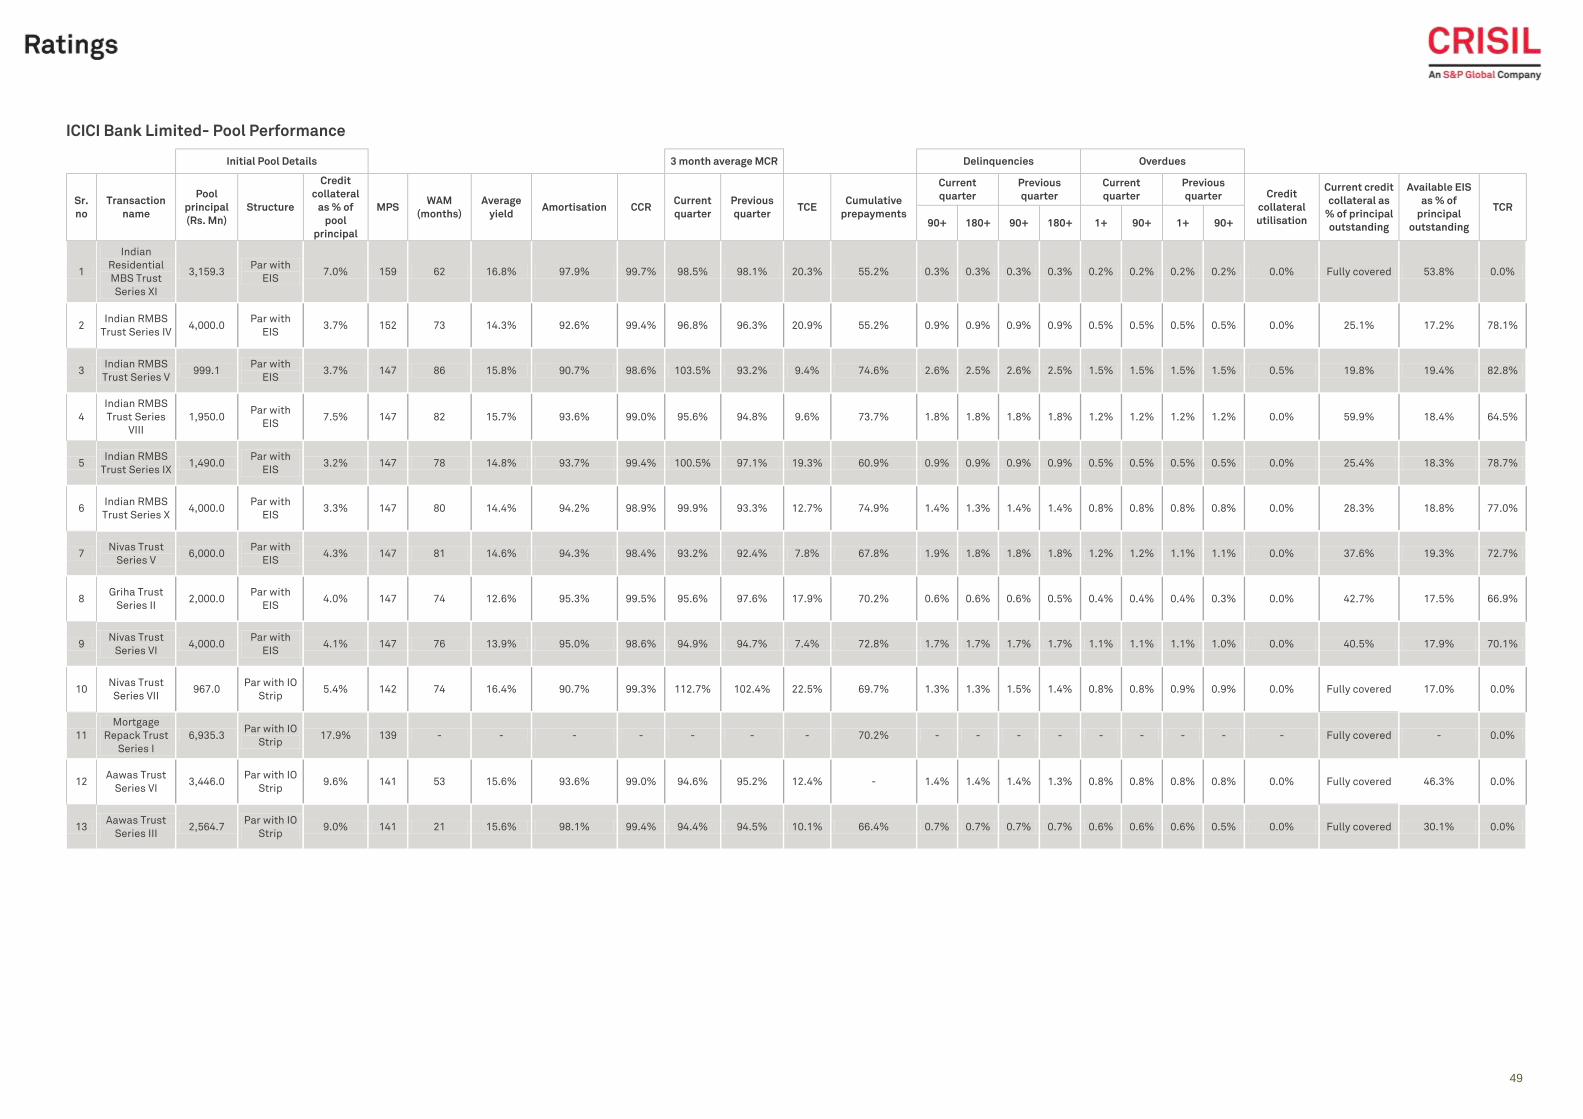
49
49
ICICI Bank Limited- Pool Performance
Initial Pool Details 3 month average MCR Delinquencies Overdues
Sr.
no
Transaction
name
Pool
principal
(Rs. Mn)
Structure
Credit
collateral
as % of
pool
principal
MPS WAM
(months)
Average
yield Amortisation CCR
Current
quarter
Previous
quarter TCE
Cumulative
prepayments
Current
quarter
Previous
quarter
Current
quarter
Previous
quarter Credit
collateral
utilisation
Current credit
collateral as
% of principal
outstanding
Available EIS
as % of
principal
outstanding
TCR
90+ 180+ 90+ 180+ 1+ 90+ 1+ 90+
1
Indian
Residential
MBS Trust
Series XI
3,159.3 Par with
EIS 7.0% 159 62 16.8% 97.9% 99.7% 98.5% 98.1% 20.3% 55.2% 0.3% 0.3% 0.3% 0.3% 0.2% 0.2% 0.2% 0.2% 0.0% Fully covered 53.8% 0.0%
2 Indian RMBS
Trust Series IV 4,000.0
Par with
EIS 3.7% 152 73 14.3% 92.6% 99.4% 96.8% 96.3% 20.9% 55.2% 0.9% 0.9% 0.9% 0.9% 0.5% 0.5% 0.5% 0.5% 0.0% 25.1% 17.2% 78.1%
3 Indian RMBS
Trust Series V 999.1
Par with
EIS 3.7% 147 86 15.8% 90.7% 98.6% 103.5% 93.2% 9.4% 74.6% 2.6% 2.5% 2.6% 2.5% 1.5% 1.5% 1.5% 1.5% 0.5% 19.8% 19.4% 82.8%
4
Indian RMBS
Trust Series
VIII
1,950.0 Par with
EIS 7.5% 147 82 15.7% 93.6% 99.0% 95.6% 94.8% 9.6% 73.7% 1.8% 1.8% 1.8% 1.8% 1.2% 1.2% 1.2% 1.2% 0.0% 59.9% 18.4% 64.5%
5 Indian RMBS
Trust Series IX 1,490.0
Par with
EIS 3.2% 147 78 14.8% 93.7% 99.4% 100.5% 97.1% 19.3% 60.9% 0.9% 0.9% 0.9% 0.9% 0.5% 0.5% 0.5% 0.5% 0.0% 25.4% 18.3% 78.7%
6 Indian RMBS
Trust Series X 4,000.0
Par with
EIS 3.3% 147 80 14.4% 94.2% 98.9% 99.9% 93.3% 12.7% 74.9% 1.4% 1.3% 1.4% 1.4% 0.8% 0.8% 0.8% 0.8% 0.0% 28.3% 18.8% 77.0%
7 Nivas Trust
Series V 6,000.0
Par with
EIS 4.3% 147 81 14.6% 94.3% 98.4% 93.2% 92.4% 7.8% 67.8% 1.9% 1.8% 1.8% 1.8% 1.2% 1.2% 1.1% 1.1% 0.0% 37.6% 19.3% 72.7%
8 Griha Trust
Series II 2,000.0
Par with
EIS 4.0% 147 74 12.6% 95.3% 99.5% 95.6% 97.6% 17.9% 70.2% 0.6% 0.6% 0.6% 0.5% 0.4% 0.4% 0.4% 0.3% 0.0% 42.7% 17.5% 66.9%
9 Nivas Trust
Series VI 4,000.0
Par with
EIS 4.1% 147 76 13.9% 95.0% 98.6% 94.9% 94.7% 7.4% 72.8% 1.7% 1.7% 1.7% 1.7% 1.1% 1.1% 1.1% 1.0% 0.0% 40.5% 17.9% 70.1%
10 Nivas Trust
Series VII 967.0
Par with IO
Strip 5.4% 142 74 16.4% 90.7% 99.3% 112.7% 102.4% 22.5% 69.7% 1.3% 1.3% 1.5% 1.4% 0.8% 0.8% 0.9% 0.9% 0.0% Fully covered 17.0% 0.0%
11
Mortgage
Repack Trust
Series I
6,935.3 Par with IO
Strip 17.9% 139 - - - - - - - 70.2% - - - - - - - - - Fully covered - 0.0%
12 Aawas Trust
Series VI 3,446.0
Par with IO
Strip 9.6% 141 53 15.6% 93.6% 99.0% 94.6% 95.2% 12.4% - 1.4% 1.4% 1.4% 1.3% 0.8% 0.8% 0.8% 0.8% 0.0% Fully covered 46.3% 0.0%
13 Aawas Trust
Series III 2,564.7
Par with IO
Strip 9.0% 141 21 15.6% 98.1% 99.4% 94.4% 94.5% 10.1% 66.4% 0.7% 0.7% 0.7% 0.7% 0.6% 0.6% 0.6% 0.5% 0.0% Fully covered 30.1% 0.0%
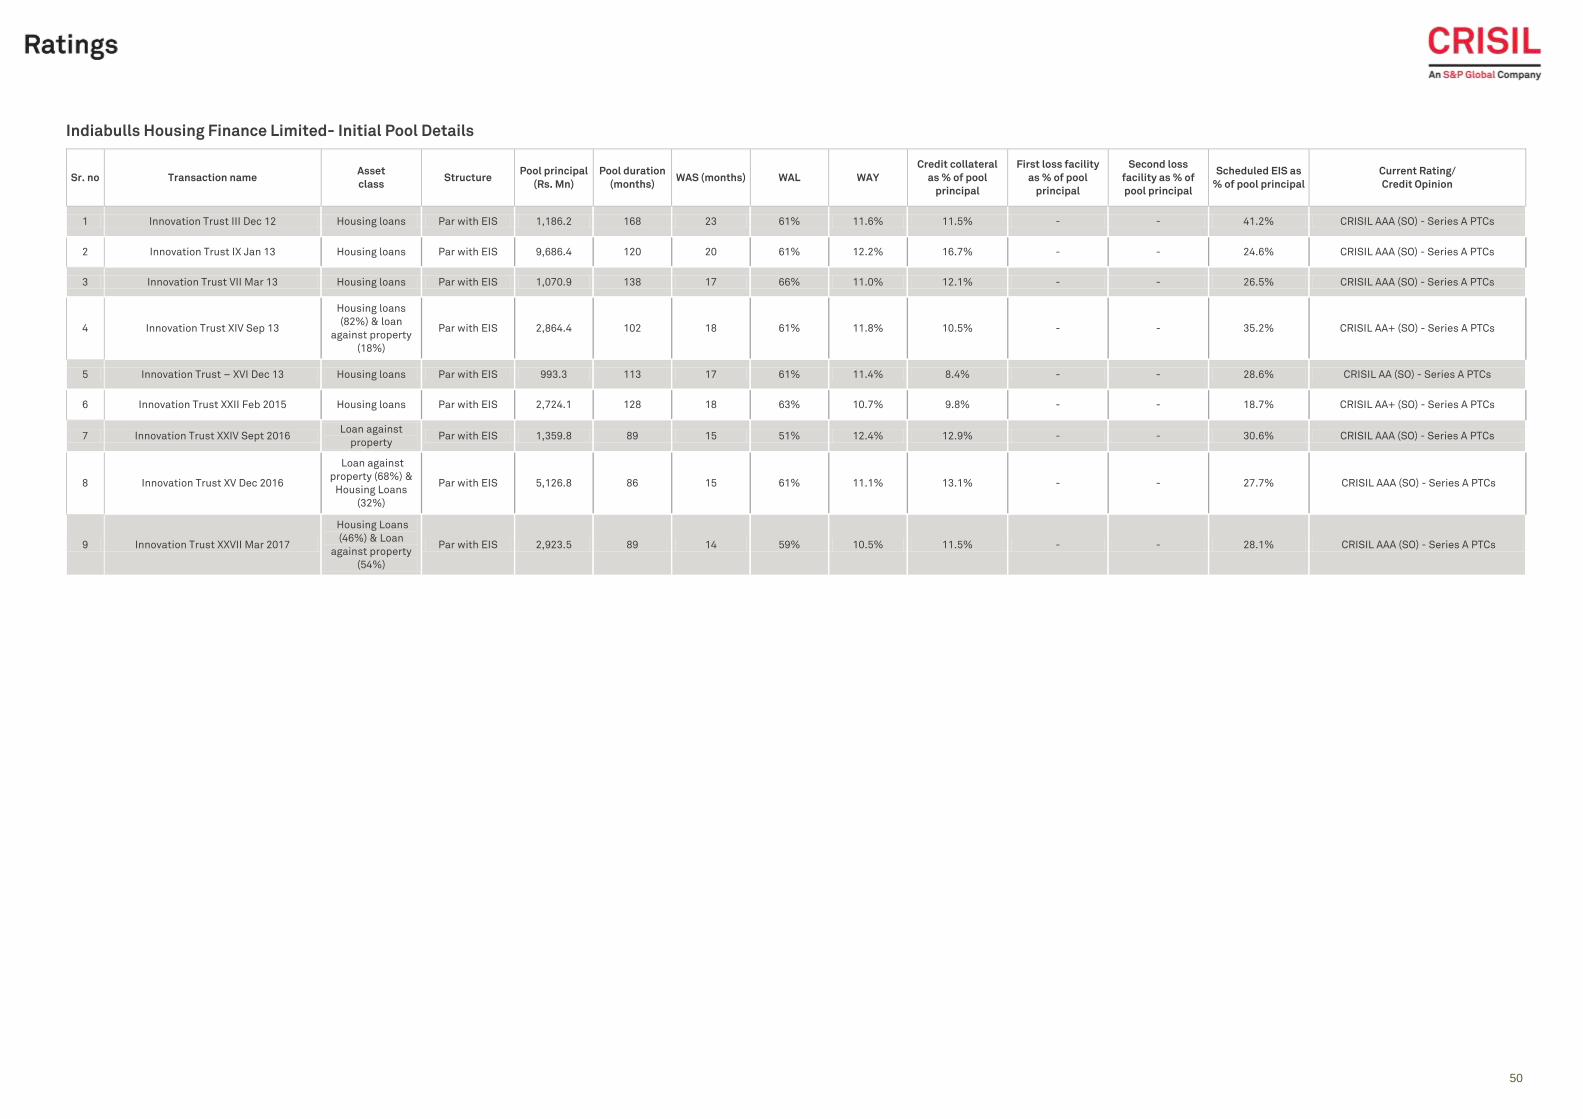
50
50
Indiabulls Housing Finance Limited- Initial Pool Details
Sr. no Transaction name Asset
class Structure
Pool principal
(Rs. Mn)
Pool duration
(months) WAS (months) WAL WAY
Credit collateral
as % of pool
principal
First loss facility
as % of pool
principal
Second loss
facility as % of
pool principal
Scheduled EIS as
% of pool principal
Current Rating/
Credit Opinion
1 Innovation Trust III Dec 12 Housing loans Par with EIS 1,186.2 168 23 61% 11.6% 11.5% - - 41.2% CRISIL AAA (SO) - Series A PTCs
2 Innovation Trust IX Jan 13 Housing loans Par with EIS 9,686.4 120 20 61% 12.2% 16.7% - - 24.6% CRISIL AAA (SO) - Series A PTCs
3 Innovation Trust VII Mar 13 Housing loans Par with EIS 1,070.9 138 17 66% 11.0% 12.1% - - 26.5% CRISIL AAA (SO) - Series A PTCs
4 Innovation Trust XIV Sep 13
Housing loans
(82%) & loan
against property
(18%)
Par with EIS 2,864.4 102 18 61% 11.8% 10.5% - - 35.2% CRISIL AA+ (SO) - Series A PTCs
5 Innovation Trust – XVI Dec 13 Housing loans Par with EIS 993.3 113 17 61% 11.4% 8.4% - - 28.6% CRISIL AA (SO) - Series A PTCs
6 Innovation Trust XXII Feb 2015 Housing loans Par with EIS 2,724.1 128 18 63% 10.7% 9.8% - - 18.7% CRISIL AA+ (SO) - Series A PTCs
7 Innovation Trust XXIV Sept 2016 Loan against
property Par with EIS 1,359.8 89 15 51% 12.4% 12.9% - - 30.6% CRISIL AAA (SO) - Series A PTCs
8 Innovation Trust XV Dec 2016
Loan against
property (68%) &
Housing Loans
(32%)
Par with EIS 5,126.8 86 15 61% 11.1% 13.1% - - 27.7% CRISIL AAA (SO) - Series A PTCs
9 Innovation Trust XXVII Mar 2017
Housing Loans
(46%) & Loan
against property
(54%)
Par with EIS 2,923.5 89 14 59% 10.5% 11.5% - - 28.1% CRISIL AAA (SO) - Series A PTCs
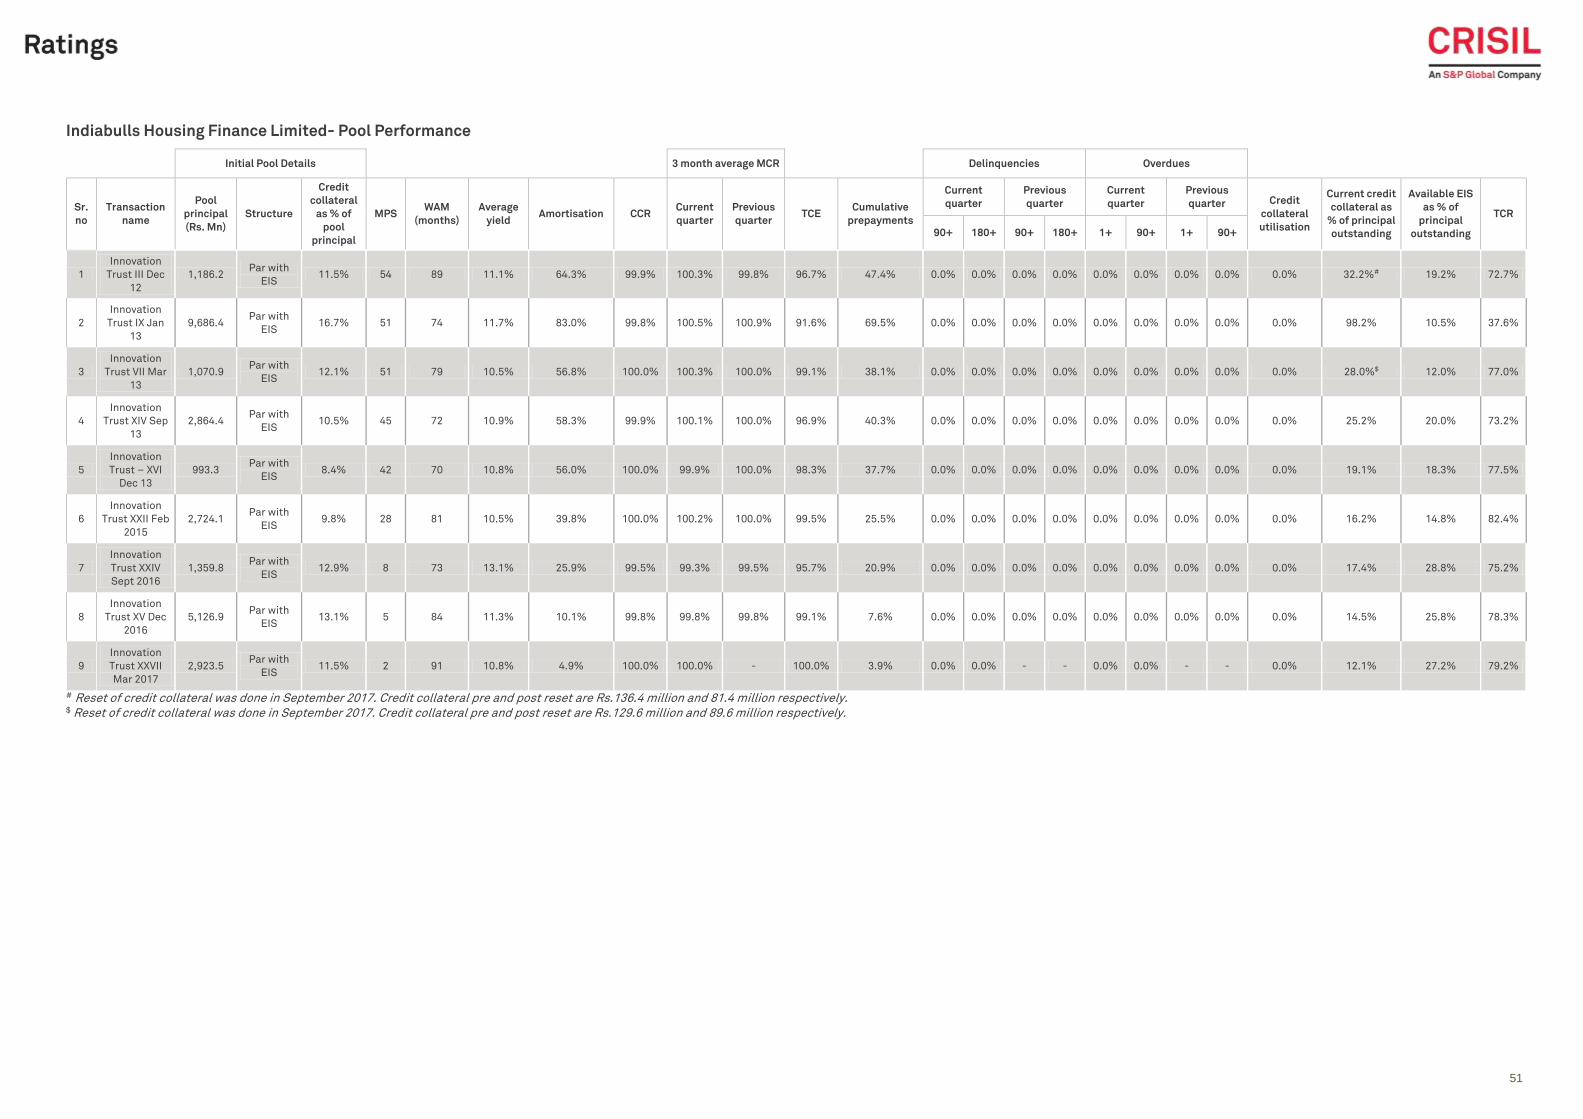
51
51
Indiabulls Housing Finance Limited- Pool Performance
Initial Pool Details 3 month average MCR Delinquencies Overdues
Sr.
no
Transaction
name
Pool
principal
(Rs. Mn)
Structure
Credit
collateral
as % of
pool
principal
MPS WAM
(months)
Average
yield Amortisation CCR
Current
quarter
Previous
quarter TCE
Cumulative
prepayments
Current
quarter
Previous
quarter
Current
quarter
Previous
quarter Credit
collateral
utilisation
Current credit
collateral as
% of principal
outstanding
Available EIS
as % of
principal
outstanding
TCR
90+ 180+ 90+ 180+ 1+ 90+ 1+ 90+
1
Innovation
Trust III Dec
12
1,186.2 Par with
EIS 11.5% 54 89 11.1% 64.3% 99.9% 100.3% 99.8% 96.7% 47.4% 0.0% 0.0% 0.0% 0.0% 0.0% 0.0% 0.0% 0.0% 0.0% 32.2%# 19.2% 72.7%
2
Innovation
Trust IX Jan
13
9,686.4 Par with
EIS 16.7% 51 74 11.7% 83.0% 99.8% 100.5% 100.9% 91.6% 69.5% 0.0% 0.0% 0.0% 0.0% 0.0% 0.0% 0.0% 0.0% 0.0% 98.2% 10.5% 37.6%
3
Innovation
Trust VII Mar
13
1,070.9 Par with
EIS 12.1% 51 79 10.5% 56.8% 100.0% 100.3% 100.0% 99.1% 38.1% 0.0% 0.0% 0.0% 0.0% 0.0% 0.0% 0.0% 0.0% 0.0% 28.0%$ 12.0% 77.0%
4
Innovation
Trust XIV Sep
13
2,864.4 Par with
EIS 10.5% 45 72 10.9% 58.3% 99.9% 100.1% 100.0% 96.9% 40.3% 0.0% 0.0% 0.0% 0.0% 0.0% 0.0% 0.0% 0.0% 0.0% 25.2% 20.0% 73.2%
5
Innovation
Trust – XVI
Dec 13
993.3 Par with
EIS 8.4% 42 70 10.8% 56.0% 100.0% 99.9% 100.0% 98.3% 37.7% 0.0% 0.0% 0.0% 0.0% 0.0% 0.0% 0.0% 0.0% 0.0% 19.1% 18.3% 77.5%
6
Innovation
Trust XXII Feb
2015
2,724.1 Par with
EIS 9.8% 28 81 10.5% 39.8% 100.0% 100.2% 100.0% 99.5% 25.5% 0.0% 0.0% 0.0% 0.0% 0.0% 0.0% 0.0% 0.0% 0.0% 16.2% 14.8% 82.4%
7
Innovation
Trust XXIV
Sept 2016
1,359.8 Par with
EIS 12.9% 8 73 13.1% 25.9% 99.5% 99.3% 99.5% 95.7% 20.9% 0.0% 0.0% 0.0% 0.0% 0.0% 0.0% 0.0% 0.0% 0.0% 17.4% 28.8% 75.2%
8
Innovation
Trust XV Dec
2016
5,126.9 Par with
EIS 13.1% 5 84 11.3% 10.1% 99.8% 99.8% 99.8% 99.1% 7.6% 0.0% 0.0% 0.0% 0.0% 0.0% 0.0% 0.0% 0.0% 0.0% 14.5% 25.8% 78.3%
9
Innovation
Trust XXVII
Mar 2017
2,923.5 Par with
EIS 11.5% 2 91 10.8% 4.9% 100.0% 100.0% - 100.0% 3.9% 0.0% 0.0% - - 0.0% 0.0% - - 0.0% 12.1% 27.2% 79.2%
# Reset of credit collateral was done in September 2017. Credit collateral pre and post reset are Rs.136.4 million and 81.4 million respectively. $ Reset of credit collateral was done in September 2017. Credit collateral pre and post reset are Rs.129.6 million and 89.6 million respectively.
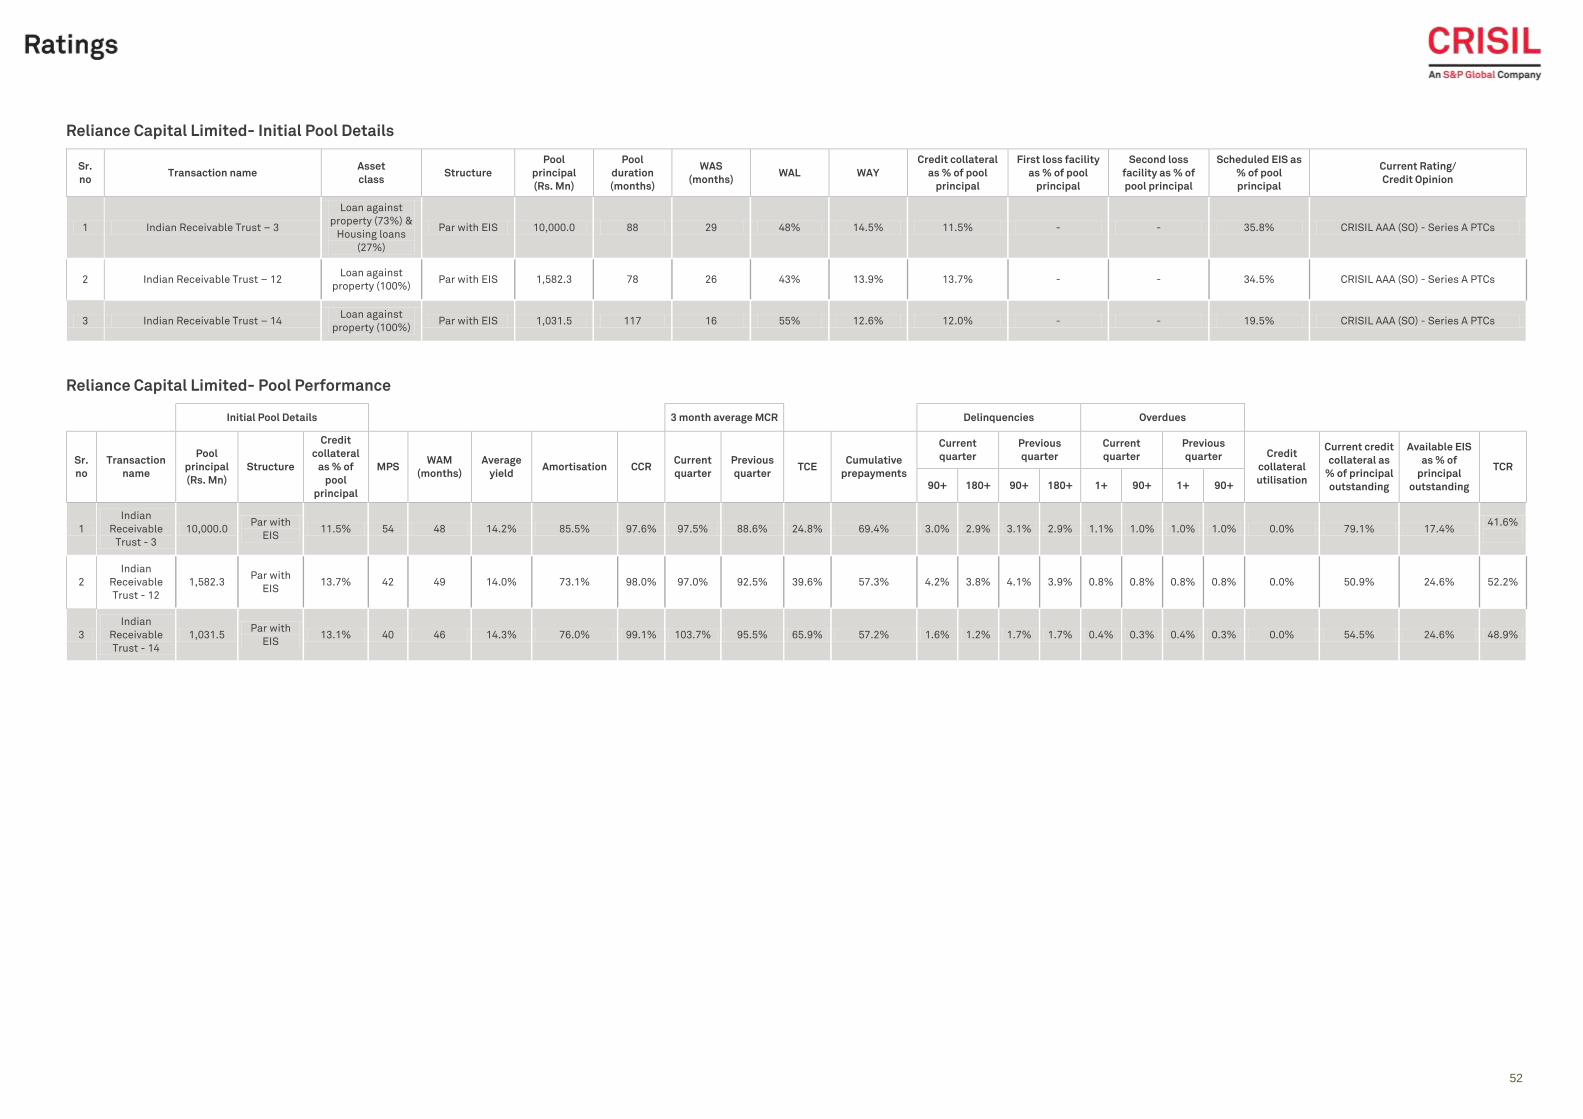
52
52
Reliance Capital Limited- Initial Pool Details
Sr.
no Transaction name
Asset
class Structure
Pool
principal
(Rs. Mn)
Pool
duration
(months)
WAS
(months) WAL WAY
Credit collateral
as % of pool
principal
First loss facility
as % of pool
principal
Second loss
facility as % of
pool principal
Scheduled EIS as
% of pool
principal
Current Rating/
Credit Opinion
1 Indian Receivable Trust – 3
Loan against
property (73%) &
Housing loans
(27%)
Par with EIS 10,000.0 88 29 48% 14.5% 11.5% - - 35.8% CRISIL AAA (SO) - Series A PTCs
2 Indian Receivable Trust – 12 Loan against
property (100%) Par with EIS 1,582.3 78 26 43% 13.9% 13.7% - - 34.5% CRISIL AAA (SO) - Series A PTCs
3 Indian Receivable Trust – 14 Loan against
property (100%) Par with EIS 1,031.5 117 16 55% 12.6% 12.0% - - 19.5% CRISIL AAA (SO) - Series A PTCs
Reliance Capital Limited- Pool Performance
Initial Pool Details 3 month average MCR Delinquencies Overdues
Sr.
no
Transaction
name
Pool
principal
(Rs. Mn)
Structure
Credit
collateral
as % of
pool
principal
MPS WAM
(months)
Average
yield Amortisation CCR
Current
quarter
Previous
quarter TCE
Cumulative
prepayments
Current
quarter
Previous
quarter
Current
quarter
Previous
quarter Credit
collateral
utilisation
Current credit
collateral as
% of principal
outstanding
Available EIS
as % of
principal
outstanding
TCR
90+ 180+ 90+ 180+ 1+ 90+ 1+ 90+
1
Indian
Receivable
Trust - 3
10,000.0 Par with
EIS 11.5% 54 48 14.2% 85.5% 97.6% 97.5% 88.6% 24.8% 69.4% 3.0% 2.9% 3.1% 2.9% 1.1% 1.0% 1.0% 1.0% 0.0% 79.1% 17.4%
41.6%
2
Indian
Receivable
Trust - 12
1,582.3 Par with
EIS 13.7% 42 49 14.0% 73.1% 98.0% 97.0% 92.5% 39.6% 57.3% 4.2% 3.8% 4.1% 3.9% 0.8% 0.8% 0.8% 0.8% 0.0% 50.9% 24.6% 52.2%
3
Indian
Receivable
Trust - 14
1,031.5 Par with
EIS 13.1% 40 46 14.3% 76.0% 99.1% 103.7% 95.5% 65.9% 57.2% 1.6% 1.2% 1.7% 1.7% 0.4% 0.3% 0.4% 0.3% 0.0% 54.5% 24.6% 48.9%
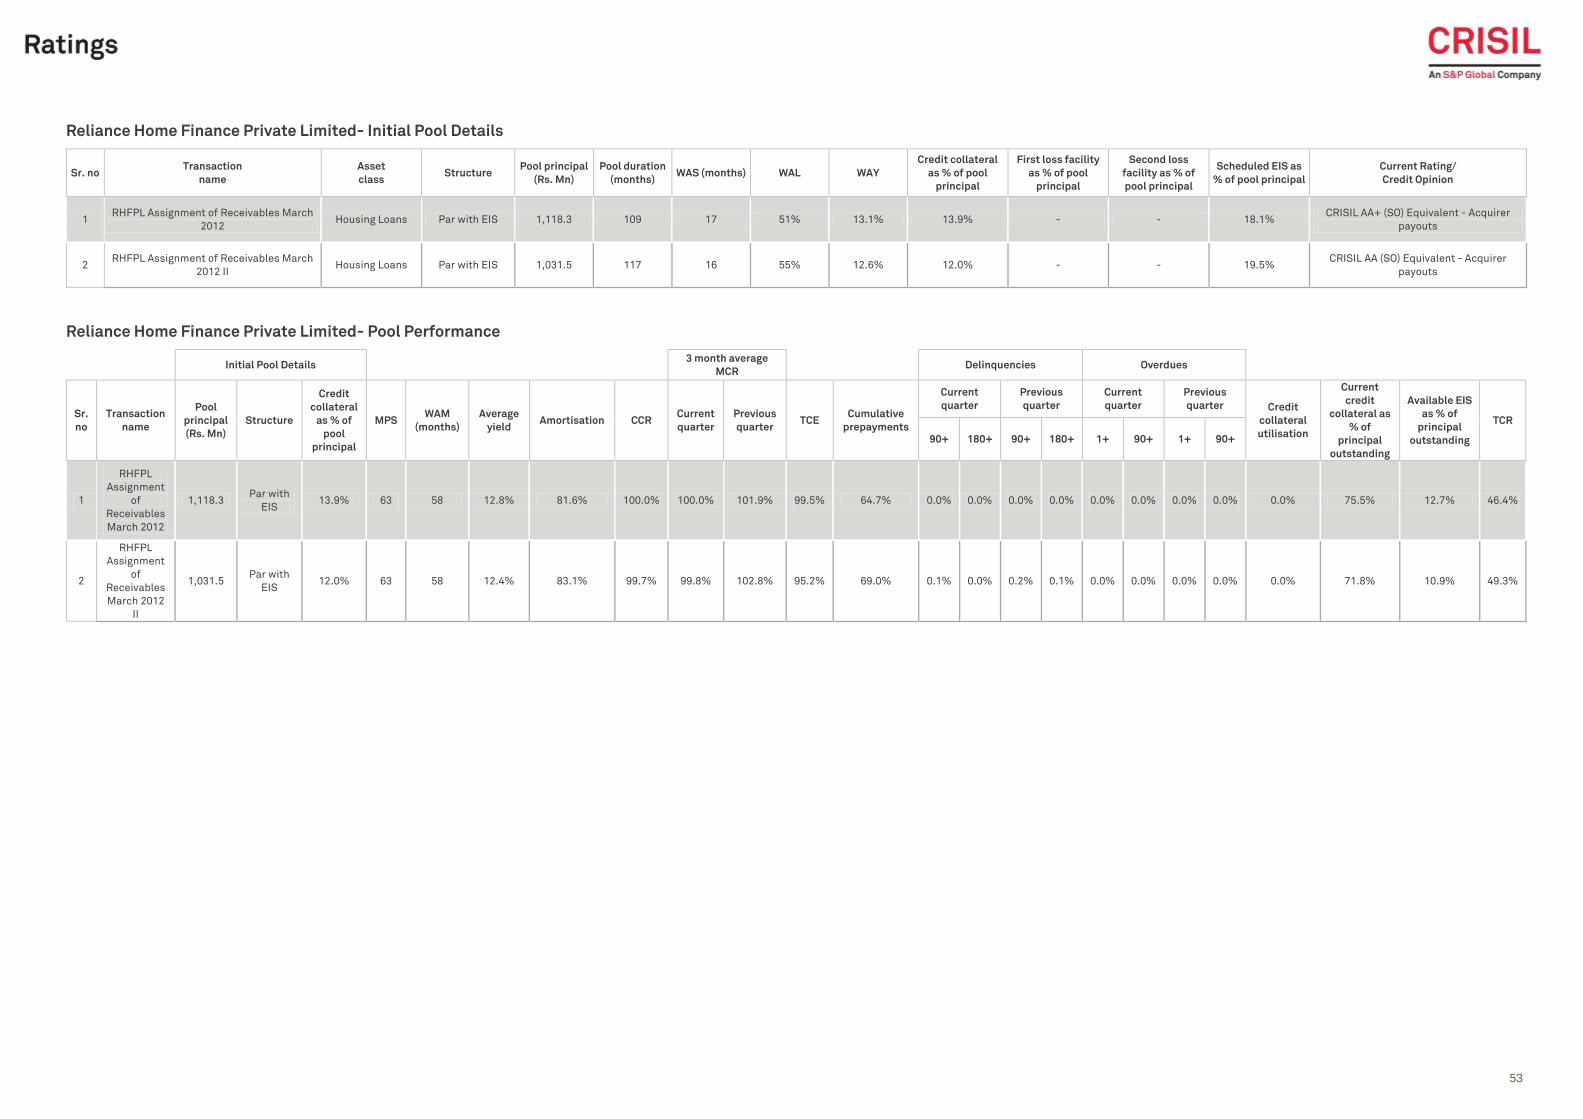
53
53
Reliance Home Finance Private Limited- Initial Pool Details
Sr. no Transaction
name
Asset
class Structure
Pool principal
(Rs. Mn)
Pool duration
(months) WAS (months) WAL WAY
Credit collateral
as % of pool
principal
First loss facility
as % of pool
principal
Second loss
facility as % of
pool principal
Scheduled EIS as
% of pool principal
Current Rating/
Credit Opinion
1 RHFPL Assignment of Receivables March
2012 Housing Loans Par with EIS 1,118.3 109 17 51% 13.1% 13.9% - - 18.1%
CRISIL AA+ (SO) Equivalent - Acquirer
payouts
2 RHFPL Assignment of Receivables March
2012 II Housing Loans Par with EIS 1,031.5 117 16 55% 12.6% 12.0% - - 19.5%
CRISIL AA (SO) Equivalent - Acquirer
payouts
Reliance Home Finance Private Limited- Pool Performance
Initial Pool Details 3 month average
MCR Delinquencies Overdues
Sr.
no
Transaction
name
Pool
principal
(Rs. Mn)
Structure
Credit
collateral
as % of
pool
principal
MPS WAM
(months)
Average
yield Amortisation CCR
Current
quarter
Previous
quarter TCE
Cumulative
prepayments
Current
quarter
Previous
quarter
Current
quarter
Previous
quarter Credit
collateral
utilisation
Current
credit
collateral as
% of
principal
outstanding
Available EIS
as % of
principal
outstanding
TCR
90+ 180+ 90+ 180+ 1+ 90+ 1+ 90+
1
RHFPL
Assignment
of
Receivables
March 2012
1,118.3 Par with
EIS 13.9% 63 58 12.8% 81.6% 100.0% 100.0% 101.9% 99.5% 64.7% 0.0% 0.0% 0.0% 0.0% 0.0% 0.0% 0.0% 0.0% 0.0% 75.5% 12.7% 46.4%
2
RHFPL
Assignment
of
Receivables
March 2012
II
1,031.5 Par with
EIS 12.0% 63 58 12.4% 83.1% 99.7% 99.8% 102.8% 95.2% 69.0% 0.1% 0.0% 0.2% 0.1% 0.0% 0.0% 0.0% 0.0% 0.0% 71.8% 10.9% 49.3%
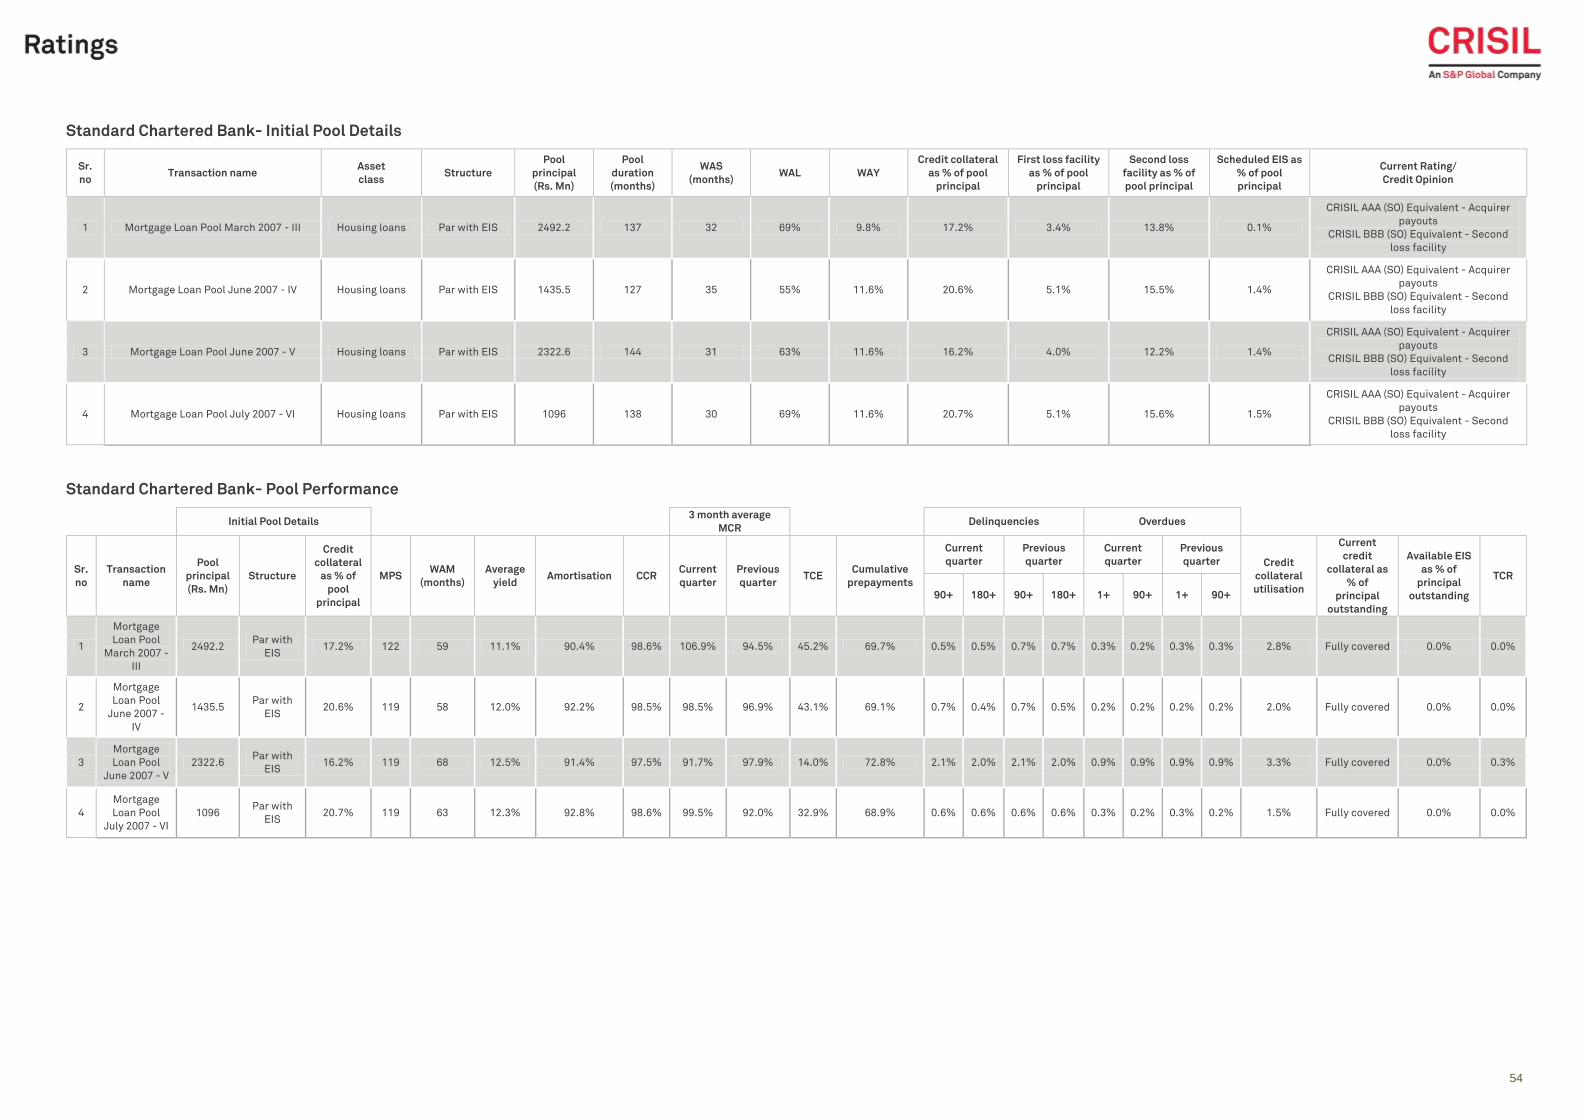
54
54
Standard Chartered Bank- Initial Pool Details
Sr.
no Transaction name
Asset
class Structure
Pool
principal
(Rs. Mn)
Pool
duration
(months)
WAS
(months) WAL WAY
Credit collateral
as % of pool
principal
First loss facility
as % of pool
principal
Second loss
facility as % of
pool principal
Scheduled EIS as
% of pool
principal
Current Rating/
Credit Opinion
1 Mortgage Loan Pool March 2007 - III Housing loans Par with EIS 2492.2 137 32 69% 9.8% 17.2% 3.4% 13.8% 0.1%
CRISIL AAA (SO) Equivalent - Acquirer
payouts
CRISIL BBB (SO) Equivalent - Second
loss facility
2 Mortgage Loan Pool June 2007 - IV Housing loans Par with EIS 1435.5 127 35 55% 11.6% 20.6% 5.1% 15.5% 1.4%
CRISIL AAA (SO) Equivalent - Acquirer
payouts
CRISIL BBB (SO) Equivalent - Second
loss facility
3 Mortgage Loan Pool June 2007 - V Housing loans Par with EIS 2322.6 144 31 63% 11.6% 16.2% 4.0% 12.2% 1.4%
CRISIL AAA (SO) Equivalent - Acquirer
payouts
CRISIL BBB (SO) Equivalent - Second
loss facility
4 Mortgage Loan Pool July 2007 - VI Housing loans Par with EIS 1096 138 30 69% 11.6% 20.7% 5.1% 15.6% 1.5%
CRISIL AAA (SO) Equivalent - Acquirer
payouts
CRISIL BBB (SO) Equivalent - Second
loss facility
Standard Chartered Bank- Pool Performance
Initial Pool Details 3 month average
MCR Delinquencies Overdues
Sr.
no
Transaction
name
Pool
principal
(Rs. Mn)
Structure
Credit
collateral
as % of
pool
principal
MPS WAM
(months)
Average
yield Amortisation CCR
Current
quarter
Previous
quarter TCE
Cumulative
prepayments
Current
quarter
Previous
quarter
Current
quarter
Previous
quarter Credit
collateral
utilisation
Current
credit
collateral as
% of
principal
outstanding
Available EIS
as % of
principal
outstanding
TCR
90+ 180+ 90+ 180+ 1+ 90+ 1+ 90+
1
Mortgage
Loan Pool
March 2007 -
III
2492.2 Par with
EIS 17.2% 122 59 11.1% 90.4% 98.6% 106.9% 94.5% 45.2% 69.7% 0.5% 0.5% 0.7% 0.7% 0.3% 0.2% 0.3% 0.3% 2.8% Fully covered 0.0% 0.0%
2
Mortgage
Loan Pool
June 2007 -
IV
1435.5 Par with
EIS 20.6% 119 58 12.0% 92.2% 98.5% 98.5% 96.9% 43.1% 69.1% 0.7% 0.4% 0.7% 0.5% 0.2% 0.2% 0.2% 0.2% 2.0% Fully covered 0.0% 0.0%
3
Mortgage
Loan Pool
June 2007 - V
2322.6 Par with
EIS 16.2% 119 68 12.5% 91.4% 97.5% 91.7% 97.9% 14.0% 72.8% 2.1% 2.0% 2.1% 2.0% 0.9% 0.9% 0.9% 0.9% 3.3% Fully covered 0.0% 0.3%
4
Mortgage
Loan Pool
July 2007 - VI
1096 Par with
EIS 20.7% 119 63 12.3% 92.8% 98.6% 99.5% 92.0% 32.9% 68.9% 0.6% 0.6% 0.6% 0.6% 0.3% 0.2% 0.3% 0.2% 1.5% Fully covered 0.0% 0.0%
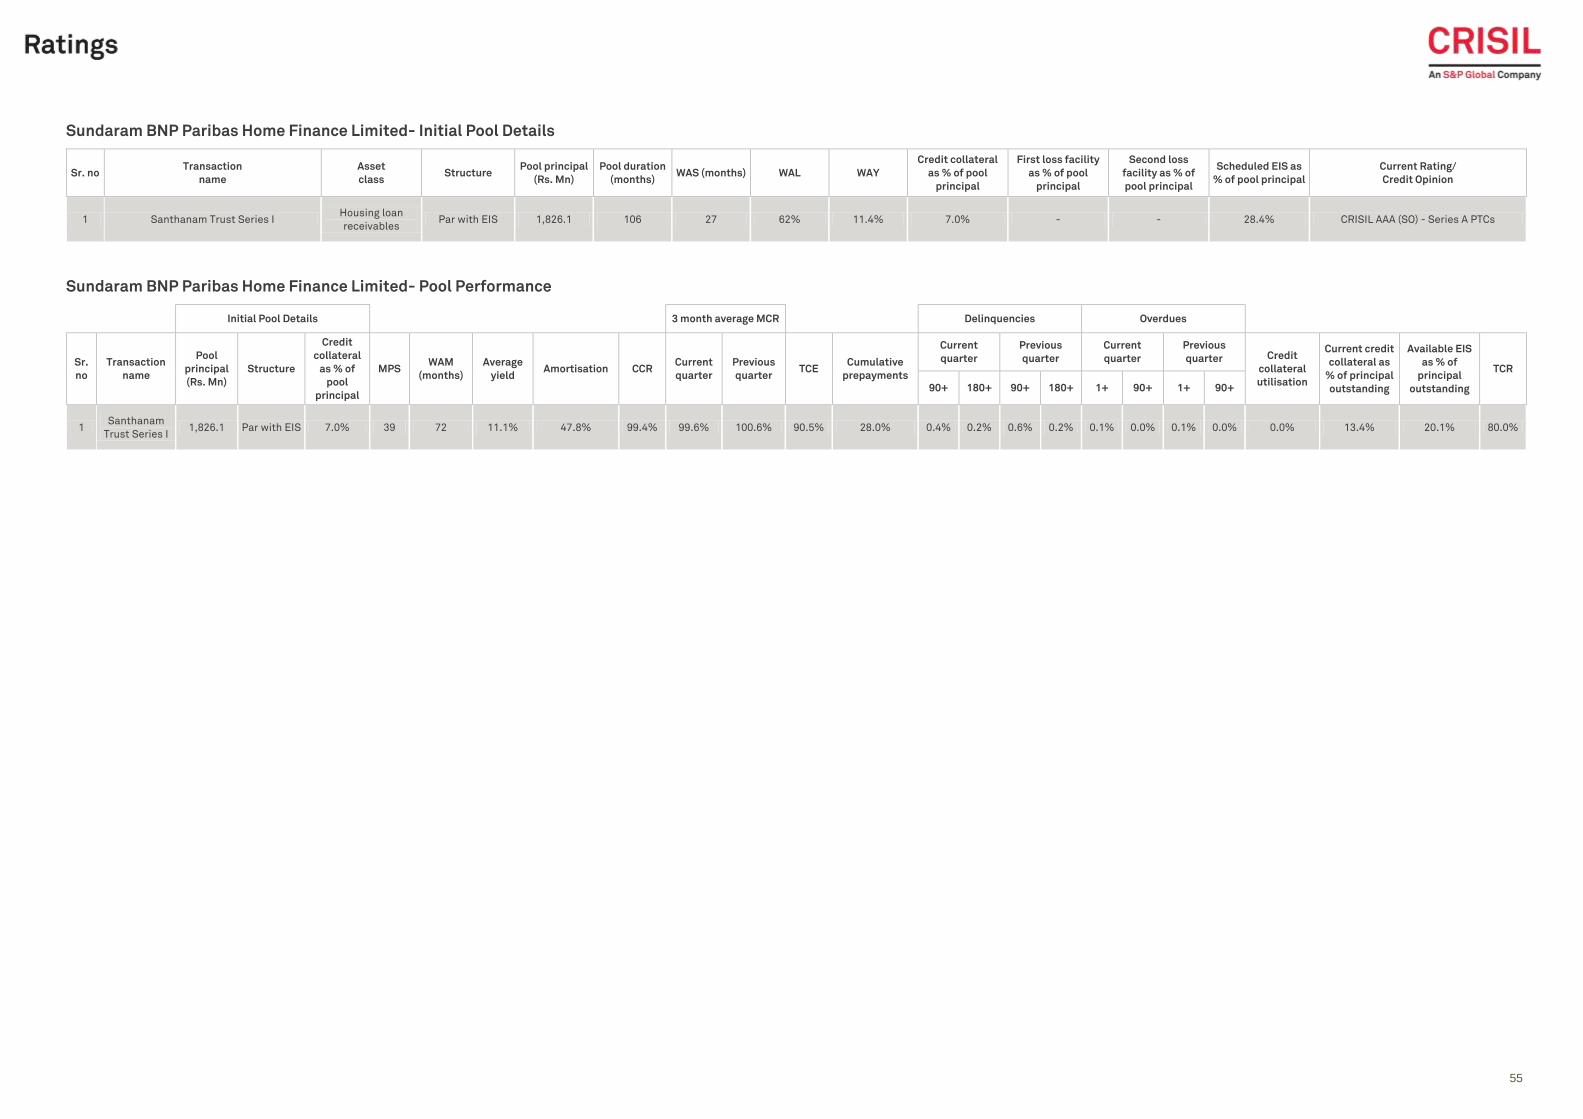
55
55
Sundaram BNP Paribas Home Finance Limited- Initial Pool Details
Sr. no Transaction
name
Asset
class Structure
Pool principal
(Rs. Mn)
Pool duration
(months) WAS (months) WAL WAY
Credit collateral
as % of pool
principal
First loss facility
as % of pool
principal
Second loss
facility as % of
pool principal
Scheduled EIS as
% of pool principal
Current Rating/
Credit Opinion
1 Santhanam Trust Series I Housing loan
receivables Par with EIS 1,826.1 106 27 62% 11.4% 7.0% - - 28.4% CRISIL AAA (SO) - Series A PTCs
Sundaram BNP Paribas Home Finance Limited- Pool Performance
Initial Pool Details 3 month average MCR Delinquencies Overdues
Sr.
no
Transaction
name
Pool
principal
(Rs. Mn)
Structure
Credit
collateral
as % of
pool
principal
MPS WAM
(months)
Average
yield Amortisation CCR
Current
quarter
Previous
quarter TCE
Cumulative
prepayments
Current
quarter
Previous
quarter
Current
quarter
Previous
quarter Credit
collateral
utilisation
Current credit
collateral as
% of principal
outstanding
Available EIS
as % of
principal
outstanding
TCR
90+ 180+ 90+ 180+ 1+ 90+ 1+ 90+
1 Santhanam
Trust Series I 1,826.1 Par with EIS 7.0% 39 72 11.1% 47.8% 99.4% 99.6% 100.6% 90.5% 28.0% 0.4% 0.2% 0.6% 0.2% 0.1% 0.0% 0.1% 0.0% 0.0% 13.4% 20.1% 80.0%
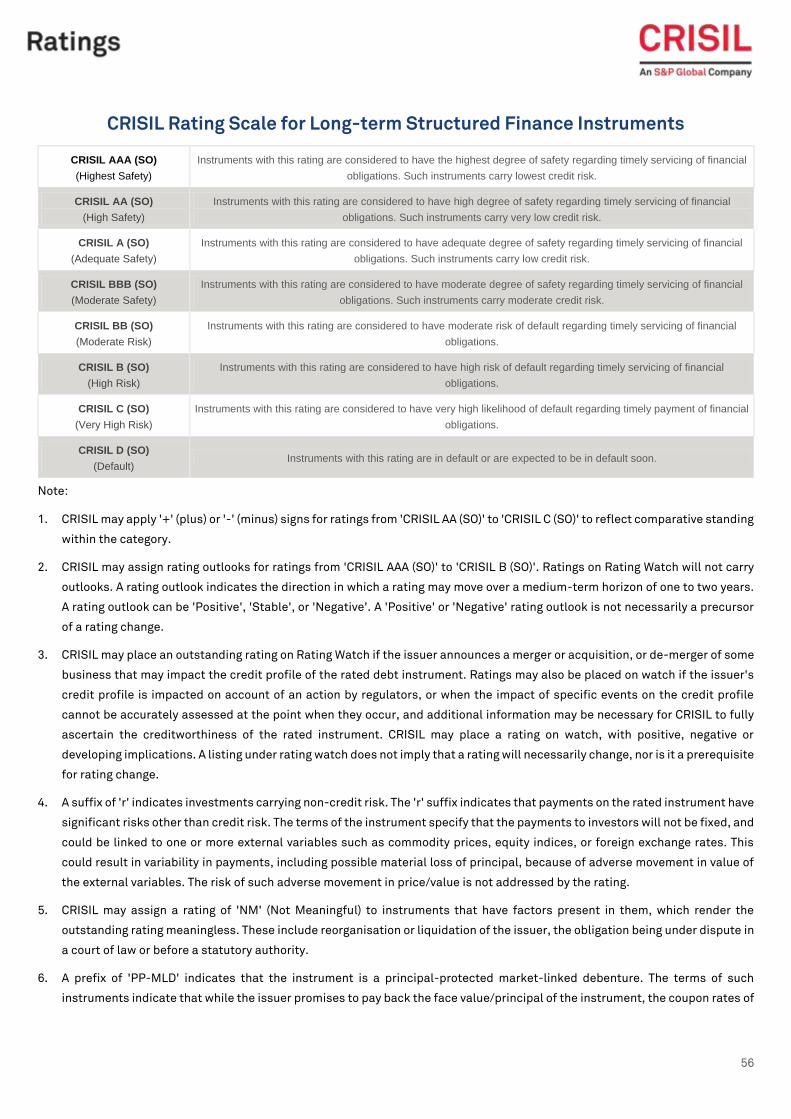
56
CRISIL Rating Scale for Long-term Structured Finance Instruments
CRISIL AAA (SO)
(Highest Safety)
Instruments with this rating are considered to have the highest degree of safety regarding timely servicing of financial
obligations. Such instruments carry lowest credit risk.
CRISIL AA (SO)
(High Safety)
Instruments with this rating are considered to have high degree of safety regarding timely servicing of financial
obligations. Such instruments carry very low credit risk.
CRISIL A (SO)
(Adequate Safety)
Instruments with this rating are considered to have adequate degree of safety regarding timely servicing of financial
obligations. Such instruments carry low credit risk.
CRISIL BBB (SO)
(Moderate Safety)
Instruments with this rating are considered to have moderate degree of safety regarding timely servicing of financial
obligations. Such instruments carry moderate credit risk.
CRISIL BB (SO)
(Moderate Risk)
Instruments with this rating are considered to have moderate risk of default regarding timely servicing of financial
obligations.
CRISIL B (SO)
(High Risk)
Instruments with this rating are considered to have high risk of default regarding timely servicing of financial
obligations.
CRISIL C (SO)
(Very High Risk)
Instruments with this rating are considered to have very high likelihood of default regarding timely payment of financial
obligations.
CRISIL D (SO)
(Default) Instruments with this rating are in default or are expected to be in default soon.
Note:
1. CRISIL may apply '+' (plus) or '-' (minus) signs for ratings from 'CRISIL AA (SO)' to 'CRISIL C (SO)' to reflect comparative standing
within the category.
2. CRISIL may assign rating outlooks for ratings from 'CRISIL AAA (SO)' to 'CRISIL B (SO)'. Ratings on Rating Watch will not carry
outlooks. A rating outlook indicates the direction in which a rating may move over a medium-term horizon of one to two years.
A rating outlook can be 'Positive', 'Stable', or 'Negative'. A 'Positive' or 'Negative' rating outlook is not necessarily a precursor
of a rating change.
3. CRISIL may place an outstanding rating on Rating Watch if the issuer announces a merger or acquisition, or de-merger of some
business that may impact the credit profile of the rated debt instrument. Ratings may also be placed on watch if the issuer's
credit profile is impacted on account of an action by regulators, or when the impact of specific events on the credit profile
cannot be accurately assessed at the point when they occur, and additional information may be necessary for CRISIL to fully
ascertain the creditworthiness of the rated instrument. CRISIL may place a rating on watch, with positive, negative or
developing implications. A listing under rating watch does not imply that a rating will necessarily change, nor is it a prerequisite
for rating change.
4. A suffix of 'r' indicates investments carrying non-credit risk. The 'r' suffix indicates that payments on the rated instrument have
significant risks other than credit risk. The terms of the instrument specify that the payments to investors will not be fixed, and
could be linked to one or more external variables such as commodity prices, equity indices, or foreign exchange rates. This
could result in variability in payments, including possible material loss of principal, because of adverse movement in value of
the external variables. The risk of such adverse movement in price/value is not addressed by the rating.
5. CRISIL may assign a rating of 'NM' (Not Meaningful) to instruments that have factors present in them, which render the
outstanding rating meaningless. These include reorganisation or liquidation of the issuer, the obligation being under dispute in
a court of law or before a statutory authority.
6. A prefix of 'PP-MLD' indicates that the instrument is a principal-protected market-linked debenture. The terms of such
instruments indicate that while the issuer promises to pay back the face value/principal of the instrument, the coupon rates of

CRISIL Performance Report
57
these instruments will not be fixed, and could be linked to one or more external variables such as commodity prices, equity
share prices, indices, or foreign exchange rates.
7. A prefix of 'Provisional' indicates that the rating centrally factors in the completion of certain critical steps/documentation by
the issuer for the instrument, without these the rating would either have been different or not assigned ab initio.
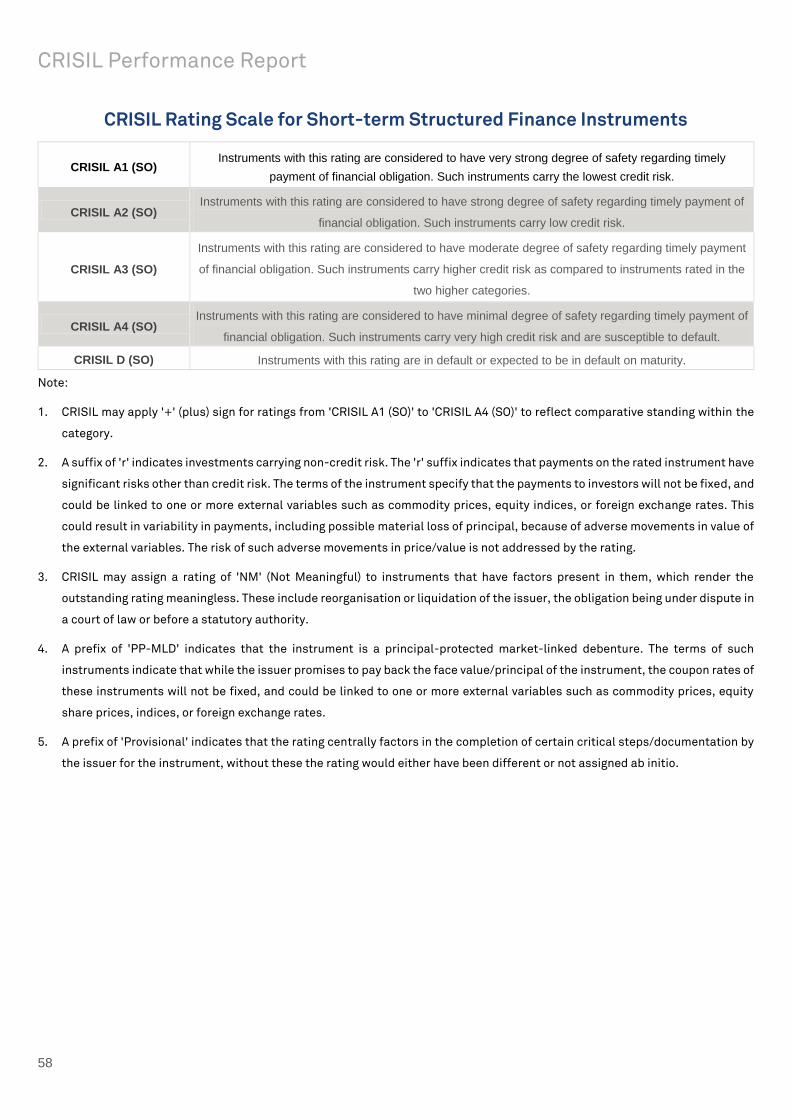
CRISIL Performance Report
58
CRISIL Rating Scale for Short-term Structured Finance Instruments
CRISIL A1 (SO) Instruments with this rating are considered to have very strong degree of safety regarding timely
payment of financial obligation. Such instruments carry the lowest credit risk.
CRISIL A2 (SO) Instruments with this rating are considered to have strong degree of safety regarding timely payment of
financial obligation. Such instruments carry low credit risk.
CRISIL A3 (SO)
Instruments with this rating are considered to have moderate degree of safety regarding timely payment
of financial obligation. Such instruments carry higher credit risk as compared to instruments rated in the
two higher categories.
CRISIL A4 (SO) Instruments with this rating are considered to have minimal degree of safety regarding timely payment of
financial obligation. Such instruments carry very high credit risk and are susceptible to default.
CRISIL D (SO) Instruments with this rating are in default or expected to be in default on maturity.
Note:
1. CRISIL may apply '+' (plus) sign for ratings from 'CRISIL A1 (SO)' to 'CRISIL A4 (SO)' to reflect comparative standing within the
category.
2. A suffix of 'r' indicates investments carrying non-credit risk. The 'r' suffix indicates that payments on the rated instrument have
significant risks other than credit risk. The terms of the instrument specify that the payments to investors will not be fixed, and
could be linked to one or more external variables such as commodity prices, equity indices, or foreign exchange rates. This
could result in variability in payments, including possible material loss of principal, because of adverse movements in value of
the external variables. The risk of such adverse movements in price/value is not addressed by the rating.
3. CRISIL may assign a rating of 'NM' (Not Meaningful) to instruments that have factors present in them, which render the
outstanding rating meaningless. These include reorganisation or liquidation of the issuer, the obligation being under dispute in
a court of law or before a statutory authority.
4. A prefix of 'PP-MLD' indicates that the instrument is a principal-protected market-linked debenture. The terms of such
instruments indicate that while the issuer promises to pay back the face value/principal of the instrument, the coupon rates of
these instruments will not be fixed, and could be linked to one or more external variables such as commodity prices, equity
share prices, indices, or foreign exchange rates.
5. A prefix of 'Provisional' indicates that the rating centrally factors in the completion of certain critical steps/documentation by
the issuer for the instrument, without these the rating would either have been different or not assigned ab initio.
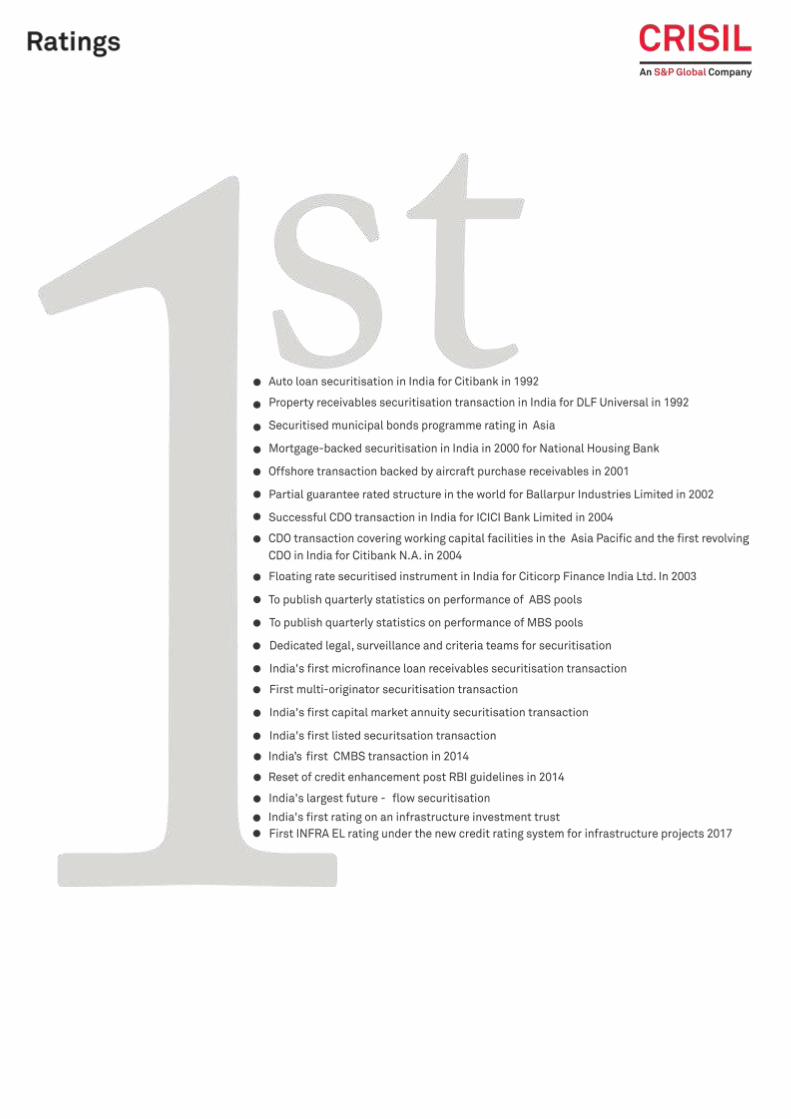
Argentina | China | Hong Kong | India | Poland | Singapore | UK | USA
CRISIL Limited: CRISIL House, Central Avenue, Hiranandani Business Park, Powai, Mumbai – 400076. India
Phone: + 91 22 3342 3000 | Fax: + 91 22 3342 3001 | www.crisil.com
About CRISIL Limited
CRISIL is a global, agile and innovative analytics company driven by its mission of making markets function better. We are India’s
foremost provider of ratings, data, research, analytics and solutions. A strong track record of growth, culture of innovation and
global footprint sets us apart. We have delivered independent opinions, actionable insights, and efficient solutions to over 100,000
customers.
We are majority owned by S&P Global Inc., a leading provider of transparent and independent ratings, benchmarks, analytics and
data to the capital and commodity markets worldwide.
About Ratings
CRISIL Ratings is part of CRISIL Limited (“CRISIL”). We pioneered the concept of credit rating in India in 1987. CRISIL is registered
in India as a credit rating agency with the Securities and Exchange Board of India (“SEBI”). With a tradition of independence,
analytical rigour and innovation, CRISIL sets the standards in the credit rating business. We rate the entire range of debt
instruments, such as, bank loans, certificates of deposit, commercial paper, non-convertible / convertible / partially convertible
bonds and debentures, perpetual bonds, bank hybrid capital instruments, asset-backed and mortgage-backed securities, partial
guarantees and other structured debt instruments. We have rated over 24,500 large and mid-scale corporates and financial
institutions. CRISIL has also instituted several innovations in India in the rating business, including rating municipal bonds, partially
guaranteed instruments and microfinance institutions. We also pioneered a globally unique rating service for Micro, Small and
Medium Enterprises (MSMEs) and significantly extended the accessibility to rating services to a wider market. Over 95,000 MSMEs
have been rated by us
CRISIL Privacy Notice
CRISIL respects your privacy. We use your contact information, such as your name, address, and email id, to fulfil your request and
service your account and to provide you with additional information from CRISIL and other parts of S&P Global Inc. and its
subsidiaries (collectively, the “Company”) you may find of interest.
For further information, or to let us know your preferences with respect to receiving marketing materials, please visit
www.crisil.com/privacy. You can view the Company's Customer Privacy at https://www.spglobal.com/privacy
Last updated: April 2016