separation of the stable isotope of sulfur 34
TRANSCRIPT
development
I
EDWARD D. NORTH AND ROBERT R. WHITE UNIVERSITY OF MICHIGAN, ANN ARBOR, MKH.
T h e ctablr bulfur isotope of mass 34 is an attractite tracer material in certain biological and physiological research. This in\ estigation undertook to obtain a supply of bul€ur 34 and to pro\ ide engineering data for a chemical exchange process for separating sulfur isotopes.
The performance of 1’4-inch Raschig rings in a column 2-inches in diameter and 63 feet high was correlated as values of height of eyuiralcnt theoretical plate plotted as a function of temperature, pressure, and flow rate. The separation factor was determined.
Increasing temperatiire up to 50” C. was shown to have a beneficial effect on the separation process. The data on unsteady state operation of the column indicate that the mass transfer resistance controlled the rate of enrich- ment of’ sulfur 34.
I RADI0ACTIT.E isotopes such as the sulfur isotope oi N O ” mass 34 studied in thiq investigation are called stable isotopes These are attractive ti acei materials in certain biological and physiological research investigations n here radioactivity may interfeie with the phenomena under study.
The ielative abundance of the stable sulfur isotopes is given in Table I
T.4BLE 1. AkBUNIIASCE O F STABLE SULFUR ISOTOPES ( 9 ) Isotope Relative Abundance
Sal 100 Sa* 0 . 7 8 S3‘ 4.40 sa€ 0 016
Because the various isotopes of an element haTve almost identi- cal chemical properties, their separation usually must depend upon sniall but measurable differences in physical properties caused by different atomic weights ( 1 , 3, 14) .
CHENICAL EXCHANGE REACTION
Equation Y represents the chemical exchange reaction studied
S3402(g) 3. HS320,(aq) $ WO2(g) -k HSs40;(aq) ( I )
The equilibrium constant for I+:quation 1 is defined in Equation
in thi? investigation:
2:
where K. is the equilibrium constant based on fugacity and f is the fugacity of the variouy components.
The value for Kf foi this reaction is greater than 1.0 at 20’ C. This means that if gaseous sulfur dioxide containing the naturally occurring abundance of the d f u r isotope of mass 34 (S34) is brought into equilibrium with a solution of sodium bisulfite con-
taining the natural abundance of sulfur 34, there will be an ex- change of SS4O2 molecules between the tR-0 phases in such a way that the eulfur 34 concentration of the solution ~vill be slightly greater than the sulfur 34 concentration in the gas. It is possible to calculate the Kf for a given chemical exchange reaction from the fundamental vibration frequencips of the molecules or ions in- volved (8, 16).
I t is convenient in analyzing the performance of the equipment ueed in applying the exchange reaction to isotope separation to define the separation factor by the equation:
where Y A is the mole fraction of component A in the vapor phase phase and ZA is the mole fraction of dissolved component A in the liquid phase. In this equation LY is defined as the relative volatility of two components, A and R, in equilibrium with each other and distributed between tTyo phases.
In the sulfur dioxide-bisulfite ion system, U A in Equation 3 i b
the mole fraction of P 4 0 3 in the vapor phase and $4 is the mole fraction of 5 3 ‘ 0 2 dissolved in the liquid phase. Y B is the molc fraction of 5 3 2 0 2 in the vapor phase, etc.
If it is assumed that the vapor phase is an ideal gas, the stand- ard state for the gas is pure gas a t one atmosphere a t constant temperature, and the standard state of the solution is infinite dilu- tion
where fo is the fugacity in standard state, atmospheres, and c 16
constant. In the absence of any data with which to evaluate the two j”’a,
it is assumed that they are numerically equal, owing to the simi- larity of the ions and their environs, and theiefore:
N = K , (a 1
PACKED COLU.MNS
The concentration difference between the gas and the solutioii is small for one equilibrium stage because of the small value of K f . A packed column containing the equivalent of many stages is par- ticularly suited to the separation of sulfur isotopes because of the scale of operation and the corrosive nature of the system. Liquid containing bisulfite ion flows down over the packing and the va- por phase containing sulfur dioxide generated from the liquid by the addition of sulfuric acid flows upward through the packing.
The concentrations at the top and bottom of a column operat- ing a t total reflux have been correlated by the vell-known Fenskr- Underwood equation :
2390
October 1951 I N D U S T R I A L A N D E N G I N E E R I N G C H E M I S T R Y
VENT TO AIR 4 A -
CONST. LEVEL BTL.
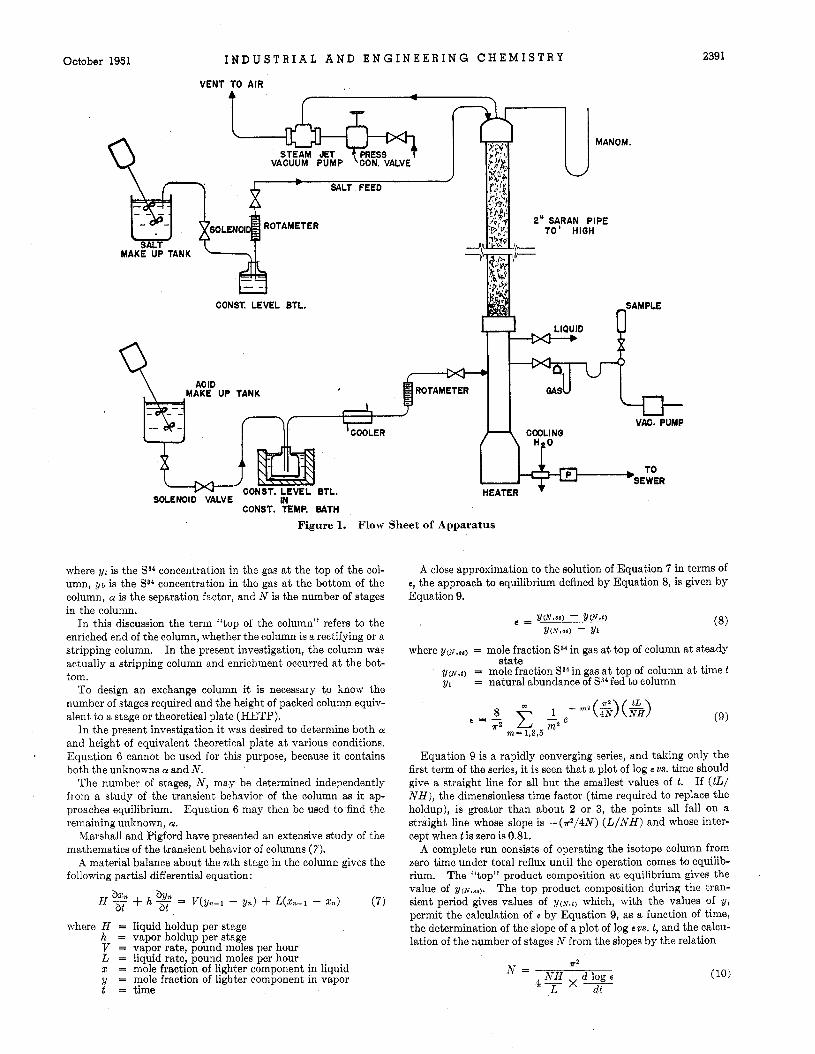
CONST. TEMP. BATH Figure 1. Flow Sheet of Apparatus
where ut is the Sa4 concentration in the gas a t the top of the col- umn, y b is the SS4 concentration in the gas a t the bottom of the column, CY is the separation factor, and N is the number of stages in the column.
In this discussion the term “top of the column” refers to the enriched end of the column, whether the column is a rectifying or a stripping column. In the present investigation, the column was actually a stripping column and enrichment occurred a t the bot- tom.
To design an exchange column it is necessary to know the number of stages required and the height of packed column equiv- alent to a stage or theoretical plate (HETP).
In the present investigation it was desired to determine both CY
and height of equivalent theoretical plate a t various conditions. Equation 6 cannot be used for this purpose, because i t contains both the unknowns CY and N .
The number of stages, N , may be determined independently from a study of the transient behavior of the column as it ap- proaches equilibrium. Equation 6 may then be used to find the remaining unknown, CY.
Marshall and Pigford have presented an extensive study of the mathematics of the transient behavior of columns (7).
A material balance about the nth stage in the column gives the following partial differential equation:
where H = liquid holdup per stage h = vapor holdup per stage V = vapor rate, pound moles per hour L = liquid rate, pound moles per hour z = mole fraction of lighter component in liquid
= mole fraction of lighter component in vapor t = time
239 1
A close approximation to the solution of Equation 7 in terms of e, the approach to equilibrium defined by Equation 8, is given by Equation 9.
where = mole fraction 5 3 4 in gas a t top of column a t steady
y ( ~ , t ) = mole fraction 534 in gas a t top of column a t time t y1 = natural abundance of S34 fed to column
state
Equation 9 is a rapidly converging series, and taking only the first term of the series, it is seen that a plot of log e us. time should give a straight line for all but the smallest values of t. If (tL/ N H ) , the dimensionless time factor (time required to replace the holdup), is greater than about 2 or 3, the points all fall on a straight line whose slope is - ( ~ 2 / 4 N ) ( L I N H ) and whose inter- cept when tis zero is 0.81.
A complete run consists of operating the isotope column from zero time under total reflux until the operation comes to equilib- rium. The “top” product composition a t equilibrium gives the value of V ( N . ~ ~ ) . The top product composition during the tran- sient period gives values of y ( ~ . ~ ) which, with the values of y, permit the calculation of e by Equation 9, as a function of time, the determination of the slope of a plot of log E us. t , and the calcu- lation of the number of stages N from the slopes by the relation
772
4- x - L dt N H d log e (10) N =
2392 I N D U S T R I A L A N D E N G I N E E R I N G C H E M I S T R Y Vol. 43, No. 10
Figure 2. Experimental Results of Runs
The value of a may then be calculated by Equation 6, and the top concentration a t equilibrium.
EQUIPMERT
The f l o ~ diagram of the appaiatus ubed in this investigation i h
The apparatus consisted basically of a packed 8horvn in Figure 1. column and its necessary auxiliaries.
The column was made of 2-inch saran pipe packed to a depth of 62 5 feet with l/d-inch porcelain Raschig rings.
The pressure in the system was maintained below atmospheric pressure by means of a ‘/*-inch hard-lead steam ejector. The pressure in the column, measured by a mercury manometer. was controlled by adjusting the pressure of the steam fed to the ejec- tor.
A neaily saturated solution of sodium eulfite (1.6 M , Mallinc- lirodt photo grade) was siphoned out of a mixing tank through a solenoid valve into a constant level bottle into the top of the col- umn through a rotameter and a manual control valve. Because of the constant pressure in the column and the constant level in the bottle, the salt feed was held a t a constant rate. It was nec- essary to remove all sharp bends in the line to prevent entrap- ment of air bubbles which formed when the pressure on the solu- tion m s reduced. The air bubbles retained a t the sharp bends increased the resistance to flow in the line.
The flow rate indicated from the calibration curve of the ro- tameter wa8 checked by observing the solution level in the salt tank during a run.
A stainless steel stripping section was clamped to the bottom of the column by means of a split ring clamp. Because of the neces- sity of heating the bottom of the stripper to boil out any remain- ing sulfur dioxide from the waste stream, and because of its com- plex construction and severely corrosive constants, it was made of Carpenter 20 stainless steel.
Autoxidation of the bisulfite ion producing sulfur and resulting in losses did not occur in the absence of air. Sulfur losses in the waste were immediately detectable by visual observation. The iuns reported in this paper had no such losses.
Liquid and vapor samples were taken from the two fittings a t the top of the stripper. The liquid sample was caught in a cup a t the top of the stripper and drawn off through a line closed with a glass stopcock into a graduated test tube. Vapor samples were removed just below the cup through a drying tube by means of a vacuum pump.
The acid feed entered the stripper below the sample lines. The strippei, was filled to just below this point with 3/s-inch porcelain Raschig rings which served to mix the acid strea,m with the down- coming sodium bisulfit,e stream. The packing was about 3 feet deep. The upper portion of the packed section of the stripper was surrounded by a Glas-Col heating element to preheat the solution going to the reboiler.
At the bottom of the stripper was a small reboiler containing 1.5 turns of l/,-inch pipe and fitted Tvith connections for the level control probes, a thermometer, and the waste line.
The probes r e r e placed in a vertical position through the use of appropriate fittings, so that the tips of the probes were opposite the centers of the lines leading from the reboiler. The original probes, made of Type 304 stainless steel, did not give satisfactory service. Type 316 stainless steel was then used, but, because of the poor service rendered, i t was replaced with tantalum, which IYBS satisfactory.
Hot Tvat,er or steam was circulated through the coil in the re- boiler to provide the necessary heat. In addition, a 400-watt disk heater was placed under the bottom of the reboiler. Practi- cally all the heat was supplied by the hot water, and the disk heater \vas kept a t a very low temperature when it was used. This pre- vented local overheating of the stainless steel, which might have induced a sensitivity to intergranular corrosion. h Tvater jacket was placed around the waste line leading to the
waste pump rrhich cooled the saturated liquid coming from the re- boiler and prevented flashing in the pump.
The waste pump was a Milton-Roy reciprocating pump with a maximum capacity of 10.5 gallons per hour. It was constructed of Carpenter 20 stainless steel and had four Hastelloy C ball check valves. The waste was pumped to the sewer.
The 2.8 ‘47 sulfuric acid was withdrawn from the bottom of the tank through a manual shut-off valve and a solenoid valve COR- trolled by the level control in the constant level bottle. The constant level bottle was immersed in a water bath maintained at 85” C. to reduce the amount of air dissolved in the acid. To pre- vent excessive corrosion the acid was cooled in a glass “condenser” before coming in contact with t,he metal in the rotameter and in the stripper.
The rotameter was used as a visual indicator and the rate was set
The acid feed was regulated by a 2-mm. bore stopcock.
1.40
I 3 6
I 3 2
I28
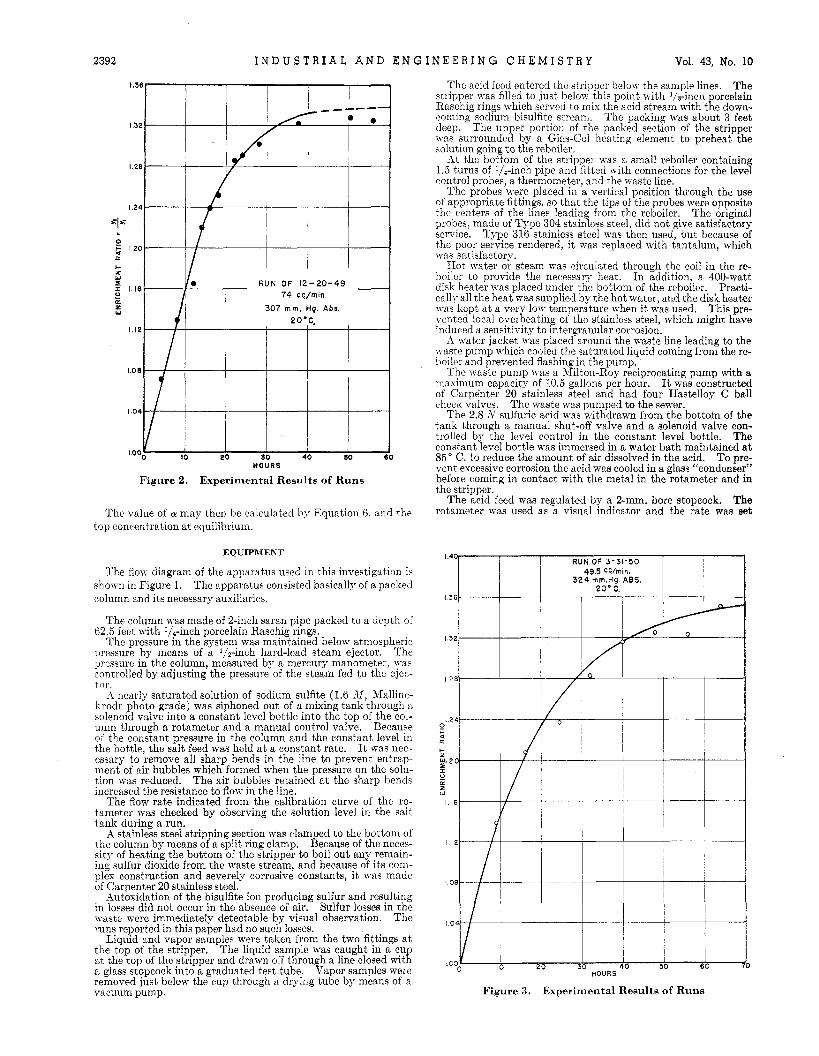
RUN OF 3-31-50 49 5 W m i n .
324 mm.Hg. ABS.
1.40
1 3 6 -
I 3 2
128-
Figure 3. Experimental Results of Runs
October 1951 I N D U S T R I A L A N D E N G I N E E R I N G C H E M I S T R Y 2393
I 3s
I 3 2
I 28
1.24
RUN OF 3-23-50 372 cc./ min. 305 mm.Hg Ab8
20 'C.
-
-
1.04
20 40 60 8 0 100 120 IO0
HOURS
Figure 4 . Experimental Results of Runs
manually. a run to ensure that a 15% excesss of acid was fed to the column.
The column was standard, black, 2- inch pipe, threaded and joined by saran couplings.
The waste solution was titrated periodically during
The column itself and all accessory lines were made of saran.
EXPERIMENTAL RESULTS
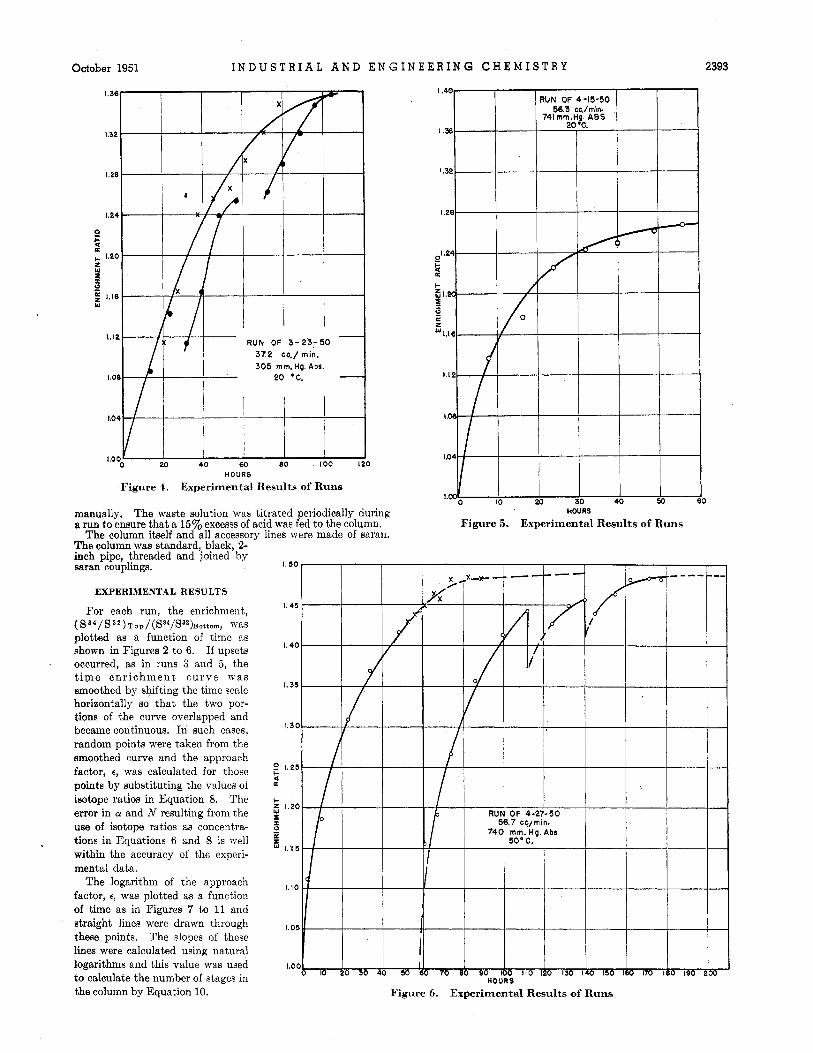
For each run, the enrichment,
plotted as a function of time as shown in Figures 2 to 6. If upsets occurred, as in runs 3 and 5 , the t i m e e n r i c h m e n t c u r v e was smoothed by shifting the time scale horizontally so that the two por- tions of the curve overlapped and became continuous. In such cases, random points were taken from the smoothed curve and the approach factor, e, was calculated for those points by substituting the values of isotope ratios in Equation 8. The error in a and N resulting from the uae of isotope ratios as concentra- tions in Equations 6 and 8 is well within the accuracy of the experi- mental data.
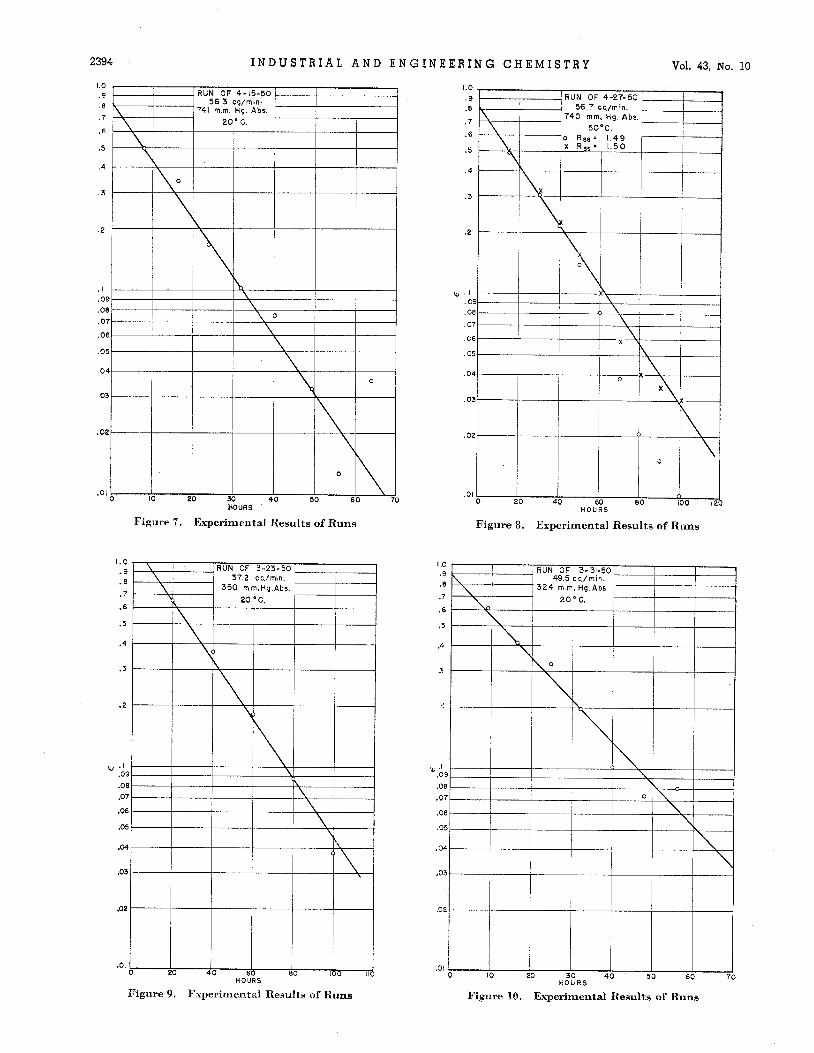
The logarithm of the approach factor, 6, was plotted as a function of time as in Figures 7 to 11 and straight lines were drawn through these points. The slopes of these lines were calculated using natural logarithms and this value was used to calculate the number of stages in the column by Equation 10.
( S a 4 / S S 2 ) T ~ p / ( S * ~ / S ~ ~ ) B o t t o r n , was
.
I. 50
I 45
I. 40
I, 35
I.3C
0 1.25 <
5 I.2C
? - p:
1.15
1.10
1.05
1.oc
HOURS
Figure 5 . Experimental Results of Runs
Figure 6. Experimental Results of Runs
2394 I N D U S T R I A L A N D E N G I N E E R I N G CHEMISTRY Vol. 43, No. 10
' 1 1 I
HOURS
Figure 7. Experimental Results of Runs
.01 I 0 20 4 0 60 eo 100 Ill
Figure 9. H O U R S
Fxperinientnl Results of Runs
I .c
f
.7
.6
.5
.4
3
2
tu .I .O'
.OI
.O'
.01
.O!
.oI
.0:
.0:
.OI
RUN OF 3-31-50
324 rn rn. Hg Abs 20°C.
, 495 cc./rnin. \
\
October
L O .9 .8 .7
.6
.5
.4
.3
2
w *I .os .O 8
1951
I I \ I I I
I R I I 1
I N D U S T R I A L A N D E N G I N E E R I N G C H E M I S T R Y
I
2395
.07 I I I I \ I I
H O U R S
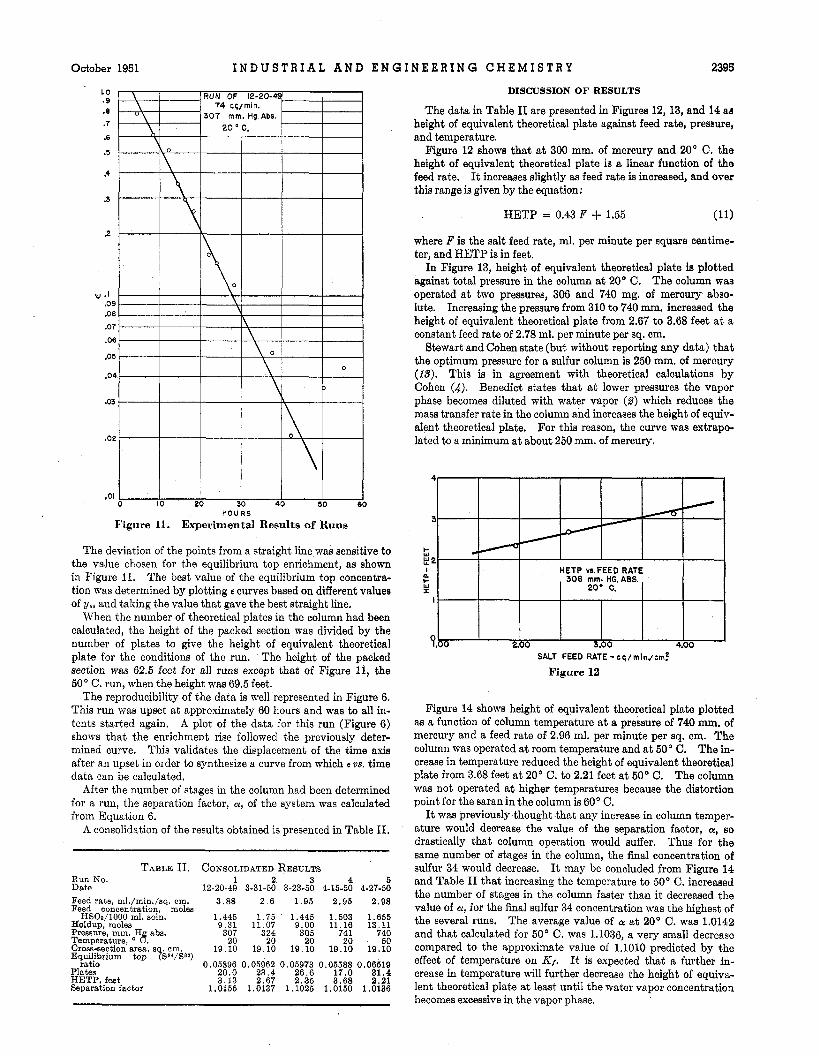
Figure 11. Experimental Results of Runs
The deviation of the points from a straight line was sensitive to the value chosen for the equilibrium top enrichment, as shown in Figure 11. The best value of the equilibrium top concentra- tion was determined by plotting E curves based on different valuee of yae and taking the value that gave the best straight line.
When the number of theoretical plates in the column had been calculated, the height of the packed section was divided by the number of plates to give the height of equivalent theoretical plate for the conditions of the run. The height of the packed section was 62.5 feet for all runs except that of Figure 11, the 50" C. run, when the height was 69.5 feet.
The reproducibility of the data is well represented in Figure 6. This run was upset a t approximately 60 hours and was to all in- tents started again. A plot of the data for this run (Figure 6) shows that the enrichment rise followed the previously deter- mined curve. This validates the displacement of the time axis after an upset in order to synthesize a curve from which E us. time data can be calculated.
After the number of stages in the column had been determined for a run, the separation factor, 01, of the system was calculated from Equation 6.
A consolidation of the results obtained is presented in Table 11.
TABLE 11. CONSOLIDATED RESULTS Run No. 1 2 3 4 5 Date 12-20-49 3-31-50 3-23-50 4-15-50 4-27-50 Feed rate ml./min./sq. om. Feed cohentration moles HSOa/1000 ml. sol&.
Holdup moles Pressur;, mm.,H abs. Temperature, 8. Cross-section area s q cm Equilibrium top' ( S a 4 / S 9
ratio Plates HETP, feet Separation factor
3.88 2.6
1.445 1.75 9.31 11.07 307 324 20 20
19.10 19.10
1.95 2.95 2.98
1.445 1.503 1.655 9.00 11.16 13.11 305 741 740 20 20 50
19.10 19.10 19.10 0.05896 0.05962 0.05973 0.05588 0.06519
20.0 23.4 26.6 17.0 31.4 3.13 2.67 2.35 3.68 2.21
1.0155 1.0137 1.1025 1.0150 1.0136
DISCUSSION OF RESULTS
The data in Table I1 are presented in Figures 12, 13, and 14 ae height of equivalent theoretical plate against feed rate, pressure, and temperature.
Figure 12 shows that at 300 mm. of mercury and 20' C. the height of equivalent theoretical plate is a linear function of the feed rate. It increases slightly as feed rate is increased, and over this range is given by the equation:
HETP = 0.43 F + 1.55 (11)
where F is the salt feed rate, ml. per minute per square centime- ter, and HETP is in feet.
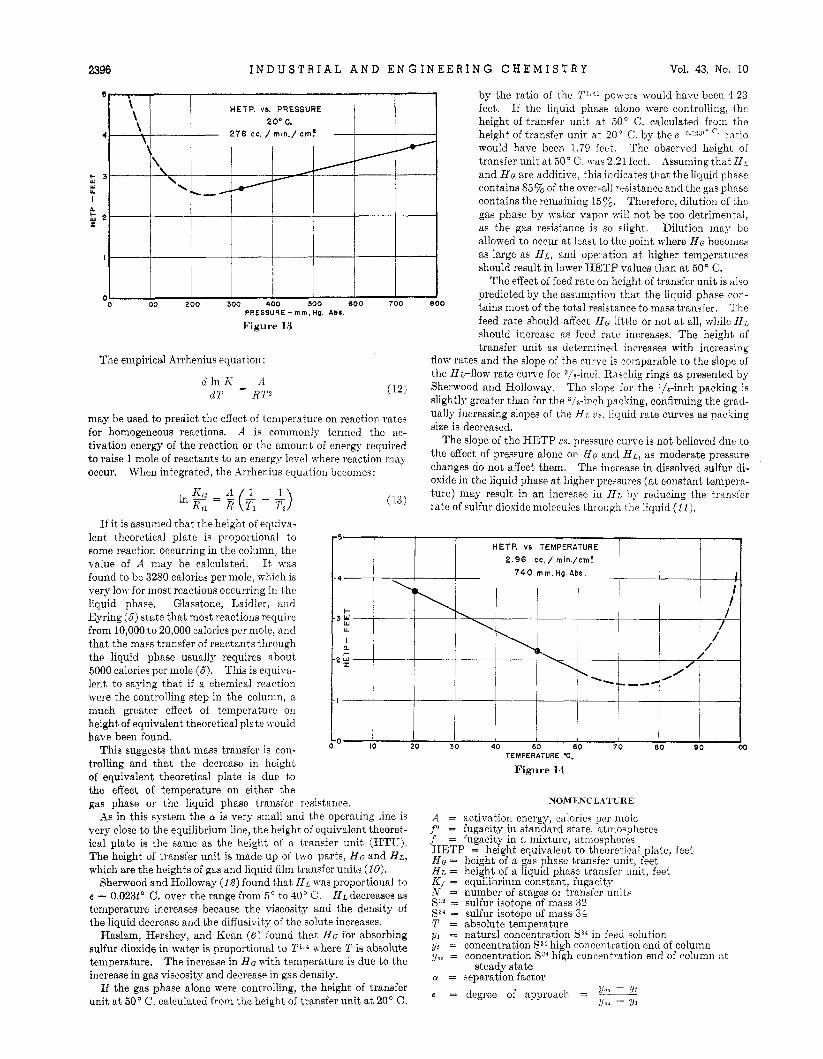
In Figure 13, height of equivalent theoretical plate is plotted against total pressure in the column at 20" C. The column waa operated at two pressurea, 306 and 740 mg. of mercury abso- lute. Increasing the pressure from 310 to 740 mm. increased the height of equivalent theoretical plate from 2.67 to 3.68 feet at a constant feed rate of 2.78 ml. per minute per sq. cm.
Stewart and &hen state (but without reporting any data) tha t the optimum pressure for a sulfur column is 250 mm. of mercury (13). This is in agreement with theoretical calculations by Cohen (4). Benedict states that at lower pressures the vapor phase becomes diluted with water vapor (8) which reduces the maw transfer rate in the column and increases the height of equiv- alent theoretical plate, For this reason, the curve was extrapo- lated to a minimum a t about 250 mm. of mercury.
3
G I HETP vs.FEED RATE a , 306 mm. HG. ABS. W 20° c. I
SALT FEED RATE-ec/mln/cm?
Figure 12
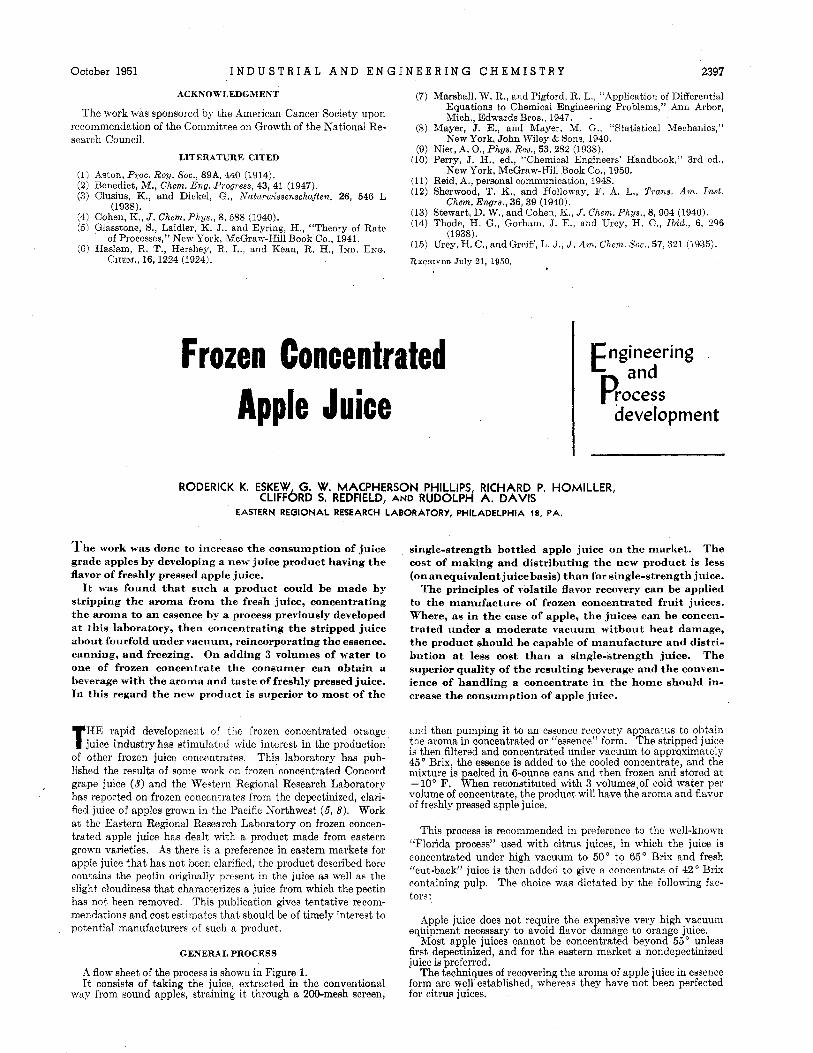
Figure 14 shows height of equivalent theoretical plate plotted as a function of column temperature at a pressure of 740 mm. of mercury and a feed rate of 2.96 ml. per minute per sq. cm. The column was operated a t room temperature and at 50" C. The in- crease in temperature reduced the height of equivalent theoretical plate from 3.68 feet a t 20" C. to 2.21 feet a t 50" C. The column was not operated at higher temperatures because the distortion point for the saran in the column is 60" C.
It was previously thought that any increase in column temper- ature would decrease the value of the separation factor, a, so drastically that column operation would suffer. Thus for the same number of stages in the column, the final concentration of sulfur 34 would decrease. It may be concluded from Figure 14 and Table I1 that increasing the temperature to 50" C. increased the number of stages in the column faster than i t decreased the value of a, for the final sulfur 34 concentration was the highest of the several runs. The average value of a a t 20" C. was 1.0142 and that calculated for 50' C. was 1.1036, a very small decrease compared to the approximate value of 1.1010 predicted by the effect of temperature on Kf. It is expected that a further in- crease in temperature will further decrease the height of equiva- lent theoretical plate a t least until the water vapor concentration becomes excessive in the vapor phase.
2396 I N D U S T R I A L A N D E N G I N E E R I N G C H E M I S T R Y Vol. 43, No. 10
4
c : w U.
I L L 2
I
<
by the ratio of the payers would have been 4.23 feet. If the liquid phase alone were controlling, the height of transfer unit at 50" C. calculated from thc height of transfer unit at 20" C. by the e-0.023t0 ratio would have been 1.79 feet. The observed height of transfer unit at 50' C. was 2.21 feet. Assuming that Hi, and H G are additive, this indicates that t,he liquid phase contains 85y0 of the over-all resistance and the gas phase contains the remaining 15%. Therefore, dilution of thc gas phase by water vapor will not be too detrimental, as the gas resistance is so slight. Dilution may be allowed to occur at least to the point where H G becomes as large as H L , and operation a t higher temperatures should result in lower HETP values than a t 50" C.
The effect of feed rate on height of transfer unit is also predicted by the assumption that the liquid phase con-
HETP. VS. PRESSURE
278 cc. / min./ c m t
I loo 2oo 300 400 6oo 700 * O 0 tains most of the total resistance to mass transfer. The PRESSURE-mm.Hg. Ab:.
Figure 13
The empirical Arrhenius equation:
may be used to predict the effect of temperature on reaction rates for homogeneous reactions. A is commonly termed the ac- tivation energy of the reaction or the amount of energy required to raise 1 mole of reactants to an energy levcl where reaction may occur. When integrated, the Arrhenius equation becomes :
feed rate should affect H G little or not a t all, while H L should increase as feed rate increases. The height of transfer unit as determined increases with increasing
flow rates and the dope of the curve is comparable to the slope of the H L - ~ ~ o w rate curve for 3/s-inch Raschig rings as present'ed by Sherwood and Holloway. The slope ior the '/(-inch packing is slightly greater than for the 3/a-inch packing, confirming the grad- ually increasing slopes of the H L us. liquid rate curves as packing size is decreaeed.
The slope of the HETP L'S. pressure curve is not believed due to the effect of pressure alone on H G and HL, as moderate pressure changes do not affect them. The increase in dissolved sulfur di- oxide in the liquid phase a t higher pressures (at constant tenipera- ture) may result in an increase in H L by reducing the transfer rate of sulfur dioxide molecules through the liquid (11).
If it is assumed that the height of equiva- lent theoretical plate is proportional to some reaction occurring in the column, the value of A may be calculated. I t was found to be 3280 calories per mole, which is very low for most reactions occurring in the liquid phase. Glasstone, Laidler, and Eyring ( 5 ) state that most reactions require from 10,000 to 20,000 calories per mole, and that the mass transfer of reactants through the liquid phase usually requires about 5000 calories per mole (5) . This is equiva- lent to saying that if a chemical reaction were the controlling step in the column, a much greater effect of temperature on height of equivalent theoretical plate would have been found.
This suggests that mass transfer is con- trolling and that the decrease in height of equivalent theoretical plate is due to the effect of temperature on either the gas phase or the liquid phase transfer resistance.
As in this syst.em the a: is very small and the operating line is very close to the equilibrium line, the height of equivalent theoret- ical plate is the same as the height of a t,ranefer unit (HTU). The height of transfer unit is made up of two parts, Ha and HL, which are the heights of gas and liquid film transfer units ( IO) .
Sherwood and Holloway ( l a ) found that H L Was proportional to e - 0.023t0 C. over the range from 5" to 40" C. H~decreases as temperature increases because the viscosity and the density of the liquid decrease and the diffusivity of the solute increases.
Haslam, Hershey, and Kean (6) found that HG for absorbing sulfur dioxide in water is proportional to P4 ivhere T is absolute temperature. The increase in HG with temperature is due to the increase in gas viscosity and decrease in gas density.
If the gas phase alone were controlling, the height of transfer unit a t 60" C. calculated from the height of transfer unit a t 20' C.
TEMPERATURE .C.
Figure 14
NOMENC L 4TUR E
A = activation energy, calories per mole fa = fugacity in standard state, atmospheres 1 = fugacity in a mixture, atmospheres HETP = height equivalent to theoretical plate, feet HG = height of a gas phase transfer unit, feet H L = height of a liquid phase transfer unit, feet Kf = equilibrium constant, fugacity N = number of stages or transfer unit? S32 = sulfur isotope of mass 32 S34 = sulfur isotope of mass 34 T = absolute temperature yl = natural concentration 534 in feed solution T/I = concentration S34 high concentration end of column ya8 = concentration S34 high concentration end of column at
01 = separation factor ? J ~ e - Vi
e = degree of approach = - ___ ys3 - 2/1
steady state
October 1951 I N D U S T R I A L A N D E N G I N E E R I N G C H E M I S T R Y 2397
ACKNOWLEDGMENT
The work was sponsored by the American Cancer Society upon recommendation of the Committee on Growth of the National Re- search Council.
LITERATURE CITED
(1) Aston, Proc. Roy. SOC., 89A, 440 (1914). (2) Benedict, M., Chem. Eng. Progress, 43, 41 (1947). (3) Clusius, K., and Diokel, G., A’aturwissenschaften, 26, 546 L
(4) Cohen, K., J . Chem. Phys., 8 , 588 (1940). ( 5 ) Glasstone, S., Laidler, K. J., and Eyring, H., “Theory of Rate
of Processes,” New York, McGraw-Hill Book Co., 1941. (6) Haalam, R. T., Hershey, R. L., and Kean, R. H., IND. ENG.
CHEM., 16,1224 (1924).
(1938).
(7) Marshall, W. R., and Pigford, R. L., “iipplication of Differential Equations to Chemical Engineering Problems,” Ann Arbor, Mich., Edwards Bros., 1947. .
(8) Mayer, J. E., and Mayer, M. G., “Statistical Mechanics,” New York, John Wiley & Sons, 1940.
(9) Nier, A. O., Phys. Rev., 53, 282 (1938). (10) Perry, J. H., ed., “Chemical Engineers’ Handbook,” 3rd ed.,
(11) Reid, A., personal communication, 1948. (12) Sherwood, T. K., and Holloway, F. A. L., Trans. Am. I n s t .
(13) Stewart, D. W., and Cohen, K., J . Chem. Phys., 8 , 904 (1940). (14) Thode, H. G., Gorham, J. E., and Urey, H. C., Ibid. , 6, 296
(1938). (15) Urey, H. C., and Greiff, L. J., J . Am. Chem. Soc., 57,321 (1935).
RECEIVED July 21, 1950.
New York, MoGraw-Hill Book Co., 1950.
Chem. Engrs., 36,39 (1940).
Frozen Concentrated Apple Juice
E ngrnyring
Process development
RODERICK K. ESKEW G. W. M A C P H E R S O N PHILLIPS R I C H A R D P. H O M I L L E R , C L I F F ~ R D s. REDFIELD, AND RUDOLP~ A. DAVIS
EASTERN REGIONAL RESEARCH LABORATORY, PHILADELPHIA 18, PA.
The work was done to increase the consumption of juice grade apples by developing a new juice product having the flavor of freshly pressed apple juice.
It was found that such a product could be made by stripping the aroma from the fresh juice, concentrating the aroma to an essence by a process previously developed at this laboratory, then concentrating the stripped juice about fourfold under vacuum, reincorporating the essence, canning, and freezing. On adding 3 volumes of water to one of frozen concentrate the consumer can obtain a beverage with the aroma and taste of freshly pressed juice. In this regard the new product is superior to most of the
HE rapid development of thc frozen concentrated orange T juice industry has stimulatcd wide interest in the production of other frozen juice concentrates. This laboratory has pub- lished the results of some work on frozen concentrated Concord grape juice ( 3 ) and the Western Regional Research Laboratory has reported on frozen concentrates from the depectinized, clari- fied juice of apples grown in the Pacific Northwest (6, 8). Work a t the Eastern Regional Research Laboratory on frozen concen- trated apple juice has dealt with a product made from eastern g r o m varieties. As there is a preference in eastern marbe& for apple juice that has not been clarified, the product described here contains the pectin originally present in the juice as well as the slight cloudiness that characterizes a juice from which the pectin has not been removed. This publication gives tentative recom- mendations and cost estimates that should be of timely interest to potential manufacturers of such a product.
GENERAL PROCESS
A flow sheet of the process is shown in Figure 1. It consists of taking the juice, extracted in the conventional
way from sound apples, straining i t through a 200-mesh screen,
single-strength bottled apple juice on the market. The cost of making and distributing the new product is less (on anequivalentjuicebasis) than for single-strength juice.
The principles of volatile flavor recovery can be applied to the manufacture of frozen concentrated fruit juices. Where, as in the case of apple, the juices can be concen- trated under a moderate vacuum without heat damage, the product should be capable of manufacture and distri- bution at less cost than a single-strength juice. The superior quality of the resulting beverage and the conven- ience of handling a concentrate in the home should in- crease the consumption of apple juice.
and then pumping it to an essence recovery apparatus to obtain the aroma in concentrated or “essence” form. The stripped juice is then filtered and concentrated under vacuum to approximately 45’ Brix, the essence is added to the cooled concentrate, and the mixture is packed in 6-ounce cans and then frozen and stored at -10” F. When reconstituted with 3 volumes,of cold water per volume of concentrate, the product will have the aroma and flavor of freshly pressed apple juice.
This process is recommended in preference to the well-known “Florida procees” used with citrus juices, in which the juice is concentrated under high vacuum to 50” to 65” Brix and fresh “cut-back” juice is then added to give a concentrate of 42’ Brix containing pulp. The choice was dictated by the following fac- tors:
Apple juice does not require the expensive very high vacuum eqhipment necessary to avoid flavor damage to orange juice.
Most apple juices cannot be concentrated beyond 55“ unless first depectinized, and for the eastern market a nondepectinized juice is preferred.
The techniques of recovering the aroma of apple juice in essence form are well established, whereas they have not been perfected for citrus juices.