separation and quantification of 15 carotenoids by reversed phase high performance liquid...
TRANSCRIPT

Spw
Ka
b
a
ARRAA
KCROI
1
opdvpcSeis
I
0d
Journal of Chromatography A, 1233 (2012) 44– 53
Contents lists available at SciVerse ScienceDirect
Journal of Chromatography A
j our na l ho me p ag e: www.elsev ier .com/ locate /chroma
eparation and quantification of 15 carotenoids by reversed phase higherformance liquid chromatography coupled to diode array detectionith isosbestic wavelength approach
amila Mitrowskaa,1, Ursula Vincentb,∗, Christoph von Holstb
National Veterinary Research Institute, Department of Pharmacology and Toxicology, al. Partyzantow 57, 24-100 Pulawy, PolandEuropean Commission, Joint Research Centre, Institute for Reference Materials and Measurements (EC-JRC-IRMM), Retieseweg 111, B-2440 Geel, Belgium
r t i c l e i n f o
rticle history:eceived 16 September 2011eceived in revised form 7 January 2012ccepted 30 January 2012vailable online 7 February 2012
eywords:arotenoidseverse phase liquid chromatographyptimisation
sosbestic concept
a b s t r a c t
The manuscript presents the development of a new reverse phase high performance liquid chromatog-raphy (RP-HPLC) photo diode array detection method allowing the separation and quantification of 15carotenoids (adonirubin, adonixanthin, astaxanthin, astaxanthin dimethyl disuccinate, asteroidenone,beta-apo-8′-carotenal, beta-apo-8′-carotenoic acid ethyl ester, beta-carotene, canthaxanthin, capsan-thin, citranaxanthin, echinenone, lutein, lycopene, and zeaxanthin), 10 of which are feed additivesauthorised within the European Union. The developed method allows for the reliable determinationof the total carotenoid content in one run using the corresponding E-isomer as calibration standardwhile taking into account the E/Z-isomers composition. This is a key criterion for the application of themethod, since for most of the analytes included in this study analytical standards are only available forthe E-isomers. This goal was achieved by applying the isosbestic concept, in order to identify specificwavelengths, at which the absorption coefficients are identical for all stereoisomers concerned. The sec-
ond target referred to the optimisation of the LC conditions. By means of an experimental design, anoptimised RP-HPLC method was developed allowing for a sufficient chromatographic separation of allcarotenoids. The selected method uses a Suplex pKb-100 HPLC column and applying a gradient witha mixture of acetonitrile, tert-butyl-methyl ether and water as mobile phases. The limits of detectionand limits of quantification ranged from 0.06 mg L−1 to 0.14 mg L−1 and from 0.20 mg L−1 to 0.48 mg L−1,respectively.© 2012 Elsevier B.V. All rights reserved.
. Introduction
Carotenoids are a class of hydrocarbons (carotenes) and theirxygenated derivatives (xanthophylls) consisting of eight iso-rene building blocks. Because of the numerous conjugatedouble bonds and the cyclic end groups, carotenoids present aariety of stereoisomers with different chemical and physicalroperties. The most important forms commonly found amongarotenoids are stereoisomers abbreviated as E- or Z-isomers.tereoisomers of this type are interconvertible in solution and
xert a marked influence on the physical properties. E- and Z-somers do not only differ in their melting points, solubility andtability, but also in respect to absorption affinity, colour and∗ Corresponding author. Tel.: +32 14 57 12 07; fax: +32 14 57 17 87.E-mail address: [email protected] (U. Vincent).
1 Present/permanent address: Reference Materials and Measurements (EC-JRC-RMM), Retieseweg 111, B-2440 Geel, Belgium.
021-9673/$ – see front matter © 2012 Elsevier B.V. All rights reserved.oi:10.1016/j.chroma.2012.01.089
colour intensity [1]. Also the ultraviolet/visible (UV/Vis) spec-tra of the E/Z-isomers show significant differences, for instancethe appearance of a new absorbance band in the spectra of theZ-isomers compared to the corresponding E-isomers [2].
Apart from the nutritional importance in human and animalhealth as metabolic precursors of vitamin A and antioxidants,carotenoids are used for the direct colouring of foodstuff aswell as for pigmentation of animal products via their addi-tion to complete feedingstuffs. In this study we included 15carotenoids (Fig. 1), namely adonirubin, adonixanthin, asteroide-none, echinenone, lycopene and the feed additives astaxanthin,astaxanthin dimethyl disuccinate, beta-apo-8′-carotenal, beta-apo-8′-carotenoic acid ethyl ester, beta-carotene, canthaxanthin,capsanthin, citranaxanthin, lutein, and zeaxanthin. The feed addi-tives are authorised within the European Union under Regulation
(EC) No 1831/2003 classified in the category “sensory additives”and functional group “colourants: substances which, when fed toanimals, add colours to food of animal origin” [3]. For instance,astaxanthin and canthaxanthin are added to salmon and trout feed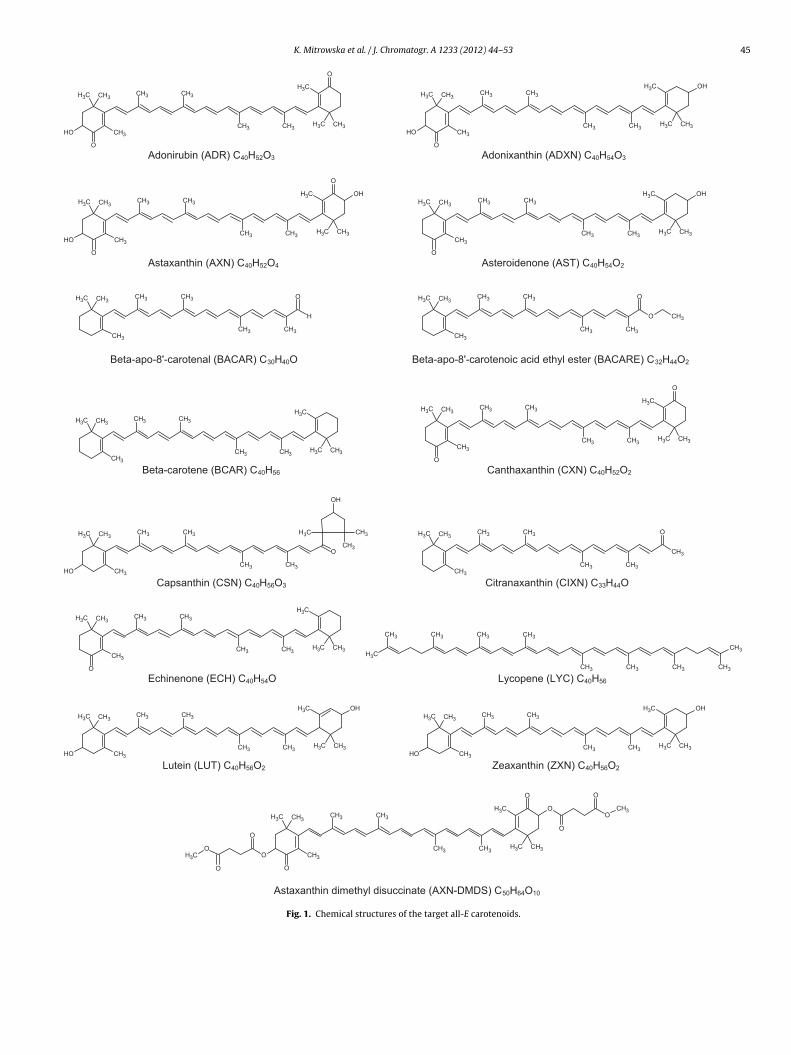
K. Mitrowska et al. / J. Chromatogr. A 1233 (2012) 44– 53 45
Fig. 1. Chemical structures of the target all-E carotenoids.
4 omato
fisiima
ftofnwoii
tmscdowcip
saZartooIwb(b[iaocbwiti
tdoiinmx
tEms
6 K. Mitrowska et al. / J. Chr
or flesh colouration, whereas lutein is widely used in poultry farm-ng for egg yolk coloration [4]. In addition, authorisation of theseubstances includes target concentration limits in complete feed-ngstuffs as specified in respective Commission Regulations. Fornstance, astaxanthin dimethyl disuccinate is authorised by Com-
ission Regulation (EC) No 393/2008 for salmon and trout [5], with maximum level of this compound in feed at 138 mg kg−1.
In order to carry out official controls to check compliance witheed and food law, animal health and animal welfare rules (Regula-ion (EC) No 882/2004), improved methods of quantitative analysisf carotenoids are required [6]. In particular there is a strong needor multianalyte methods allowing for the simultaneous determi-ation of the different carotenoids. Since legal limits of carotenoidshen utilised as feed additives are expressed in terms of the sum
f the Z-and all-E-forms, analytical methods that are fit for thentended purpose need to address the presence of the various E/Z-somers of the target carotenoid.
Many procedures have been described for the quantita-ive analysis of carotenoids in a wide range of carotenoids
ixtures and extracts [7–23]. They are mainly based on thepectrophotometric [7–20] or mass spectrometry analysis [21]ombined with high performance liquid chromatography. Theifferent methods are generally designed to meet differentbjectives. Some provide a rapid single-analyte method [7–9],hereas others are more complex procedures which give a
omplete profile of the carotenoids present [11–16,21–23], includ-ng separation of stereoisomers with [19,20] or without opticalroperties [8,10,17–19].
Quantitative analysis depends on the availability of carotenoidtandards including the various isomers. However, not all isomersre available, which especially applies to the Z-isomer. Moreover,- and all-E-forms do not have the same absorption coefficientnd these absorption coefficients are often not tabulated, thusendering the measurement of carotenoids extremely difficult. Fur-hermore, calibration of different isomers against the stable andften available all-E-isomers leads in general to an underestimationf the total content of the different isomers of a specific carotenoid.n order to cope with the lack of all required standard substances,
e applied the isosbestic concept, which has been previously usedy Lessin for quantification of E- and Z-isomers of three carotenoidsalpha-carotene, beta-carotene and beta-cryptoxanthin) [10] andy Schierle for spectrophotometric determination of beta-carotene7]. This concept is based on the principle that a specific wavelengths selected for the measurement, where the absorption coefficientsre identical for all stereoisomers, thus allowing the determinationf the total carotenoid content independently of the E/Z-isomersomposition against the corresponding all-E-form. The only draw-ack of this method is its lower sensitivity, since the wavelengthith the highest absorption coefficient is often different from the
sosbestic wavelength. However, this is not a major problem, sincehe legal limits of carotenoids in target matrices in complete feed-ngstuffs are most often at relatively high level (above 50 mg kg−1).
The research presented in this paper had two goals, namely (1)he development of a reverse phase liquid chromatography withiode array detection (RP-HPLC-DAD) allowing for the separationf all 15 carotenoids included in this study and (2) establishing thesosbestic wavelengths for the individual carotenoids, thus facil-tating their quantification. To our knowledge, to date, there areo published methods enabling separation and quantification of asany as 15 different carotenoids belonging to both carotenes and
anthophylls in one run.Since the isosbestic concept when applied to the determina-
ion of feed additives focuses on the quantification of the sum of/Z-isomers, the optimisation of LC conditions allowing for a chro-atographic separation of these isomers was not a target of this
tudy.
gr. A 1233 (2012) 44– 53
2. Experimental
2.1. Reagents and solvents
All chemicals and solvents used were of analytical grade andsuitable for HPLC. The selected carotenoids are shown in Fig. 1and were all-E-isomers. Adonirubin (ADR) 95.0%, adonixanthin(ADXN) 98.0%, asteroidenone (AST) 98.0%, echinenone (ECH) 98.0%were purchased at CaroteNature GmbH (Lupsingen, Switzerland).Astaxanthin (AXN) ≥ 98.5%, canthaxanthin (CXN) 94.0%, beta-apo-8′-carotenal (BACAR) > 96.0%, beta-carotene (BCAR) 95.0%,lycopene (LYC) ≥ 97.0% were obtained from Sigma–Aldrich (St.Louis, MO, USA). Lutein (LUT), zeaxanthin (ZXN) were providedby Applichem Lifescience (Darmstadt, Germany). Astaxanthindimethyl disuccinate (AXN-DMDS), beta-apo-8′-carotenoic acidethyl ester (BACARE), capsanthin (CSN), and citranaxanthin (CIXN)were kindly provided by DSM Nutritional Products Ltd (Kaiseraugst,Switzerland).
Acetonitrile (ACN), ethanol (EtOH), methanol (MeOH), and tert-butyl-methyl ether (tBME) 99% were of LC gradient grade (VWR,Lutterworth, England) whereas tetrahydrofuran 99% stabilisedwith 250–350 ppm butylated hydroxytoluene (THF with BHT) wasobtained from Alfa Aesar GmbH & Co KG (Karlsruhe, Germany). Purewater (H2O) 18.2 M� cm−1 quality was obtained from a Milli-QIntegral 5 System (Millipore, Molsheim, France).
2.2. Standard solutions
Stock solutions for ADR, ADXN, AXN, AXN-DMDS, AST, BACAR,BACARE, BCAR, CXN, CSN, CIXN, ECH, LUT, LYC and ZXN at approx-imately 1 mg mL−1 were prepared in THF with BHT.
Using the respective absorption coefficients A (1%, 1 cm) theexact concentrations of the individual stock solutions were deter-mined spectrophotometrically after dilution in suitable solvents.Next the individual working solutions of each carotenoid preparedin ACN at the concentration of approx. 10 mg L−1 were injected inthe HPLC system for purity check (purity based on the peak areaof the individual carotenoid to the sum of all chromatogram peakareas ratio) and the absorbance of the solutions was corrected forthe impurities.
A first mixture working solution consisted of a dilution of eachindividual stock solution at 50 mg L−1 in ACN. The second mixtureworking solution was obtained from the first solution by dilution inACN at the concentration of 5 mg L−1. All these working solutionswere prepared in amber glass and kept at −30 ◦C when not in use.
2.3. HPLC conditions for the separation of 15 all-E-carotenoids
All chromatographic measurements were performed using aHPLC Shimadzu system CLASS-VP (Shimadzu, Duisburg, Germany)equipped with a quaternary pump, a degasser, an autosamplerand a column heater, and coupled to a diode array detector. TheHPLC solution version 1.23 SP1 software controlled the HPLC-DADsystem and processed the data. The best HPLC separation of the all-E-carotenoids after optimisation as specified in Section 3.1.2 wasachieved on a Suplex pKb-100 column, 5 �m, 250 mm × 4.6 mm ingradient mode. The mobile phase A containing ACN, tBME and H2O(696:200:104; v:v:v) and the mobile phase B containing ACN andtBME (700:300; v:v) were used to employ the following gradientelution: 100% of the mobile phase A was held for 10 min, decreasedto 40% at 14 min and held for 14 min. From 28 to 45 min the systemwas re-equilibrated with the initial composition of the mobile
phase A (100%). The flow rate of the mobile phase was 0.5 mL min−1.The column temperature was 20 ◦C and the sample temperaturewas kept at 4 ◦C by means of the thermostated HPLC autosampler.The injection volume in the HPLC system was 5 �L for all the
omatogr. A 1233 (2012) 44– 53 47
st
3
ofiatc
3
3
pcsSatoCpvtctmvsmtmactowas
t
TRietc
K. Mitrowska et al. / J. Chr
amples injected. The UV/Vis spectra of all peaks were recordedhrough the diode array detector in the range from 190 to 700 nm.
. Results and discussion
Since the absorption coefficients of the target analytes dependn the medium in which they are solved, the study consistedrst of the optimisation of the chromatographic separation of 15ll-E-carotenoids in a standard solution. Secondly the concept ofhe isosbestic approach to allow reliable quantification of all 15arotenoids was developed.
.1. Determination of appropriate HPLC conditions
.1.1. Initial optimisation of HPLC conditionsFor the selection of the HPLC column and also for the mobile
hase, as a starting point systems from literature have beenhosen [7–23]. Several reverse phase columns (Lichrospher RPelect B, Zorbax RX-C8, Ascentis RP-Amide, YMC Carotenoid C 30,uplex pKb-100) were tested through a traditional and sequentialpproach with different combinations of solvents, namely acetoni-rile, methanol, tert-butyl-methyl ether and water in order to findptimal HPLC conditions for the separation of the carotenoids.ompared to the other phases examined in this work the SuplexKb-100 with a mixture of ACN, tBME and H2O (700:200:100;:v:v) provided the best separation, and was thus chosen forhis study. The Suplex pKb-100 is a column commonly used forarotenoid analyses and is known to exhibit enhanced shape selec-ivity useful for separation of compounds with rigid, well-defined
olecular shape such as carotenoids [8,18]. The maximum injectedolume was set at 10 �L, since larger volumes made the peakhape wider and asymmetrical. Then three Suplex pKb-100 chro-atographic columns with different internal diameters (IDs) were
ested: 4.6 mm, 3.0 mm and 2.1 mm. It was found that the chro-atographic columns having smaller IDs than 4.6 mm (3.0 mm
nd 2.1 mm) turned out to be unsuitable to separate 15 all-E-arotenoids. Moreover chromatographic conditions were not easilyransferred from the column of 4.6 mm ID to the one of 3.0 mm IDr 2.1 mm ID. The influence of column temperature and flow rateas also examined. Applying a lower flow rate and performing the
nalysis at lower temperature resulted in better chromatographiceparation.
Besides the selection of the specific stationary phase andhe other chromatographic conditions, a HPLC gradient elution
able 1uggedness test 1: The experimental design and the results of analysis expressed
n terms of the chromatographic response function (CRF) as defined in the text. Thexperimental design was based on the initial optimised conditions of phase A: ACN,BME and H2O (700:200:100; v:v:v). High values of the CRF stand for improvedhromatographic conditions.
Trial number Replication H2O (mL) tBME (mL) ACN (mL) CRF
1 1 96 196 708 36.171 2 96 196 708 37.302 1 96 204 692 41.122 2 96 204 692 40.563 1 96 196 692 40.723 2 96 196 692 40.404 1 96 204 708 40.084 2 96 204 708 40.015 1 104 196 708 40.985 2 104 196 708 41.026 1 104 204 692 40.776 2 104 204 692 41.277 1 104 196 692 41.277 2 104 196 692 41.168 1 104 204 708 41.438 2 104 204 708 41.29
Fig. 2. Standardised effects of factors and interactions on the chromatographic per-formance including the significance level (vertical line) at ̨ = 0.05 for (a) ruggednesstest 1, (b) ruggedness test 2 and (c) ruggedness test 3. Interactions of specific factorsare indicated by the corresponding numbers. For instance “2by3” means that thereis an interaction between TBME and water on the chromatographic performance.Only factors that exceed the line have a significant influence on the chromatogra-phy. The LC conditions of ruggedness 3 were considered more robust compared tothe conditions of the other ruggedness tests, since the number of factors exceedingthe vertical line was much less.

48 K. Mitrowska et al. / J. Chromatogr. A 1233 (2012) 44– 53
Table 2Ruggedness test 2. The experimental design was based on the results from rugged-ness test 1 indicating that at the initial optimised conditions small variation had astrong influence on CRF. Description as in caption of Table 1.
Trial number Replication H2O (mL) ACN (mL) CRF
1 1 104 668 40.301 2 104 668 40.632 1 104 692 40.992 2 104 692 41.103 1 120 668 37.493 2 120 668 38.044 1 120 692 39.90
(otefemdspA
3
atnoafe
C
wnc“ot“g
Table 3Ruggedness test 3. The experimental design was based on the following condi-tions that have been slightly modified based on the results from ruggedness test2.: ACN:tBME:H2O; 696:200:104; v:v:v. Description as in caption of Table 2.
Trial number Replication H2O (mL) tBME (mL) ACN (mL) CRF
1 1 102 196 686 40.811 2 102 196 686 40.602 1 102 204 706 41.312 2 102 204 706 40.923 1 102 196 706 41.143 2 102 196 706 41.054 1 102 204 686 41.454 2 102 204 686 41.235 1 106 196 686 41.235 2 106 196 686 41.006 1 106 204 706 40.976 2 106 204 706 40.947 1 106 196 706 41.087 2 106 196 706 40.91
Fmfl1
4 2 120 692 39.655 1 112 680 39.795 2 112 680 40.10
described in Section 2.3) was chosen increasing the concentrationf the organic solvent in order to minimise the retention time ofhe most retained carotenoids (LYC and BCAR) within the short-st total analysis time. Thus the total analysis time was shortenedrom 60 min in isocratic mode to 45 min in gradient mode. Whenstablishing best HPLC conditions we also applied the simplex opti-isation procedure [24], starting with the parameter combinations
escribed here. However, even after 14 trials the starting conditionstill turned out to be the best one. Therefore we stopped here androceeded with the ruggedness test of mobile phase A (mixture ofCN, tBME and H2O (700:200:100; v:v:v)).
.1.2. Ruggedness tests of the HPLC separationIn order to establish the robustness of the chromatographic sep-
ration of the target all-E-15 carotenoids against small variation ofhe composition of the mobile phase, we conducted three rugged-ess tests. The tests are based on the principle that small variationsf the composition of mobile phase A are introduced on purposend the effect of these variations on the chromatographic responseunction (CRF) [25] which was calculated according the followingquation:
RF =p−1∑
i=1
Ri + aP + b(tM − tL)
here Ri is the resolution between adjacent peak pairs, P is theumber of peaks detected, tM is the target retention time (in thisase 30 min), tL is the retention time for the last peak, and “a” andb” are two arbitrary weighting factors. In order to adjust the value
f CRF to the visual inspection of the chromatograms thus to makehe difference between CRF values more significant the values fora” and “b” were set a 1 and 0.3, respectively. Better chromato-raphic conditions are indicated by higher values for CRF indicating0.0 5.0 10.0 15.0 20.0
0
1
2
3
4
mAU
1
2 3
4
56
78
9
ig. 3. HPLC separation of 15 all-E carotenoids (0.5 mg L−1 in ACN); column: Suplex pKb-1obile phase B: ACN:tBME (700:300; v:v); the isocratic conditions: 0–10 min: 100% A; t
ow rate: 0.5 mL min−1; column temperature: 20 ◦C; �: 410 nm; identification: 1 – AXN-D0 – BACARE, 11 – LUT, 12 – ZXN, 13 – ECH, 14 – LYC, and 15 – BCAR.
8 1 106 204 686 41.398 2 106 204 686 41.23
(1) sufficient separation of adjacent peaks and (2) an acceptableretention time for the last eluting peak. The small variations areimplemented by adjusting the variables at two different levels –specified as high and low – and performing HPLC measurementsaccordingly. In order to measure the effect of the small variation ofa specific variable on CRF, the average of the values for CRF obtainedfrom the experiments at the high and low level is calculated respec-tively. The difference of both average values is then the effect ofthis specific variable on CRF. The set up of the experimental designand the statistical assessment was done with the software packageStatistica®, Version 10 (StatSoft, Tulsa, OK, USA).
In ruggedness test 1 we selected three variables defining thecomposition of the mobile phase, which were the volumes ofACN, tBME and H2O and introduced variations of each vari-able at two levels into the preparation of the mobile phase. Forinstance, for the variable ACN one set of experiments was con-ducted using 692 mL for the preparation of the mobile phase,whereas the second set of experiments was done with 708 mLof ACN. Eight trials of the various combinations of the variablevariations were conducted in duplicates (Table 1), in order to esti-mate the analytical error, against which the significance of thecalculated effects and interactions was checked. The results of thestatistical assessment as shown in Fig. 2a indicated that CRF wassignificantly influenced by water, followed by ACN, whereas tBME
turned out to be less important. We also observed significant inter-actions between the factors. For instance, the influence of the watercontent on the CRL function was much higher, when the concentra-tion of tBME was at the high level. The sign of the factors (Fig. 2a)25.0 30.0 35.0 40.0 min
10
11
12
13
14 15
00, 5 �m, 250 mm × 4.6 mm; mobile phase A: ACN:tBME:H2O (696:200:104; v:v:v);he gradient: 10–14 min gradient 100–40% A, 14–28 min 40% A, 28–45 min 100% A;
MDS, 2 – AXN, 3 – ADR, 4 – CXN, 5 – CSN, 6 – ADXN, 7 – BACAR, 8 – AST, 9 – CIXN,

K. Mitrowska et al. / J. Chromato
(a)
(b)
0.0 2.5 5.0 7.5 10.0 12.5 min
0
25
50
mAU 476nm4nm ( 1.00)
all-E-A XN
0.0 2.5 5.0 7.5 10.0 12.5 min
0
25
mAU
all-E-AXN
9-Z-AXN
13-Z-AXN
Fig. 4. HPLC separation of AXN isomers (a) before incubation – only all-E-AXN iso-mRv
rwltc(CAa(mtirceatgst
wl
Fc6v
er and (b) after incubation – a mixture of all-E and Z isomers; column: AscentisP Amide, 5 �m, 250 mm × 2.1 mm; mobile phase: ACN:tBME:H2O, 600:200:200;:v:v; flow rate: 0.2 mL min−1; column temperature: 30 ◦C.
evealed that better chromatographic conditions were observed,hen the water and ACN content was high and the tBME was
ow. The result of the statistical assessment is also reflected inhe visual presentation of the chromatograms. For example, in thehromatogram corresponding to combination 1 (ACN:tBME:H2O708:196:96; v:v:v), Table 1) delivering the worst mean value forRF (36.17) we could see the co-elution of ADXN with BACAR andST with CIXN. The HPLC separation of 15 carotenoids obtainedpplying the composition of the mobile phase A in combination 8ACN:tBME:H2O (708:204:104; v:v:v), Table 1) gave the best opti-
ised HPLC separation of all compounds (CRF 41.43). Nevertheless,he large variation of the chromatographic separation obtainedn the experiments strongly indicated that the method was notobust enough, thus indicating that we had not found yet optimalhromatographic conditions. Therefore we conducted additionalxperiments to establish better HPLC conditions at which the sep-ration power was still high and the effect of small variations ofhe composition of the mobile phase on the separation of the tar-et analysed was minimised. This optimisation was pursued by aecond factorial design, making use of the results from ruggedness
est 1.The experimental design only included two factors namely (1)ater adjusted at higher concentrations and (2) ACN adjusted at
ower concentrations. The content of tBME was kept constant, since
(a)
min2.50.1
0
5
10
15
mAU λmax = 480 nm
ig. 5. Chromatograms of the three stereoisomers of AXA that were coeluting at the Lhromatograms in (a) refer to measurements at �max: 480 nm and (b) �iso: 410 nm; co00:200:200; v:v:v; flow rate: 2 mL min−1; column temperature: 20 ◦C. (For interpretatioersion of the article.)
gr. A 1233 (2012) 44– 53 49
ruggedness test 1 indicated that the effect of this factor was minor.Furthermore, the remaining two factors were tested at three lev-els in order to check whether the optimal conditions were alreadywithin the variation realised by the experiments of this test. Theexperimental design and the results are shown in Table 2. Thestatistical evaluation (Fig. 2b) revealed that water had the mostsignificant impact on the separation of the target analyte, but –in contrast to ruggedness test 1 – the best result was observedwhen the water content was at the low level (104 mL) and the worstresult was observed when the water content was at the high level(120 mL). Furthermore, no significant curve linear effect could beobserved in this range. However, the pooled data from ruggednesstests 1 and 2 indicated that the CRF value passes a maximum at awater content of about 104 mL, whereas a lower CRF values wereobtained at 112 and 96 mL, respectively. Likewise for ACN, optimalconditions were observed at 692 mL and lower CRF values wereobtained for 668 and 708 mL, respectively. Based on these resultsthe initial conditions as established in Section 3.1.1 were slightlymodified and the following optimal composition of mobile phase Awas established: ACN:tBME:H2O; 696:200:104; v:v:v.
The objective of the third ruggedness test was to check theimpact of small variations of the optimal conditions establishedin ruggedness test 2 on the CRF value. All three components wereincluded in the study, each of them varied at two levels, resultingin 8 experiments performed in duplicates. The experimental designand the results are shown in Table 3. The results of the statisticalassessment as presented in Fig. 2c indicate that most of the factorsdid not have a significant influence on the CRF value, whereas asignificant but very small effect was observed for tBME. Therefore,the selected conditions (ACN:tBME:H2O; 696:200:104; v:v:v) areconsidered as robust enough for the intended purpose. This is alsoconfirmed by visual inspection of the 16 chromatograms obtainedin this exercise, since in all cases a sufficient separation of the targetanalytes was obtained.
The best conditions in terms of retention times, peak shapes,repeatability of the signal and highest possible signal to noise ratioare detailed in Section 2.3. The separation of the target 15 all-E-carotenoids obtained at the selected conditions is presented inFig. 3.
3.2. Optimisation of the DAD quantification
The identification of isosbestic wavelengths included two steps,namely (1) the formation of Z-isomers from the corresponding all-E-isomers by conducting experiments under defined conditions(incubation) and (2) measuring the absorption characteristics of
(b)
0
5
10
15
mAU λiso = 410 nm
---- AXN befor e inc uba tion
---- AXN af ter incub ation
min2.50.1
C conditions selected, before (black line) and after the incubation (red line). Thelumn: Suplex pKb-100, 5 �m, 250 mm × 4.6 mm; mobile phase: ACN:tBME:H2O;n of the references to color in this figure legend, the reader is referred to the web

50 K. Mitrowska et al. / J. Chromatogr. A 1233 (2012) 44– 53
Table 4The measured wavelengths for the different carotenoids at maximum absorbance (�max), at isosbestic point (�iso) and at chosen common wavelength for all carotenoids(�com); (a) the difference of the absorbances before and after incubation at specific � and (b) the corresponding sensitivities of the measurement conducted at specific �expressed as relative absorbance compared to the absorbance at �max.
Carotenoid Differencea atspecific � (%)
Sensitivityb atspecific � (%)
�max 480 nm 18 100AXN-DMDS �iso 410 nm 0 29
�com 410 nm 0 29
�max 480 nm 16 100AXN �iso 410 nm 2 31
�com 410 nm 2 31
�max 480 nm 25 100ADR �iso 405 nm 1 25
�com 410 nm 5 30
�max 475 nm 20 100CXN �iso 410 nm 2 31
�com 410 nm 2 31
�max 475 nm 23 100CSN �iso 385 nm 1 14
�com 410 nm 9 32
�max 465 nm 19 100ADXN �iso 400 nm 2 26
�com 410 nm 4 36
�max 460 nm 10 100BACAR �iso 385 nm 1 20
�com 410 nm 5 46
�max 460 nm 19 100AST �iso 390 nm 1 19
�com 410 nm 8 38
�max 470 nm 25 100CIXN �iso 385 nm 1 14
�com 410 nm 13 33
�max 445 nm 13 100BACARE �iso 360 nm 0 9
�com 410 nm 9 58
�max 445 nm 18 100LUT �iso 380 nm 1 15
�com 410 nm 9 48
�max 455 nm 16 100ZXN �iso 375 nm 0 12
�com 410 nm 5 44
�max 460 nm 18 100ECH �iso 400 nm 1 27
�com 410 nm 5 37
�max 475 nm 35 100LYC �iso 395 nm 0 14
�com 410 nm 7 25
�max 455 nm 22 100BCAR �iso 375 nm 0 12
�com 410 nm 8 41
tl
3
wctibea
he solution before and after the incubation against various wave-engths.
.2.1. Formation of Z-isomersIn order to conduct experiments to establish the isosbestic
avelength we need to look in more details at the physico-hemical characteristics of the E/Z-isomers and the conditions ofheir formation. Z-isomers of carotenoids may be naturally formed
n certain organisms. However, as an example, all-E-AXN is theiologically favoured form but can be isomerised to its Z-isomer,specially the 9-Z- and 13-Z-AXN, by environment factors suchs heat, light and oxygen [17]. Theoretically, a higher number ofmany different cis-Z-isomers may be formed, the actual number ofZ-isomers however is quite reduced [1]. Furthermore, high temper-ature markedly promotes the isomerisation of all-E-AXN, therebyleading to the formation of the corresponding Z-isomers. We madeuse of this reaction in order to produce Z-isomers from the cor-responding all-E-isomers. For instance, in the case of AXN theformation of the above mentioned Z-isomers was checked by sub-jecting the solution after incubation to LC analysis. Three different
chromatographic columns were tested regarding their capabilityof separating the target analytes, namely Suplex pKb-100, ZorbaxRX C8, Ascentis RP Amide. The best separation of all-E- and Z-isomers of AXN was achieved with the Ascentis RP Amide column
K. Mitrowska et al. / J. Chromatogr. A 1233 (2012) 44– 53 51
0
20000
40000
60000
80000
100000
120000
140000
160000
180000
700600500400300200
Wavelength (nm)
Are
a (
mA
u)
t 0' AXN DMDS t 120' AXN DMDS
0
20000
40000
60000
80000
100000
120000
140000
160000
180000
200000
700600500400300200
Wavelength (nm)
Are
a (
mA
u)
t 0' AXN t 120' AXN
0
50000
100000
150000
200000
250000
700600500400300200
Wavelength (nm)
Are
a (
mA
u)
t 0' ADR t 120' ADR
0
50000
100000
150000
200000
250000
700600500400300200
Wavelength (nm)
Are
a (
mA
u)
t 0' CXN t 120' CXN
0
50000
100000
150000
200000
250000
300000
700600500400300200
Wavelength (nm)
Are
a (
mA
u)
t 0' CSN t 120' CSN
0
50000
100000
150000
200000
250000
300000
350000
700600500400300200
Wavelength (nm)
Are
a (
mA
u)
t 0' ADXN t 120' ADXN
0
50000
100000
150000
200000
250000
300000
350000
700600500400300200
Wavelength (nm)
Are
a (
mA
u)
t 0' BACAR t 120' BACAR
0
50000
100000
150000
200000
250000
300000
350000
400000
700600500400300200
Wavelength (nm)
Are
a (
mA
u)
t 0' AST t 120' AST
0
50000
100000
150000
200000
250000
700600500400300200
Wavelength (nm)
Are
a (
mA
u)
t 0' CXIN t 120' CXIN
0
50000
100000
150000
200000
250000
300000
350000
700600500400300200
Wavelength (nm)
Are
a (
mA
u)
t 0' BACARE t 120' BACARE
0
20000
40000
60000
80000
100000
120000
140000
700600500400300200
Wavelength (nm)
Are
a (
mA
u)
t 0' LUT t 120' LUT
0
50000
100000
150000
200000
250000
700600500400300200
Wavelength (nm)
Are
a (
mA
u)
t 0' ZXN t 120' ZXN
0
50000
100000
150000
200000
250000
300000
350000
400000
450000
700600500400300200
Wavelength (nm)
Are
a (
mA
u)
t 0' ECH t 120' ECH
0
20000
40000
60000
80000
100000
120000
140000
160000
180000
700600500400300200
Wavelength (nm)
Are
a (
mA
u)
t 0' LYC t 120' LYC
0
50000
100000
150000
200000
250000
300000
700600500400300200
Wavelength (nm)
Are
a (
mA
u)
t 0' BCAR t 120' BCAR
Isosbestic point
λ 410 nm
Isosbestic point
λ 410 nm
Isosbestic point
λ 405 nm
Isosbestic point
λ 410 nm
Isosbestic point
λ 375 nm
Isosbestic point
λ 385 nm
Isosbestic point
λ 400 nm
Isosbestic point
λ 385 nm
Isosbestic point
λ 390 nm
Isosbestic point
λ 385 nm
Isosbestic point
λ 360 nm
Isosbestic point
λ 380 nm
Isosbestic point
λ 400 nm
Isosbestic point
λ 395 nm
Isosbestic point
λ 375 nm
F n; theo
aot1
ig. 6. UV/Vis spectra of standard solutions before (t 0′) and after (t 120′) incubatiother. The abbreviations of the analytes are defined in Fig. 1 and in Section 2.1.
s shown in Fig. 4. The chromatogram obtained from the analysisf the solution after incubation showed two additional peaks closeo the peak of the all-E-isomer that were identified as 9-Z- and3-Z-AXN [1].
isosbestic point corresponds to the wavelength at which these spectra cross each
For the incubation experiments, standard solutions containingindividually the all-E-isomer of each carotenoid (approx. 10 mg L−1
in ACN) were treated at 80 ◦C in a heating block for 2 h. The incu-bation conditions were identical for all carotenoids [7]. In addition,

5 omato
woo
3
a5swtptwmpbsteatlfFbwpesiTsotIpC
cidai
crs
TC
2 K. Mitrowska et al. / J. Chr
e performed corresponding incubation experiments at 50 ◦C, inrder to check for an impact of a different incubation temperaturen the determination of the isosbestic wavelengths.
.2.2. Determination of isosbestic wavelengthsIn the next step the standard solutions were subjected to LC
nalysis, measuring at different wavelengths ranging from 245 to60 nm in steps of 5 nm. This analysis was done on both standardolutions, before and after the incubation. For this experiment itas required that specific HPLC conditions were selected in which
he all-E- and Z-isomers of the same carotenoid coeluted. For thaturpose we applied the HPLC conditions already optimised in Sec-ion 3.1 with some modifications: a decrease in the amount ofater in the mobile phase and an increase in the flow rate of theobile phase up to 2 mL min−1. The test is based on the princi-
le that at the isosbestic wavelength the peaks of the carotenoidefore and after the heat treatment have the same area. Fig. 5hows the result for AXN obtained at two wavelengths. At 480 nmhe absorption coefficients for the all-E- and Z-isomers are differ-nt, thus leading to a different peak area for the solution beforend after the incubation. In contrast, at 410 nm the difference ofhe area of both peaks is much smaller, indicating that this wave-ength is very close to the ideal isosbestic conditions. The resultsrom the incubation experiments of all carotenoids are shown inig. 6, in which the measured peak areas of the standard solutionsefore and after the incubation were plotted against the adjustedavelengths, thus showing the spectra of both cases. The isosbesticoint corresponded to a wavelength at which these spectra crossach other. The results of experiments are summarised in Table 4,howing individually for each carotenoid the wavelengths of max-mum absorbance (�max) and those of isosbestic conditions (�iso).he positive effect on the accuracy of the measurement by mea-uring at �iso is indicated by the differences of the absorbancesbtained before and after the incubation when selecting �max forhe measurement and varied from 10% for BACAR to 35% for LYC.n addition, Table 4 shows the sensitivity obtained at �iso com-ared to �max, which ranged between 9% for BACARE and 31% forXN.
The results from the experiments at 50 ◦C demonstrated in mostases a lower formation of Z-isomers compared to the correspond-ng experiments performed at 80 ◦C. However, the impact of theifferent incubation conditions on the isosbestic wavelength was inll cases negligible, thus confirming the robustness of the selectedsosbestic wavelengths presented in this paper (figures not shown).
Using this isosbestic wavelength the total carotenoid contentan be quantified exclusively against the all-E-isomer without theisk of underestimation of the sum of all isomers but with a loss ofensitivity of around 3 times.
able 5alibration curves, LODs and LOQs for 15 carotenoids (n = 3).
Carotenoid Slope Intercept Corr
AXN-DMDS 17,830 −1330 0.99AXN 30,040 117 0.99ADR 35,043 −10,451 0.99CXN 20,405 3122 0.99CSN 33,768 −3640 0.99ADXN 39,407 −12,754 0.99BACAR 68,307 −16,660 0.99AST 57,324 −8356 0.99CIXN 32,432 −6824 0.99BACARE 75,816 −26,378 0.99LUT 32,041 −6056 0.99ZXN 53,930 −13,790 0.99ECH 64,133 −17,916 0.99LYC 38,648 −7903 0.99BCAR 44,191 −11,717 0.99
gr. A 1233 (2012) 44– 53
3.2.3. Applying a common isosbestic wavelength forquantification of 15 carotenoids
Because isosbestic points individually determined for all 15carotenoids were relatively close to each other covering a rangefrom 360 to 410 nm, we investigated the option of selecting410 nm as a common wavelength which applied to all analytesand the corresponding isomers. The same wavelength has alreadybeen used by Lessin for recording absorbance and quantificationof E- and Z-isomers of alpha-carotene, beta-carotene and beta-cryptoxanthin [10]. In our study measuring all analytes at thiscommon wavelength revealed that the difference in absorbanceof a standard solution before and after incubation was in allcases except one below or equal 9%. For CIXN the difference was13%. The absorbance measured at the chosen common isosbesticwavelength in comparison to the one measured at the maximumwavelength specifically established for each analyte ranged from25% to 58% for all tested carotenoids. In contrast, the absorbancemeasured accurately at the isosbestic wavelength in comparisonto the one measured at maximum wavelength ranged from 9% to31% for all tested carotenoids, showing much less sensitivity of themeasurement (Table 4).
Applying one common isosbestic wavelength for the quantifi-cation of 15 carotenoids is a compromise between quantifying allisomers of carotenoids exclusively against all-E-isomers at a max-imum wavelength (the risk of underestimation) and quantifyingat an isosbestic point (the risk of too low sensitivity). The separa-tion of the target 15 carotenoids quantified at a common isosbesticwavelength is presented in Fig. 3.
In addition, it has been observed that while injecting incubatedsingle standard solutions of individual carotenoids using a finaloptimised method for the separation of 15 carotenoids some iso-mers of one carotenoid may slightly coelute with isomers of anotheradjacent carotenoid. It means that Z-isomers of some carotenoidsmay show up under two or more peaks under optimised HPLC con-ditions. It should be taken into account that in a real sample therecould be an unlimited number of Z-isomers and other carotenoidswhich may coelute and interfere with the carotenoids we haveincluded in our method.
3.3. Calibration curves, limits of detection and qualification
As a part of single-laboratory validation, linearity, correlationcoefficient, limit of detection (LOD) and limit of quantification(LOQ) of the method for the determination of carotenoids at 410 nm
were assessed.The calibration curves were linear in the range from 5 mg L−1 to25 mg L−1 while correlation coefficient for all 15 carotenoids wasabove 0.9987.
elation coefficient LOD (mg L−1) LOQ (mg L−1)
98 0.09 0.2997 0.12 0.4096 0.13 0.4394 0.12 0.4198 0.08 0.2687 0.07 0.2394 0.10 0.3395 0.10 0.3293 0.14 0.4897 0.06 0.2098 0.09 0.3097 0.09 0.3297 0.08 0.2797 0.12 0.3997 0.08 0.26

omato
Lmc0reaL
4
tdact
tcdw
csfE
aoatdow
mcc
pof
[[[
[[
[
[[[[[
[[22] M. Careri, L. Elviri, A. Mangia, J. Chromatogr. A 854 (1999) 233.
K. Mitrowska et al. / J. Chr
LODs calculated as three times the signal-to-noise ratio andOQs calculated as ten times the signal-to-noise ratio were deter-ined using calibration curves established at appropriate low
oncentration levels of the target analytes and ranged from.06 mg L−1 to 0.14 mg L−1 and from 0.20 mg L−1 to 0.48 mg L−1,espectively. Additionally the values calculated were confirmedxperimentally by injecting the standard solutions of carotenoidst the concentration level corresponding to the obtained LODs andOQs (Table 5).
. Conclusion
A new RP-HPLC-DAD method for the separation and the quan-ification of adonirubin, adonixanthin, astaxanthin, astaxanthinimethyl disuccinate, asteroidenone, beta-apo-8′-carotenal, beta-po-8′-carotenoic acid ethyl ester, beta-carotene, canthaxanthin,apsanthin, citranaxanthin, echinenone, lutein, lycopene, zeaxan-hin in standard solution has been developed.
The isosbestic point approach has been applied to calculatehe concentration of 15 carotenoids. Isosbestic points for all 15arotenoids have been determined and the chromatogram of a stan-ard solution mixture of 15 carotenoids at one common isosbesticavelength has been presented.
This analytical method is designed for the determination of theontent of carotenoids against all-E-standards. It has been demon-trated that while measuring at an isosbestic wavelength the resultor the content of carotenoids does not depend on the ratio of the/Z-isomers present in the product forms.
Going further calculating the concentration of all 15 carotenoidst one common isosbestic wavelength (410 nm) reduces the riskf underestimation by quantifying Z-isomers exclusively againstll-E-isomers and ensures high sensitivity. Another advantage ofhis approach is the possibility of using single-wavelength UV/Visetectors instead of multi-wavelength acquisition with a DAD inne run. Alternatively analyte specific wavelengths can be adjusted,hen using a HPLC system equipped with a DAD.
It can be finally concluded that the developed multi-analyteethod based on multi-lambda acquisition with a DAD in one run
ould be an appropriate tool for the detection and determination ofarotenoids in a wide range of carotenoids mixtures and extracts.
The next step will be to complete the optimisation of the samplereparation of feed samples and to apply the complete method-logy to the determination of the target analytes in completeeedingstuffs and to develop a single-laboratory validated method
[[
[
gr. A 1233 (2012) 44– 53 53
which meets the criteria of relevant European legislation [6].
Acknowledgements
The authors are grateful to the FEFANA (European Union Associ-ation of Specialty Feed Ingredients and their Mixtures) carotenoidsworking group for the fruitful scientific discussions and in par-ticular to Joseph Schierle from DSM Nutritional Products Ltd(Kaiseraugst, Switzerland) for also providing us with carotenoidstandards.
References
[1] G. Britton, S. Liaaen-Jensen, H. Pfander, Carotenoids, vol. 1A: Isolation and Anal-ysis, Birkhauser Verlag, Basel, 1995.
[2] G. Britton, S. Liaaen-Jensen, H. Pfander, Carotenoids, vol. 1B: Spectroscopy,Birkhauser Verlag, Basel, 1995.
[3] Regulation (EC) No 1831/2003 of the European Parliament and of the Councilof 22 September 2003 on additives for use in animal nutrition, Official J. Euro.Union L 268 (2003) 29.
[4] D.E. Breithaupt, Trends Food Sci. Technol. 18 (2007) 501.[5] Commission Regulation No 393/2008 of 30 April 2008 concerning the autho-
risation of astaxanthin dimethyldisuccinate as a feed additive. Official J. Euro.Union L 117 (2008) 20.
[6] Regulation (EC) No 882/2004 of the European Parliament and of the Councilof 29 April 2004 on official controls performed to ensure the verification ofcompliance with feed and food law, animal health and animal welfare rules No882/2004, Official J. Euro. Union L 191 (2004) 1.
[7] J. Schierle, T. Schellenberger, C. Fizet, R. Betz, Eur. Food Res. Technol. 215 (2002)268.
[8] J. Schierle, B. Pietsch, A. Ceresa, C. Fizet, J. AOAC Int. 87 (2004) 1070.[9] J. Rubaj, G. Bielecka, W. Korol, K. Kwiatek, Bull. Vet. Inst. Pulawy 53 (2009) 707.10] W.J. Lessin, G.L. Catigani, S.J. Schwartz, J. Agric. Food Chem. 45 (1997) 3728.11] B.S. Inbaraj, J.T. Chien, B.H. Chen, J. Chromatogr. A 1102 (2006) 193.12] M. Kimura, C.N. Kobori, D.B. Rodriguez-Amaya, P. Nestel, Food Chem. 100 (2007)
1734.13] M.G. Dias, M.F.G.F.C. Camões, L. Oliveira, Food Chem. 109 (2008) 815.14] J.P. Steghens, A.L. van Kappel, E. Riboli, C. Collombel, J. Chromatogr. B 694 (1997)
71.15] B. Lyan, V. Azaïs-Braesco, N. Cardinault, V. Tyssandier, P. Borel, M.C. Alexandre-
Gouabau, P. Grolier, J. Chromatogr. B 751 (2001) 297.16] V. Rajendran, Y.S. Pu, B.H. Chen, J. Chromatogr. B 824 (2005) 99.17] J.P. Yuan, F. Chen, J. Agric. Food Chem. 47 (1999) 3656.18] C. Emenhiser, L.C. Sander, S.J. Schwartz, J. Chromatogr. A 707 (1995) 205.19] C. Wang, D.W. Armstrong, C.D. Chang, J. Chromatogr. A 1194 (2008) 172.20] V.M. Moretti, T. Mentasti, F. Bellagamba, U. Luzzana, F. Caprino, G.M. Turchini,
I. Giani, F. Valfrè, Food Addit. Contam. 23 (2006) 1056.21] T. Lacker, S. Strohschein, K. Albert, J. Chromatogr. A 854 (1999) 37.
23] D.E. Breithaupt, Food Chem. 86 (2004) 449.24] C.K. Bayne, B. Rubin, Practical Experimental Designs and Optimization Methods
for Chemists, VCH Publishers, Deerfield Beach, FL, 1986.25] S. Bostyn, B. Cagnon, H. Fauduet, Talanta 80 (2009) 1.