separating figure from ground with a parallel network figure from...separating figure from ground...
TRANSCRIPT
Perception, 1986, volume 15, pages 197-216
Separating figure from ground with a parallel network
Paul K Kienker, Terrence J Sejnowskill Department of Biophysics, Johns Hopkins University, Baltimore, MD 21218, USA
Geoffrey E Hinton, Lee E Schumacher Computer Science Department, Carnegie-Mellon University, Pittsburgh, PA 15213, USA Received 16 May 1986
Abstract. The differentiation of figure from ground plays an important role in the perceptual organization of visual stimuli. The rapidity with which we can discriminate the inside from the outside of a figure suggests that at least this step in the process may be performed in visual cortex by a large number of neurons in several different areas working together in parallel. We have attempted to simulate this collective computation by designing a network of simple processing units that receives two types of information: bottom-up input from the image containing the outlines of a figure, which may be incomplete, and a top-down attentional input that biases one part of the image to be the inside of the figure. No presegmentation of the image was assumed. Two methods for performing the computation were explored: gradient descent, which seeks locally optimal states, and simulated annealing, which attempts to find globally optimal states by introducing noise into the computation. For complete outlines, gradient descent was faster, but the range of input parameters leading to successful performance was very narrow. In contrast, simulated annealing was more robust: it worked over a wider range of attention parameters and a wider range of outlines, including incomplete ones. Our network model is too simplified to serve as a model of human performance, but it does demonstrate that one global property of outlines can be computed through local interactions in a parallel network. Some features of the model, such as the role of noise in escaping from nonglobal optima, may generalize to more realistic models.
1 Introduction The visual system is capable of transforming a noisy incomplete two-dimensional input into a relatively clear-cut and complete three-dimensional interpretation of a scene. For a single fixation, the interpretive process does not appear to involve conscious infer- ence, and yet, as Helmholtz (1909/1962) pointed out, it must have many of the properties that we normally associate with inference. Pieces of evidence in the input (like T junctions) must be used to support hypotheses about the three-dimensional scene (like one bounding contour occluding another). For any real image there will be many pieces of evidence and many competing hypotheses, so it is essential to have a mechanism that can rapidly decide which mutually consistent subset of the hypotheses is best supported by the evidence. According to this view, the visual system is a parallel statistical inference engine, but to make this convincing it is necessary to specify, in detail, just how this engine works.
The Gestalt psychologists identified many of the principles and constraints used by the interpretive process. Gestalts were viewed as organizations that emerged from multiple interactions (Attneave 1982), but the closest they came to a mechanism was a weak analogy with fields in physics. They were unable to produce a convincing mechanism for applying the constraints and making the necessary trade-offs between conflicting constraints when interpreting an image.
The inferential view of perception was rejected by Gibsonian psychologists, who pointed out that with very complex image features it is possible to find cues that act as
ll Author to whom all communications should be addressed.
198 P K Kienker, T J Sejnowski, G E Hinton, L E Schumacher
very strong evidence for properties of the visible three-dimensional surfaces, so it may not be necessary to combine many weak sources of evidence (Gibson 1966). In their language, the complex properties of the optic array speciSy the properties of visible surfaces. This is an important point which had led to the discovery of many interesting complex features, but we suspect that the problem of conflicting evidence will always remain in any task involving the interpretation of real input. Gibsonians are unhappy with the idea that perception involves inference, but seem happy with underspecified notions like 'resonance' between the image and its interpretation. The mechanism we propose for parallel statistical inference is actually far more similar to a resonance mechanism than to the kind of serial logical inference that Gibson found so distasteful (personal communication, Gibson 1979).
The aim of this paper is to suggest a new mechanism for unconscious perceptual inference and, by applying it to a visual task that requires the coordination of top-down and bottom-up influences, to demonstrate that the mechanism is effective. The strong relationship between the proposed mechanism and correct Baysian inference has been described elsewhere (Hinton and Sejnowski 1983; Geman and Geman 1984). The simulations we present involve many simplifications and some ad hoc choices of parameters: this may lead some readers to wonder what the simulation proves. It does not prove that the theory is correct, nor does it prove that the particular parameters we used are of psychological interest. What it does show is that the proposed mechanism is well-specified and internally consistent. Many proposed mechanisms are not, and as theories of perception become more complex, checking for internal consistency may become as important as experimental data for eliminating incorrect theories.
One class of theories that has been proposed to account for early visual processing is based on parallel networks of neuron-like processing units. The present approach is similar in spirit to other recent network models (Arbib 1975; Dev 1975; Marr and Poggio 1976; Feldman and Ballard 1982; Marr 1982; Hopfield and Tank 1985). In this type of model, each local hypothesis about an object in the image is represented by a processing unit and the constraints between these hypotheses, whether innate or learned, are implemented by connections between the units (Ballard et a1 1983; Hinton and Sejnowski 1983). This computational method is similar to relaxation labeling methods (Waltz 1975; Zucker and Hummel 1979; Prager 1980; Danker and Rosenfeld 1981), but the algorithm used for updating the processing units is stochastic rather than deterministic. Surprisingly, it is easier to analyze the convergence properties of net- works of binary units if the update rule is stochastic. A generalization of this approach has recently been applied to stereopsis (Sperling 1970; Julesz 1971; Schulten 1986). Preliminary results have been reported previously (Sejnowski and Hinton 1986).
1.1 Figure- ground separation When a closed outline is flashed briefly, an observer can report within a few hundred milliseconds whether or not a small spot was on the inside or the outside of the outline (Ullman 1984). This discrimination probably requires two steps: a separation of figure from ground, and a subsequent decision about whether the spot was located in the figure. The speed with which the decision can be made compared with the time scale of neural processing suggests that figure - ground separation is computed in parallel over the visual field. However, most of the connections between neurons in visual cortex are limited in range, so that global decisions such as the assignment of figure to a region are probably made on the basis of local interactions. The question addressed here is how such global decisions can be successfully made on the basis of local nonlinear inter- actions that occur in parallel.
Information in an image formed on the retina is transformed as it passes through the retina, the lateral geniculate nucleus, and primary visual cortex. We are interested in
Separating figure from ground 199
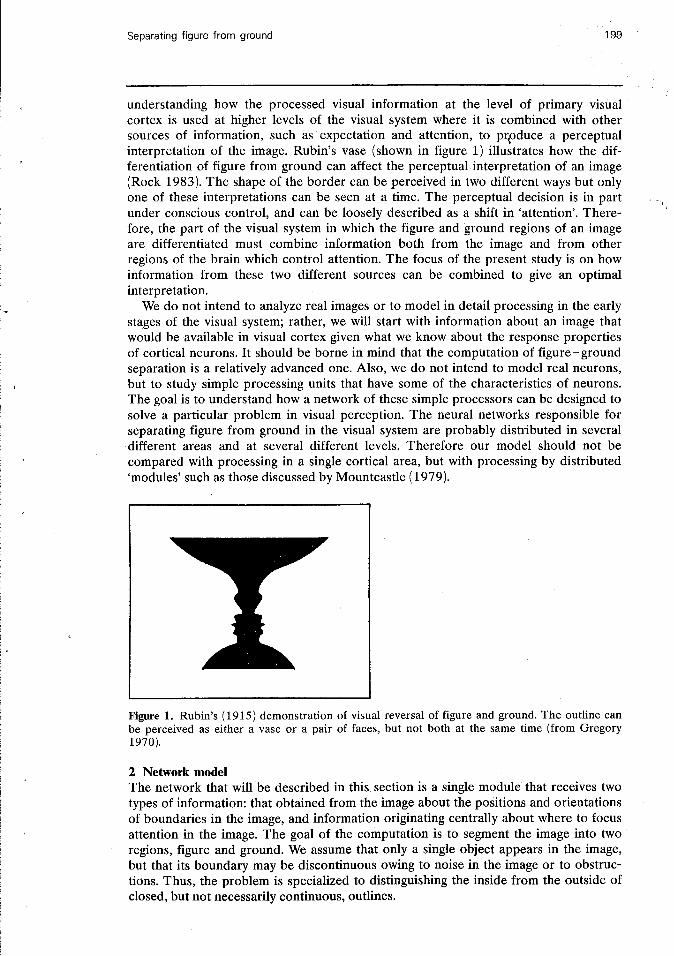
understanding how the processed visual information at the level of primary visual cortex is used at higher levels of the visual system where it is combined with other sources of information, such as expectation and attention, to pr,oduce a perceptual interpretation of the image. Rubin's vase (shown in figure 1) illustrates how the dif- ferentiation of figure from ground can affect the perceptual interpretation of an image (Rock 1983). The shape of the border can be perceived in two different ways but only one of these interpretations can be seen at a time. The perceptual decision is in part under conscious control, and can be loosely described as a shift in 'attention'. There- fore, the part of the visual system in which the figure and ground regions of an image are differentiated must combine information both from the image and from other regions of the brain which control attention. The focus of the present study is on how information from these two different sources can be combined to give an optimal interpretation.
We do not intend to analyze real images or to model in detail processing in the early stages of the visual system; rather, we will start with information about an image that would be available in visual cortex given what we know about the response properties of cortical neurons. It should be borne in mind that the computation of figure-ground separation is a relatively advanced one. Also, we do not intend to model real neurons, but to study simple processing units that have some of the characteristics of neurons. The goal is to understand how a network of these simple processors can be designed to solve a particular problem in visual perception. The neural networks responsible for separating figure from ground in the visual system are probably distributed in several different areas and at several different levels. Therefore our model should not be compared with processing in a single cortical area, but with processing by distributed 'modules' such as those discussed by Mountcastle (1979).
Figure 1. Rubin's (1915) demonstration of visual reversal of figure and ground. The outline can be perceived as either a vase or a pair of faces, but not both at the same time (from Gregory 1970).
2 Network model The network that will be described in this section is a single module that receives two types of information: that obtained from the image about the positions and orientations of boundaries in the image, and information originating centrally about where to focus attention in the image. The goal of the computation is to segment the image into two regions, figure and ground. We assume that only a single object appears in the image, but that its boundary may be discontinuous owing to noise in the image or to obstruc- tions. Thus, the problem is specialized to distinguishing the inside from the outside of closed, but not necessarily continuous, outlines.
200 P K Kienker, T J Sejnowski, G E Hinton, L E Schumacher
2.1 Processing units The processing units were used to represent the variables known to be important for the computation, and the connections between the units were used to implement directly the constraints between the variables (Hinton and Sejnowski 1983). We used our intuition about the problem to help design the network, and in turn used the performance of the network to test our intuition. The units have only two output values, 0 or 1, and represent hypotheses about the image that are either false or true. The connection strengths have integer values between - 15 and + 15.
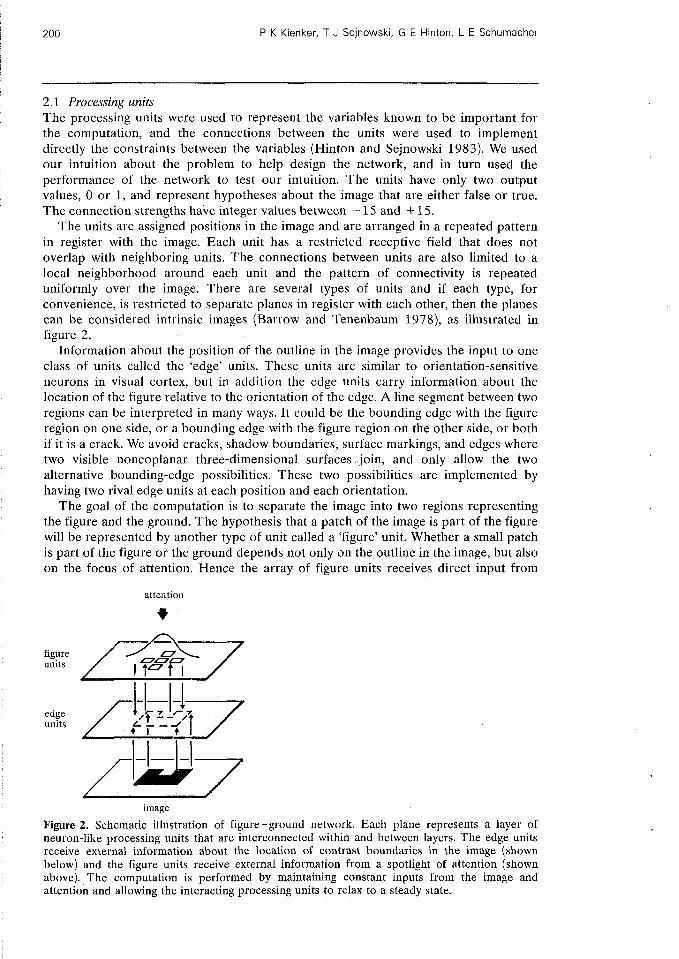
The units are assigned positions in the image and are arranged in a repeated pattern in register with the image. Each unit has a restricted receptive field that does not overlap with neighboring units. The connections between units are also limited to a local neighborhood around each unit and the pattern of connectivity is repeated uniformly over the image. There are several types of units and if each type, for convenience, is restricted to separate planes in register with each other, then the planes can be considered intrinsic images (Barrow and Tenenbaum 1978), as illustrated in figure 2.
Information about the position of the outline in the image provides the input to one class of units called the 'edge' units. These units are similar to orientation-sensitive neurons in visual cortex, but in addition the edge units carry information about the location of the figure relative to the orientation of the edge. A line segment between two regions can be interpreted in many ways. It could be the bounding edge with the figure region on one side, or a bounding edge with the figure region on the other side, or both if it is a crack. We avoid cracks, shadow boundaries, surface markings, and edges where two visible noncoplanar three-dimensional surfaces -join, and only allow the two alternative bounding-edge possibilities. These two possibilities are implemented by having two rival edge units at each position and each orientation.
The goal of the computation is to separate the image into two regions representing the figure and the ground. The hypothesis that a patch of the image is part of the figure will be represented by another type of unit called a 'figure' unit. Whether a small patch is part of the figure or the ground depends not only on the outline in the image, but also on the focus of attention. Hence the array of figure units receives direct input from
attention
9
figure units KFPT/ A
image
Figure 2. Schematic illustration of figure-ground network. Each plane represents a layer of neuron-like processing units that are interconnected within and between layers. The edge units receive external information about the location of contrast boundaries in the image (shown below) and the figure units receive external information from a spotlight of attention (shown above). The computation is performed by maintaining constant inputs from the image and attention and allowing the interacting processing units to relax to a steady state.
Separating figure from ground 201
some higher level which can bias some of the figure units to the true state. This bias cannot be dominant, otherwise information about the position of the outline provided by the edge units will be ignored; the 'bottom-up' information from the image must be balanced with the 'top-down' information from the attention.
During a computation the outline in the image and the attentional bias are held fixed and the network, shown schematically in figure 2, must find the states of all the processing units that are maximally consistent with the top-down and bottom-up inputs. This can be considered a search for the best interpretation of the image from amongst the large set of all possible internal models that can be represented by the units. In general, the more that is known about the regularities of objects in the image, the more constraints can be implemented as connections between the units, and the faster the search will be. It should be kept in mind that in separating figure from ground the human visual system is taking into account many more constraints than are incor- porated into our model. These additional constraints, had they been implemented, would make the solution to the problem easier. The module in figure 2 is only meant to be a small part of a much larger system.
Cohen and Grossberg (1984) have recently analyzed a network model of early visual processing similar in style to the one studied here. They distinguish two types of variables in their representation of the image: boundary variables, which are associated with contours, and feature variables, which are defined between contours, such as color. In terms of this nomenclature, our edge units could be classified as boundary variables, and our figure units as feature variables.
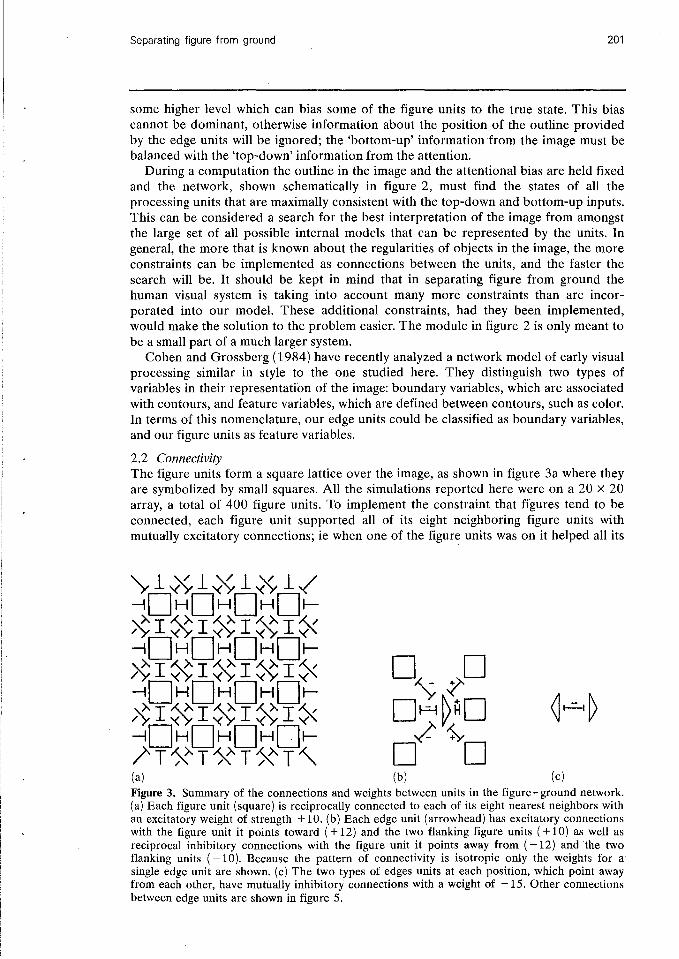
2.2 Connectivity The figure units form a square lattice over the image, as shown in figure 3a where they are symbolized by small squares. All the simulations reported here were on a 20 x 20 array, a total of 400 figure units. To implement the constraint that figures tend to be connected, each figure unit supported all of its eight neighboring figure units with mutually excitatory connections; ie when one of the figure units was on it helped all its
(a) (b) (c) Figure 3. Summary of the connections and weights between units in the figure-ground network. (a) Each figure unit (square) is reciprocally connected to each of its eight nearest neighbors with an excitatory weight of strength + 10. (b) Each edge unit (arrowhead) has excitatory connections with the figure unit it points toward ( + 12) and the two flanking figure units ( + 10) as well as reciprocal inhibitory connections with the figure unit it points away from (-12) and the two flanking units ( - 10). Because the pattern of connectivity is isotropic only the weights for a single edge unit are shown. (c) The two types of edges units at each position, which point away from each other, have mutually inhibitory connections with a weight of - 15. Other connections between edge units are shown in figure 5.
202 P K Kienker, T J Sejnowski, G E Hinton, L E Schurnacher
neighbors to be on. To avoid boundary effects, the edges of the square array were identified, so that the surface had the topology of a torus. Attention was implemented by top-down excitatory inputs which decreased in strength with distance, d, from the centre of the attention. The input from the Gaussian 'spotlight' had two parameters specifying the center of attention, and two more parameters specifying the amplitude, A, and width, a , of the spotlight:
17 = Aexp ( - dla) ' . (1)
The attentional input for a typical problem is illustrated in figure 4a. Between every pair of figure units there was a pair of edge units, oriented as shown in
figure 3b. An edge unit is symbolized by an arrowhead, with the direction of the arrowhead pointing toward the figure region it supports. Only horizontal and vertical orientations were represented, giving a total of 1600 edge units. Wherever a line segment occurred in the image, the two relevant edge units received strong excitatory input. This insured that the line segment would be interpreted, but only one edge unit of the pair would be active since cracks were not allowed. Mutual inhibition was therefore provided between the two edge units, as in figure 3c, so that when one of the pair was on it would tend to suppress the other, and vice versa. Edge units were given a high threshold to insure that they would not be inserted into implausible locations without direct support from the outline.
The only information about which of the two edge interpretations was preferred at a given location of the outline came indirectly from the attentional input via the figure units. Each edge unit had excitatory connections with the adjacent figure unit with which it was consistent (pointing toward), and inhibitory connections with the adjacent figure unit with which it was inconsistent (pointing away from). Both of these con- nections were reciprocal, so that the activation of a figure unit would support all four of the adjacent edge units that point toward it.
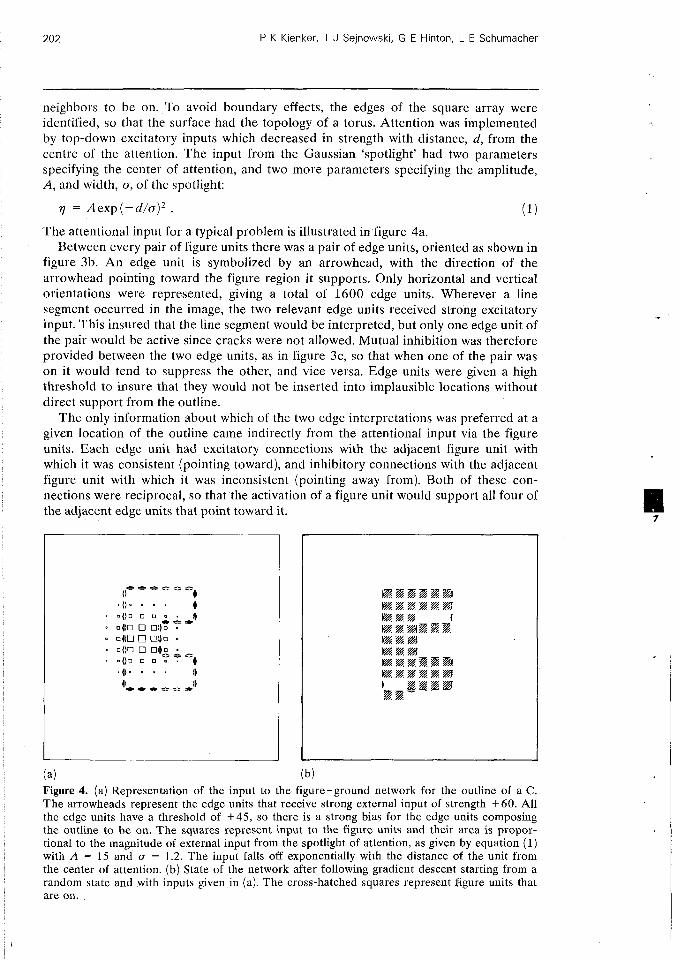
Figure 4. (a) Represe~ltation of the input to the figure-ground network for the outline of a C. The arrowheads represent the edge units that receive strong external input of strength f60. All the edge units have a threshold of +45, so there is a strong bias for the edge units composing the outline to be on. The squares represent input to the figure units and their area is propor- tional to the magnitude of external input from the spotlight of attention, as given by equation ( 1 ) with A = 15 and a = 1.2. The input falls off exponentially wirh the distance of the unit from the center of attention. (b) State of the network after following gradient descent starting from a random state and with inputs given in (a). The cross-hatched squares represent figure units that are on.
Separating figure from ground
In circumstances where the outline is incomplete, edges should tend to support the continuity of the figure through the gap. This can be accomplished in two ways: either by directly connecting parallel edges of the same type, or by extending the interaction between the edge and figure units to the next nearest neighbor along its orientation. The latter was found empirically to be more effective, and the continuity constraint was implemented according to the scheme shown in figure 3b.
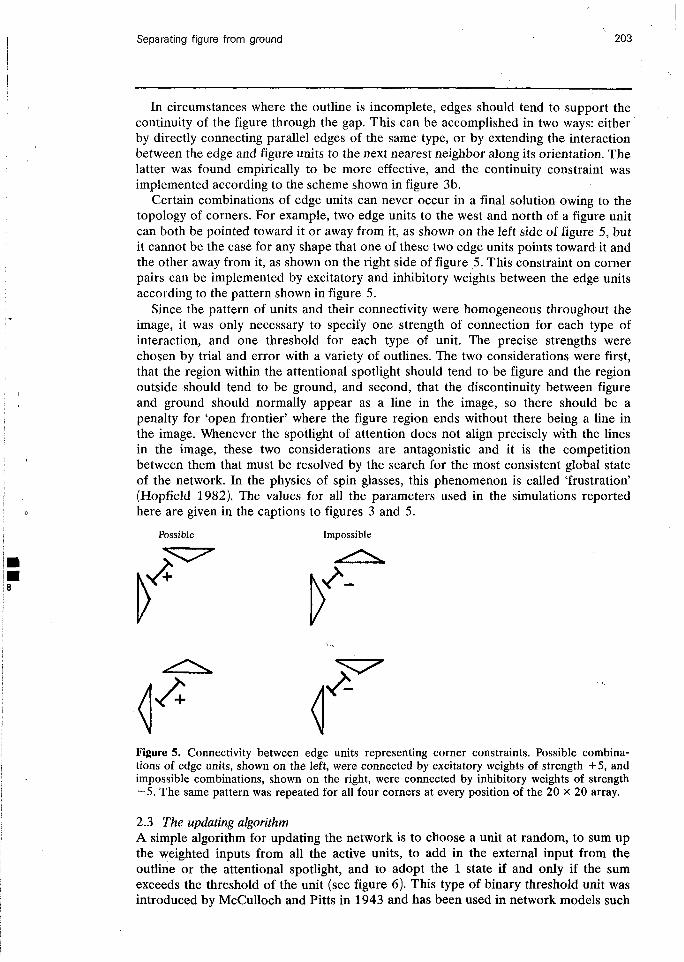
Certain combinations of edge units can never occur in a final solution owing to the topology of corners. For example, two edge units to the west and north of a figure unit can both be pointed toward it or away from it, as shown on the left side of figure 5, but it cannot be the case for any shape that one of these two edge units points toward it and the other away from it, as shown on the right side of figure 5. This constraint on corner pairs can be implemented by excitatory and inhibitory weights between the edge units according to the pattern shown in figure 5.
Since the pattern of units and their connectivity were homogeneous throughout the image, it was only necessary to specify one strength of connection for each type of interaction, and one threshold for each type of unit. The precise strengths were chosen by trial and error with a variety of outlines. The two considerations were first, that the region within the attentional spotlight should tend to be figure and the region outside should tend to be ground, and second, that the discontinuity between figure and ground should normally appear as a line in the image, so there should be a penalty for 'open frontier' where the figure region ends without there being a line in the image. Whenever the spotlight of attention does not align precisely with the lines in the image, these two considerations are antagonistic and it is the competition between them that must be resolved by the search for the most consistent global state of the network. In the physics of spin glasses, this phenomenon is called 'frustration' (Hopfield 1982). The values for all the parameters used in the simulations reported here are given in the captions to figures 3 and 5.
Possible Impossible
Figure 5. Connectivity between edge units representing corner constraints. Possible combina- tions of edge units, shown on the left, were connected by excitatory weights of strength +5, and impossible combinations, shown on the right, were connected by inhibitory weights of strength -5. The same pattern was repeated for all four corners at every position of the 20 X 20 array.
2.3 The updating algorithm A simple algorithm for updating the network is to choose a unit at random, to sum up the weighted inputs from all the active units, to add in the external input from the outline or the attentional spotlight, and to adopt the 1 state if and only if the sum exceeds the threshold of the unit (see figure 6). This type of binary threshold unit was introduced by McCulloch and Pitts in 1943 and has been used in network models such
204 P K Kienker, T J Sejnowski, G E Hinton, L E Schumacher
as the Marr-Poggio (1976) model of stereopsis. In general, it is very difficult to analyze the convergence properties of nonlinear relaxation algorithms of this type [eg, Marr et a1 (1978) suggested that a general analysis of algorithms in the class was not possible].
There is a special class of nonlinear relaxation algorithms that can be analyzed, as first suggested by Hopfield (1982). The network of units described above has the property that every connection between a pair of units is reciprocal, so that the matrix of weights w, between unit i and unit j is symmetric, w, = w,,. Hopfield pointed out that for a symmetric network the sequence of random updates must eventually stop, so that the network converges to some fixed state. This happens because the dyna- mics of a symmetric network is governed by a function which always decreases or stays constant whenever a unit is updated by the binary threshold rule:
where s, is the state of unit i, q, is the external input to the unit, and Bi is the threshold of the unit. This function is called the 'energy' of the network in analogy to the energy of a mechanical system, but for a network it is a measure of the inconsistency between the states of the units in the network. If many pairs of active units are on which are joined by inhibitory weights, then the network is highly inconsistent and it has a high energy; when most pairs of active units are joined by excitatory weights then the inconsistency is low and the energy is low. The energy is therefore a useful measure of how well all the constraints are being satisfied by the network, and since
Binary threshold unit
0 - 5 - 3 - 1 1 3 5
Energy gap, AE
inputs output
Binary Boltzmann unit
2 0.5 E PI 0 l . O K - 5 -3 -1 1 3 5
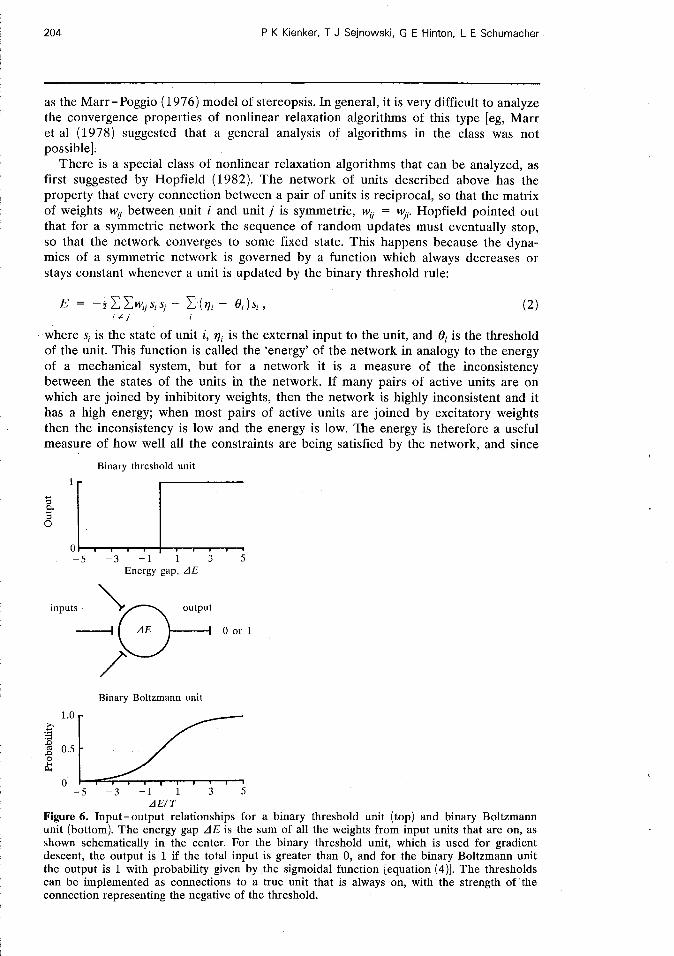
A E / T Figure 6 . Input-output relationships for a binary threshold unit (top) and binary Boltzmann unit (bottom). The energy gap AE is the sum of all the weights from input units that are on, as shown schematically in the center. For the binary threshold unit, which is used for gradient descent, the output is 1 if the total input is greater than 0, and for the binary Boltzmann unit the output is 1 with probability given by the sigmoidal function [equation (4)]. The thresholds can be implemented as connections to a true unit that is always on, with the strength of the connection representing the negative of the threshold.
Separating figure from ground 205
the energy decreases when the binary threshold rule is applied, it will tend to evolve with time into a more consistent state.
Given a set of inputs, the state with the globally minimum energy is the best solution to the problem. The binary threshold rule only guarantees convergence to a local minimum, so the network may get trapped in states that represent suboptimal inter- pretations of the image. An example of a suboptimal state of a network for a typical input is illustrated in figure 4b. These 'frustrated' states can be avoided if the binary threshold rule is modified to allow the system sometimes to increase in energy and jump out of the local energy minimum. A probabilistic algorithm with this property was introduced by Metropolis et a1 (1953) to simulate thermodynamic systems. An addi- tional parameter called the 'temperature', T, is introduced, that corresponds to the amount of noise that is added to the update decision.
The 'heat bath' form of the Metropolis algorithm (Binder 1978) that we use is: (i) Select a unit at random from the network. (ii) Calculate the total input to the unit,
AE, = ~ w , , s l - 6, + 11,. (3) I
This is also the difference in the energy of the system when the state of unit i changes from 0 to 1, and is called the energy gap.
(iii) Turn the unit on with probability
This sigmoidal relation between the input AEi and the probability of update is graphed in figure 6.
Although this updating algorithm is probabilistic, the actual probability of update is never transmitted to other units: only the binary outcome of the decision is transmitted. This relaxation algorithm therefore differs from previous relaxation labeling schemes (Hanson and Riseman 1978; Zucker and Hummel 1979; Peleg 1980; Hummel and Zucker 1983) in which the probabilities are directly represented and deterministically computed. Our relaxation algorithm more closely resembles that of Geman and Geman (1984), which uses more general Markov random fields, and that of Cerny (1983) and Smolensky (1 983).
The units in the network will fluctuate on and off, more so at higher than at lower temperatures, as in thermodynamic systems governed by statistical mechanics (Schroe- dinger 1946). Starting from an arbitrary state and applying the Metropolis update algorithm, the network will eventually reach a state of equilibrium where the lowest energy state has the highest probability of occurring. However, the number of updates required to reach equilibrium and the relative probability of being in the ground state depend on the temperature: at low temperature there is a strong bias in favor of states with a low energy, but the time required to reach equilibrium may be long. At higher temperatures the bias is not so favorable, but equilibrium is reached faster. The difficulty of jumping out of a local energy minimum depends on the heights of the energy barriers separating it from other minima: at high temperatures these barriers are easily jumped, and lowering the temperature increases the time required to make the jump.
This parallel stochastic architecture, called the Boltzmann machine (Fahlman et a1 1983), is generally applicable to constraint satisfaction problems and other problems in perceptual inference (Hinton and Sejnowski 1983). A learning algorithm has been developed for improving the performance of a Boltzmann machine with experience in the task domain (Ackley et a1 1985; Sejnowski et a1 1986), but this learning algorithm will not be discussed further in this paper.
206 P K Kienker, T J Sejnowski, G E Hinton, L E Schurnacher
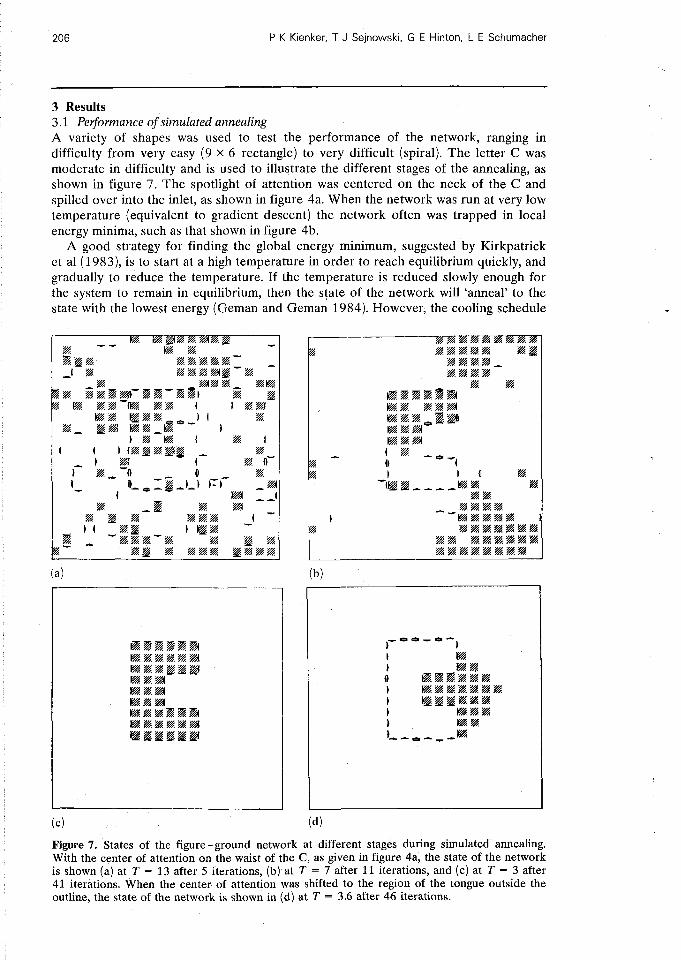
3 Results 3.1 Performance of simulated annealing A variety of shapes was used to test the performance of the network, ranging in difficulty from very easy (9 x 6 rectangle) to very difficult (spiral). The letter C was moderate in difficulty and is used to illustrate the different stages of the annealing, as shown in figure 7. The spotlight of attention was centered on the neck of the C and spilled over into the inlet, as shown in figure 4a. When the network was run at very low temperature (equivalent to gradient descent) the network often was trapped in local energy minima, such as that shown in figure 4b.
A good strategy for finding the global energy minimum, suggested by Kirkpatrick et a1 (1983), is to start at a high temperature in order to reach equilibrium quickly, and gradually to reduce the temperature. If the temperature is reduced slowly enough for the system to remain in equilibrium, then the state of the network will 'anneal' to fhe state with the lowest energy (Geman and Geman 1984). However, the cooling schedule
Figure 7. States of the figure-ground network at different stages during simulated annealing. With the center of attention on the waist of the C, as given in figure 4a, the state of the network is shown (a) at T = 13 after 5 iterations, (b) at T = 7 after 11 iterations, and (c) at T = 3 after 41 iterations. When the center of attention was shifted to the region of the tongue outside the outline, the state of the network is shown in (d) at T = 3.6 after 46 iterations.
Separating figure from ground
required to reach the global minimum depends on the shape of the energy landscape, and not all problems can be efficiently solved using simulated annealing.
The following annealing schedule was found to be effective in achieving the correct separation of figure from ground for many shapes:
(i) Start the network in a random state at temperature T = 20. (ii) Perform 2000 random updates with the Metropolis algorithm. This will be called
one iteration since on average each unit is updated once. (iii) If the energy is the global energy minimum (previously determined) then stop. (iv) If 4 < T < 20, multiply T by 0.9 and return to step (ii).
If 1 < T < 4, multiply by 0.99 and return to step (ii). If T < 1, then stop.
This schedule allows up to 148 iterations to occur. The annealing was usually terminated earlier because the correct solution was achieved, often at a temperature that was still fairly high('). If the global energy minimum was not achieved by the end of the cooling schedule then the run was considered a failure. The performance of the network for a particular input was tested by annealing 1000 times and finding the median number of iterations required to reach the correct solution. For an unknown shape, the global energy would not be given a priori as provided in this testing procedure and the annealing schedule would be allowed to run its course.
The correct solution was found most of the time when the above annealing schedule was followed. At the high temperatures shown in figure 7a the relatively weak bias provided by the spotlight of attention had little effect compared to the random fluc- tuations in the figure units. The edge units on the boundary of the C, even at this high temperature, have a strong tendency to be on, reflecting the strong input from the image. However, many pairs of edges are on simultaneously and there is not yet any tendency for the edges to align toward the inside. As the temperature falls, isolated figure units coalesce into islands both inside the C and outside of it, as shown in figure 7b; however only the ones on the inside are stabilized by the edge units, and the islands on the outside always 'evaporate'. The decision whether or not to fill in the inlet was some- times made quite late in the cooling schedule, reflecting the difficulty in resolving the conflicting constraints that must be satisfied. Toward the end of the cooling schedule the figure units on the inside filled in the remaining holes, as in figure 7c, though small inconsistencies sometimes remained for a long time. When the center of attention was moved to the outside of the outline, figure - ground reversals occurred, as shown in the bottom right panel of figure 7d where the center of attention was located just outside the tongue of the C.
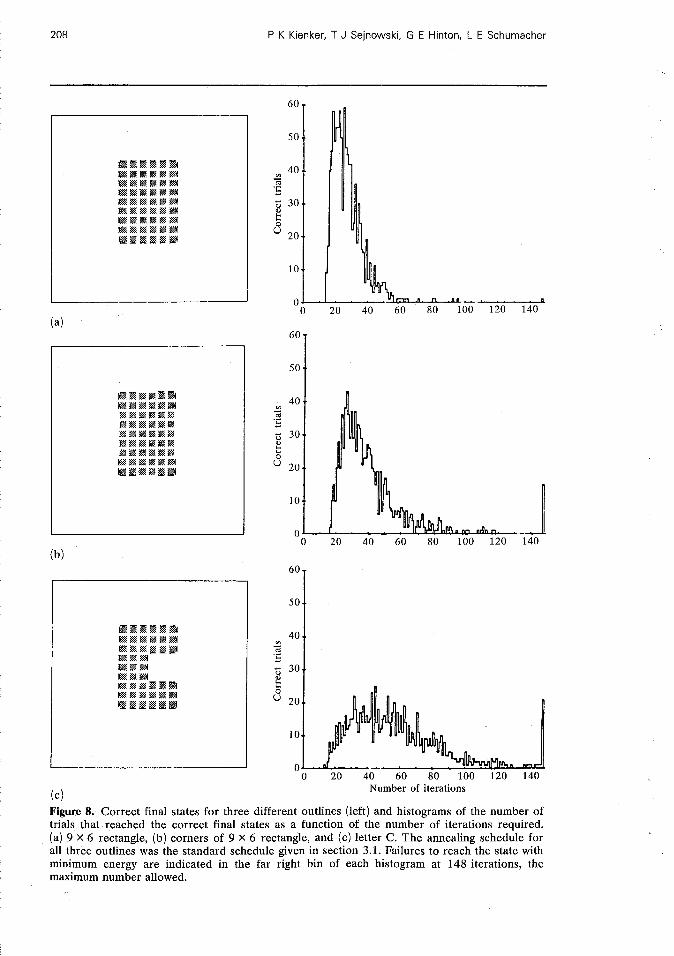
Histograms giving the performance of the annealing algorithm on several shapes of input figures are given in figure 8. Some failures occurred, but the overall performance was good. In general, the more complex the shape the more iterations were required to reach the correct solution, and the higher the variance in the distribution. Discon- tinuous outlines also took longer, although one or two missing edges caused only a small degradation. In figure 8b, only the corners of the rectangle were provided, yet the network was able to find the most plausible completion with less than half of the edges remaining in the rectangle.
Although the network was able to deal successfully with incomplete outlines, edges were not spontaneously generated to fill in the gaps. When the weights were adjusted to fill in the gaps, the performance of the network on simpler problems was hampered
(')Terminating the annealing as soon as the solution is achieved seldom affects the final outcome. If allowed to continue, the network does not fluctuate far from the correct solution and almost always returns to it. This behavior indicates that the global solution is a fairly deep energy minimum.
208 P K Kienker, T J Sejnowski, G E Hinton, L E Schumacher
Number of iterations
Figure 8. Correct final states for three different outlines (left) and histograms of the number of trials that reached the correct final states as a function of the number of iterations required. (a) 9 X 6 rectangle, (b) corners of 9 x 6 rectangle, and (c) letter C. The annealing schedule for all three outlines was the standard schedule given in section 3.1. Failures to reach the state with minimum energy are indicated in the far right bin of each histogram at 148 iterations, the maximum number allowed.
Separating figure from ground
because edge units spontaneously stabilized islands of figure units that should not have been stabilized, and prevented figure units from properly filling in regions.
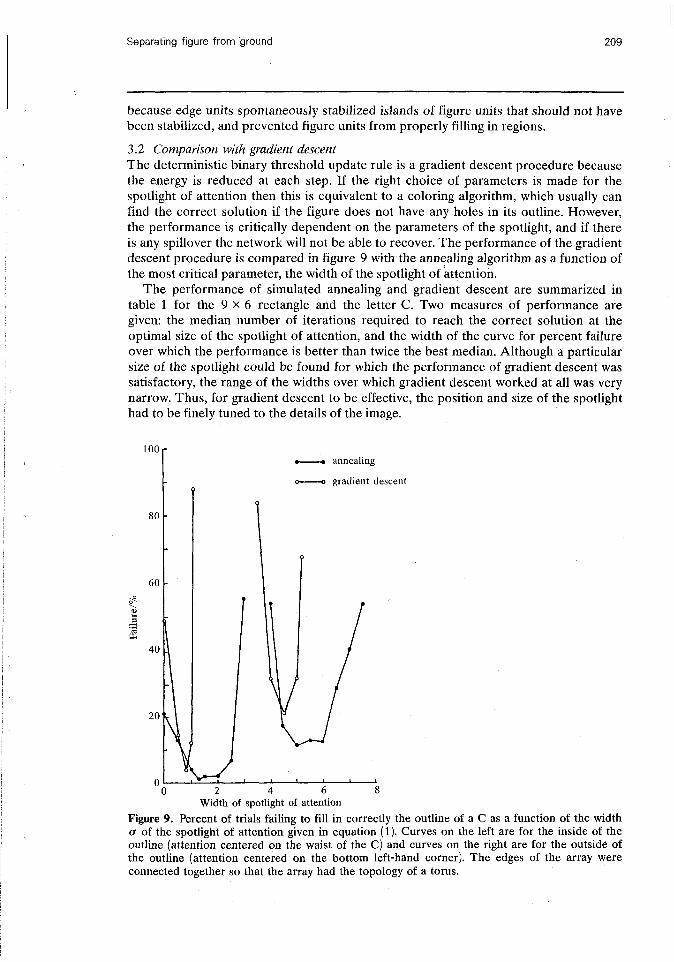
3.2 Comparison with gradient descent The deterministic binary threshold update rule is a gradient descent procedure because the energy is reduced at each step. If the right choice of parameters is made for the spotlight of attention then this is equivalent to a coloring algorithm, which usually can find the correct solution if the figure does not have any holes in its outline. However, the performance is critically dependent on the parameters of the spotlight, and if there is any spillover the network will not be able to recover. The performance of the gradient descent procedure is compared in figure 9 with the annealing algorithm as a function of the most critical parameter, the width of the spotlight of aqention.
The performance of simulated annealing and gradient descent are summarized in table 1 for the 9 x 6 rectangle and the letter C . Two measures of performance are given: the median number of iterations required to reach the correct solution at the optimal size of the spotlight of attention, and the width of the curve for percent failure over which the performance is better than twice the best median. Although a particular size of the spotlight could be found for which the performance of gradient descent was satisfactory, the range of the widths over which gradient descent worked at all was very narrow. Thus, for gradient descent to be effective, the position and size of the spotlight had to be finely tuned to the details of the image.
- annealing - gradient descent
Width of spotlight of attention
Figure 9. Percent of trials failing to fill in correctly the outline of a C as a function of the width a of the spotlight of attention given in equation (1). Curves on the left are for the inside of the outline (attention centered on the waist of the C) and curves on the right are for the outside of the outline (attention centered on the bottom left-hand corner). The edges of the array were connected together so that the array had the topology of a torus.
21 0 P K Kienker, T J Sejnowski, G E Hinton, L E Schurnacher
Table 1. Performance of gradient descent versus annealing.
Outline Focus of Gradient descent Simulated annealing attention
best range of a at best range of a at mediana twice best median mediana twice best median
9 X 6 rectangle inside 12 0.9 24 2.5 outside 15 1.1 3 8 3.0
Letter C inside 37 0.4 53 2.5 outside 32 1.1 67 3.2
Wedian number of iterations required to reach the correct solution at the optimal size of the spotlight of attention.
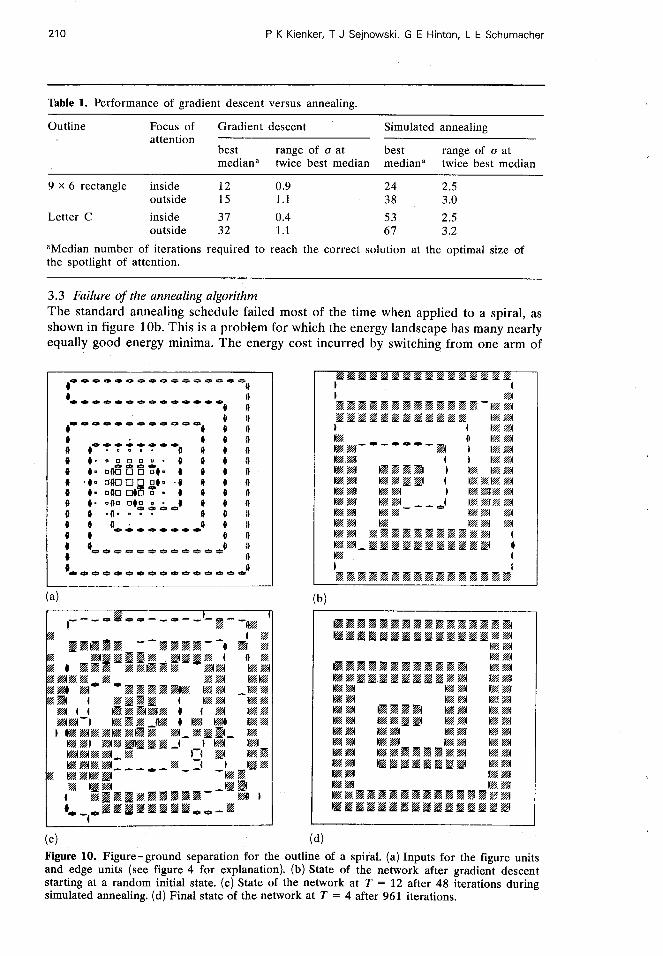
3.3 Failure of the annealing algorithm The standard annealing schedule failed most of the time when applied to a spiral, as shown in figure lob. This is a problem for which the energy landscape has many nearly equally good energy minima. The energy cost incurred by switching from one arm of
Figure 10. Figure-ground separation for the outline of a spiral. (a) Inputs for the figure units and edge units (see figure 4 for explanation). (b) State of the network after gradient descent starting at a random initial state. (c) State of the network at T = 12 after 48 iterations during simulated annealing. (d) Final state of the network at T = 4 after 961 iterations.
Separating figure from ground 21 1
the spiral to the adjoining arm is very small. This problem is also very difficult for humans, and typically requires several fixations to patch together smaller continuous regions. There apparently is a level of complexity that even our visual systems cannot handle in a single parallel step.
In principle, the spiral could be solved in a single annealing if the cooling schedule were slow enough, as shown by Geman and Geman (1984). Consequently, we modified the schedule given in section 3.1 by exponentially decrementing the temperature by 0.999 on each iteration from an initial temperature of 12. Figure 10c shows the state of the network at an intermediate temperature during the very slow annealing schedule, and figure 10d shows the final state of the network; the correct solution was obtained in 17/20 trials.
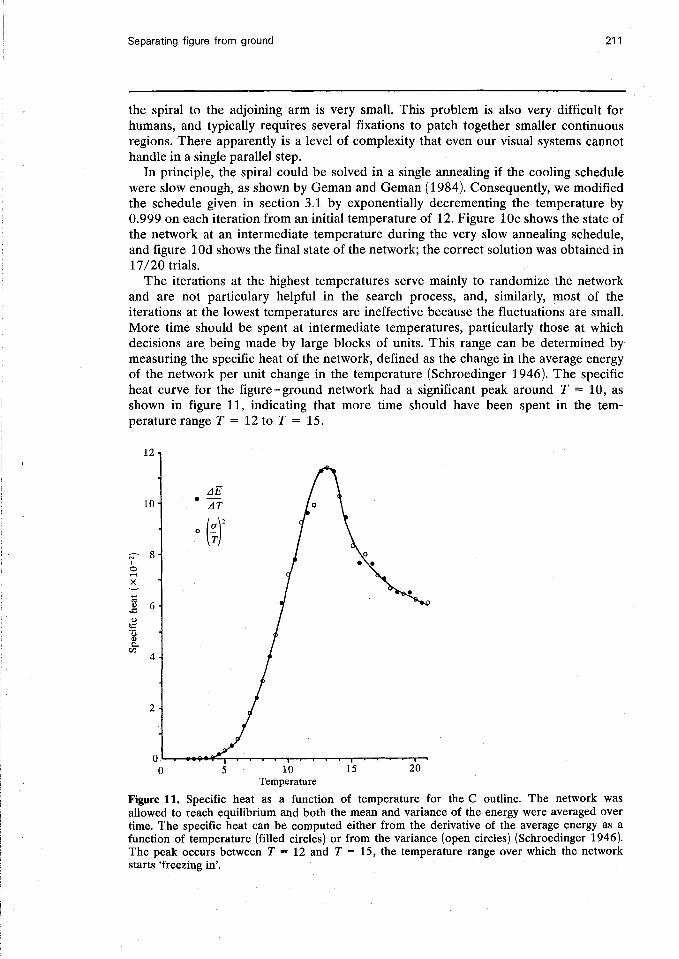
The iterations at the highest temperatures serve mainly to randomize the network and are not particulary helpful in the search process, and, similarly, most of the iterations at the lowest temperatures are ineffective because the fluctuations are small. More time should be spent at intermediate temperatures, particularly those at which decisions are being made by large blocks of units. This range can be determined by measuring the specific heat of the network, defined as the change in the average energy of the network per unit change in the temperature (Schroedinger 1946). The specific heat curve for the figure-ground network had a significant peak around T = 10, as shown in figure 11, indicating that more time should have been spent in the tem- perature range T = 12 to T = 15.
Temperature
Figure 11. Specific heat as a function of temperature for the C outline. The network was allowed to reach equilibrium and both the mean and variance of the energy were averaged over time. The specific heat can be computed either from the derivative of the average energy as a function of temperature (filled circles) or from the variance (open circles) (Schroedinger 1946). The peak occurs between T = 12 and T = 15, the temperature range over which the network starts 'freezing in'.
21 2 P K Kienker, T J Seinowski, G E Hinton, L E Schumacher
- ---
3.4 Nonuniformity, simultaneity, and delay Some of the assumptions that have been made are not likely to be strictly true in a real physical system, so we attempted to test the sensitivity of the results to several of these assumptions. For example, the assumption that all of the processing units are always at the same temperature was tested by introducing variability into the temperature in two different ways. In the first test, a random factor uniformly distributed between 0.5 and 1.0 was assigned to every unit. During the annealing procedure the temperature of each unit was multiplied by this random factor, which was kept constant through the annealing. In a second test, a new random factor was chosen for each unit before each update.
The performance of the network was not significantly affected by either of these procedures. The only anomaly was an occasional unit that would become locked into an incorrect state because it had been assigned a low temperature factor; otherwise, the effect of the randomness in the temperature fluctuations was inconsequential compared with the other sources of randomness in the update algorithm. The test with a constant temperature factor was also a test of random variations in the weights, because, in the update algorithm, multiplying the temperature for a unit by a factor k is equivalent to multiplying all the weights, inputs, and the threshold of the unit by k-l. This also shows that the performance of the system is not sensitive to the assumption of perfect symmetry of the interactions.
In some simulations synchronous updates of the processing units and transmission delays were both included to test the sensitivity of the performance to the assumption that updates were asynchronous and transmission was instantaneous. The effect of simultaneous updates was negligible even when up to half the units were updated at the same time. This is in part a consequence of the local connectivity: two units that do not have a direct connection between them can be simultaneously updated without violating the Markov assumption that the updates occur independently. In contrast, the effect of transmission delay was very significant and state dependent.
We tested the effect of delay by introducing a delay of 2000 updates (one iteration of the network) between probing a unit and transmission of the new state to neighboring units. At low temperatures the effect of delay was less pronounced because the rate of flipping is lower; if a unit did not flip when its state was updated then delay had no consequence. However, at high temperature the rate of flipping was high and the effect of the delay was effectively to add more noise to the update algorithm. Even when running the network at a constant low temperature, T = 1, and starting from a random state, the noise introduced by the delay was sufficient to overcome local energy minima and find the correct solution. The state dependence of the effective temperature introduced by the delay was thus able to mimic simulated annealing, as suggested to us by Francis Crick (personal communication).
4 Neural networks The binary units used in the model share some properties with neurons, such as the summation of excitatory and inhibitory inputs and a threshold, but the binary output does not resemble an action potential because it is a sustained value of 1 or 0 rather than a spike. If, however, the average time between updates is identified with the average duration of a postsynaptic potential then the shape of the output between updates can be considered an approximation to the shape of postsynaptic potentials. Thus, the output of a unit can be identified with postsynaptic potentials rather than with action potentials if for each postsynaptic unit we scale the magnitude of the output by the weight of the connection.
How can the probabilistic update algorithm be implemented by neurons, and in particular, how can the temperature be controlled? The membrane potential of a
Separating figure from ground 21 3
neuron is graded, but if it exceeds a fairly sharp threshold an action potential is produced followed by a refractory period lasting several milliseconds, during which another action potential cannot be elicited. If Gaussian noise is added to the membrane potential, then even if the total synaptic input is below threshold, there is a finite probability that the membrane potential will reach threshold. The amplitude of the Gaussian noise will determine the width of the sigmoidal probability distribution for the neuron to fire during a short time interval, and it therefore plays the role of temperature in the model. Surprisingly, a cumulative Gaussian is a very good approximation to the required probability distribution, never differing by more than about 2% over the entire range of inputs.
Intracellular recordings in the central nervous system reveal stochastic variability in the membrane potential of most neurons, in part due to fluctuations in the transmitter released by presynaptic terminals. Other sources of noise may also be present and could be controlled by cellular mechanisms (Verveen and Derksen 1968; Holden 1976). If some sources of noise in the central nervous system are gated or modulated, it should be possible to identify them experimentally. For example, the noise could be regularly cycled and this would be apparent in the massed activity. Alternatively, noise may always be present at a low level and be increased irregularly whenever there is an identified need.
In the visual cortex of primates, single neurons respond to the same visual stimulus with different sequences of action potentials on each trial (Sejnowski 1981, 1986). In order to measure a repeatable response, spike trains are typically averaged over ten trials. The result, called the poststimulus time histogram, gives the probability for a spike to occur as a function of the time after the onset of the stimulus. However, this averaging procedure filters out all information about the variance of the noise, so that there is no way to determine whether the noise varies systematically during the response to the stimulus or perhaps on a longer time scale, while the stimulus is being attended to. Such measurements of the noise variance over a range of time scales could provide evidence that this parameter has an active role in neural processing.
Neurophysiologists typically average the spike train from a neuron to reduce the variability in the pattern of spikes. Under stationary conditions the spike train can be averaged over time to obtain a time-averaged firing rate, but during nonstationary conditions the ensemble average of spike trains must be used to obtain a poststimulus time histogram. These two methods of averaging represent two ways to view the sigmoidal probability function used to update units (figure 6): over a short time interval it represents the probability for a single unit to fire, and can be estimated by the poststimulus time histogram; over longer time intervals and stationary conditions, it represents the time-average firing rate of a unit. However, the time-average firing rate of a neuron cannot be accurately measured over short time intervals, particularly during nonstationary conditions, which suggests that the probabilistic interpretation of spike firing defined as an ensemble average may be of more general usefulness than the time- average firing rate.
Our analysis depended on the symmetric connectivity of the network. Symmetric connections appear in many network models that perform constraint satisfaction by optimization (Marr and Poggio 1976; Ballard et a1 1983; Hopfield and Tank 1985). Symmetric connectivity stabilizes processing in networks and might be found where stability is essential. Lateral inhibition is common in many areas of the brain and is generally symmetric, but evidence for symmetric excitatory connections is weak. Recurrent collaterals from projection neurons could provide reciprocal excitation, but a test of the symmetry assumption will await a more detailed knowledge of connectivity between neurons in the visual system.
21 4 P K Kienker, T J Sejnowski, G E Hinton, L E Schumacher
5 Discussion Whether a particular patch in an image is part of the figure or ground depends on global patterns in the image and on what is being attended. This problem cannot be solved without several iterations of the network because the global information must be propagated through local interactions. In general it is not possible to predict whether a nonlinear network will converge to the correct state, but in the special case of a symmetric network and stochastic updating it is now possible to construct and study particular networks that are guaranteed to solve global problems such as figure -ground separation.
The performance of simulated annealing in separating figure from ground in the parallel network presented here compares favorably with that of gradient descent. Although many iterations are generally required to achieve a solution, the effective time is only a few hundred milliseconds, if each iteration can be performed in a few milli- seconds. The chief advantage of simulated annealing is an increase in the robustness of the network to noise in the inputs, such as missing segments in the outline and variation in the size and position of the attentional spotlight. Most of the benefit of simulated annealing can be obtained from running the network at a constant moderate tem- perature, so that temperature control is not crucial for effective use of stochastic relaxation.
Our network model of figure -ground separation is much too simplified to serve as a model for how this computation is performed in the nervous system. A more realistic network model would need to take into account a greater range of orientations and multiple levels of resolution (Rosenfeld and Vanderbrug 1977; Hanson and Riseman 1978; Marr and Poggio 1979; Terzopoulos 1984). It would also have to introduce distinctions between low-level edge labeling and higher-level attentional phenomena that have been glossed over in the examples presented here. However, general features of more sophisticated models may already be reflected in this simple network model. Other relaxation schemes that attempt to find globally optimal solutions with local connectivity also have the problem of getting trapped in local optima. The addition of noise to the processing units might be helpful to many of these algorithms.
The model of figure-ground separation only used information from the outlines of figures. Other cues, such as optical flow, may also provide information for separating figure from ground, which would require other modules. We can analyze the per- formance of several modules working together in parallel by simply adding together their energy functions. One of the consequences of this additivity is that different sources of evidence are weighed together linearly. Sperling and his colleagues have recently shown that several factors affecting the perception of depth in a rotating wire cube, including proximity, luminance, and perspective, are linearly additive (Dosher et a1 1986). This result is in agreement with our approach and suggests that linear additivity of evidence may be a general property of perceptual systems (Sperling et a1 1983).
During the relaxation of the network the inputs were kept fixed as well as all the weights and parameters in the network. The perception of ambiguous figures such as Rubin's vase in figure 1 usually undergoes spontaneous reversal which we have not attempted to model. One possible extension of the model would be to incorporate fatigue into the weights or some other change to the parameters on a time scale greater than the relaxation time of the network. This approach has been taken by Kawamoto and Anderson (1985) to model spontaneous reversal in the perception of the Necker cube.
Simulated annealing has been useful in solving difficult NP-complete problems (Kirkpatrick et a1 1983; Johnson et a1 1985) and it has also been applied to problems such as image restoration (Geman and Geman 1984). However, it can be a very slow
Separating figure from ground 21 5
procedure and may not be the method of choice if a better algorithm is known. We have shown in this paper that a parallel implementation of simulated annealing can be very effective, reasonably efficient, and more robust than gradient descent in separating figure from ground for simple outlines. This architecture may be applicable to a wide variety of problems in perception that require the simultaneous satisfaction of a very large number of constraints (Hinton and Sejnowski 1983).
References Ackley D H, Hinton G E, Sejnowski T J, 1985 "A learning algorithm for Boltzmann Machines"
Cognitive Science 9 147 - 16 9 Arbib M A, 1975 "Artificial intelligence and brain theory: Unities and diversities" Annals of
Biomedical Engineering 3 238 - 274 Attneave F, 1982 "Pragnanz and soap-bubble systems: a theoretical exploration" in Organization
and Representation in Perception ed J Beck (Hillsdale, NJ: Lawrence Erlbaum Associates) pp 11-29
Ballard D H, Hinton G E, Sejnowski T J, 1983 "Parallel visual computation" Nature (London) 306 21 -26
Barrow H G, Tenenbaum J M, 1978 "Recovering intrinsic scene characteristics from images" in Computer Vision Systems eds A R Hanson, E M Riseman (New York: Academic Press) pp 3-26
Binder K, 1978 The Monte-Carlo Method in Statistical Physics (New York: Springer) Cerny V, 1983 "Multiprocessor system as a statistical ensemble: a way towards general-purpose
parallel processing and mind computers?" preprint, Institute of Physics and Biophysics, Camenius University, Bratislava, Czechoslovakia
Cohen M A, Grossberg S, 1984 "Neural dynamics of brightness perception: features, boundaries, diffusion and resonance" Perception & Psychophysics 31 428 - 456
Danker A J, Rosenfeld A, 1981 "Blob detection by relaxation" IEEE Transactions on Pattern Analysis and Machine Intelligence 3 79 - 92
Dev P, 1975 "Perception of depth surfaces in random-dot stereograms: a neural model" Znter- national Journal of Man - Machine Studies 7 5 1 1 - 528
Dosher B A, Sperling G, Wurst S, 1986 "Tradeoffs between stereopsis and proximity luminance covariance as determinants of perceived 3D structure" Vision Research (in press)
Fahlman S E, Hinton G E, Sejnowski T J, 1983 "Massively-parallel architectures for AI: NETL, THISTLE and Boltzmann Machines" in Proceedings of the National Conference on Artijicial Intelligence (Washington, DC: William Kauffman) pp 109 - 11 3
Feldman J A, Ballard D H, 1982 "Connectionist models and their properties" Cognitive Science 6 205 - 254
Geman S, Geman D, 1984 "Stochastic relaxation, Gibbs distributions, and the Baysian restoration of images" IEEE Transactions on Pattern Analysis and Machine Intelligence 6 72 1 - 741
Gibson J J, 1966 The Senses Considered as Perceptual Systems (Boston, MA: Houghton-Mifflin) Gregory R L, 1970 The Intelligent Eye (New York: McGraw-Hill) Hanson A R, Riseman E M (eds), 1978 "Segmentation of natural scenes" in Computer Vision
Systems (New York: Academic Press) pp 129 - 163 Helmholtz H von, 1909/1962 Physiological Optics volume 3 (New York: Dover, 1962); English
transation by J P C Southall for the Optical Society of America (1924) from the 3rd German edition of Handbuch derphysiologischen Optik (Hamburg: Voss, 1909)
Hinton G E, Sejnowski T J, 1983 "Optimal perceptual inference" in Proceedings of the IEEE Computer Society Conference on Computer Vision and Pattern Recognition (Washington DC: IEEE Computer Society Press) pp 448 - 453
Holden AV, 1976 Models of the Stochastic Activity of Neurones Lecture Notes in Biomathe- matics 12 (Berlin: Springer)
Hopfield J J, 1982 "Neural networks and physical systems with emergent collective computa- tional abilities" Proceedings of the National Academy of Sciences of the United States of America 79 2554-2558
Hopfield J J, Tank D W, 1985 "'Neural' computation of decision in optimization problems" , Biological Cybernetics 52 141 - 152
Hummel R A, Zucker S W, 1983 "On the foundations of relaxation labeling processes" IEEE Transactions on Pattern Analysis and Machine Intelligence 5 267 - 287
Johnson D S, Aragon C R, McGeoch L A, Schevon C, 1985 "Optimization by simulated anneal- ing: and experimental evaluation" (unpublished manuscript)
P K Kienker, T J Sejnowski, G E Hinton, L E Schumacher
Julesz B, 1971 Foundations of Cyclopean Perception (Chicago, IL: University of Chicago Press) Kawamoto A, Anderson J A, 1985 "A neural network model of multistable perception" Acta
Physiologica 59 3 5 - 6 3 Kirkpatrick S, Gelatt D D, Vecchi M P, 1983 "Optimization by simulated annealing" Science 220
671 -680 Marr D, 1982 Vision (San Francisco, CA: Freeman) Marr D, Palm G, Poggio T, 1978 "Analysis of a cooperative stereo algorithm" Biological Cyber-
netics 28 223 -239 Marr D, Poggio T, 1976 "Cooperative computation of stereo disparity" Science 194 283 -287 Marr D, Poggio T, 1979 "A computational theory of human stereo vision" Proceedings of the Royal
Society of London, Series B 204 30 1 - 328 McCulloch W S, Pitts W H, 1943 "A logical calculus of ideas immanent in nervous activity"
Bulletin of Mathematical Biophysics 5 1 1 5 - 13 3 Metropolis N, Rosenbluth A, Rosenbluth M, Teller A, Teller E , 1953 "Equation of state cal-
culations by fast computing machines" Journalof ChernicalPhysics 21 1087 - 1092 Mountcastle V B, 1979 "An organizing principle for cerebral function: The units module and the
distributed system" in The Neurosciences Fourth Study Program eds F 0 Schmitt, F G Worden (Cambridge, MA: MIT Press) pp 2 1 - 42
Peleg S, 1980 "A new probabilistic relaxation scheme" IEEE Transactions on Pattern Analysis and Machine Intelligence 2 362 - 369
Prager J M, 1980 "Extracting and labeling boundary segments in natural scenes" IEEE Trans- actions on Pattern Analysis and Machine Intelligence 2 16 - 27
Rock I, 1983 The Logic of Perception (Cambridge, MA: MIT Press) Rosenfeld A, Vanderbrug G J, 1977 IEEE Transactions on Systems, Man and Cybernetics 7
104- 107 Rubin E, 1915 Synsoplevede Figurer (Copenhagen: Gyldendal, Nordisk Forlag) [German edition:
1921 Visuell Wahrgenommene Figuren (Copenhagen: Gyldendalske Boghandel)] Schroedinger E, 1946 Statistical Thermodynamics (Cambridge: Cambridge University Press) Schulten K, 1986 in Disordered Systems and Biological Organization eds F Fogelman, F Weisbuch,
E Bienenstock (Berlin: Springer) Sejnowski T J, 1981 "Skeleton filters in the brain" in Parallel Models of Associative Memory eds
J A Anderson, G E Hinton (Hillsdale, NJ: Lawrence Erlbaum Associates) pp 189 - 2 12 Sejnowski T J, 1986 "Open questions about computation in cerebral cortex" in Parallel Distrib-
uted Processing: Explorations in the Microstructure of Cognition volume 2 Applications eds J L McClelland, D E Rumelhart (Cambridge, MA: MIT Press) pp 372- 389
Sejnowski T J, Hinton G E, 1986 "Separating figure from ground with a Boltzmann Machine" in Vision, Brain and Cooperative Computation eds M A Arbib, A R Hanson (Cambridge, MA: MIT Press)
Sejnowski T J, Kienker P K, Hinton G E, 1986 "Learning symmetry groups with hidden units: Beyond the perceptron" Physica D in press
Smolensky P, 1983 "Schema selection and stochastic inference in modular environments" in Proceedings of the National Conference on Artificial Intelligence (Washington, DC: William Kauffman) pp 378 - 382
Sperling G, 1970 "Binocular vision: A physical and neural theory" Journal of American Psychology 83 461-534
Sperling G, Pave1 M, Cohen Y, Landy M S, Schwartz B, 1983 "Image processing in perception and cognition" in Physical and Biological Processing of Images eds 0 J Braddick, A C Sleigh (Berlin: Springer) pp 359 - 378
Terzopoulos D, 1984 Multiresolution Computation of Visible-Surface Representations PhD thesis, MIT, Cambridge, MA, USA
Ullman S, 1984 "Visual routines" Cognition 18 97 - 159 Verveen A A, Derksen H E, 1968 "Fluctuation phenomenon in nerve membranes" Proceedings of
the IEEE 56 906-916 Waltz D, 1975 "Understanding line drawings of scenes with shadows" in The Psychology of
Computer Vision ed P H Winston (New York: McGraw-Hill) pp 19 - 91 Zucker S W, Hummel R A, 1979 "Toward a low-level description of dot clusters: labeling edge,
interior and noise points" Computer Graphics and Image Processing 9 21 3 - 233 '
O 1986 a Pion publication printed in Great Britain