sensory evaluation of ice cream made with prebiotic ingredients
TRANSCRIPT
University of Nebraska - LincolnDigitalCommons@University of Nebraska - Lincoln
Nutrition & Health Sciences Dissertations & Theses Nutrition and Health Sciences, Department of
2-2011
SENSORY EVALUATION OF ICE CREAMMADE WITH PREBIOTIC INGREDIENTSSUBSTITUTED FOR SUGARJennifer M. WoodUniversity of Nebraska - Lincoln, [email protected]
Follow this and additional works at: http://digitalcommons.unl.edu/nutritiondiss
Part of the Dietetics and Clinical Nutrition Commons
This Article is brought to you for free and open access by the Nutrition and Health Sciences, Department of at DigitalCommons@University ofNebraska - Lincoln. It has been accepted for inclusion in Nutrition & Health Sciences Dissertations & Theses by an authorized administrator ofDigitalCommons@University of Nebraska - Lincoln.
Wood, Jennifer M., "SENSORY EVALUATION OF ICE CREAM MADE WITH PREBIOTIC INGREDIENTS SUBSTITUTEDFOR SUGAR" (2011). Nutrition & Health Sciences Dissertations & Theses. Paper 18.http://digitalcommons.unl.edu/nutritiondiss/18
SENSORY EVALUATION OF ICE CREAM MADE WITH PREBIOTIC
INGREDIENTS SUBSTITUTED FOR SUGAR
By
Jennifer M. Wood
A THESIS
Presented to the Faculty of
The Graduate College at the University of Nebraska
In Partial Fulfillment to the Requirements
For the Degree of Master of Science
Major: Nutrition
Under the Supervision of Professor Julie A. Albrecht
Lincoln, Nebraska
February, 2011
SENSORY EVALUATION OF ICE CREAM MADE WITH PREBIOTIC
INGREDIENTS SUBSTITUTED FOR SUGAR
Jennifer May Wood, M.S.
University of Nebraska 2011
Adviser: Julie Albrecht
Prebiotics are non-digestible food ingredients that beneficially affect the host by
selectively stimulating growth and/or activity of beneficial bacteria in the colon. The
project objective was to determine consumer acceptability of ice cream with prebiotic
ingredients substituted for part of the sugar and to determine sensory attributes of
sweetness, smoothness, and vanilla flavor. A commercial ice cream mix was made
substituting 0%, 10%, 20%, or 30% of the sugar for either Fructooligosaccharides (FOS)
or inulin. Sensory analyses were conducted using 95 non-trained panelists. Overall
consumer acceptability and sensory attributes were measured on a 175 mm anchored
hedonic scale. When 10% and 20% inulin ice cream were compared to the control (0%),
no significant differences in sweetness, smoothness, vanilla flavor or overall acceptability
were found (P < 0.05). The 30% inulin ice cream was significantly less sweet than the
control and 10% and 20% inulin ice cream, less smooth and less vanilla flavor than the
control, and less acceptable than the control and 10% inulin ice cream (P < 0.05). For
10% and 20% FOS ice cream, no significant differences were found in sweetness,
smoothness, vanilla flavor or overall acceptability compared to the control (P < 0.05).
The 30% FOS ice cream was significantly less sweet than 10% FOS ice cream but not
significantly different than the control or 20% FOS ice cream (P < 0.05). The 30% FOS
ice cream was significantly less smooth than the control, 10% and 20% FOS (P < .05).
Vanilla flavor was not significantly different. Overall acceptability was significantly less
for 30% FOS compared to the control and 10% FOS ice cream but not significantly
different than 20% FOS (P < .05). These results suggest that FOS and inulin may be
acceptable ingredients in ice cream when substituted for up to 20% of the sugar.
i
Acknowledgements
I would like to thank Laurie Keeler, Senior Manager for Food Technology Transfer of
University of Nebraska-Lincoln Food Processing Center for her technical expertise in ice
cream production and David Girard, Research Technologist for his assistance during
sensory evaluation.
ii
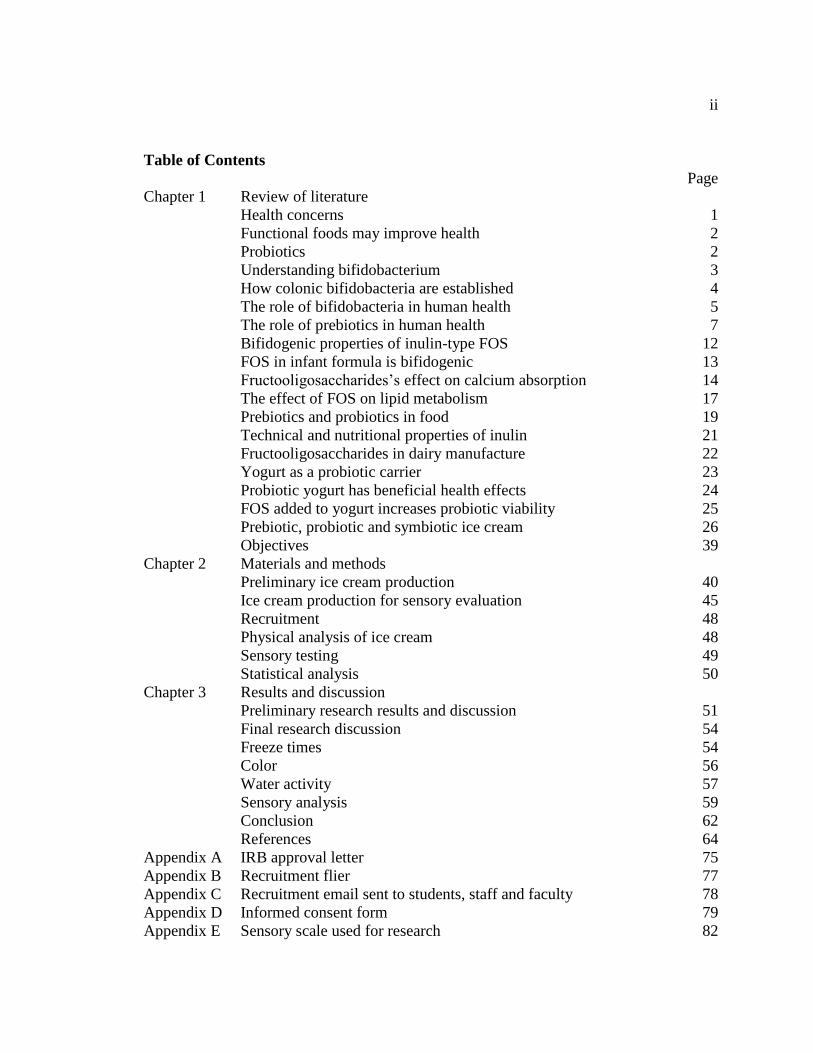
Table of Contents
Page
Chapter 1 Review of literature
Health concerns 1
Functional foods may improve health 2
Probiotics 2
Understanding bifidobacterium 3
How colonic bifidobacteria are established 4
The role of bifidobacteria in human health 5
The role of prebiotics in human health 7
Bifidogenic properties of inulin-type FOS 12
FOS in infant formula is bifidogenic 13
Fructooligosaccharides’s effect on calcium absorption 14
The effect of FOS on lipid metabolism 17
Prebiotics and probiotics in food 19
Technical and nutritional properties of inulin 21
Fructooligosaccharides in dairy manufacture 22
Yogurt as a probiotic carrier 23
Probiotic yogurt has beneficial health effects 24
FOS added to yogurt increases probiotic viability 25
Prebiotic, probiotic and symbiotic ice cream 26
Objectives 39
Chapter 2 Materials and methods
Preliminary ice cream production 40
Ice cream production for sensory evaluation 45
Recruitment 48
Physical analysis of ice cream 48
Sensory testing 49
Statistical analysis 50
Chapter 3 Results and discussion
Preliminary research results and discussion 51
Final research discussion 54
Freeze times 54
Color 56
Water activity 57
Sensory analysis 59
Conclusion 62
References 64
Appendix A IRB approval letter 75
Appendix B Recruitment flier 77
Appendix C Recruitment email sent to students, staff and faculty 78
Appendix D Informed consent form 79
Appendix E Sensory scale used for research 82
iii
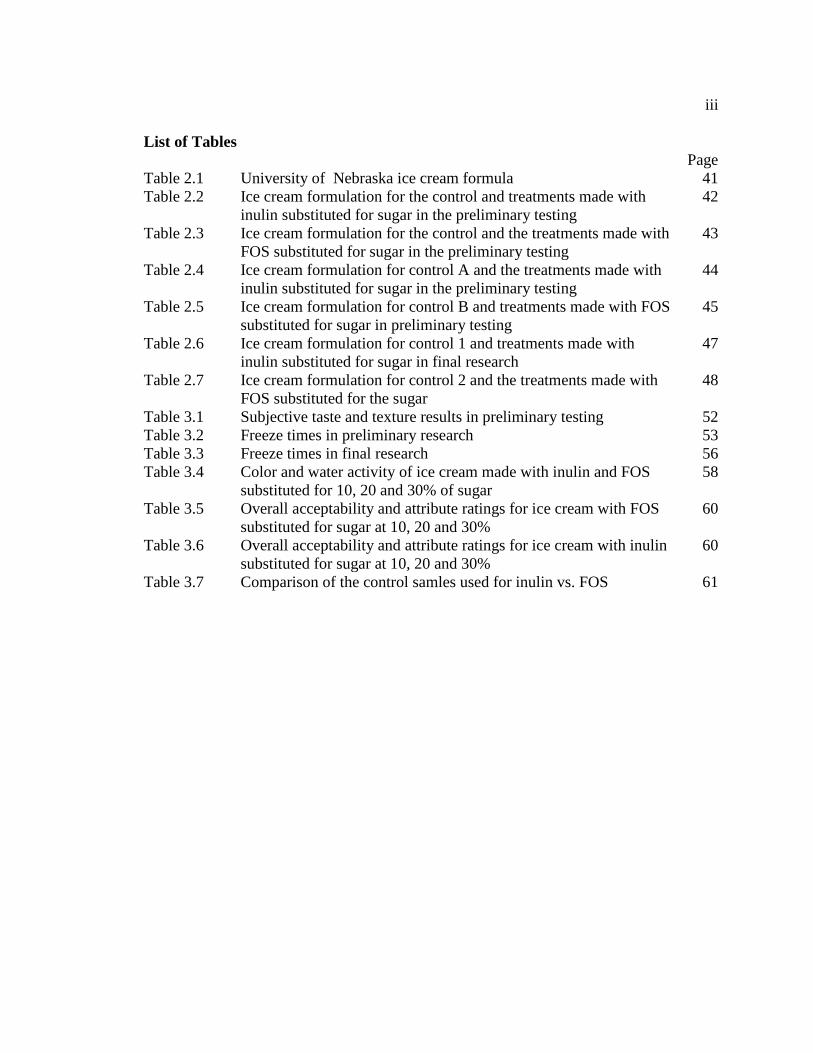
List of Tables
Page
Table 2.1 University of Nebraska ice cream formula 41
Table 2.2 Ice cream formulation for the control and treatments made with
inulin substituted for sugar in the preliminary testing
42
Table 2.3 Ice cream formulation for the control and the treatments made with
FOS substituted for sugar in the preliminary testing
43
Table 2.4 Ice cream formulation for control A and the treatments made with
inulin substituted for sugar in the preliminary testing
44
Table 2.5 Ice cream formulation for control B and treatments made with FOS
substituted for sugar in preliminary testing
45
Table 2.6 Ice cream formulation for control 1 and treatments made with
inulin substituted for sugar in final research
47
Table 2.7 Ice cream formulation for control 2 and the treatments made with
FOS substituted for the sugar
48
Table 3.1 Subjective taste and texture results in preliminary testing 52
Table 3.2 Freeze times in preliminary research 53
Table 3.3 Freeze times in final research 56
Table 3.4 Color and water activity of ice cream made with inulin and FOS
substituted for 10, 20 and 30% of sugar
58
Table 3.5 Overall acceptability and attribute ratings for ice cream with FOS
substituted for sugar at 10, 20 and 30%
60
Table 3.6 Overall acceptability and attribute ratings for ice cream with inulin
substituted for sugar at 10, 20 and 30%
60
Table 3.7 Comparison of the control samles used for inulin vs. FOS 61

iv
List of Figures
Figure 1.1 Fructan polysaccharide figure 9
1
Chapter 1. Review of Literature
Health Concerns
Western society is plagued with many degenerative diseases which may be directly
related to food intake (Jenkins and others 1980, Kirtchevsky and Tepper 1995).
Consumers have a desire for disease prevention. In a survey conducted by Gilbert and
Sloan (1998), consumers indicated that an improved immune system was a major health
concern (Gilbert and Sloan 1998, Niness 1999).
The microflora of the human gut is a major part of one’s immune system and there is a
growing interest in the role diet plays in the microbial composition of the intestinal tract
and the related health benefits. The human colonic flora consists of more than 400
bacterial species of which anaerobes outnumber aerobes (Bohunik 1996, Eckburg and
others 2005). There are two categories of colonic bacteria: 1) those that are desirable and
create unfavorable conditions for growth of pathogenic bacteria, such as Bifidobacterium,
Eubacterium and Lactobacillus, and 2) those that are undesirable or promote an
environment favorable for increased proliferation of pathogenic bacteria, such as
Clostridia, Escherichia, Salmonella and Campylobacter (Roberfroid 2001, Gibson and
Wang 1994, Ziemer and Gibson 1998). Factors that contribute to the health of the human
gastrointestinal tract are diet, gastrointestinal pH and host health, as well as competitive
inhibition and metabolic interactions among the various bacterial species.
2
Functional Foods May Improve Health
Functional foods provide a unique opportunity to contribute to well-being and health
because they provide benefits beyond adequate nutritional effects and may reduce the risk
of disease (Roberfroid 2002). The term, functional food, is used to describe nutrients that
have an effect on physiologic processes that is separate and distinct from those associated
with their role as nutrients (Koletzko and others 1998, Roberfroid 2000). Researchers in
the last few decades have demonstrated the health promoting benefits of prebiotics,
probiotics and symbiotic foods as functional foods. Symbiotic foods combine probiotics
and prebiotics in a food product, which together may promote health benefits for the
consumer or create increased functionality or desired qualities in the end food product. In
addition, the selection of food systems for the delivery of prebiotics and probiotics are
important factors to consider for viability and synergistic effect in functional foods.
Probiotics
A probiotic is defined as a live microbial feed supplement, which beneficially affects the
host animal by improving its intestinal microbial balance (Fuller 1989). Probiotics must
be able to be prepared on a large scale and must remain as a viable, live organism under
storage and be able to survive the intestinal ecosystem (Fuller 1991, 1992). Probiotics
have been consumed by human beings in the form of fermented foods for thousands of
years and have been considered helpful for bodily ailments and longevity (Lourens-
Hattingh and others 2001, Rasic 2003). Today, it is well accepted that daily intake of
probiotics helps maintain balanced intestinal flora and prevents gastrointestinal disorders.
3
Lactobacillus and Bifidobacterium and other species of microorganisms have been used
as probiotics for years, primarily in fermented dairy products (Boyle and Tang 2006).
There are concerns regarding the safety of probiotics outside the genera of Lactobacillus
and Bifidobacterium, since some of the other genera contain many pathogenic species,
particularly Enterococcus. Fermenting organisms such as Streptococcus salivarius subsp.
thermophilus and Lactobacillus delbrueckii subsp. bulgaricus used in yogurt production,
are generally considered fermenting organisms rather than probiotics by most scientists
because they are not expected to survive and grow in the host’s intestinal tract (Senok
and others 2005). Probiotic microorganisms may produce many health-promoting
metabolites and may suppress colonization of pathogenic organisms and metabolites that
are detrimental to human health.
Lactobacillus and Bifidobacteria are probiotics isolated from dairy products or from
human or animal intestinal tracts. In the U.S., probiotics are available in conventional
foods such as probiotic-cultured yogurt, dietary supplements and medical foods. Probiotic
foods worldwide also include cheese, juice, infant formula and cereals (Sanders 2006).
Understanding Bifidobacteria
Bifidobacteria are a natural part of the bacterial flora in the human body and have a
symbiotic bacteria-host relationship with humans. They primarily exist in the large
intestine and are one of the major genera of colonic microflora. First isolated in 1899
from a healthy breast-fed infant by Tissier of the Pasteur Institute in France,
4
Bifidobacteria are gram-positive, non-motile, often branched, anaerobic bacteria
(Ishibashi and others 1997). Currently about 30 Bifidobacteria species are known. The
Bifidobacterium species that inhabit the human intestinal tract are rather distinct from
those that inhabit the intestines of animals (Mitsuoka 1984). The representative species of
human origin include B. longum, B. breve, B bifidum, B. adoltescentis and B.
pseudocatenuatum. Representatives of animal-derived species include B. pseudolongum,
B. thermophilus and B. animalis.
How Colonic Bifidobacteria are Established
Before birth, the human fetus is germ-free and intestinal bacteria do not exist. When
humans are born, they are populated with mostly anaerobic bacteria from their mother’s
vaginal and fecal floral. From the time of birth, bacteria begin to colonize the intestinal
tract forming a complex system of intestinal microflora. Colonization is initially
determined by feeding modem, primarily breastfeeding versus formula feeding, but is
further determined through use of antibiotics and other pharmaceutical agents throughout
life. Bifidobacteria constitute over 95% of the intestinal flora in breast-fed infants
(Yoshioka and others 1991). They report that the number of Bifidobacteria in bottle-fed
infants is lower than that in breast-fed infants; nevertheless, even in bottle-fed infants,
Bifidobacteria remain the predominant bacteria.
Breast-fed infants have an increased resistance to infections compared to formula fed
infants. This may partly be attributed to the predominating Bifidobacteria in the intestinal
5
microflora of breast-fed infants. Bacteria, as measured in the feces of breast-fed infants
are almost exclusively Bifidobacteria (Ishibashi and others 1997, Yoshioka and others
1991). Human breast milk naturally contains prebiotic fructooligosaccharides (FOS),
which may contribute to the predominate Bifidobacteria in the intestines of breastfed
infants and perhaps their increased resistance to infections (Rotimi and Duerden 1981,
Gnoth and others 2000, Dai and Walker 2000). This is supported by research showing
that supplementation of prebiotics to formula-fed infants proliferates Bifidobacteria as
well as improves other health outcomes, such as reduced incidence of fever and
gastrointestinal infections (Rao and others 2009). Bifidobacteria gradually decrease in
number from the time of weaning as numerous different types of bacteria are introduced
with a more complex diet. By adulthood, Bifidobacteria constitute only 25% of the
colonic bacteria yet they remain an important component of the intestinal microflora.
Bifidobacteria are regarded as a marker of the stability of the human intestinal microflora
with optimal levels as high as one-third of total intestinal microflora (Boeckner and
others 2001).
The Role of Bifidobacteria in Human Health
Bifidobacteria aid in digestion, boost immunity, are associated with a lower incidence of
allergies (Björkstén and others 2001), and may inhibit some types of tumor growth
(Guarner and Malagelada 2003). Bifidobacteria may also help to lower cholesterol by
converting it to a less absorbable form known as coprostanol, which may decrease
cholesterol absorption from the intestinal tract (Tahri and others 1996). In addition, an
6
increased proportion of Bifidobacteria in the gut may crowd out undesirable pathogenic
bacteria thus reducing the chance of diarrhea and infection (Gibson and Roberfriod 1995,
Walker 2000). Pathological bacteria such as E. coli and Clostridium perfringens have
been associated with diarrhea, infections, liver damage and putrefaction of the intestinal
contents. Proliferation of these pathogenic bacteria may be further decreased through
selective inhibition by increasing the proliferation of Bifidobacteria (Bernet 1994, Gibson
and others 1995). Further beneficial effects from increased proliferation of
Bifidobacteria may include increased phagocytosis of E. coli (Schiffrin and others 1997).
In addition the health promoting effects prompted by bifidobacteria and other healthful
bacteria may be due to the growth inhibition of harmful bacteria, stimulations of immune
function, lowering of gas distention problems, and improved digestion/absorption of
essential nutrients and synthesis of vitamins (Gibson 1995, Gibson and others 1995).
Being mainly saprophytes, probiotic bacteria depend on fermentable carbohydrates in the
colon. Bifidobacteria metabolize non-digestible oligosaccharides (NDOs), such as inulin-
type fructooligosaccharides (FOS) to produce vitamins and short-chain fatty acids
(SCFAs), predominantly lactate and acetate. These short chain fatty acids are the main
source of energy utilized by the epithelial cells in the colonic mucosa. Short-chain fatty
acids lower intestinal pH, which has been shown to increase the absorption of calcium
and magnesium (Bosscher and others 2006). Lower pH may also inhibit the growth of
pathogenic bacteria such as E. coli and Cl. perfringens, which are completely inhibited at
pH 5.0 and 4.5 (Wang and Gibson 1993).
7
The Role of Prebiotics in Human Health
Research findings suggest dietary habits influence the prevalence of Bifidobacteria in the
colon. A prebiotic is a non-digestible food ingredient that beneficially affects the host by
selectively stimulating the growth and/or the activity of one or a limited number of
bacterial species in the colon, thus improving host health or colonic microflora
composition (Collins and Gibson 1999, Gibson and others 1994a, Gibson and others
1995, Boeckner and others 2001). Non-digestible oligosaccharides (NDOs) such as
inulin-type fructooligosaccharides (FOS) resist hydrolysis and digestion in the upper
gastrointestinal tract but are hydrolyzed and fermented in the large bowel by colonic
bacteria, such as Bifidobacteria (Kleesen and others 1997). These prebiotics may change
the composition of fecal bacteria by 1) increasing beneficial bacteria, such as Lactobacilli
and Bifidobacteria, which help modulate the activity of the immune system, and by 2)
decreasing pathogenic organisms, such as Clostridia and protein-degrading bacteriodes,
which may produce tumor-promoters from metabolites of proteins that escaped digestion
in the upper gut (Rastall 2005, Sanders 2006).
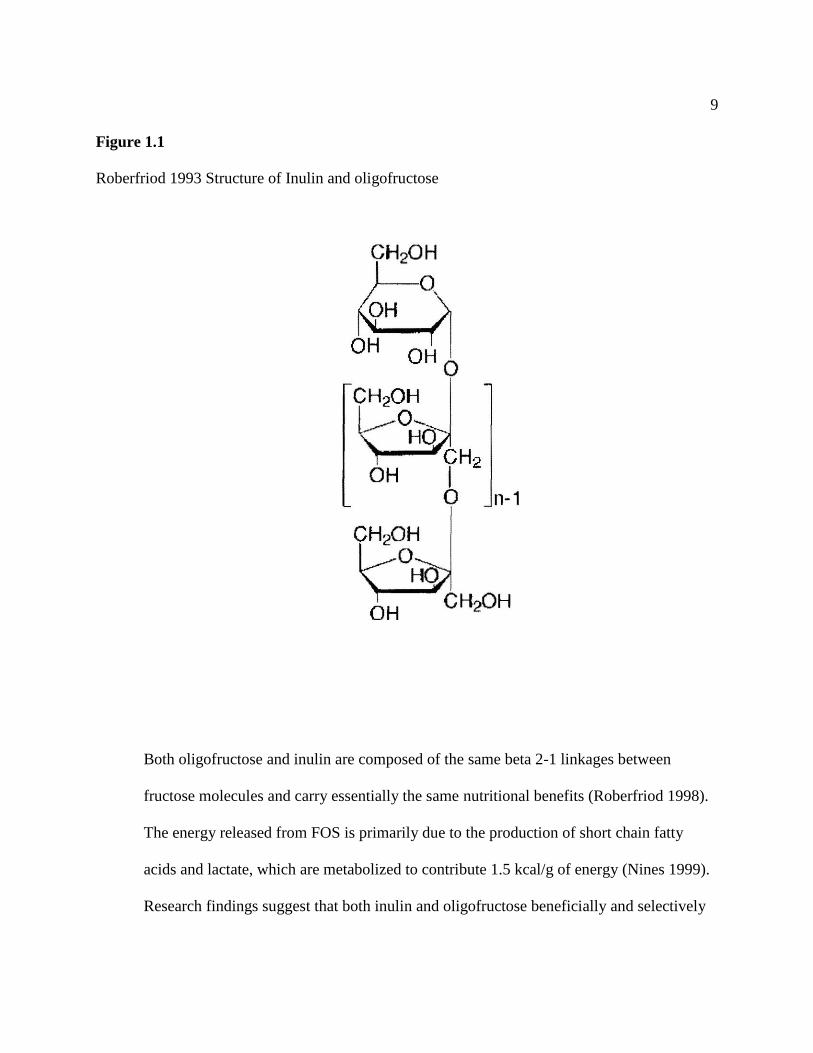
Fructan polysaccharides are classified as fiber and are a storage polysaccharide
predominately made up of chains of fructose. Various types of fructan polysaccharides
are linked in a beta 2-1 configuration (Figure 1.1). These fructooligosaccharides (FOS)
differ in degree of polymerization (DP), which is the number of fructose units in the
chain. Inulin has the longest DP ranging from two to 60 (Gibson and others 1994a,
Roberfriod 1998). Inulin is the naturally occurring storage oligomer of fructose found in
8
Jerusalem artichoke, asparagus, garlic, banana, rye, wheat, chicory and onion.
Commercial inulin is obtained through hot water extraction from chicory root.
Oligofructose is not found naturally in food; rather it is created from partial enzymatic
hydrolysis of inulin resulting in a shorter DP ranging from two to 20. The term non-
digestible oligosaccharide (NDO) is used to describe short-chain carbohydrates that are
not digested in the small intestine and enter the large intestine unaltered. Inulin,
fructooligosaccharides, oligofructose, oligosaccharides, lactulose and
galactooligosaccharides are NDOs that are well-known prebiotics. The term
―oligosaccharide‖ refers to a short chain of sugar molecules (―oligo‖ means ―few‖ and
―saccharide‖ means ―sugar.‖). Fructooligosaccharides (FOS) and inulin, which are found
in many vegetables, consist of short chains of fructose molecules. Oligofructose is
obtained through partial hydrolysis of inulin. Oligofructose was introduced as a synonym
for fructooligosaccharides in 1989 (Coussement, 1999). Galacto-oligosaccharides (GOS),
which also occur naturally, consist of short chains of galactose molecules.
9
Figure 1.1
Roberfriod 1993 Structure of Inulin and oligofructose
Both oligofructose and inulin are composed of the same beta 2-1 linkages between
fructose molecules and carry essentially the same nutritional benefits (Roberfriod 1998).
The energy released from FOS is primarily due to the production of short chain fatty
acids and lactate, which are metabolized to contribute 1.5 kcal/g of energy (Nines 1999).
Research findings suggest that both inulin and oligofructose beneficially and selectively
10
feed anaerobic Bifidobacteria in the colon but the degree of polymerization may be a
factor in gastrointestinal side effects such as flatulence, as well as bifidogenic properties.
The average American consumes between 2.6 and 2.5 grams per day of inulin and
oligosaccharides, respectively, with a range of 1.3 to 3.5 g from commonly consumed
foods, such as bananas, onions, and wheat (Moshfegh and others 1999). Some research
findings indicate less than 10 grams per day to be ineffective in promoting desired
colonic microbial changes. However, gastrointestinal disturbances, such as increased
flatuance and bloating, as well as the potential for diarrhea have been reported in
response to doses of ten to 20 grams, the amount often reported for desired changes in
colonic microflora composition (Bouhnik and others 1997, Hunter and others 1999,
Menne and others 2000, Kleesen and others 1997, Kruse and others 1999).
Therefore, further research has been conducted to determine a level that induces the
desired bifidogenic stimulation with the least amount of gastrointestinal disturbances,
thus increasing the chance of compliance. Gastrointestinal disturbances may reduce
consumption of functional foods containing FOS. Fermentation of FOS by colonic
bacteria may be influenced by chain length, with longer chains being fermented in more
distal regions with perhaps less gaseous response (Perrin and others 2002). Some earlier
reports have indicated eight to ten grams per day of FOS may be the optimum daily
amount to reduce the side effects and still provide health benefits. Bouhnik and others
(2004) reported that the most commonly used non-digestible carbohydrates such as
11
inulin-type FOS measurably raised fecal counts of Bifidobacterium at reasonable dose
ranges of 2.5 to 5 grams per day within 7 days of administration.
Inulin and oligofructose are prebiotics that are also classified as dietary fibers. Fiber is a
general term for substances which resist hydrolysis in the stomach and the small intestine
(Trowell 1974). Inulin and oligofructose have been given GRAS (generally recognized as
safe) status in the United States since 2002 (FDA 2003). Beyond their bifidogenic
properties, these fibers have fecal bulking effects and have been shown to increase
mineral absorption, increase B vitamin synthesis, increase short chain fatty acid (SCFA)
production, increase immune function and improve blood lipids (Jenkins and others
1999).
Currently, inulin and oligofructose are used worldwide as a fat-replacer and sugar
substitute in foods. They are also used to increase the fiber content of foods and as
prebiotics (Sangeetha and others 2005a, 2005b). Both inulin and oligofructose are widely
used in a variety of food products, both for their technological and nutritional attributes
(Roberfroid 2002). Adding prebiotics to commonly consumed foods may help increase
the daily consumption of prebiotic ingredients. However, in addition to the
gastrointestinal side effects caused with increased consumption, the degrees of
polymerization (DP) or chain lengths of FOS products contribute slightly different
attributes to finished food products. Although inulin-type FOS may impart sweetness to

12
food products, it may also change the texture, water activity and color of the food
product.
Bifidogenic properties of inulin-type FOS
Inulin-type FOS is the most studied prebiotic because of its bifidogenic properties
(Tomamatsu 1994). Bouhnik and others (1999) reported that as the amount of short chain
FOS consumed increased, fecal Bifidobacteria increased. Numerous researchers reported
that a dose of ten to 20 grams per day of NDOs such as inulin-type FOS are required to
produce beneficial changes in colonic bacteria through increased proliferation of
Bifidobacteria (Bouhnik and others 1997, Hunter and others 1999, Menne and others
2000, Kleesen and others 1997, Kruse and others 1999).
The chain length of NDOs affects the rate and ability of Bifidobacteria to ferment the
NDOs (Perrin and others 2002, Gibson and Wang 1994). Growth rates of Bifidobacteria
cultured on either oligofructose or inulin were obtained and increased growth rate was
shown on oligofructose versus the inulin, which has a longer chain length (Wang and
Gibson 1993, Gibson and Wang 1995). Therefore, these researchers concluded that
oligofructose is the preferred source of carbon and energy for Bifidobacteria. Roberfroid
and others (1998) also demonstrated through in vitro fermentation of inulin, that all
fructans are bifidogenic but those molecules with a chain DP > 10 are fermented on
average half as quickly as molecules with a DP < 10.
13
FOS in infant formula is bifidogenic
Rao and others (2009) reviewed 11 trials that compared infants (minimum age 28 days)
receiving formula milk supplemented with or without prebiotics and fed for a minimum
of 2 weeks. In these trials, outcomes included stool colony counts of Bifidobacteria,
Lactobacilli, and enteric pathogenic bacteria such as E. coli, as well as stool pH,
consistency, frequency, anthropometry and symptoms of tolerance. Of these 11 trials,
significant increases in Bifidobacteria after prebiotic supplementation were found in six
trials and a trend toward increased Bifidobacteria counts were reported in two trials. A
significant reduction in stool pH in the prebiotic-supplemented group was reported.
Prebiotic supplemented infants had softer, more frequent stools, similar to those of
breastfed infants. Weight gain was slightly higher in the prebiotic supplemented group
compared to the controls. Tolerance of prebiotic supplementation was found in all but
one of the eight trials. Intolerance was defined as excessive vomiting, diarrhea,
regurgitation, and excessive irritability. In one study, infants who received prebiotic
supplementation had more frequent diarrhea (18% vs. 4%), irritability (16% vs. 4%) and
eczema (18% vs. 7%) compared to the controls, suggesting that more research is needed
in this area prior to recommending routine prebiotic supplementation of formula-fed
infants. However, a number of studies support the use of prebiotics due to positive
alteration of fecal microflora.
14
Fructooligosaccharide’s effect on calcium absorption
Findings by Briel and others (1995) reveal dietary fiber plays a significant role in human
health. However, questions remain whether dietary fiber impairs mineral absorption,
similar to the effect of phytate on zinc and iron absorption. Inulin-type FOS are soluble
fibers containing negligible amounts of phytate.
Inulin-type FOS are easily fermented by colonic bacteria and may stimulate absorption of
several minerals and improve mineralization of bone. Although much of the research on
the functional effects of NDOs, such as inulin-type FOS, is based on animal experiments,
findings support the effect of NDOs on increased absorption of calcium, magnesium,
zinc, and iron (Scholz-Ahren and others 2001, van den Heuval and others 1998).
Increased calcium and magnesium absorption may be partially explained by the increased
production of short-chain fatty acids, fermentation end products, which lower the pH of
fecal content. Lower fecal pH increases mineral solubility leading to improved mineral
absorption (Remesy and others 1993, Bouhnik and others 1997, Wang and others 1993,
Campbell and others 1997). These short-chain fatty acids may further influence mineral
absorption by forming complexes with the minerals, leading to an increase in their uptake
by the intestinal cells (Trinidad and others 1993, 1997). Some researchers speculate that
the metabolic byproduct, butyrate, may stimulate the intestinal epithelium and increase its
absorptive capacity (Topping and Clifton 2001). However, in humans, the effects of
NDOs on fecal pH and the ratio of SCFAs is less conclusive perhaps due to the shorter
15
duration of human studies and the less pronounced stimulation of mineral absorption by
SCFAs. Mineral absorption as well as fecal fermentation may also be dose dependent on
prebiotics and calcium intake, as well as the duration of the study, a finding supported by
Ohta and others (1995), Remesy and others (1993), Coudray and others (2005).
Favorable effects of NDOs on mineral metabolism in humans occur under conditions of
increased calcium requirements such as in adolescence and post menopause (Maha Tahiri
and others 2003, Abrams and others 2005). Adolescence is a time when increased
calcium absorption is important to support growth and optimize bone mineral density
(BMD) for later life. NDOs increase calcium and mineral absorption efficiency in people
with low calcium intakes or increased calcium needs which is supported by research
(Coudray and others 2005). Results reported by Bosscher and others (2006) from a one-
year intervention trial on pre-pubertal girls and boys (n=100) indicated significantly
increased calcium absorption in the group receiving a mixture of synergistically active
oligofructose and long-chain inulin (8 g/d) after 8 weeks. The effect of increased calcium
absorption lasted during the entire intervention period resulting in improved bone mineral
content (BMC) and significantly increased BMD during periods of rapid growth
compared to the control group.
Research conducted by Van den Heuvel and others (1999) further support the beneficial
effects of oligofructose on calcium absorption in adolescents. In their study, 12 male
adolescents aged 14-16 years received 15 grams oligofructose or sucrose (control
16
treatment) daily distributed over 3 meals per day for 9 days. Treatments were
administered in a randomized, double-blind crossover design separated by a 19 day
washout period. An increase in the amount of dietary calcium that was absorbed, also
known as true fractional calcium absorption (%), was reported in the adolescents after
consumption of oligofructose. The authors concluded that 15 grams of oligofructose per
day stimulates fractional calcium absorption in male adolescents.
Genetic variances, including specific vitamin D receptor gene polymorphisms, may alter
the effect of prebiotic consumption initially, however the research indicated that long
term (1 year) consumption of both short and long-chain inulin-type fructans significantly
increased calcium absorption and enhanced bone mineralization during pubertal growth
(Abrams and others 2005).
Benefits of increased intestinal calcium absorption would be important for
postmenopausal women whose intestinal calcium absorption naturally declines. However,
Tahiri and others (2003) reported consumption of short-chain fructooligosaccharides
(scFOSs) did not increase calcium absorption for women who were not on hormone
replacement therapy. The researchers reported that the effects of calcium absorption with
dietary scFOSs may be dependent on factors other than lifestage (age) and dietary
calcium content intake such as impaired vitamin D status or reduced intestinal
responsiveness to calcium needs, as is common with increasing age. However, results
from a subgroup of women in this study who have had menopause for > 6 years (n=6)
17
suggested some benefit of dietary scFOSs on calcium absorption in the late
postmenopausal phase. The small subject number warrants further investigation.
Van den Heuvel and others (1998) studied the effect of inulin, FOS and
galactooligosaccharides (GOS) on true intestinal absorption of iron and calcium in men.
Mineral absorption was measured by using double stable-isotope techniques. In this
study, 12 healthy non-anemic males subjects, 20-30 years of age received four treatments
with a consistent basal diet supplemented with 15 grams per day of either inulin, FOS,
GOS, or not supplemented (control) for 21 days for each treatment according to a
randomized, crossover design with no wash-out period noted. Iron absorption was
measured during the last 7 days of treatment (days 15-21) and calcium absorption was
measured on day 21 of each treatment period. They reported no significant differences
among treatments. The researchers concluded that 15 grams per day inulin, FOS, or GOS
did not have a negative effect on iron and calcium absorption in young healthy men.
Their findings are supported by Coudray and others (1997) who indicated both soluble
inulin and partly-soluble sugar beet fiber improved calcium absorption and calcium
balance without significantly altering magnesium, iron or zinc absorption.
The effect of FOS on Lipid Metabolism
Dietary fiber plays a role in lipid metabolism and may reduce coronary artery disease
(CAD) risk, depending on the type and source of fiber. Non-fermentable fiber, such as
wheat-bran, reduces colonic transit time, but has little effect on lipid metabolism,
18
whereas fermentable fibers, such as pectins and b-glucans, reduce serum cholesterol but
do not affect transit time (Truswell 1992). Because the fructooligosaccharides, inulin and
oligofructose, are classified as dietary fiber, research has been conducted on their lipid-
lowering effects. Fiordaliso and others (1995) demonstrated lipid-lowering effects of
oligofructose in the serum of rats. Oligofructose supplementation has also been shown to
prevent accumulation of cholesterol in liver tissue of rats as well protecting against an
increase in free cholesterol concentration induced by high-fat diets (Kok and others
1996). Research conducted by Delzenne and others (1993) revealed a large decrease in
triglycerides in test animals supplemented for 30 days at a dose of 20g/100g
oligofructose. Although total cholesterol did not change in this study, the ratio of HDL to
LDL cholesterol improved. This finding is supported by research from Levrat and others
(1991) with rats fed inulin 10% by weight, possibly due to short chain fatty acid
production present in the cecum of rats fed inulin. However in research reported by
Vanhoof and Schrijver (1995), hypercholesterolemic rats fed inulin had no significant
effect on plasma or liver cholesterol concentrations. Differences in normo- and
hypercholestorolemic rats make conclusions difficult.
Because animal studies revealed some evidence of lipid-lowering effects of FOS,
attention has been given to studies in humans. However, research has been limited and
somewhat conflicting. A review conducted by Chowla and others (2010) concluded that
soluble fibers such as pectin, oat bran, guar gum, and psyllium had a small but significant
decreasing effect on total and LDL-cholesterol levels within a practical range of intake
19
(Brown and others 1999). Inulin appeared to have a similar effect on blood lipids when
consumed by hyperlipidemic adults. Therefore, the authors concluded that preliminary
evidence exists for a hypotryglyceridemic effect of FOS, but at the present stage of
knowledge, it is not possible to conclude a hypocholesterolemic effect.
Prebiotics and Probiotics in Food
Probiotics have been consumed by human beings in the form of fermented foods for
thousands of years (Cross and others 2001). Elie Metchnikoff, a Russian scientist first
observed that consuming large amounts of fermented milk products containing
Lactobacilli prolonged life and gave the first scientific explanation for the beneficial
effects of lactic acid bacteria present in fermented milk (Rasic 2003). It is currently
accepted that daily intake of probiotic-rich foods improves and helps maintain well-
balanced intestinal flora, and prevents gastrointestinal disorders (Lavermicocca, 2006).
For probiotic bacteria to exert positive health benefits, these bacteria have to establish
themselves in the gastro intestinal tract. Diet and food substrates are one of the most
influential factors in regulating colonization of microorganisms in the gastrointestinal
tract. Food not only acts as a buffer enhancing survival of bacteria through the stomach,
food may also contain functional components or ingredients, such as prebiotics, which
may alter probiotic survival and functionality in the gut. The food, or substrate, also plays
a role in probiotic survival during product manufacture and storage.
20
The growing interest in the complex interactions between diet, gut microbiology and
health has encouraged research and development of dietary strategies to increase
proliferation of beneficial bacteria in the gut beyond the ability of the traditional
American diet. Research findings suggest that symbiotic foods could play a significant
role in modulating gut bacteria by increasing survival rates for probiotics during
manufacture and storage as well as selectively feeding beneficial bacteria once
established in the gut. Therefore, manufactures are interested in manufacturing symbiotic
foods that provide greater viability of probiotic organisms while maintaining quality
sensory properties in the finished product.
Food, particularly dairy products are considered an ideal vehicle for delivering probiotic
bacteria to the human gastrointestinal tract (Granato and others 2010) Fat content, protein
content and type, sugars and pH of food products are factors that could affect probiotic
growth and survival in food. Therefore, product formulation can be manipulated to aid
efficacy. There is potential for increasing the synergistic effect of foods when combining
probiotics and prebiotics in the diet, separately or as symbiotics. Some foods may
naturally contain ingredients that function as prebiotics, increasing the efficacy of
probiotics, whereas other foods can be fortified with prebiotics during the manufacturing
process. It is important to develop probiotic, prebiotic and symbiotic products with are
part of day-to-day normal diet to maintain minimum therapeutic level easily.
21
Technical and nutritional properties of inulin
Inulin and oligofructose pose both nutritional and functional attributes that are useful in
formulating innovative healthful products for consumers. The difference in chain length
between inulin and oligofructose account for their distinctly different functional
attributes. Inulin has a longer chain length and is less soluble than oligofructose. The
ability of inulin to form inulin microcrystals when added to milk or water is useful in
producing a smooth creamy texture in food. Inulin has been used successfully to replace
fat in food products because it provides a fat-like mouth feel (Niness 1999). Inulin-type
fructans also help stabilize foams (Cummings and Roberfroid 1997). In addition, inulin is
used by the food industry as a water binder, emulsifier, stabilizer and texturizer.
Traditionally, inulin has been used to replace fat in dressings, spreads, dairy products and
frozen desserts.
Technical and Nutritional Properties of Oligofructose
Oligofructose is composed of shorter-chain oligomers as compared to inulin and has
functional qualities similar to sucrose and glucose syrups. It is more soluble than sucrose
and provides 50% of the sweetness of table sugar (Niness 1999). This quality contributes
to the body of dairy products and to the humectancy of soft baked goods. It can provide
crispiness to low-fat cookies and work as a binder in energy bars in the same way sucrose
(sugar) functions. However, oligofructose has the added benefit of fewer calories than
sucrose and does not affect serum glucose levels in diabetic patients nor does it increase
insulin production or glucagon secretion (Beringer and Wenger 1995). Oligofructose is
22
often used in combination with high intensity sweeteners to replace sugar and provide a
well-balanced flavor profile while reducing the aftertaste of artificial sweeteners.
Oligofructose also provides fiber enrichment in products giving manufacturers additional
marketing venues. Oligofructose is successfully used in cereals, fruit preparations for
yogurt, frozen desserts, cookies and nutritional dairy products (Niness 1999).
Oligofructose lowers the freezing point in frozen desserts and acts as a stabilizer similar
to inulin, a quality that may be beneficial in preventing ice crystal formation during the
hardening process and recrystallization during transport (Akalin and others 2002).
Fructooligosaccharides in Dairy manufacture
Most foods containing probiotic bacteria are found the refrigerated section of
supermarkets as bacteria are easily destroyed by heat and other processing conditions.
The dairy sector has a major advantage in the development of innovative new probiotic,
prebiotic and symbiotic foods. Dairy products incorporated with probiotic bacteria are
gaining popularity and comprise approximately 65% of the world functional food market
(Agrawal 2009). Lactobacillus and Bifidobacterium are the most commonly used species
of bacteria used in dairy products for probiotic effects (Sexelin and others 2005).
Ensuring a high survival rate of probiotic bacteria is important as standards requiring a
minimum of 106 to 10
7 CFU/g of Lactobacillus acidophilus and/or Bifidobacteria in
fermented dairy products have been introduced by several food organizations worldwide
(Shah 2000). Therefore, research has been conducted on symbiotic dairy products to
promote increased viability of probiotics.
23
Yogurt as a probiotic carrier
Fermented milk products, such as yogurt, are a common carrier for probiotic delivery.
For fermentation of yogurt, Streptococcus thermophilus and Lactobacillus delbrueckii
ssp. Bulgaricus are used. Bifidobacteria are sometimes added to yogurt and other
fermented dairy products as a probiotic with varying viability over a range of shelf lives.
Hamann and Marth (1984) reported that Streptococcus thermophilus and Lactobacillus
delbrueckii ssp. bulgaricus survive in yogurt until the use by date. However, Birollo and
others (2000) observed that in whole set yogurt the level of Streptococci decreased
approximately 1 log cycle at 6 C in 60 days shelf life, while they remained viable and
even reproduce in skimmed set yogurt under the same conditions. Higher concentrations
of milk fat in yogurt produce an inhibitory effect for probiotic cultures, particularly B.
bifidum BBI in yogurt (Vinderola and others 2000). Research has suggested plain yogurts
retain higher levels of L. acidophilus over the shelf life compared to yogurts containing
fruit purees other than mango or strawberry. This may be partially due to the differences
in pH with the presence of fruit pulp (Kailasapathy 2008). Shah and others (1995)
demonstrated L. acidophilus is affected by the low pH of the environment. Therefore,
ingredients that lower the pH of yogurt may have an effect on the viability of probiotics.
However, ascorbic acid was reported to improve viability of L acidophilus in yogurts but
did not have an effect on Bifidobacteria (Dave and others 1997). Dave and Shah (1997)
reported that Bifidobacteria, when added to the commercial starter culture, decline
rapidly after the initial inoculation of yogurt. Viability of probiotic bacteria depend on
many factors: species of the probiotics, incubation time and temperature, pH of the final
24
product, storage temperature, and the length of time from inoculation to consumption
(Akin and others 2007).
Probiotic Yogurt has Beneficial Health Effects
Consuming bifidobacteria-containing yogurt (B longum BB536) compared to a standard
yogurt containing no Bifidobacteria created significant positive changes in the relative
percentage of Bifidobacterium amongst other main bacteria in the intestinal flora
(Yaeshima 1997). A simultaneous decrease in ammonia, which is representative of
putrefactive product, was also shown as well as an increased frequency of defecation in
subjects with a tendency toward constipation (Yaeshima 1997). Yogurts containing other
strains of Bifidobacteria, B breve M-16V and B. longum BB536 fed to very small infants
of 1000 g or less enhanced early colonization of Bifidobacteria and reduced necrotizing
enterocolitis and other intestinal tract infections (Akiyama and others 1994).
Gibson and Roberfroid (1995) reported that Bifidobacteria can survive the intestinal
ecosystem, as do some of the fermenting organisms. Although the use of human-origin
species as food supplement seems to be the reasonable and correct choice (Ishibashi and
others 1997), B. animalis is often identified as the species used in various yogurts,
possibly due to its acid-resistant nature. Animal derived species have not been isolated
from the human intestinal tract, perhaps due to the inability to colonize the host intestinal
tract. Recently, the B. animalis strains isolated from probiotic yogurts were reported to
have genetic differences compared to B animalis originating from animal intestinal tracts
25
and these strains have been renamed B. lactis (Meile and others 1997). This species is not
an inhabitant of the human intestinal tract.
FOS added to yogurt increases probiotic viability
The addition of prebiotics as a food ingredient may increase viability of probiotics added
to food products. Donker and others (2007) demonstrated that the addition of ―Hi-maize‖
or amylase maize starch (a natural dietary fiber/resistant starch) and inulin resulted in
improved growth, viability and organic acid production of L. acidophilus and L. casei in
set-type yogurts. Both cultures demonstrated better retention of viability with inulin
compared to Hi-maize however, proteolytic activity remained higher in both cultures with
―Hi-maize‖ or no supplement as compared to inulin. Positive effects of adding Hi-maize,
inulin and FOS on viability of L acidophilus, L. Casei, Lactobacillus rhamnosus and
Bifidobacterium spp. were also observed in yogurt reported by Capela and others (2006).
These authors reported fructooligosaccharide as most effective in retaining viability of
probiotics as compared to the other prebiotics.
In a study by Akalin and others (2004), the addition of FOS in yogurt increased viability
of both Bifidobacterium animalis and Bifidobacterium longum from inoculation through
storage. The level of Bifidobacterium animalis remained higher than the recommended
level of one million cells throughout storage at 4°C for 28 days. Bifidobacterium longum
did not remain viable at the same high levels as Bifidobacterium animalis, yet counts
were at the same level after 28 days of storage with FOS as were found at 7 days of
26
storage without the addition of FOS demonstrating that FOS increased viability of both
strains. Shin and others (2000) found that the viability of commercial Bifidobacterium
spp. in skim milk improved by 55.7% after 4 weeks of refrigerated storage when
fructooligosaccharides (FOS) were added.
Prebiotic, Probiotic and Symbiotic Ice Cream
Ice cream is a popular product and is consumed by people of all ages. In 2003, 5333
million liters of ice cream were produced in the USA, which accounts for 10% of the
total milk production and 16% of processed milk. In Canada, 380 million liters of milk
were used to produce desserts, of which 79% was used for the production of ice cream
(Goff and Griffiths 2006). Because of the popularity and the beneficial composition of ice
cream, it could be classified as a commonly consumed food that manufacturers could use
for delivery of probiotics, prebiotics, and symbiotics.
Ice cream and frozen dairy desserts have the potential as probiotic carriers. Ice cream is a
frozen mixture of milk, sweeteners, stabilizers, emulsifiers and flavoring agents (Marshal
and others 2003). The category includes plain ice cream, reduced-fat, low-fat, nonfat,
fruit and nut ice creams, puddings, variegated, mousse, sherbet, frozen yogurt and other
frozen products. The fact that ice cream has a low storage temperature and less risk of
temperature abuse may lead to a higher viability of probiotics at the time of consumption
(Cruz and others 2009).
27
The dairy industry has found probiotic cultures to be a tool for the development of new
functional products (Champagne and others 2005). Probiotic bacteria have been
incorporated into fermented and non-fermented ice cream which may be an acceptable
vehicle for delivery of the probiotic microorganism in the human diet (Akin and others
2007, Hekmat and McMahon 1992, Kailasapathy and Sultana 2003, Ravula and Shah
1998). The matrix of milk fat, milk proteins, lactose and other compounds endogenous to
ice cream make it a good vehicle for probiotic cultures. Commercial production of
probiotic enriched ice cream and fermented frozen desserts are gaining popularity
(Kailasapathy and Sultan, 2003) despite the loss of viability of the microorganisms in the
finished products possibly due to acidity, freeze injury and oxygen toxicity (Hekmat and
McMahon 1992: Ravula and Shah 1998). The species of bacteria most commonly used in
dairy products for probiotic effect are Lactobacillus and Bifidobacterium (Saxelin and
others 2005). The viability of added probiotic bacteria depends on the dose level,
temperature, type of dairy foods and presence of air (Homayouni, Ehsani, Azizi,
yarmand, and Razavi, 2006a). Other parameters that may affect probiotic viability are
probiotic strain, freeze time and temperature, pH, temperature abuse and time to
consumption. Freezing and thawing causes various degrees of damage to cells, which
include microorganism death through inhibition of their development, reduction, and/or
interruption of metabolic activity (Davies and Obafemi 1985).
Prebiotics have been used to increase the viability of probiotic bacteria in dairy products
and are also used as texturizing agents in low-fat foods such as ice cream (Devereux and
28
others 2003). Studies have reported on the functionality of inulin as a fat replacer in
reduced fat ice cream (Schaller-Povolny and Smith 2001) and in yog-ice cream (El-Nagar
and others 2002). In addition, Homayouni and others (2008) reported encapsulation of
probiotic bacteria Lactobacillus casei (Lc-01) and Bifidobacterium lactis (Bb-12) can
increase the survival rate of probiotic bacteria in symbiotic ice cream containing 1%
resistant starch, without effecting sensory properties.
The pH of non-fermented ice cream is approximately 6.9, which provides conditions for
survival of the probiotic bacteria (Christiansen and others 1996) although Reza and others
(2010) suggest the freezing process, storage conditions, probiotic strain and whether or
not microencapsulation is used all effect survival. Research conducted by Hekmat and
McMahon (1992) concluded that probiotic ice cream at 5.5 pH had better overall
acceptance than ice cream prepared at 6.0 pH. In their study, 88 untrained judges were
asked to indicate their most and least preferred samples and evaluate flavor, texture, and
overall acceptance of strawberry-flavored iced cream using a hedonic scale of 1 to 9. The
authors did note that the preference of ice cream at the varying pH levels was affected by
the panelist’s pattern of yogurt consumption, although not significantly. The authors
further determined that the pattern of frozen yogurt consumption was not a predictor of
consumer preference due to the varying acidity (pH4.5-6.7) of frozen yogurt depending
on whether the yogurts are fully fermented or not.
29
Agitation during freezing incorporates air, thus conferring the desirable smoothness and
softness to the frozen products. This also has an effect on probiotic survival, being
disadvantageous to oxygen susceptible probiotic species. Inulin and oligofructose have
different effects on the overrun in ice cream, which indicates increased air incorporation
in the ice cream product, with inulin having a greater capacity than oligofructose. Being
strictly anaerobic, bifidobacterium spp. are more sensitive to oxygen than L. acidophilus
(Talwalkar and Kallaspathy 2003).
Akalin and Erisir (2008) compared the rheological characteristics of regular and low-fat
ice cream and probiotic ice cream as well as the survival of probiotic starter culture. The
authors found high apparent viscosity in the probiotic ice cream mix containing
oligofructose or inulin which can be explained by the interactions of dietary fiber and
liquid components of the ice cream mix, with the highest mean viscosity in the mix
containing inulin. This finding is supported by Schmidt and others (1993) who found ice
cream mixes containing carbohydrate-based fat replacers exhibit a viscous behavior
because of the capability for imbibing water, which would increase the viscosity of the
system. Schaller-Povolny and Smith (2001) had similar findings in ice cream replacing
100% of the corn syrup with inulin in reduced-fat ice cream. Similar results were
reported by El-Nager and others (2002) and Akin (2005) for yog-ice cream and probiotic-
fermented ice cream, respectively. Inulin is highly hygroscopic causing it to bind water
and form a gel-like network.

30
Akalin and Erisir (2008) also reported a direct correlation between firmness and melting
behavior. They found all probiotic ice creams were firmer than regular ice cream. The
addition of oligofructose or inulin increased the firmness in probiotic ice cream (P <
0.05). The ice cream supplemented with inulin was significantly firmer than other
products throughout the storage except the last day (P < 0.05). The ability of inulin to
bind water molecules and form a particle gel network can improve the firmness of the
products (Franck 2002).
In ice cream production, ice crystal size may increase up to 40% during the hardening
process. Recrystallization happens during storage, whereby small ice crystals melt and
large crystals grow simultaneously, a problem that is exacerbated with temperature
fluctuations causing a course grainy texture in ice cream. Small crystals, with a slightly
lower melting point, are more sensitive to temperature fluctuations than larger crystals
(Marshal and others 2003). Inulin and oligofructose may act as a stabilizing agent to help
control ice recrystallization, therefore, first dripping time of ice cream supplemented with
these prebiotics can be improved by the recrystallization process as storage time
increases. The inulin-supplemented group had the lowest change in melting properties
and the longest first dripping time as well as the most increase in firmness (P < 0.05)
most likely due to the high molecular weight and hygroscopic properties of inulin. First
dripping time is the time for the ice cream at room temperature to begin dripping. In this
research, first dripping and complete melting times were measured according to Guven
and Karaca (2002). 25 g of tempered samples were left to melt (at room temperature, 20
31
C) on a 0.2 cm wire mesh screen above a beaker. First dripping and complete melting
times of samples were determined as seconds. These observations are consistent with
those of El-Natar and others (2002) who demonstrated that inulin supplementation
reduced the melting rate and increased firmness in yog-ice cream. Akin (2005) also
reported that addition of inulin retarded the melting time of probiotic-fermented ice
cream. These authors found that the highest values for apparent viscosity, overrun, and
firmness and the most remarkable improvement in the meltdown characteristics were
obtained in the mix or ice cream containing probiotics and inulin (P < 0.05).
Melting properties were improved by oligofructose and inulin (P < 0.05) with melting
times decreasing in all samples as storage time increased. The first dripping times were
longer in probiotic ice creams supplemented with oligofructose and inulin in comparison
to the control sample with inulin increasing the first dripping time more than
oligofructose. Ice creams resulting in higher overruns have a high amount of air and tend
to melt slowly as air cells act as an insulator (Marshall and others 2003). In their study,
the addition of L. Acidophilus La-5 and B. animalis Bb-12 did not significantly affect
overrun values, which is supported by the work of Alamprese and others (2002).
When compared to the control, the viable counts for both L. acidophilus La-5 and B.
animalis Bb-12 significantly increased in the probiotic ice cream mix by addition of
oligofructose (P < 0.05) due the possible prebiotic effect oligofructose. The viable counts
of probiotics declined in all samples as a result of freezing, most likely due to the freeze
32
injury of cells leading to eventual death of the cells. This may have been exacerbated by
the incorporation of air into the ice cream. The incorporation of air is essential to obtain
the desired overrun in ice-cream: however, excess oxygen will affect the growth of
micro-aerophilic Lactobacillus acidophilus and anaerobic Bifidobacteria (Kailasapathy
and Sultana 2003). Viable counts continued to decline through storage; however the
mixing and freezing had a greater effect on counts than storage (P < 0.05). A similar
finding was reported by Hagen and Narvhus (1999) for different microorganisms with
different production technologies and pH. However, Davidson and others (2000) did not
report significant changes on culture bacteria during storage. Hekmat and McMahon
(1992), and Haynes and Playne (2002) reported satisfactory survival of probiotic bacteria
in frozen dairy desserts. The authors in this study reported B. animalis Bb-12 survived
better than L. Acidophilus La-5 in ice cream over 90 days, yet counts of B. animalis Bb-
12 only remained higher than the recommended minimum limit of 106 CFU during
storage in the ice cream supplemented with oligofructose.
Akalin and Erisir (2008) concluded that the best improvement in textural characteristics
in terms of firmness, melting properties and first dripping time was obtained in probiotic
ice cream with inulin during storage (P < 0.05). Survival of probiotic bacteria were
significantly enhanced with oligofructose (P < 0.05) and the recommended minimum
limit of 106 CFU/g were maintained for B. animalis BB-12 in only probiotic ice cream
with oligofructose during storage.
33
Akin and others (2006) studied the effects of inulin and sugar on physical and sensory
characteristics of probiotic ice cream containing Streptococcus salivarius spp.
thermophilus, Lactobacillus delbrueckii ssp. bulgaricus, Lactobacillus acidophilus LA-
14 and Bifidobacterium lactis BL-01. The addition of sugar at concentrations of 15, 18,
and 21% were used and they found that viability of organisms remained highest at a
sugar concentration of 18%. The addition of inulin stimulated the growth of L.
acidophilus and B. lactis improving the viability of both of these organisms.
Streptococcus thermophilus was the most stable in all samples of probiotic ice cream
with > 107 CFU/g throughout the storage period. Lactobacillus delbrueckii ssp.
bulgaricus was reduced by 1.5 log cycles. Lactobacillus acidophulus and
Bifidobacterium lactis decreased to 105
CFU/g in the control samples, whereas the counts
were 106 CFU/g in the samples supplemented with inulin. These results suggest that the
addition of inulin stimulated the growth of L. acidophilus and B. lactis, which resulted in
improved viability of these organisms.
Atkin and others (2006) also found that increasing sugar concentration led to products
with better physical and sensory properties. The initial pH of milk (6.59-6.62) decreased
to 5.8- 6.0 during probiotic ice cream making. The acidity increased as the inulin level
increased (p < 0.01). The authors attributed this to inulin stimulating the metabolic
activities of the starter bacteria resulting in improved development of acidity. The effect
of sugar level and addition of inulin on acetaldehyde was insignificant (P < 0.05).
Overrun values rose from 34.0 to 37.5% as sugar content increased from 15% to 21% (P
34
< 0.01). Similar results were found in frozen yogurts by Guven and Karaca (2002). These
authors found that the addition of inulin had an insignificant effect on overrun values of
the ice-cream samples (P < 0.05). This may be partially due to the small percentage of
inulin added to the mix in this study.
First dripping times were increased as sugar content increased in the samples (P < 0.05).
The complete melting time was related to sugar content (P < 0.01) with sugar having a
negative impact. The addition of inulin at 1% had an insignificant effect on the first
dripping time however, addition of 2% inulin to ice cream led to an increase in first
dripping time. The results indicated that increased additions of inulin to ice-cream mixes
increased complete melting times. This may be attributed to the stabilizing ability of
inulin due to binding water. The viscosity of the samples increased as the sugar content
increased (P < 0.01). The addition of inulin caused an increase in the viscosity (P < 0.05).
Similar results were reported by El-Nagar and others (2002).
Ten panelists using a sensory rating scale of 1-10 for flavor and taste and 1-5 for
consistency, color and appearance assessed organoleptic properties in the study by Atkin
and others (2006). This external panel of non-smokers used for sensory evaluation was
very familiar with dairy products and were checked on the basis of sensory acuity and
consistency. The properties evaluated included six attributed for flavor and taste (a) (no
criticism: 10, cooked flavor:9-7 lack of sweetness and too sweet: 9-7, lack of flavor: 9-6
yogurt/probiotic flavor: 8-6, acidic/sour: 8-6, rancid and oxidized: 6-1, and others 5-1),
35
(b) eight characteristic of body and texture (no criticism: 5, crumbly: 4-2, course: 4-1,
weak: 4-1, gummy: 4-1, fluffy: 3-1, sandy: 2-1) and (c) four terms describing color and
appearance (no criticism: 5, dull color: 4-1, non-uniform color: 4-1, unnatural color: 3-
1,).
Di Criscio and others (2010) reported on probiotic, prebiotic and synbiotic ice cream.
For their study, three types of ice cream were produced by adding Lactobacillus casei
DSM 20011and Lactobacillus rhamnosus DSM 20021, prebiotic inulin, or a combination
of both. Two different mixes were evaluated, vanilla and fruit, however vanilla only was
used for the prebiotic and symbiotic ice creams. Prebiotic ice creams included inulin at
2.5%, 5%, and 10% of the ice cream mix. Synbiotic ice cream were produced with Lb.
casei and 3% inulin , Lb. casei and 6% inulin , Lb rhamnosus and 3% inulin and Lb
rhamnosus and 6% inulin. Microbial counts, pH, acidity and physical and functional
properties were evaluated. Microbial analyses were carried out 0-1 d, and after 1, 3, 7 and
16 weeks of frozen storage. Sensory assessment was conducted using a semi-trained
panel of 10 judges. Five terms were used: flavor, homogeneity, color, taste and
consistence. A scale of 1 to 3 was used for flavor and homogeneity. A scale of 1 to 4 was
used for consistence, and a scale of 1 to 5 for taste and color. The samples stored at -
20°C after 7 days were removed from the freezer and tempered for 5 minutes at 20°C
before sensory analysis. In probiotic ice creams, firmness was not significantly
influenced by the presence of microorganisms. Probiotic vanilla ice cream was only
slightly lower in taste intensity compared with the control vanilla ice cream. Prebiotic ice
36
cream with 5 and 10% inulin were significantly firmer by about 50 and 25% respectively
(p < 0.05). The authors related this to changes in freezing points because of higher solute
concentrations together with the gelling properties of inulin and the increased water
binding, which improve viscosity and modifies the rheology of the mix (El-Nager and
others 2002). The prebiotic ice cream with the best firmness characteristic was that with
2.5% inulin, for which no significant differences were found compared with the control
ice cream. Overrun values were about 15% lower in ice cream with 5 and 10% inulin
compared to the control and 2.5% inulin. No significant differences were found between
control samples and samples with 2.5% inulin in melting rate values. Melting rate values
were significantly higher in samples with 5% inulin compared to 2.5% inulin and the
controls. However the values stabilized with 10% inulin. El-Nagar and others (2002)
reported the addition of 5% inulin significantly increases the rate of meltdown, which
decreases from 5 to 9% because of the formation of a cohesive network able to bind
water, thus reducing the mobility of water molecules among other molecules of the mix.
In sensory analysis of prebiotic ice creams, the addition of 10% inulin lowered
acceptability of taste and flavor, consistency and homogeneity. The physical analysis was
consistent with the sensory analysis for consistency and homogeneity. The researchers
reported that ice cream with 2.5% inulin was the best ice cream with values similar to the
control ice cream for all tested parameters (P < 0.05). For symbiotic ice cream, the
addition of microorganisms and inulin did not significantly affect ice creams for
consistency, taste, intensity, or homogeneity. Poor results were observed for color, which
appeared more opaque, whereas better evaluations were expressed for flavor, because of
37
higher sweetness intensity. Ice creams with 6% inulin were less icy compared with those
with 3% inulin. These results were in accordance with Schaller-Povolny and Smith
(1999) who observed a cryoprotectant effect of inulin that helps in reduction of ice crystal
growth. The best symbiotic ice cream was that with Lb. rhamnosus and 6% inulin,
followed by ice cream with Lb. casei and 6% inulin. The authors concluded that ice
cream with high inulin doses (10%) altered sensorial and physical properties of prebiotic
ice creams, however formulations with 2.5% inulin (which did not adversely affect ice
cream characteristics), it is possible to intake 5 g/d, assuming intake of 80 g ice cream,
would thus provide the needed amount for beneficial effects on intestinal microorganisms
and that it should be possible to produce a functional ice cream (symbiotic) with inulin
(minimum 3%) and potentially probiotic microorganisms.
Stiff competition exists in today’s market as savvy shoppers want functional foods that
may help stimulate the immune system or prevent disease, but also demand products that
taste good. Food manufacturers need solid scientific evidence about ingredients and their
functional qualities for product development. Because ice cream is a good source of
calcium and minerals as well as a commonly consumed food, inulin and oligofructose
could be used in ice cream production to increase daily intake of prebiotics. In addition,
inulin-type FOS added to ice cream could potentially increase the calcium and mineral
absorption as well as improve functional qualities. Therefore, more research is needed to
determine the acceptable amount of inulin-type FOS, in varying DP, which could be
added to ice cream to create a functional food product with acceptable sensory properties.
38
Research suggests inulin, in water-based foods such as dairy products, when used as a fat
replacer, gives a fat-like mouth feel and texture (Izzo and Franck 1998, Zimeri and
Kokini 2003).Limited research is available regarding FOS as a replacement for sugar in
ice cream production.
Non-digestible Oligosaccharides (NDO), such as inulin and fructooligosaccharides
(FOS), have potential for functional food products, however there is question as to how
much can be added to food products without compromising sensory attributes.
39
Objectives
The goal of this research project was to determine the maximum amount of inulin and
oligofructose that can replace sugar in a standardized ice cream recipe while maintaining
acceptable sensory qualities. The specific research objectives were:
1. To use an ice cream formulation that is used commercially as the control.
2. To replace part of the sugar in the control with either inulin (DP > 23) or
oligofructose (DP 3-10) at 10, 20, and 30% of the sugar.
3. Conduct sensory evaluation of the ice cream samples with 10, 20, or 30% of the
sugar replaced with varying amounts of inulin or oligofructose then to compare
these samples with the control sample. Sensory evaluation measurements include
sweetness, smoothness, taste and overall acceptability of the ice cream products
using hedonic scales with a 175 mm anchored line.
4. Determine the effect of adding oligofructose and inulin on water activity, texture,
and color in the control samples and experimental samples using physical tests.
40
Chapter 2. Materials and Methods
Preliminary Ice Cream Production
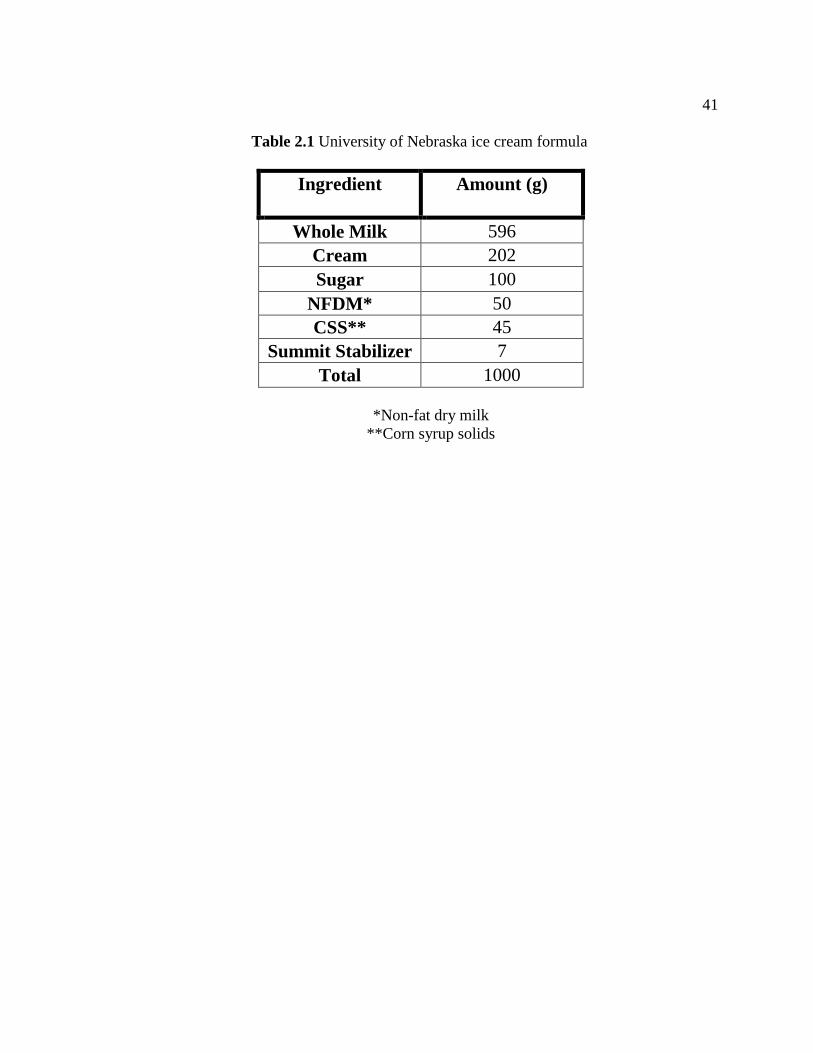
The University of Nebraska’s basic ice cream formulation (Table 2.1) was used to
determine the feasibility of small-scale production of ice cream as the control formulation
using a 1000 g sample. Preliminary research was conducted to determine what levels of
inulin and fructooligosaccharide (FOS) were to be used in the product used for sensory
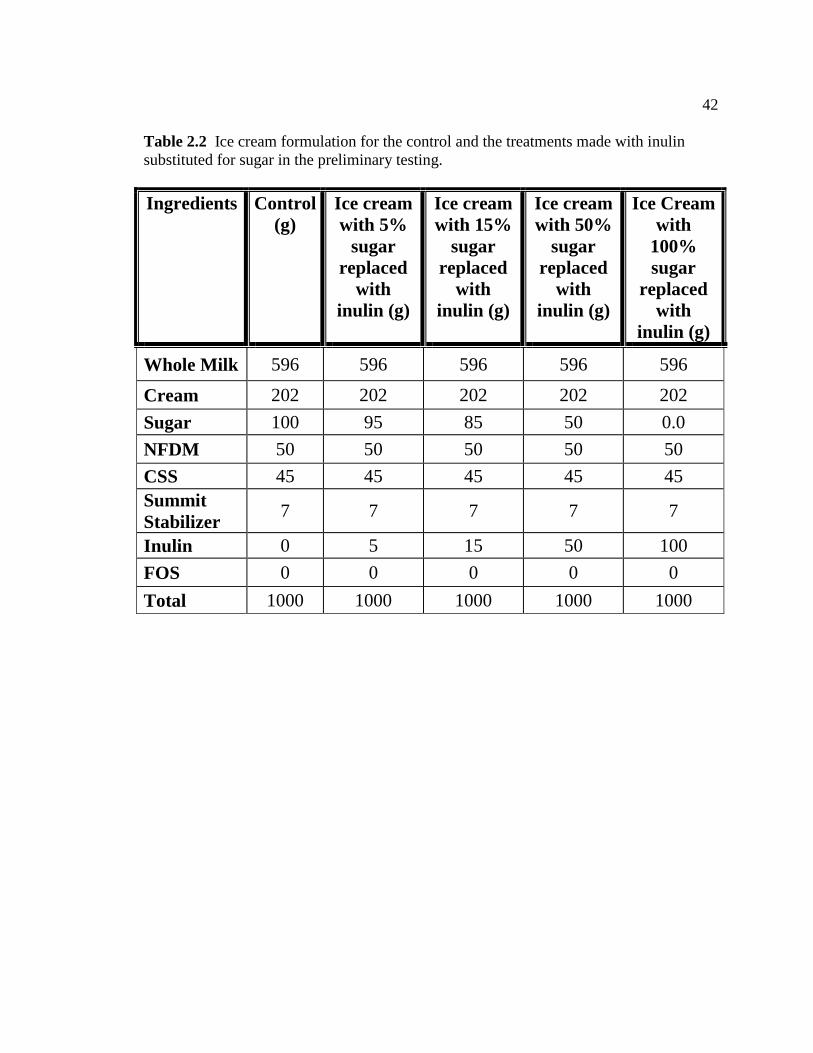
evaluation. Four 1000 g treatment batches were made substituting 5, 15, 50 and 100% of
sugar in the control formulation (Table 2.2) with inulin (Raftiline HP; DP >23; New
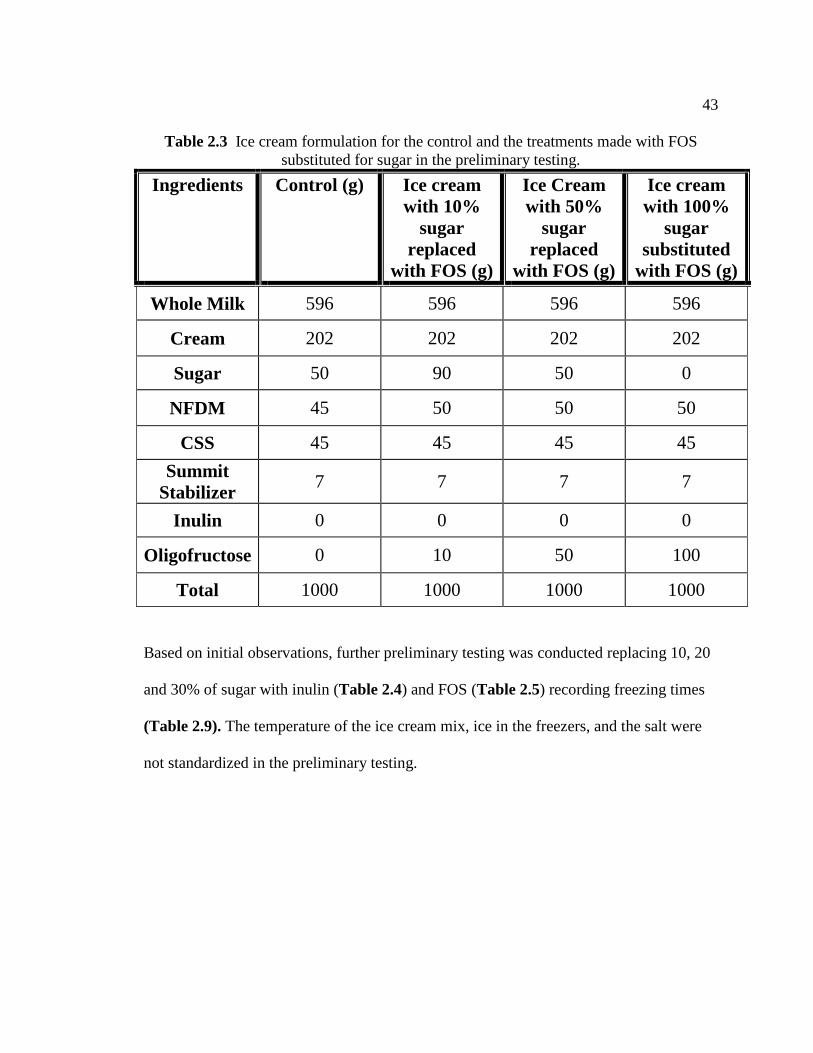
Century, KS). Three 1000 g treatment samples were produced substituting 10, 50, and
100% of sugar in the control recipe (Table 2.3) using FOS (Raftilose P95; DP of 2-10;
Orafti Active Food Ingredients, Malvern, PA). A control batch was also made. All
samples were produced weighing liquid and dry ingredients in separate containers. The
liquid and dry ingredients were then mixed together and the ice cream mix was quickly
poured into the freezing chamber of a consumer ice cream maker (Hamilton Beach Ice
Cream Maker). Frozen ice cream samples were placed in 1-quart disposable plastic
containers containing 520g and two (2 oz.) containers to determine how full to fill the
smaller containers to allow for expansion for the samples to be used for sensory
evaluation. After freezing the samples in a consumer refrigerator, subjective taste and
texture comparisons were made on these eight batches of ice cream.
41
Table 2.1 University of Nebraska ice cream formula
Ingredient
Amount (g)
Whole Milk 596
Cream 202
Sugar 100
NFDM* 50
CSS** 45
Summit Stabilizer 7
Total 1000
*Non-fat dry milk
**Corn syrup solids
42
Table 2.2 Ice cream formulation for the control and the treatments made with inulin
substituted for sugar in the preliminary testing.
Ingredients
Control
(g)
Ice cream
with 5%
sugar
replaced
with
inulin (g)
Ice cream
with 15%
sugar
replaced
with
inulin (g)
Ice cream
with 50%
sugar
replaced
with
inulin (g)
Ice Cream
with
100%
sugar
replaced
with
inulin (g)
Whole Milk 596 596 596 596 596
Cream 202 202 202 202 202
Sugar 100 95 85 50 0.0
NFDM 50 50 50 50 50
CSS 45 45 45 45 45
Summit
Stabilizer 7 7 7 7 7
Inulin 0 5 15 50 100
FOS 0 0 0 0 0
Total 1000 1000 1000 1000 1000
43
Table 2.3 Ice cream formulation for the control and the treatments made with FOS
substituted for sugar in the preliminary testing.
Ingredients Control (g) Ice cream
with 10%
sugar
replaced
with FOS (g)
Ice Cream
with 50%
sugar
replaced
with FOS (g)
Ice cream
with 100%
sugar
substituted
with FOS (g)
Whole Milk 596 596 596 596
Cream 202 202 202 202
Sugar 50 90 50 0
NFDM 45 50 50 50
CSS 45 45 45 45
Summit
Stabilizer 7 7 7 7
Inulin 0 0 0 0
Oligofructose 0 10 50 100
Total 1000 1000 1000 1000
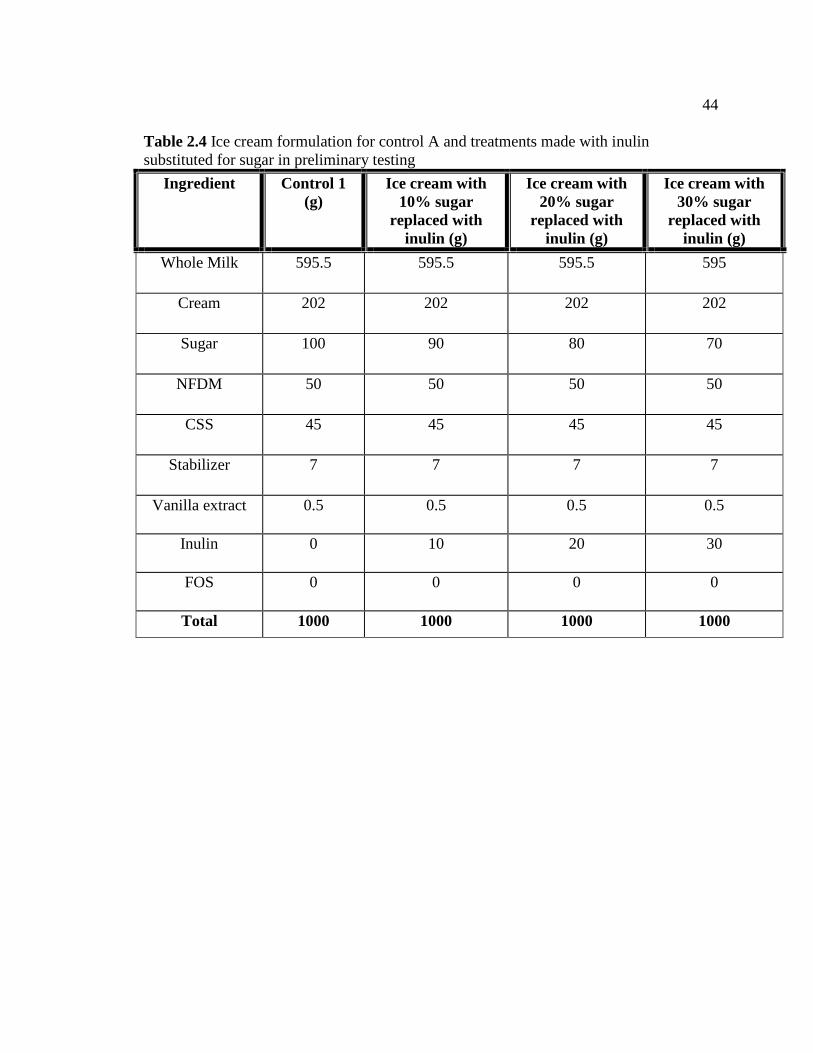
Based on initial observations, further preliminary testing was conducted replacing 10, 20
and 30% of sugar with inulin (Table 2.4) and FOS (Table 2.5) recording freezing times
(Table 2.9). The temperature of the ice cream mix, ice in the freezers, and the salt were
not standardized in the preliminary testing.
44
Table 2.4 Ice cream formulation for control A and treatments made with inulin
substituted for sugar in preliminary testing
Ingredient Control 1
(g)
Ice cream with
10% sugar
replaced with
inulin (g)
Ice cream with
20% sugar
replaced with
inulin (g)
Ice cream with
30% sugar
replaced with
inulin (g)
Whole Milk 595.5 595.5 595.5 595
Cream 202 202 202 202
Sugar 100 90 80 70
NFDM 50 50 50 50
CSS 45 45 45 45
Stabilizer 7 7 7 7
Vanilla extract 0.5 0.5 0.5 0.5
Inulin 0 10 20 30
FOS 0 0 0 0
Total 1000 1000 1000 1000
45
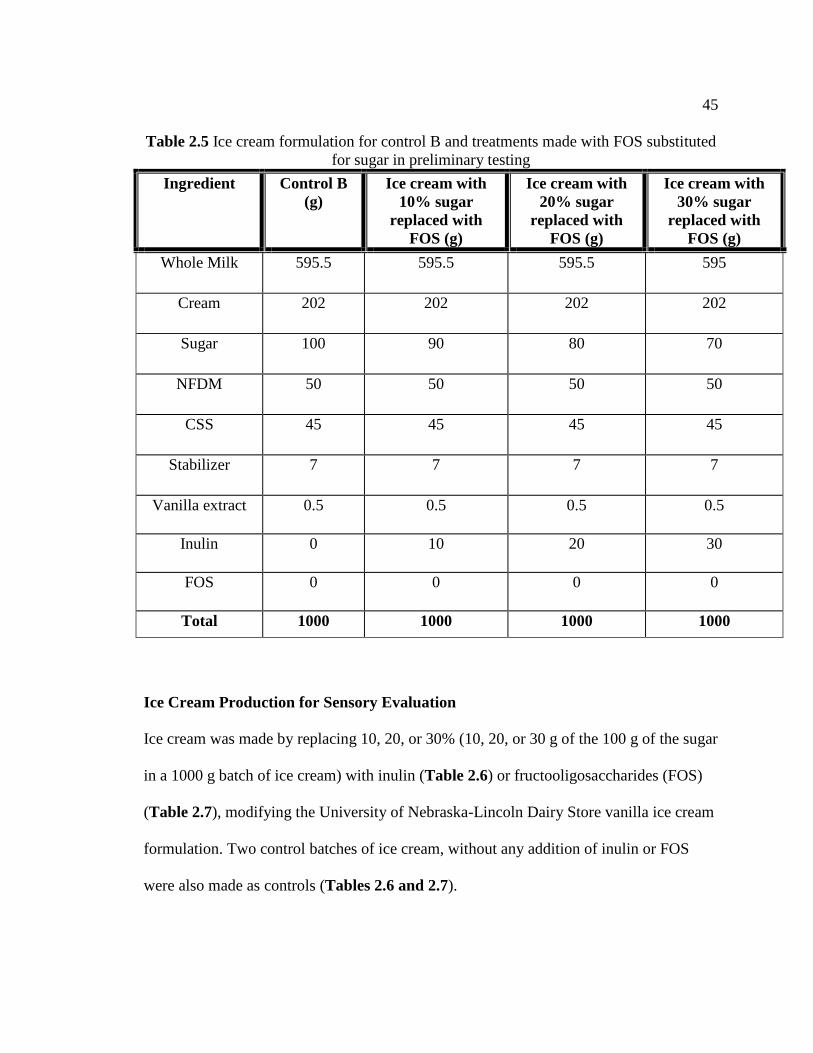
Table 2.5 Ice cream formulation for control B and treatments made with FOS substituted
for sugar in preliminary testing
Ingredient Control B
(g)
Ice cream with
10% sugar
replaced with
FOS (g)
Ice cream with
20% sugar
replaced with
FOS (g)
Ice cream with
30% sugar
replaced with
FOS (g)
Whole Milk 595.5 595.5 595.5 595
Cream 202 202 202 202
Sugar 100 90 80 70
NFDM 50 50 50 50
CSS 45 45 45 45
Stabilizer 7 7 7 7
Vanilla extract 0.5 0.5 0.5 0.5
Inulin 0 10 20 30
FOS 0 0 0 0
Total 1000 1000 1000 1000
Ice Cream Production for Sensory Evaluation
Ice cream was made by replacing 10, 20, or 30% (10, 20, or 30 g of the 100 g of the sugar
in a 1000 g batch of ice cream) with inulin (Table 2.6) or fructooligosaccharides (FOS)
(Table 2.7), modifying the University of Nebraska-Lincoln Dairy Store vanilla ice cream
formulation. Two control batches of ice cream, without any addition of inulin or FOS
were also made as controls (Tables 2.6 and 2.7).
46
Corn syrup solids (36 DE; DRI-SWEET 36) were obtained from Germantown Summit,
Roquette, IA. The stabilizer was obtained from Danisco Cultor USA, Inc., New Century,
KS. Inulin (Raftiline HP; DP >23) and fructooligosaccharide (FOS) (Raftilose P95; DP of
2-10) were obtained from Orafti Active Food Ingredients, Malvern, PA. The remaining
ingredients were purchased from a local grocery store. Liquid ingredients (milk and
cream) and dry ingredients were weighed and place in two separate containers, then the
liquid and dry ingredients were mixed together. This ice cream mix was heated on a stove
top to a temperature of 710C (160
0F) to solubilize the stabilizer. In commercial ice cream
production, raw milk would be used and a pasteurization process would occur at this
stage. After the ice cream mix was combined, each 1000g batch was poured into the
freezing chamber of a consumer ice cream maker (Hamilton Beach Ice Cream Maker).
Salt and ice were measured and placed around the freezing chamber and kept constant
between the samples. The initial amount of ice added to the freezer was 3.45 kg with an
additional amount of 1.09 kg added during the freezing process. The initial amount of salt
added to the freezer was 0.55 kg with an additional amount of 0.18 kg added when the
second amount of ice was added to the freezer. Freeze times were recorded from the time
the ice cream freezer started until the time the freezer stopped churning (Tables 2.10).
The frozen ice cream was then placed into 2-ounce plastic portion cups (PL2, Solo Cup
Co., Il). Each treatment group and the two control batches were assigned random
numbers and the samples were immediately placed in a blast freezer (U.S Cooler, I1) and
stored until one prior to the sensory evaluation. One day prior to sensory analysis, the
containers were transferred to a consumer freezer (Westinghouse) set at -20 0C (0
0F).
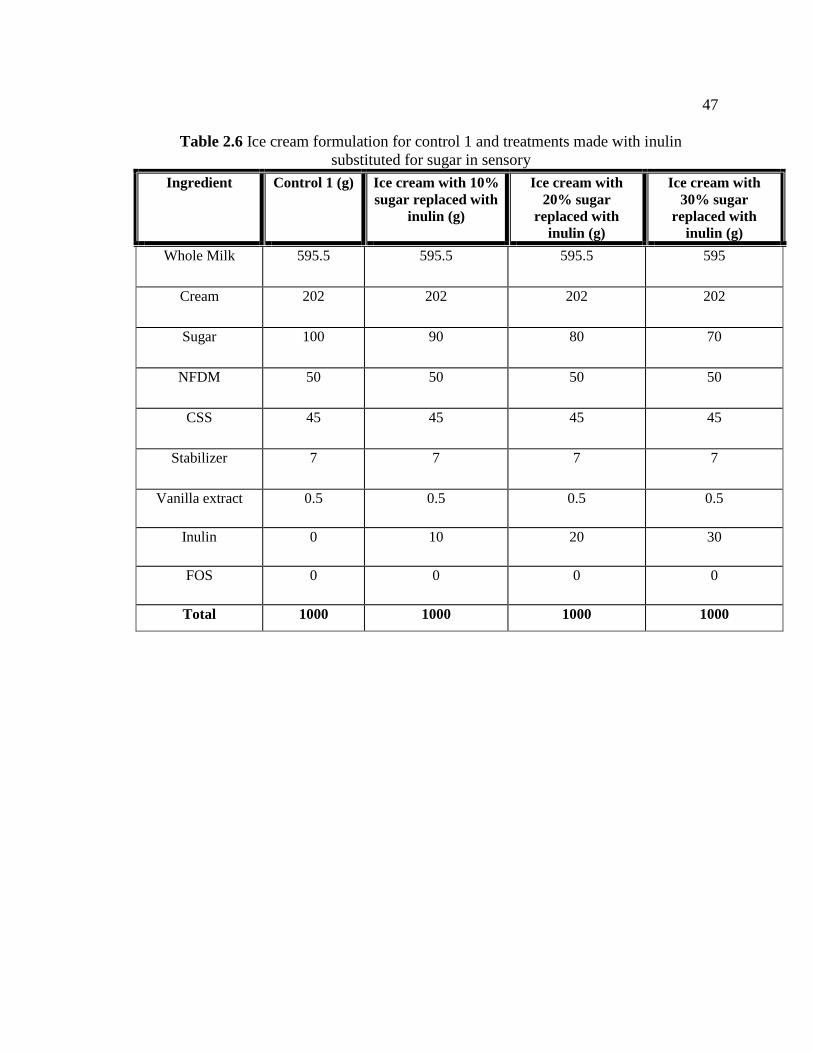
47
Table 2.6 Ice cream formulation for control 1 and treatments made with inulin
substituted for sugar in sensory
Ingredient Control 1 (g) Ice cream with 10%
sugar replaced with
inulin (g)
Ice cream with
20% sugar
replaced with
inulin (g)
Ice cream with
30% sugar
replaced with
inulin (g)
Whole Milk 595.5 595.5 595.5 595
Cream 202 202 202 202
Sugar 100 90 80 70
NFDM 50 50 50 50
CSS 45 45 45 45
Stabilizer 7 7 7 7
Vanilla extract 0.5 0.5 0.5 0.5
Inulin 0 10 20 30
FOS 0 0 0 0
Total 1000 1000 1000 1000
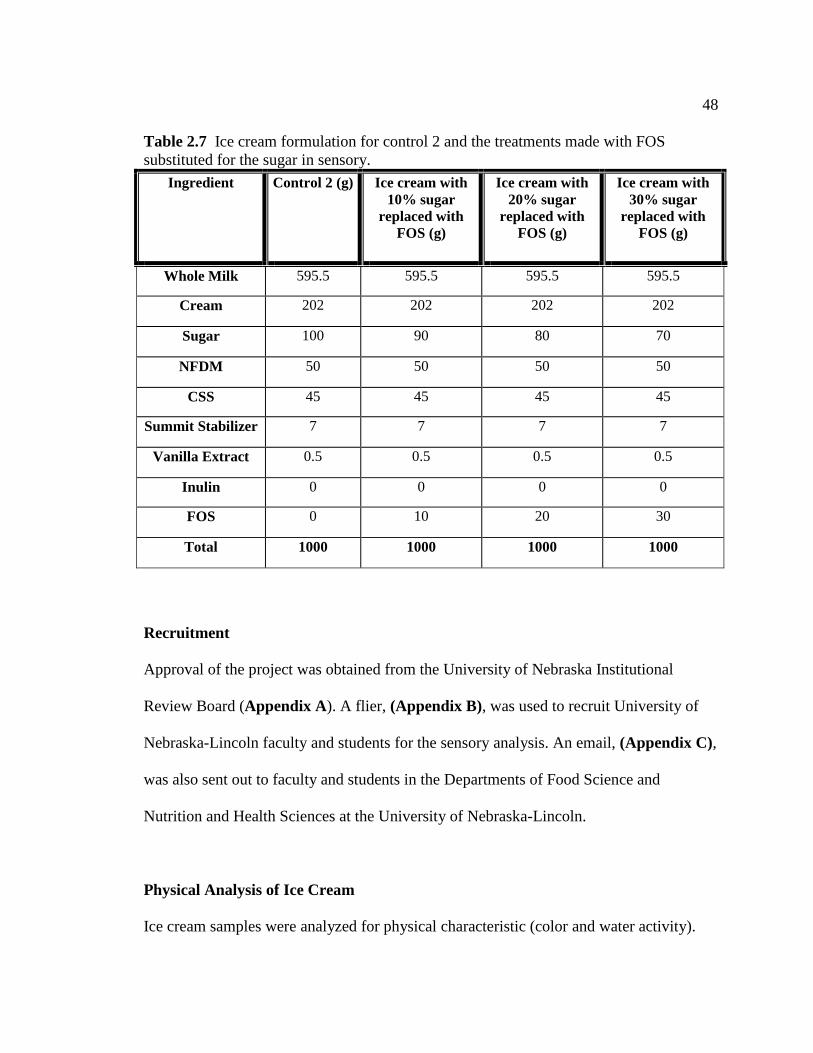
48
Table 2.7 Ice cream formulation for control 2 and the treatments made with FOS
substituted for the sugar in sensory.
Ingredient Control 2 (g) Ice cream with
10% sugar
replaced with
FOS (g)
Ice cream with
20% sugar
replaced with
FOS (g)
Ice cream with
30% sugar
replaced with
FOS (g)
Whole Milk 595.5 595.5 595.5 595.5
Cream 202 202 202 202
Sugar 100 90 80 70
NFDM 50 50 50 50
CSS 45 45 45 45
Summit Stabilizer 7 7 7 7
Vanilla Extract 0.5 0.5 0.5 0.5
Inulin 0 0 0 0
FOS 0 10 20 30
Total 1000 1000 1000 1000
Recruitment
Approval of the project was obtained from the University of Nebraska Institutional
Review Board (Appendix A). A flier, (Appendix B), was used to recruit University of
Nebraska-Lincoln faculty and students for the sensory analysis. An email, (Appendix C),
was also sent out to faculty and students in the Departments of Food Science and
Nutrition and Health Sciences at the University of Nebraska-Lincoln.
Physical Analysis of Ice Cream
Ice cream samples were analyzed for physical characteristic (color and water activity).
49
For color, colorimeter (Minolta CR-300, Konica Minolta Sensing Americas Inc., NJ) was
used. The L value signifies lightness or darkness, the b value signifies yellow or blue, and
the a value signifies red or green. For water activity, Pawkit water activity meter
(Decagon Devices Inc., WA) was used with a 0.5 oz sample and three replications were
conducted for each sample at room temperature, approximately 20°C (68°F).
Sensory Testing
Participants were asked to read and sign an informed consent form, (Appendix D) prior
to the sensory evaluation. Participants were then asked to taste four ice cream samples
consisting of a control sample and three samples of ice cream containing either inulin or
FOS replacing sugar at 10, 20, or 30%. Ice cream samples were presented all at one and
in no specific order, with random numbers written on the containers. Four different
sensory forms (Appendix E) were presented to each participant, stapled together, with
the control number on the top sheet and then in order by 10, 20 or 30% of the inulin or
FOS, with only the random numbers listed. A glass of water was included on the tray.
Participants were asked to taste the ice cream samples in the order of the sensory forms
place on the tray. Participants were asked to rate the ice cream for the sensory attributes
of sweetness, smoothness, vanilla flavor, and overall acceptability for each sample on a
175 mm anchored hedonic scale (Appendix E). Participants were instructed to cleanse
the pallet with water between tasting each sample. Participants could write additional
comments on the bottom of the sensory instrument.
50
Statistical Analysis
Data were entered into an Excel spreadsheet and uploaded to SAS (version 9.1).
Statistical analysis was conducted using SAS (version 9.1) to determine the means and
standard deviation of the physical data and sensory data. An ANOVA was conducted to
determine statistical significance and Least Square Means test was conducted to
determine differences between means.
51
Chapter 3. Results and Discussion
Preliminary Research Results and Discussion
Eight initial batches of ice cream were produced using 0, 5, 15, 50 and 100% of the sugar
substituted with inulin or 10, 50 and 100% of the sugar substituted with FOS and one
control for the preliminary research. Subjective taste and texture comparisons were made
on the initial eight batches of ice cream produced in preliminary research. The results are
provided in Table 3.1. Freeze times recorded during the second phase of the preliminary
ice cream production are listed in Table 3.2.
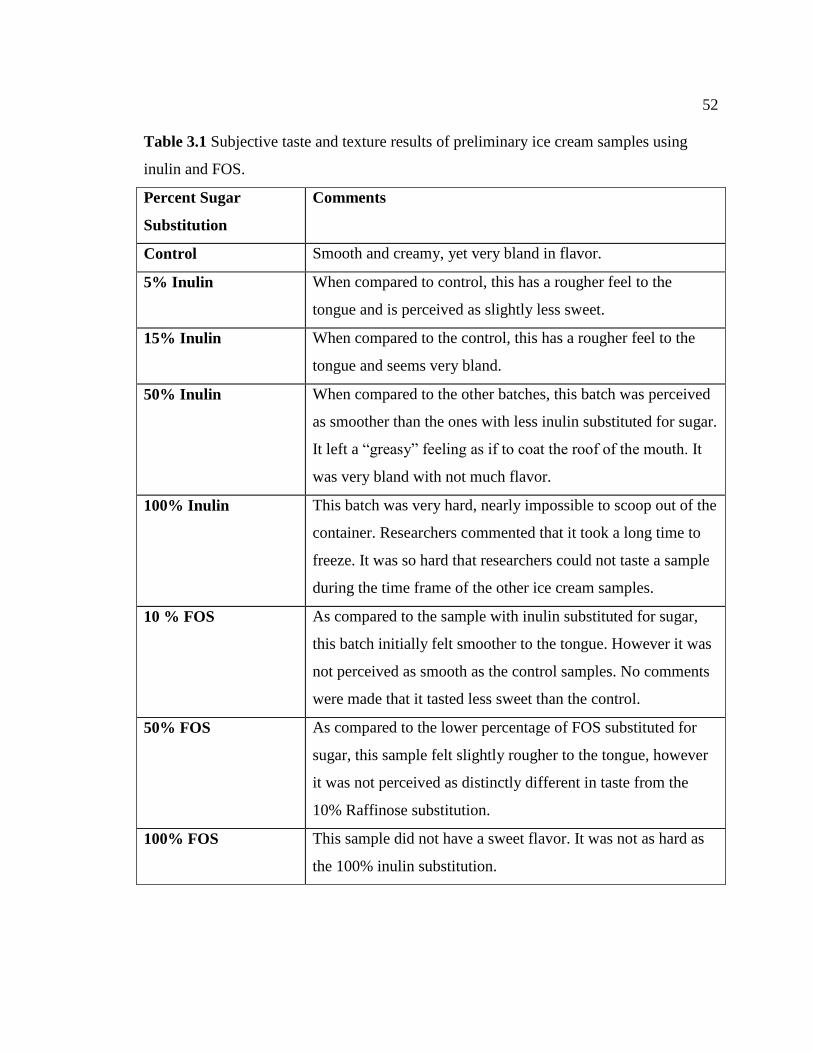
52
Table 3.1 Subjective taste and texture results of preliminary ice cream samples using
inulin and FOS.
Percent Sugar
Substitution
Comments
Control Smooth and creamy, yet very bland in flavor.
5% Inulin When compared to control, this has a rougher feel to the
tongue and is perceived as slightly less sweet.
15% Inulin When compared to the control, this has a rougher feel to the
tongue and seems very bland.
50% Inulin When compared to the other batches, this batch was perceived
as smoother than the ones with less inulin substituted for sugar.
It left a ―greasy‖ feeling as if to coat the roof of the mouth. It
was very bland with not much flavor.
100% Inulin This batch was very hard, nearly impossible to scoop out of the
container. Researchers commented that it took a long time to
freeze. It was so hard that researchers could not taste a sample
during the time frame of the other ice cream samples.
10 % FOS As compared to the sample with inulin substituted for sugar,
this batch initially felt smoother to the tongue. However it was
not perceived as smooth as the control samples. No comments
were made that it tasted less sweet than the control.
50% FOS As compared to the lower percentage of FOS substituted for
sugar, this sample felt slightly rougher to the tongue, however
it was not perceived as distinctly different in taste from the
10% Raffinose substitution.
100% FOS This sample did not have a sweet flavor. It was not as hard as
the 100% inulin substitution.
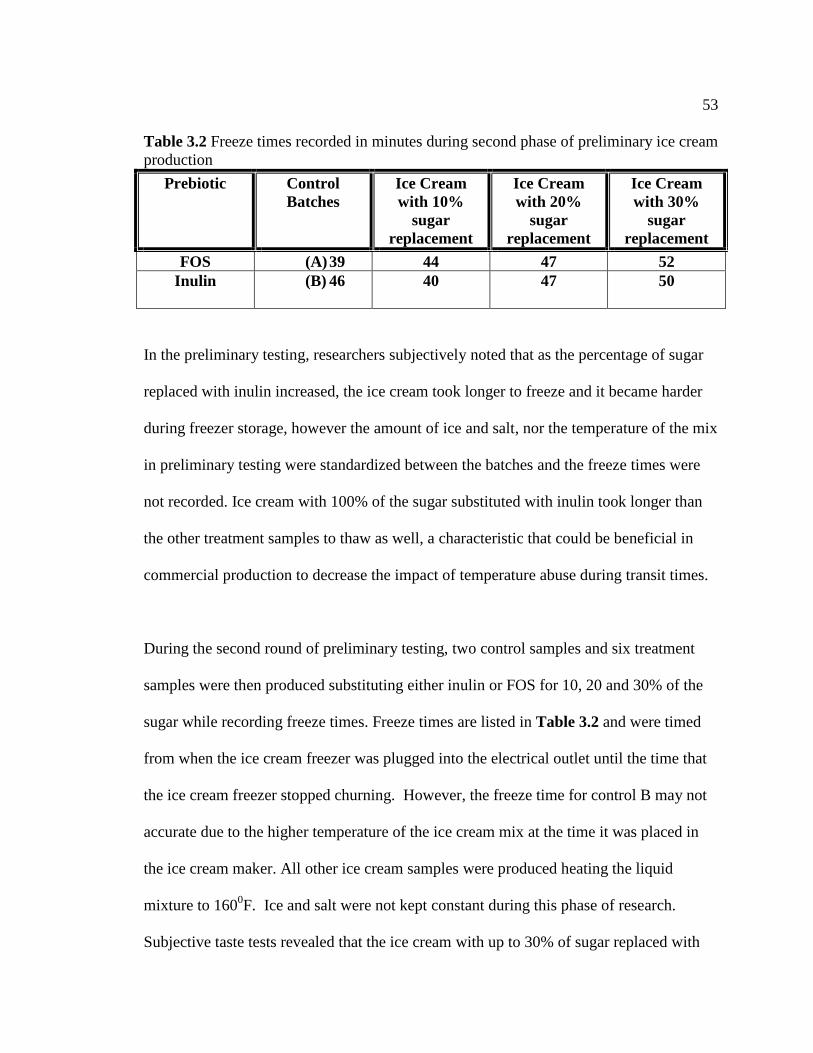
53
Table 3.2 Freeze times recorded in minutes during second phase of preliminary ice cream
production
Prebiotic Control
Batches
Ice Cream
with 10%
sugar
replacement
Ice Cream
with 20%
sugar
replacement
Ice Cream
with 30%
sugar
replacement
FOS (A) 39 44 47 52
Inulin (B) 46 40 47 50
In the preliminary testing, researchers subjectively noted that as the percentage of sugar
replaced with inulin increased, the ice cream took longer to freeze and it became harder
during freezer storage, however the amount of ice and salt, nor the temperature of the mix
in preliminary testing were standardized between the batches and the freeze times were
not recorded. Ice cream with 100% of the sugar substituted with inulin took longer than
the other treatment samples to thaw as well, a characteristic that could be beneficial in
commercial production to decrease the impact of temperature abuse during transit times.
During the second round of preliminary testing, two control samples and six treatment
samples were then produced substituting either inulin or FOS for 10, 20 and 30% of the
sugar while recording freeze times. Freeze times are listed in Table 3.2 and were timed
from when the ice cream freezer was plugged into the electrical outlet until the time that
the ice cream freezer stopped churning. However, the freeze time for control B may not
accurate due to the higher temperature of the ice cream mix at the time it was placed in
the ice cream maker. All other ice cream samples were produced heating the liquid
mixture to 1600F. Ice and salt were not kept constant during this phase of research.
Subjective taste tests revealed that the ice cream with up to 30% of sugar replaced with
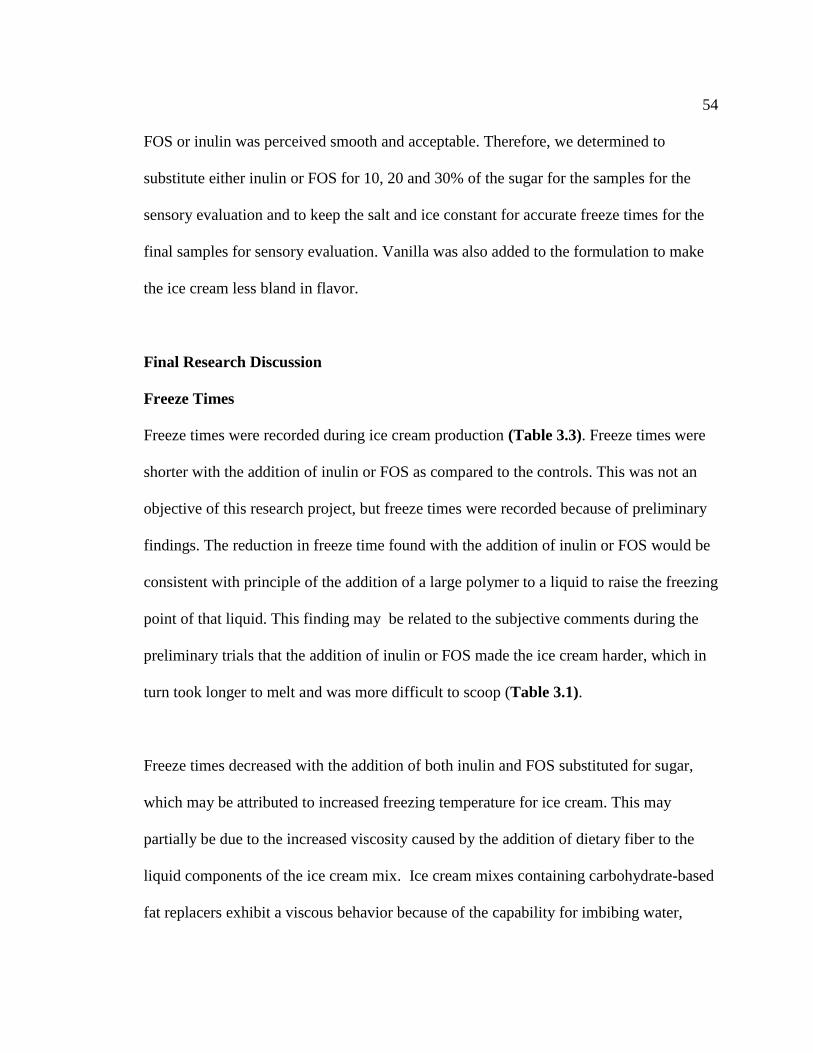
54
FOS or inulin was perceived smooth and acceptable. Therefore, we determined to
substitute either inulin or FOS for 10, 20 and 30% of the sugar for the samples for the
sensory evaluation and to keep the salt and ice constant for accurate freeze times for the
final samples for sensory evaluation. Vanilla was also added to the formulation to make
the ice cream less bland in flavor.
Final Research Discussion
Freeze Times
Freeze times were recorded during ice cream production (Table 3.3). Freeze times were
shorter with the addition of inulin or FOS as compared to the controls. This was not an
objective of this research project, but freeze times were recorded because of preliminary
findings. The reduction in freeze time found with the addition of inulin or FOS would be
consistent with principle of the addition of a large polymer to a liquid to raise the freezing
point of that liquid. This finding may be related to the subjective comments during the
preliminary trials that the addition of inulin or FOS made the ice cream harder, which in
turn took longer to melt and was more difficult to scoop (Table 3.1).
Freeze times decreased with the addition of both inulin and FOS substituted for sugar,
which may be attributed to increased freezing temperature for ice cream. This may
partially be due to the increased viscosity caused by the addition of dietary fiber to the
liquid components of the ice cream mix. Ice cream mixes containing carbohydrate-based
fat replacers exhibit a viscous behavior because of the capability for imbibing water,

55
which would increase the viscosity of the system (Schmidt and others 1993). Akalin and
others (2008) found ice cream containing inulin had higher viscosity than ice cream
containing oligofructose and suggested this might be due to the higher molecular weight
of inulin. Inulin is also highly hygroscopic and would, therefore, bind water and form a
gel-like network that, in addition to the other components in the ice cream, may affect
rheology of the mix. Similar results were reported by El-Nagar and others (2002) and
Akin (2005) for yog-ice cream and probiotic-fermented ice cream, respectively.
Previous studies indicated that inulin and FOS added to ice cream may increase the
firmness of ice cream containing probiotic bacteria Lactobacillus acidophilus La-5 and
Bifidobacterium animalis Bb-12 (Akalin and others 2002). These researchers
demonstrated that probiotic ice cream containing 4% inulin and 4% oligofructose
(compared to 1, 2 and 3% inulin and 1, 2 and 3 % oligofructose used in this project; 10,
20 and 30 g in 1000 gram batches) increased firmness throughout storage except for the
1st day. In their research, inulin exhibited a higher firmness than oligofructose. Akalin
and others (2002) also demonstrated that both inulin and oligofructose added to ice cream
improved the melting properties of ice cream. The ice cream remained firm longer at
room temperature, with inulin exhibiting the lowest change in melting properties.
56
Table 3.3 Freeze times recorded in minutes during final ice cream production
Prebiotic Control
Batches
Ice Cream
with 10%
sugar
replacement
Ice Cream
with 20%
sugar
replacement
Ice Cream
with 30%
sugar
replacement
FOS 42 35 27 33
Inulin 37 30 30 30
Color
Color measurements for the control samples (n = 12) were compared to samples
containing 10, 20, or 30% of sugar substituted with either inulin or FOS (n = 6 for each
treatment) (Table 2.11). Ice cream with inulin substituted for 30% of the sugar was
significantly darker compared to all treatment samples including the control. Ice cream
with sugar substituted with 20% inulin and 20% FOS were significantly darker than the
control, however ice cream with 30% of sugar substituted with FOS was not significantly
darker than the control. It appears that both inulin and FOS darken the color of the
products at 20% but this trait may not appear at higher concentrations of FOS where it
continues to darken with additional inulin. There were no significant differences in color
measurements between the control and treatment samples for yellow/blue (P < 0.05 and
the red/green (a) values.

57
Water Activity
No significant differences were found in water activity between the control and treatment
samples (Table 2.11). Water activity is affected by temperature with increasing water
activity for increasing temperature. Water activity measurements were made controlling
for temperature for all the ice cream samples.
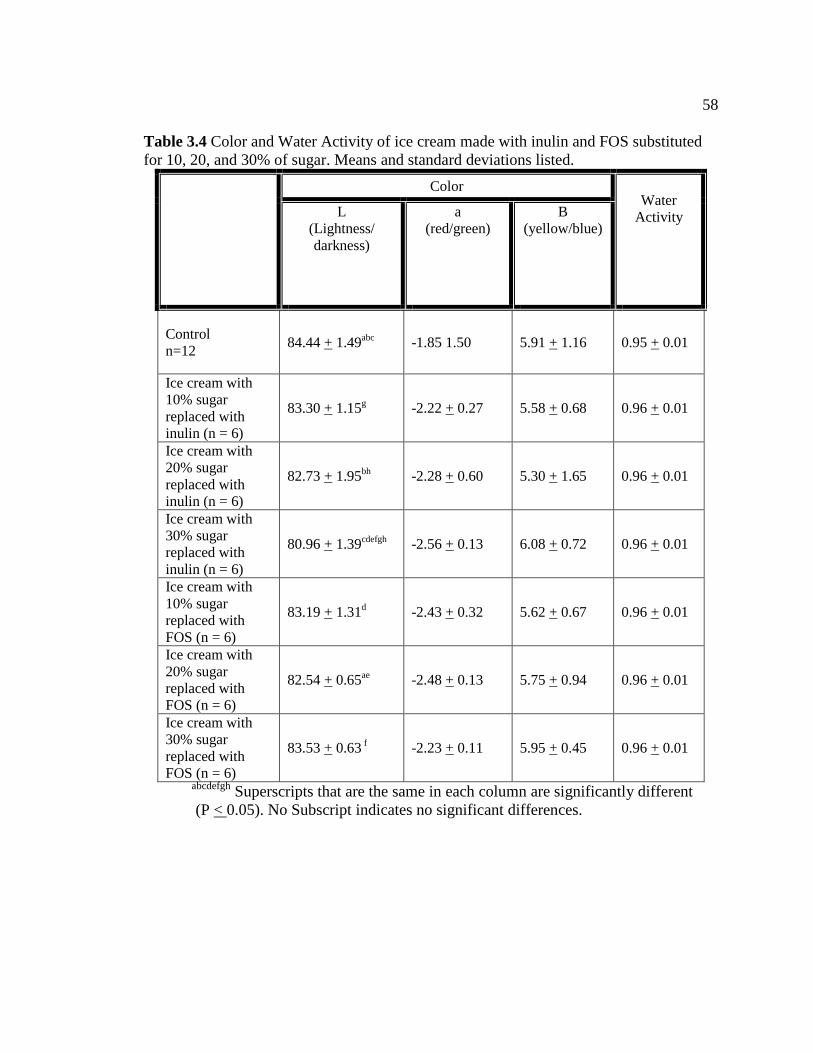
58
Table 3.4 Color and Water Activity of ice cream made with inulin and FOS substituted
for 10, 20, and 30% of sugar. Means and standard deviations listed.
Color
Water
Activity
L
(Lightness/
darkness)
a
(red/green)
B
(yellow/blue)
Control
n=12 84.44 + 1.49
abc -1.85 1.50
5.91 + 1.16 0.95 + 0.01
Ice cream with
10% sugar
replaced with
inulin (n = 6)
83.30 + 1.15g -2.22 + 0.27 5.58 + 0.68 0.96 + 0.01
Ice cream with
20% sugar
replaced with
inulin (n = 6)
82.73 + 1.95bh
-2.28 + 0.60 5.30 + 1.65 0.96 + 0.01
Ice cream with
30% sugar
replaced with
inulin (n = 6)
80.96 + 1.39cdefgh
-2.56 + 0.13 6.08 + 0.72 0.96 + 0.01
Ice cream with
10% sugar
replaced with
FOS (n = 6)
83.19 + 1.31d -2.43 + 0.32
5.62 + 0.67 0.96 + 0.01
Ice cream with
20% sugar
replaced with
FOS (n = 6)
82.54 + 0.65ae
-2.48 + 0.13 5.75 + 0.94 0.96 + 0.01
Ice cream with
30% sugar
replaced with
FOS (n = 6)
83.53 + 0.63 f -2.23 + 0.11 5.95 + 0.45 0.96 + 0.01
abcdefgh Superscripts that are the same in each column are significantly different
(P < 0.05). No Subscript indicates no significant differences.
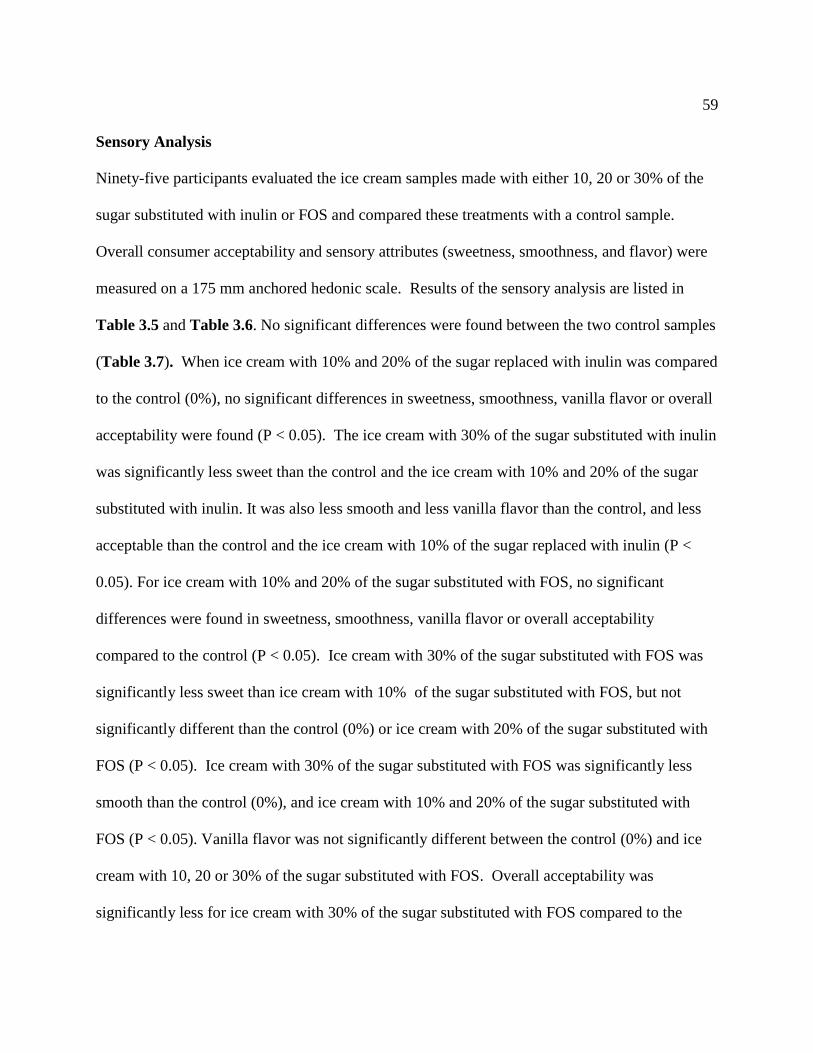
59
Sensory Analysis
Ninety-five participants evaluated the ice cream samples made with either 10, 20 or 30% of the
sugar substituted with inulin or FOS and compared these treatments with a control sample.
Overall consumer acceptability and sensory attributes (sweetness, smoothness, and flavor) were
measured on a 175 mm anchored hedonic scale. Results of the sensory analysis are listed in
Table 3.5 and Table 3.6. No significant differences were found between the two control samples
(Table 3.7). When ice cream with 10% and 20% of the sugar replaced with inulin was compared
to the control (0%), no significant differences in sweetness, smoothness, vanilla flavor or overall
acceptability were found (P < 0.05). The ice cream with 30% of the sugar substituted with inulin
was significantly less sweet than the control and the ice cream with 10% and 20% of the sugar
substituted with inulin. It was also less smooth and less vanilla flavor than the control, and less
acceptable than the control and the ice cream with 10% of the sugar replaced with inulin (P <
0.05). For ice cream with 10% and 20% of the sugar substituted with FOS, no significant
differences were found in sweetness, smoothness, vanilla flavor or overall acceptability
compared to the control (P < 0.05). Ice cream with 30% of the sugar substituted with FOS was
significantly less sweet than ice cream with 10% of the sugar substituted with FOS, but not
significantly different than the control (0%) or ice cream with 20% of the sugar substituted with
FOS (P < 0.05). Ice cream with 30% of the sugar substituted with FOS was significantly less
smooth than the control (0%), and ice cream with 10% and 20% of the sugar substituted with
FOS (P < 0.05). Vanilla flavor was not significantly different between the control (0%) and ice
cream with 10, 20 or 30% of the sugar substituted with FOS. Overall acceptability was
significantly less for ice cream with 30% of the sugar substituted with FOS compared to the
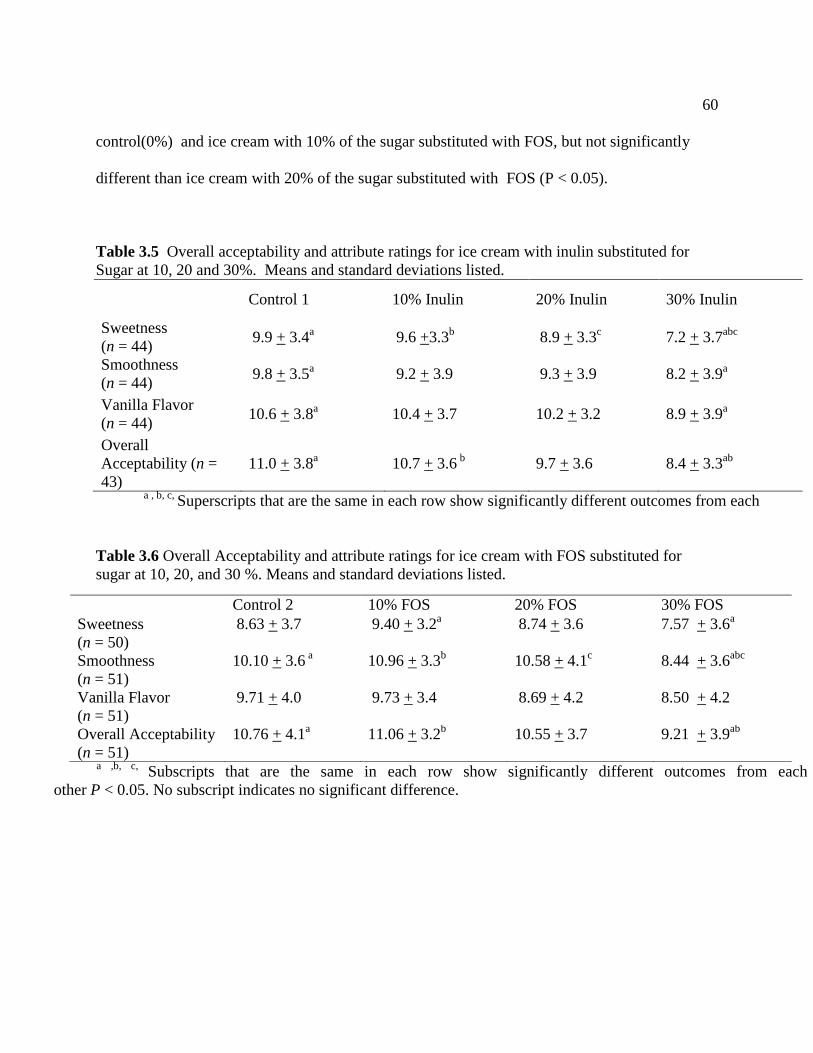
60
control(0%) and ice cream with 10% of the sugar substituted with FOS, but not significantly
different than ice cream with 20% of the sugar substituted with FOS (P < 0.05).
Table 3.5 Overall acceptability and attribute ratings for ice cream with inulin substituted for
Sugar at 10, 20 and 30%. Means and standard deviations listed.
Control 1 10% Inulin 20% Inulin 30% Inulin
Sweetness
(n = 44) 9.9 + 3.4
a 9.6 +3.3
b 8.9 + 3.3
c 7.2 + 3.7
abc
Smoothness
(n = 44) 9.8 + 3.5
a 9.2 + 3.9 9.3 + 3.9 8.2 + 3.9
a
Vanilla Flavor
(n = 44) 10.6 + 3.8
a 10.4 + 3.7 10.2 + 3.2 8.9 + 3.9
a
Overall
Acceptability (n =
43)
11.0 + 3.8a 10.7 + 3.6
b 9.7 + 3.6 8.4 + 3.3
ab
a , b, c, Superscripts that are the same in each row show significantly different outcomes from each
Table 3.6 Overall Acceptability and attribute ratings for ice cream with FOS substituted for
sugar at 10, 20, and 30 %. Means and standard deviations listed.
a ,b, c, Subscripts that are the same in each row show significantly different outcomes from each
other P < 0.05. No subscript indicates no significant difference.
Control 2 10% FOS 20% FOS 30% FOS
Sweetness
(n = 50)
8.63 + 3.7 9.40 + 3.2a
8.74 + 3.6 7.57 + 3.6a
Smoothness
(n = 51)
10.10 + 3.6 a 10.96 + 3.3
b 10.58 + 4.1
c 8.44 + 3.6
abc
Vanilla Flavor
(n = 51)
9.71 + 4.0 9.73 + 3.4 8.69 + 4.2 8.50 + 4.2
Overall Acceptability
(n = 51)
10.76 + 4.1a 11.06 + 3.2
b 10.55 + 3.7 9.21 + 3.9
ab
61
Table 3.7 Comparison of the 2 control samples. Means and standard deviations listed.
Control 1
(n = 44)
Control 2
(n = 51)
P value
Sweetness 9.87 + 3.4 8.63 + 3.7 P = .08
Smoothness 9.83 + 3.5 10.10 + 3.6 P = .72
Vanilla Flavor 10.64 + 3.8 9.71 + 4.0 P = .24
Overall Acceptability 11.03 + 3.8 10.76 + 4.1 P = .72
No significant difference were indicated (P = 0.05)
During the sensory evaluation, participants had the opportunity to make comments on their
sensory forms. The number of participants who made similar comments is listed in parenthesis
behind the comment. One participant mentioned the 10 % FOS sample was difficult to scoop, but
no participants mentioned grittiness or ice crystals. In the 20% FOS sample, one participant
mentioned it was smoother than the 30% FOS sample, other comments included: their favorite of
the four (1), creamy and good texture (2), creamy but gritty (1), sugar appears to be crystallizing
out (1). In the 30% FOS sample, comments included: not very creamy and after-taste (1), gritty
or icy (3), didn’t taste right (1), not as good as control (1). Comments on the 10% inulin sample
included: very smooth (1), still too sweet (1), funny texture (1), keeper and best flavor (1), coated
mouth (1), gritty (1), a little blah (1), hard (1), needs more sweetness (1). In the 20% inulin
sample, comments included: sweeter (2), after-taste (1), gritty or grainy (4), hard (1), best sample
or keeper (6). Comments on the 30% inulin samples included: clumpy (9), didn’t care for or not
great (3), fluffy (1), very smooth and creamy (2), the best one (1). Comments on the control for
the inulin included: very good and not too sweet (1), after-taste (2), sweet (3), strange film (1),
62
favorite sample (3), gritty (2). Lum and Albrecht (2007) reported on sensory evaluation
conducted on ice cream with 10% of sugar replaced with inulin or FOS. Seventy-one participants
evaluated the ice cream and liked the ice cream made with inulin or FOS equally well (p < 0.05).
However, the participants liked the control sample better than ice cream with 10% of the sugar
substituted with either inulin or FOS (p < 0.001).
Di Criscio and others (2010) reported ice cream with 2.5% inulin did not alter physical or
sensory characteristics of ice cream significantly; however ice cream with high inulin (10%)
altered the physical and sensory characteristics of ice cream. Our results support ice cream with
up to 2% inulin or FOS (20% of the sugar substituted with inulin or FOS) is acceptable.
Conclusion
Inulin and FOS are potential ingredients for use in ice cream; they may however, have an effect
on physical and sensory attributes when substituted for sugar in ice cream. Future research
should include tests for hardness. Considerations for ice cream producers:
The color of ice cream may be affected (slightly more green) when more than 30 % of
sugar is substituted for inulin in ice cream
Inulin and FOS may darken the color of ice cream when substituted for greater than
20% of the sugar.
Inulin or FOS substituted for up to 20% of sugar in ice cream does not affect
sweetness, smoothness, vanilla flavor or overall acceptability

63
These results suggest that inulin and FOS may be acceptable ingredients in ice cream when
substituted for up to 20% of sugar. However, more research is needed to confirm these results.
64
References
Abrams SA, Griffin IJ, Hawthorne KM, Liang L, Gunn SK, Darlinton G, Ellis KJ. 2005.
A combination of prebiotic short- and long-chain inulin-type fructans enhances calcium
absorption and bone mineralization in young adolescents. Am J Clin Nutr 82:471-6.
Agrawal R. 2009. Probiotics: an emerging food supplement with health benefits. Food
Biotechnol 19:227-46.
Akalin AS, Erisir D. 2008. Effects of inulin and oligofructose on the rheological
characteristic and probiotic culture survival in low-fat probiotic ice cream. Inst Food
Tech 73:184-188.
Akalin A, Fenderya S, Akbulut N. 2003. Viability and activity of bifidobacteria in
yoghurt containing fructooligosacharides during refrigerated storage. Int J Food Sci
39:613-21.
Akin MB, Akin MS, Kirmaci Z. 2007. Effects of inulin and sugar levels on the viability
of yogurt and probiotic bacteria and the physical and sensory characteristics in probiotic
ice cream. Food Chem 104:93–9.
Akiyama K, Shimada M, Ishizeki S, Takigawa I, Imura S, Yamauchi K, Hatano M, Abe N,
Yaeshima T, Hayasawa H & Shimimura S. 1994. Effects of administration of
Bifidobacterium in extremely premature infants: Development of intestinal microflora by
orally administered Bifidobacterium longum (in comparison with Bifidobacterium breve).
Acta Neonatologica Japonica. 30, 257-263.
Alamprese C, Foschino R, Rossi M, Pompei C, Savai L. 2002. Survival of Lactobacillus
Johnsonii La1 and influence of its addition in retail-manufactured ice cream produced
with different sugar and fat concentrations. Int Dairy J 12:201-8.
Beringer A, Wenger R. 1995. Anulin in der emdihrung des diabetikers. Dtsch. Zeitschr. f.
Yerdauungs-u.Dtofwechselkrankh. 15:268-72.
Bernet MF, Brassart D, Neeser JR, Servin AL. 1994. Lactobacillus acidophilus LA1
binds to cultured human intestinal cell lines and inhibits cell attachment and cell invasion
by enterovirulent bacteria. Gut 35:483-489.
Björkstén BM, Sepp E, Julge K, Voor T, Mielsaar M. 2001. Allergy development and the
intestinal microflora during the first year of life. J Allergy Clin Immunol 108:516-20.
Birillo, GA, Reinheimer JA, Vinderola CG. 2000. Viability of lactic acid microflora in
different types of yoghurt. Food Res. Int., 33: 799-805.
65
Boeckner LS, Schnepf MI, Tungland BC. 2001. Inulin: A review of nutritional and
health implications. Adv Food Nutr Res. 43:1-63.
Bosscher D, Van Loo J, Franck A. 2006a. Inulin and oligofructose as prebiotices in the
prevention of intestinal infections and diseases. Nutr Res Rev 19(2):216-26.
Bosscher D, Van Loo J, Franck A. 2006b. Inulin and oligofructose as functional
ingredients to improve bone mineralization. Int Dairy J 16:1092-7.
Bouhnik Y, Flourie B, Andrieux C, Bisetti N, Briet F, Rambaud J-C. 1996. Effects of
bifidobacterrium sp fermented milk ingested with or without inulin colonic bifidobacteria
and enzymatic activities in healthy humans. Eur J Clin Nutr 50:267-73.
Bouhnik Y, Flourie B, D´Agay-Abensour L, Pochart P, Gramet G, Durand M, Rambaud
JC. 1997. Administration of transgalacto-oligosaccharides increases fecal bifidobacteria
and modifies colonic fermentation metabolism in healthy humans. J Nutr 127:444-8.
Bouhnik Y, Vahedi KAL, Attar A, Salfati J, Pochart P, Marteau P, Flourie B, Bornet F,
Rambaud JC.1999. Short-chain fructo-oligosaccharide administration dose-dependently
increases faecal bifidobacteria in healthy humans. J Nutr 129:113-116.
Bouhnik Y, Raskine L, Simoneau G, Vicaut E, Neut C, Flouri B, Brouns F, Bournet FR.
2004. The capacity of nondigestible carbohydrates to stimulate fecal beifidobacteria in
healthy humans: a double-blind randomized, placebo-controlled, parallel-group, dose-
response relation study. Am J Clin Nutr 80:1658-64.
Boyle R, Tang M. 2006. The role of probiotics in the management of allergic disease.
Clinical & Experimental Allergy 36(5):568-76.
Briet F, Achour L, Flourie B, Beaugerie L, Pellier P, Franchisseur C, Bornet F, Rambaud
JC. 1995a. Symptomatic response to varying levels of fruto-oligosaccharides consumed
occasionally or regularly. Eur J Clin Nutr 49:501-7.
Brown L, Rosner B, Willet WW, Sacks FM. 1999b. Cholesterol lowering effects of
dietary fiber: a meta-analysis. Am J Clin Nutr 69(1):30-42
Campbell JM, Fahey GC Jr, Wolf BW. 1997. Selected indigestible oligosaccharides
affect large bowel mass, cecal and fecal short-chain fatty acids, pH and microflora in rats.
J Nutr 127:130-6.
Capela P, Hay T, Shah N. 2006. Effect of cryoprotectants, prebiotics and
microencapsulation on survival of probiotic organisms in yoghurt and freeze-dried
yoghurt. Food Res Int 39(2):203-11.
66
Champagne CP, Garderner NJ, Roy D. 2005. Challenges in the addition of probiotic
cultures to foods. Critical Reviews in Food Science and Nutrition 45(1):61-84.
Chawla R, Patil GR. 2010. Soluble Dietary Fiber. Comprehensive Reviews in Food
Science and Food Safety 9(2):178-96.
Christiansen PS, Edelsten D, Kristiansen JR, Nielsen EW. 1996. Some properties of ice
cream containing Bifidobacterium bifidum and Lactobacillus acidophilus.
Milchwissenschaft 51:502-4.
Collins M, Gibson G. 1999. Probiotics, prebiotics and synbiotics: dietary approaches for
the modulation of microbial ecology. Am J Clin Nutr 69:1052-1057.
Coudray C, Bellanger J, Castiglia-Delavaud C, Vermorel V, Rayssiguier Y. 1997. Effect
of soluble or partly soluble dietary fibres supplementation on absorption and balance of
calcium, magnesium, iron and zinc in healthy young men. Eur J Clin Nutr 51:375-80.
Coudray C, Feillet-Coudray C, Tressol JC, Gueux E, Thien S, Jaffrelo L, Mazur A,
Rayssiguier Y. 2005. Stimulatory effect of inulin on intestinal absorption of calcium and
magnesium in rats is modulated by dietary calcium intakes. Eur J Nutr 44:293-302.
Coussement PA. 1999. Anion and oligofructose: Safe intakes and legal status. J Nuts
129:14125-75.
Cross M, Stevenson L, Gill H. 2001. Anti-allergy properties of fermentented foods: An
important immunoregulatroy mechanism of lactic acid bacteria? Int Immunopharmacol
1(5):891-901.
Cruz A, Antunes A, Sousa A, Faria J, Saad S. 2009. Ice-cream as a probiotic food carrier.
Food Research Int 42(9):1233-39.
Cummings JH, Roberfroid MB, Andersson H. 1997. A new look at dietary carbohydrate:
Chemistry, physiology and health. Eur J Clin Nutr 51:417-423.
Dai D, Nanthakumar NN, Newburg DS, WA Walker WA. 2000. The role of
oligosaccharides and glycoconjugates in intestinal host defense. J Ped Gastr Nutr 30:
S23-33.
Dave RI, Shah NP. 1996. Evaluation of media for selective enumeration of Streptococcus
thermophilus, Lactobacillus delbrueckii ssp. bulgaricus, Lactobacillus acidophilus and
Bifidobacteria, J Dairy Sci 79:1529-39.
67
Dave RI, Shah NP. 1997. Effectiveness of asborbic acid as an oxygen scavenger in
improving viability of probiotic bacteria in yogurts made with commercial starter
cultures. Int Dairy Jour 7:435-43.
Davidson RH, Duncan SE, Hackney CR, Eigel WN, Boling JW. 2000. Probiotic culture
survival and implications in fermented frozen yoghurt characteristics. J Dairy Sci 83:666-
73.
Davies R, Obafemi A. 1985. Response of micro-organisms to freeze-thaw stress. In:
Robinson RK, Editor. Microbioloty of frozen foods. London, U.K.:Elsevier Aplied
Science Publishers. p 83-107.
Delzenne N, Kok N., Fiordaliso M, Deboyser D, Goethals F, Roberfroid M. 1993.
Dietary fructooligosaccharides modify lipid metabolism in rats. Am. J. Clin. Nutr.
57:S820.
Devereux HN, Jones GP, McCormack L, Hunter WC. 2003. Consumer acceptability of
low fat foods contain inulin an doligofructose. J Food Sci 68:1850-4.
Di Criscio T, Frantianni A, Minogna R, Cinquanta L, Coppola R, Sorrentino E, Pnfili G.
2010. Production of functional probiotic, prebiotic and symbiotic ice creams. J Dairy Sci
93:4555-63.
Donker O, Nilmini S, Stolic P, Vasiljevic T, Shah N. 2007. Survival and activity of
selected probiotic organisms in set-type yoghurt during cold storage. Int. Dairy J
17(6):657-65.
Eckburg, PB, Bik EM, Bernstein CN, Purdom E, Dethlefsen L, Sargent M, Gill SR,
Nelson KE, Relman DA. 2005. Diversity of the human intestinal microbial flora. Science
308:1635–38
El-Nagar G, Clowes G, Tudorica CM, Kuri V, Brennan CS. 2002. Rheological quality
and stability of yog-ice cream with added inulin. Int J Dairy Technol 55:89-93.
Fiordaliso M, Kok N. Desager JP., Goethals F, Deboyser D, Roberfroid M, Delzenne N.
1995. Dietary oligofructose lowers triglycerides, phospholipids and cholesterol in serum
and VLDL of rats. Lipids 30:163–67.
Food and Drug Administration. 2003. Agency response letter GRAS Notice No. GRN
008118. Available at http://www.cfsan.fda.gov/-rdb/opa-g118.html. Accessed August 18,
2008.
Franck A. 2002. Technological functionality of inulin and oligofructose. Br J Nutr 2:287-
91.
68
Fuller R. 1989. Probiotics in man and animals. J Appl Bacteriol 66:365-78.
Fuller R. 1991. Probiotics in human medicine. Gut 32: 439-442.
Fuller R. 1992. Probiotics. The Scientific Basis. Chapman & Hall, London, U.K.
Gilbert L, Sloan E. 1998. Food industry forecast: consumer trends to 2020 and beyond.
Food Technol 52:31-44.
Gibson Gr, Wang X. 1994a. Bifidogenic properties of different types of
fructooligosaccharides. Food Microbiol 11:491-8.
Gibson GR, Wang X. 1994b. Inhibitory effects of bifidobacteria on other colonic
bacteria. J Appl Bact 77:412-20.
Gibson Gr, Roberfroid MB. 1995. Dietary modulation of the human colonic microbiotia:
Introducing the concept of prebiotics. J Nutr 125:1401-12.
Gibson G, Beatty E, Wang X, Cummings JH. 1995. Selective stimulation of
bifidobacteria in the human colon by oligofructose and inulin. Gastroenterol108:975 -82.
Gnoth MJ, Kunz C, Kinne-Saffran E, Rudloff S. 2000. Human milk oligosaccharides are
minimally digested in vitro. J Nutr 130:3014-3020.
Goff HD, Griffiths MW. 2006. Major advances in fresh milk and milk products. J. Dairy
Sci., 89: 1163-1173.
Granato D, Branco GF, Cruz AG, Faria JAF, Shah NP. 2010. Probiotic dairy products as
functional foods. Comprehensive Reviews in Food Science and Food Safety 9(5):455-70.
Guarner F, Malagelad JR. 2003, Gut flora in health and disease. Lancet 361:512-19.
Guven M, Karaca OB. 2002. Survival of probiotic cultures in low-fat ice-cream-type
frozen yogurts. Int J Dairy Tech 55:27-31.
Hagen M, Narvhus JA. 1999. Productions of ice cream containing probiotic bacteria.
Milchwissenschaft 54:265-8.
Hamman W, Marth E. 1984. Survival of Streptococcus thermophilus and Lactobacillus
bulgaricus in Commercial and Experimental Yoghurts. J Food Protect 47:781-786.
69
Hekmat S, McMahon DJ. 1992 Survival of Lactobacillus acidophilus and
Bifidobacterium bifidum in ice cream for us as probiotic food. Jour Dairy Sci 75:1415-
22.
Homayouni A, Azizi A, Ehsani MR, Yarmand MS, Razavi SH. 2008. Effect of
microencapsulation and resistant starch on the probiotic survival and sensory properties
of symbiotic ice cream. Food Chemistry 111:50-5.
Hunter JO, Tuffnell Q, Lee AJ. 1999. Controlled trial of oligofructose in the management
of irritable bowel syndrome. J Nutr 129:1451S-3S.
Ishibashi N, Yaeshima T and Hayasawa H. 1997. Bifidobacteria: Their significance in
human intestinal health. Mal J Nutr 3:149-59.
Izzo M and Franck A. 1998. Nutritional and health benefits of inulin and oligofructose
conference. Trends in Food Science and Technology 9:255–7.
Jenkins D, Raynolds D, Slavin B, Leeds A, Jenkins A, Jepson E. 1980. Dietary fiber and
blood lipids; Treatment of hypercholesterolemia with guar crispbread. Am J Clin Nutr
33:575-81.
Jenkins DJ, Kendall CW, Vuksan V. 1999. Inulin, oligofructose and intestinal function. J
Nutr 129:14315-35.
Kailasapathy K, Harmstorf I, Phillips M. 2008. Survival of Lactobacillus acidophilus and
Bifidobacterium animalis spp. lactis in stirred fruit yogurts. LWT—Food Sci Technol
41:1317–22.
Kailasapathy K, Sultana K. 2003. Survival and b-galactosidase activity of encapsulated
and free Lactobacillus acidphilus and Bifidobacterium lactis in ice-cream. Australian J of
Dairy Tech 58:223-7.
Kleessen B, Sykura B, Zunft H, Zunft J, Blaut M. 1997. Effects of inulin and lactose on
fecal microflora, microbial activity and bowel habit in elderly constipated persons. Am J
Clin Nutr 65:1397-1402.
Kok N, Roberfroid M, Robert A, Delzenne N. 1996. Involvement of lipogenesis in the
lower VLDL secretion induced by oligofructose in rats. Br J Nutr 76:881–90.
Koletzko B, Agget PJ, Bindels J, Bund P, Ferre P, Gil A, Lentze MJ, Roberfroid M,
Strobel S. 1998. Growth, development and differentiation: a functional food science
approach. Br J Nutr 1:S5-45.
70
Kritchevsky D, Tepper S. 1995. Influence of dietary fiber on establishment and
progression of atherosclerosis in rabbits. J Nutr Biochem 4(6):509-12.
Kruse HP, Kleessen B, Blaut M. 1999. Effects of inulin on faecal bifidobacteria
in human subjects. Br J Nutr 82:375–382.
Laroia S, Martin JH. 1991. Effect of pH on survival of Bifidobacterium bifidum and
Lactobacillus acidophilus in frozen fermented desserts. Cultured Dairy Products Journal
26:3-21.
Levrat, MA, Remesy, C, Demigne C. 1991. High propionic acid fermentations and
mineral accumulation in the cecum of rats adapted to different levels of inulin. J. Nutr.
121:1730-7.
Lourens-Hattingh A, Viljoen B. 2001. Yogurt as probiotic carrier food. Int. Dairy J.
11:1–17.
Lum, AK, and Albrecht JA. 2008. Sensory evaluation of ice cream made with prebiotic
ingredients. RURALS.
http://digitalcommons.unl.edu/cgi/viewcontent.cgi?article=1033&context=rurals
Maha T, Tressol J, Arnaud J, Bornet F, Couteloup-Demange C, Feillet-Coudray C,
Brandolini M, Ducros V, Pepin D, Browns F, Roussel AM, Rayssiguier Y, Coudray C.
2003. Effect of short-chain fructooligosaccharides on intestinal calcium absorption and
calcium status in postmenopausal women: A stable-isotope study. Am J Clin Nutr
77:449-57.
Marshall R, Goff H, Hartel R. 2003. Ice Cream. New York: Springer p357.
Meile L, Ludwig W, Rueger U, Gut C, Kaufmann P, Dasen G, Wenger S, Teuber M.
1997. Bifidobacterium lactis Bifidobacterium lactis sp. nov., a moderately oxygen
tolerant species isolated from fermented milk. Syst. Appl. Microbiol. 20:57-64.
Menne E, Guggenbuhl N. 2000. Fn-type chicolry inulin hydrolysate has a prebiotic effect
in humans. J Nutr 130:1197-99.
Mitsouka T. 1984. Taxonomy and ecology of bifidobacteria. Bifidobacteria Microflora
3:11-28.
Mohammadi R, Mortazavian AM, Khosrokhavar R, Gomes Da Cruz A. 2010. Ann
Microbiol DOI 10.1007/s13213-010-0188-z.
http://www.springerlink.com/content/m153w1q4tt070573/abstract. Posted January 06,
2011.
71
Moshfegh AJ, Friday JE, Goldman JP. 1999. Presence of inulin and oligofructose in the
diets of Americans. J Nutr 129:1407S-1411S.
Niness K. 1999. Inulin and oligofructose. What are they? J Nutr 129:S1402-6.
Ohta A, Ohtusuki M, Baba S, Adachi T, Sakata T, Sakaguchi EI. 1995. Calcium and
magnesium absorption from the colon and rectum are increased in rats fed
fructooligosaccharides. J Nutr 125:2417-24.
Perrin S, Fougnies C. Grill JP, Jacobs H, Schneider F. 2002. Fermentation of chicory
fructo-oligosaccharides in mixtures of different degrees of polymerization by three strains
of bifidobacteria. Can J Microbiol 48:759–763
Rao S, Srinivasjois R, Patole S. 2009. Prebiotic supplementation in full-term neonates: A
systematic review of randomized controlled trials. Arch Ped Adol Med 163:755-64.
Rasick JL, Caballero B, Trugo L, Finflas P. 2003. Microflora of the instestine probiotics
Roberfroid MB, Van Loo Jae, Gibson GR. 1998. The bifidogenic nature of chicory inulin
and its hydrolysis products. J Nutr 128:11-9.
Rastall R. 2006. A matter of support. Prepared Foods July;65-69.
Rastall RA, Gibson GR, Gill HS, Garner F, Klaenhamer TR, Pot B, Reid G, Rowland IR,
Sanders ME. 2005. Modulation of the microbial ecology of the human colon by
probiotics, prebiotics and synbiotics to enhance human health: An overview of enabling
science and potential applications. FEMS Microbiol Ecol 52:145-52.
Remesy, C., Levrat, M.A., Gamet. L., Demigne, C., 1993. Cecal fermentations in rats fed
oligosaccharides (inulin) are modulated by dietary calcium level. Gastrointest. Liver
Physiol. 27, G855-G862.
Roberfroid MB, Van Loo J, Gibson GR. 1998. The bifidogenic nature of chicory inulin
and its hydrolysis products. J Nutr 128: 127-30.
Roberfroid M. 2000. Prebiotics and probiotics: Are they functional foods? Am J Clin
Nutr 71(supp):1682S-7S.
Roberfroid MB. 2001. Prebiotics: Preferential substrates for specific germs? Am J Clin
Nutr 73:S406-9.
Roberfroid MB. 2002. Functional foods: Concepts and application to inulin and
oligofructose. Br J Nutr 87: S139-S143.
72
Rossi M, Corradini C, Amaretti A, Nicolini M, Pompei A, Zanoni S, Matteuzzi D. 2005.
Fermentation of fructooligosaccharides and inulin by bifidobacteria: A comparative study
of pure and fecal cultures. Appl Environ Microbiol 71:6150–8.
Rotimi VO, Duerden BI. 1981. The development of thebacterial flora in normal neonates.
J Med Microbiol 14:51–62.
Sanders, ME. 2006. Summary of probiotic activities of Bifidobacterium lactis HN019. J.
Clin Gastroenterol. 40:776-83.
Sanders ME. 2007. Probiotics, strains matter. Functional foods & nutraceuticals
magazine. June:36-41.
Sangeetha PT, Ramesh MN, Prapulla SG. 2005a. Process Biochem. 40:1085-88.
Sangeetha PT, Ramesh MN, Prapulla SG. 2005b. J Food Process Eng 68:57-
64.
Schaller-Povolny LA, Smith DE. 2001. Viscosity and freezing point of a reduced fat ice
cream mix as related to inulin content. Milchwissenschaft 56:25-9.
Schiffrin EJ, Brassart JR, Servin AL, Rochat F, Donnet-Hughes A.1997. Immune
modulation of blood leukocytes in humans by lactic acid bacteria: Criteria for strain
selection. Am J Clin Nutr 66:515S-520S.
Schmidt K, Lundy A, Reynolds J, Yee LN. 1993. Carbohydrateor protein based fat
mimicker effects on ice milk properties. J. Food Sci. 58:761–763, 779.
Scholz-Ahrens KE, Schaafsma G, Van den Heuval EG, Schrezenmeir J. 2001. Effects of
prebiotics on mineral metabolism. Am J Clin Nutr 73(2 Suppl):S459-64.
Schrezenmeir J, de Vrese M. 2001. Probiotics, prebiotics, and symbiotics: Approaching a
definition. Am J Clin Nutr. 7:S361-4.
Senok AC, Ismaeel AY, Botta GA. 2005 Probiotics: Facts and myths. Clin Micr Inf
12:958-66.
Saxelin M, Tynkkynen S, Mattila-Sandholm T, de Voss WM. 2005. Probiotic and other
functional microbes: From markets to mechanisms. Curr Opin Biotechnol 16:204-11.
Shah N, Lankaputhra W, Britz M, Kyle W. 1995. Survival of Lactobacillus acidophilus
and Bifidobacterium bifidum in commercial yoghurt during refrigerated storage. Int Dairy
J 5:515-21.
73
Shah, NP. 2000. Probiotic bacteria: Selective enumeration and survival in dairy foods.
Journal of Dairy Science, 83:894-907.
Tahri K, Grill JP, Schneider F. 1996. Bifidobacteria strain behavior toward cholesterol:
Coprecipitation with bile salts and assimilation. Curr Microbiol 33:187–193.
Talwalkar A, Kailasapathy K. 2004. The role of oxygen in the viability of probiotic
bacteria with reference to L. acidophilus and Bifidobacterium spp. Curr Issues Intest
Microbiol. 5:1-8.
Tomamatsu H. 1994. Health effects of oligosaccharides. Food Tech 48:61-65.
Topping DL, Clifton PM. 2001. Short-chain fatty acids and human colonic function:
Roles of resistant starch and nonstarch polysaccharides. Physiol Rev 81:1031–64
Trinidad TP, Wolever TM, Thompson LY. 1993. Interactive effects of calcium and short
chain fatty acids on absorption in the distal colon of man. Nutr Res 13:417-25.
Trinidad, TP, Wolever TMS, Thompson LU. 1997. Effect of short-chain
fatty acids on calcium absorption in humans. Adv Exp Med Biol 427:183–9.
Trowell HC. 1974. Definition of dietary fiber. Lancet 1(7856)503.
Truswell AS. 2002. Cereal grains and coronary heart disease. A review. Eur J Clin Nutr
56:1–6.
Van den Heuval E, Schaafsma G, Muys T, van Dokkum W. 1998. Nondigestible
oligosaccharides do not interfere with calcium and nonheme-iron absorption in young
healthy men. Am J Clin Nutr 67:445-51.
Van den Heuval E, Muys T, van Dokkum W, Schaafsma G. 1999. Oligofructose
stimulates calcium absorption in adolescents. Am J Clin Nutr 69:544-8.
Van Loo J. 2004. The specificity of the interaction with intestinal fermentation by
prebiotics determines their physiological efficacy. Nutr Res Rev 17:89-98.
Vanhoof K, De Schrijver R. 1995. Effect of unprocessed and baked inulin on lipid
metabolism in normo and hypercholesterolemic rats. Nutr. Res. 15:1637–1646.
Vinderola C, Reinheimer J. 2000. Enumberation of Lactobaillus casei in the presence of
L Acidophilus, bifidobacteria and lactic starter bacteria in fermented dairy products. Int
Dairy J 10(4):271-5.
74
Walker, WA. 2000. Role of nutrients and bacterial colonization in the development of
intestinal host defense. J Pediatr Gastroenterol Nutr 30: S2–7.
Wang X, Gibson GR. 1993. Effects of the in vitro fermentation of oligofructose and
inulin by bacteria growing in the human large intestine. J Ap Bacteriol 75:375-80.
Ziemer C, Gibson G. 1998. An overview of probiotics, prebiotics and synbiotics in the
functional food concept: Perspectives and future strategies. Int Dairy J 8:473-9.
Yoshioka H, Fujita K, Sakata H, Murono K, Iseki K. 1991. Development of the normal
intestinal flora and its clinical significance in infants and children. Bifidobacteria and
Microflora 10(1): 11-17.
Zimeri JE and Kokini JL. 2003. Rheological properties of inulin-waxy maize starch
systems. Carbohydrate Polymers 52:67–85.

75
Appendix A - IRB Approval Letter

76
77
Appendix B – Recruitment Flier
Attention Students and Faculty!
You are invited to participate in a Research
Study on the Addition of Fructooligosaccharides
in Ice Cream
When? Spring Semester 2008 (exact date yet to
be decided)
Where? Sensory Analysis Laboratories in the
Departments of Nutrition and Health Sciences
and Food Science and Technology
Details: You must be at least 19 years of age to
participate. You will be tasting vanilla flavored
ice cream samples and asked to fill out a sensory
analysis questionnaire.
What you will get for participating: a gift
certificate for the UNL Dairy Store or a candy
bar

78
Appendix C – Recruitment Email sent to students, staff and faculty
Dear Students, Staff and Faculty,
You are invited to participate in a study on the Investigation of Fructooligosaccharides in
Ice Cream.
During this study you will be asked to taste several samples of vanilla flavored ice cream
that have various amounts of two types of Fructooligosaccharides added. As
compensation for participating, you will receive a gift certificate for the UNL Dairy
Store.
The study is being held in the sensory analysis laboratory in the Department of Nutrition
and Health Sciences on (date) and in the Department of Food Science and Technology on
(date).

79
Appendix D - Informed Consent Form
80
____________________________________________________ College of Education and Human Sciences Department of Nutrition and Health Sciences
Informed Consent Form
Title of Project: The Investigation of Fructooligosaccharides in Ice Cream Production
Purpose of the Research: Fructooligosaccharides (FOS) are non-digestible carbohydrates
that selectively feed the beneficial bacterial in your gut. It is also found in commonly
consumed foods such as bananas, onions, garlic, wheat, asparagus, barley, wheat, and
tomatoes. FOS is derived from chicory root for commercial use and is used in place of part
of the sugar in the ice cream samples in this study. The optimal daily intake of FOS to
stimulate growth of beneficial bacteria in the colon as well as enhance the absorption of
bone enhancing minerals is 8 to 10 grams per day. Average daily consumption for
Americans is currently 1 to 4 grams per day. to increase the daily consumption of FOS, we
are investigating the possibility of adding FOS to ice cream, as ice cream is a commonly
consumed food. We are investigating adding two types of FOS with varying degrees of
polymerization (carbohydrate chain length) at various levels in place of sugar. Our goal is to
determine how much FOS can be added to the ice cream and still maintaining acceptable
sensory qualities. FOS and inulin are currently added to some commercial yogurt products.
Procedures: To participate in this study, you will first be asked to read and sign this
informed consent form. Then you will be given several samples of vanilla flavored ice
cream and asked to fill out sensory analysis forms identifying qualities such as sweetness,
smoothness, flavor, and overall acceptability. You will also be given the opportunity to add
any additional comments about ice cream.
Risks: The known risks associated with the consumption of FOS are increased flatulence
and the urgency to defecate due to increased fecal bulk similar to consuming high fiber
foods.
Benefits: The benefit of participating in this study is that you have helped the University of
Nebraska-Lincoln further scientific research that benefits the health of the consumers.
Confidentiality: Information collected in this study will be kept strictly confidential. No
contact information will be collected. The results of the study will be published in a
graduate thesis and submitted for publication in scientific journals and presented at
conferences were appropriate. Personal information will not be collected and individual Initals ____
81
data will not be identifiable. Information collected will be stored in a locked cabinet in
104 RLH in the Department of Nutrition and Health Sciences for up to two years.
Compensation: When you complete this study, you will receive a gift certificate for the
UNL Dairy store.
Opportunity to ask questions: You may ask any questions about this study and have those
questions answered before agreeing to participate in the study or at any time during the
study.
Initial Consent: You are free to decide not to participate in this study or to withdraw at any
time without negatively affecting your relationship with the University of Nebraska. Your
decision will not result in any loss of benefits to which you are otherwise entitled. you are
free to call the investigators at any time if you have any questions about your rights as a
research participant that have not been answered by the investigator or to report any
concerns about the study. You may contact the University of Nebraska – Lincoln,
Institutional Review Board whose telephone number is 402-472-6965. By signing this form,
you indicate that you have read and understand the information presented and all questions
have been answered. You will be given a copy of this consent for you to keep.
Signature of Participant__________________________________________________
Names and Phone Numbers of the Researchers:
Julie A. Albrecht, Ph.D
University of Nebraska-Lincoln
Office: (402) 472-8884
Jennifer M. Wood, RD, LD
University of Nebraska-Lincoln
(507) 875-2705
110 Ruth Leverton Hall / P.O. Box 830806 / Lincoln, NE 68583-0806 / (402) 472-3716 / Fax (402) 472-1587

82
Appendix E – Sensory Scale Used for Research
Directions
1. Discard any food, gum, or tobacco from your mouth and rinse your mouth out with
water.
2. Taste each product in the order listed. Taste the first product and place an X on the
line to indicate its level of sweetness, smoothness, flavor, and overall acceptability.
Example:
not sweet very sweet
3. You may swallow the sample or spit the sample out in the cups provided. Rinse your
mouth out with water before tasting the next sample.
4. After tasting a product, wait one minute (by setting the timer) to sample the next
product.
5. Repeat steps #2 and #3 until all the products are sampled and all the scales are filled
out.

83
Appendix E
Sensory Scale
Sweetness
not sweet
very sweet
Smoothness
not smooth
very smooth
Flavor
not vanilla
very vanilla
Overall Acceptability
not acceptable
very acceptable

84
Additional
Comments:______________________________________________________________
________________________________________________________________________
________________________________________________________________________
_____________________________________________________