sensor classification intensity modulation sensors phase modulation sensors frequency modulation...
TRANSCRIPT
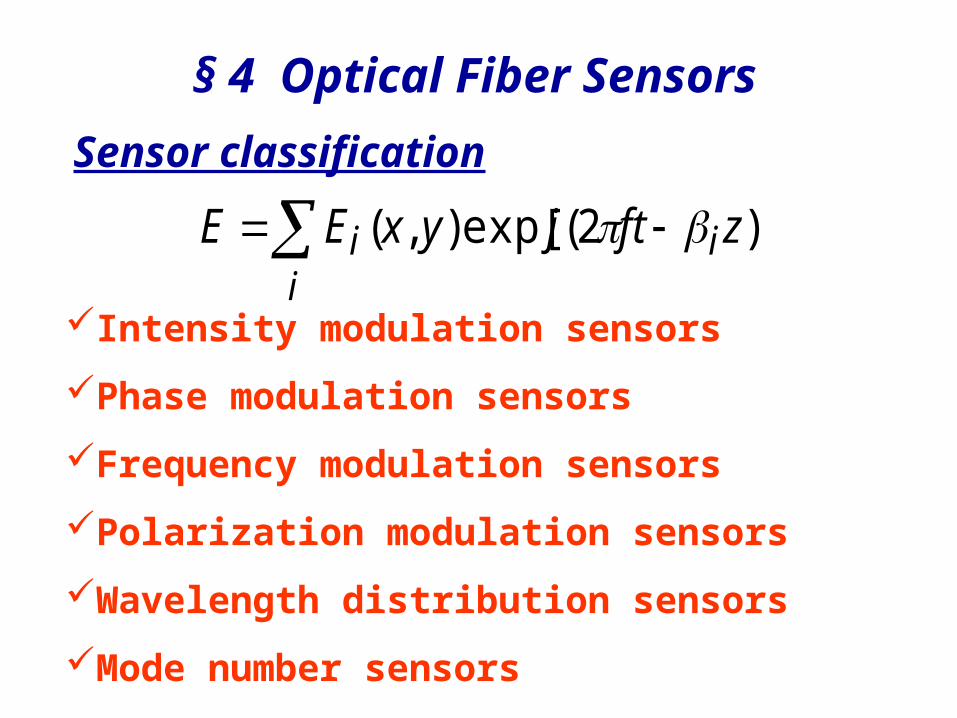
Sensor classification
i
ii zftjyxEE )]2(exp[),(
Intensity modulation sensors
Phase modulation sensors
Frequency modulation sensors
Polarization modulation sensors
Wavelength distribution sensors
Mode number sensors
§ 4 Optical Fiber Sensors
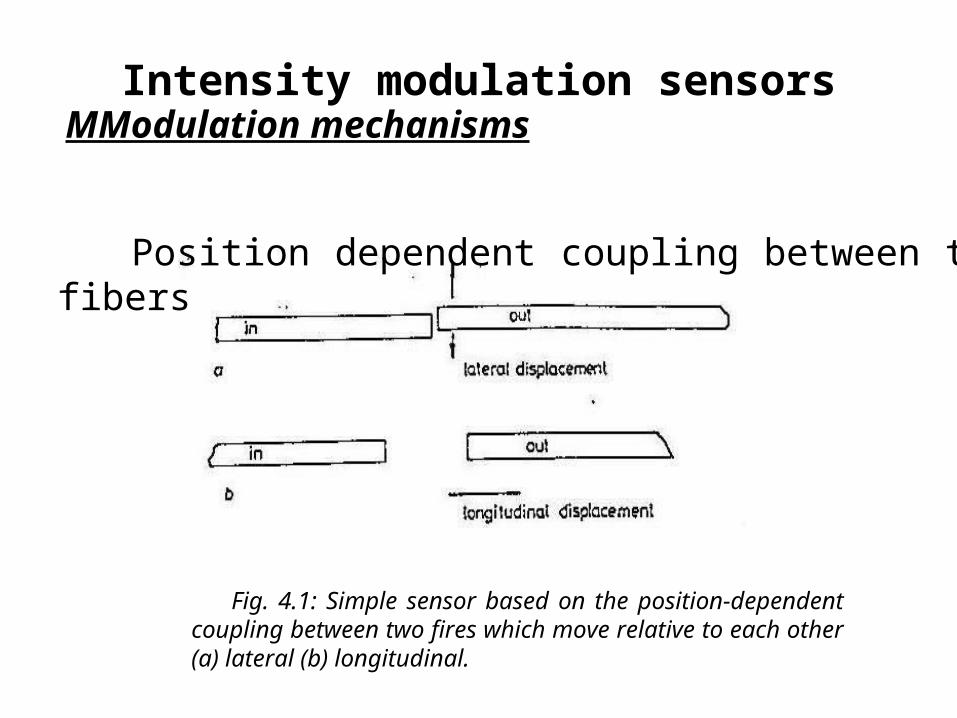
Intensity modulation sensorsMModulation mechanisms
Fig. 4.1: Simple sensor based on the position-dependent coupling between two fires which move relative to each other (a) lateral (b) longitudinal.
Position dependent coupling between two fibers
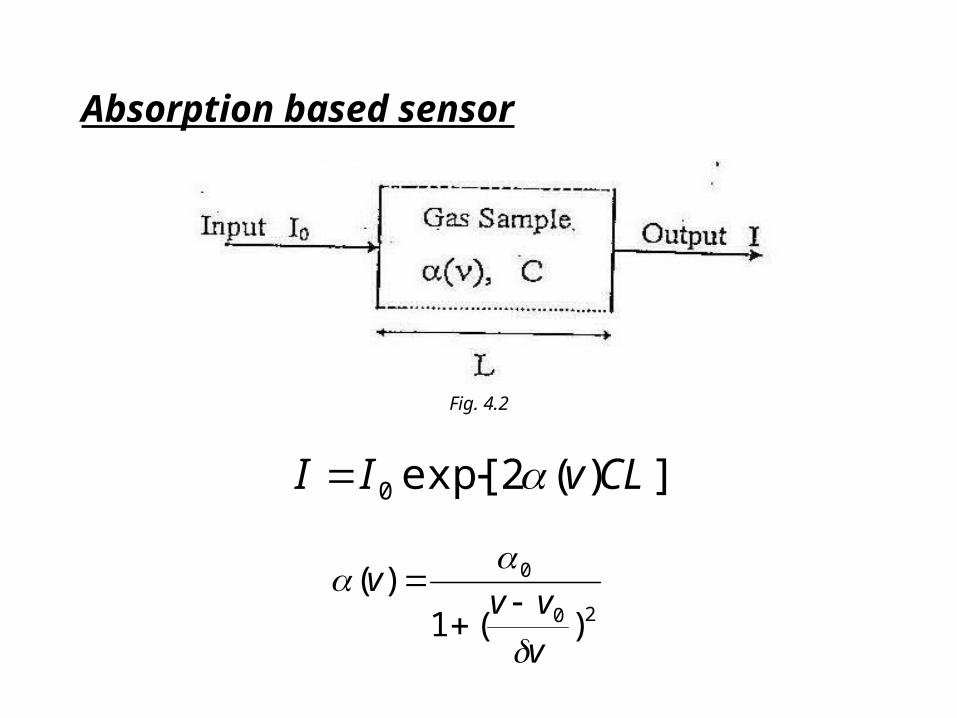
Absorption based sensor
Fig. 4.2
])(2exp[0 CLvII
20
0
)(1)(
v
vvv
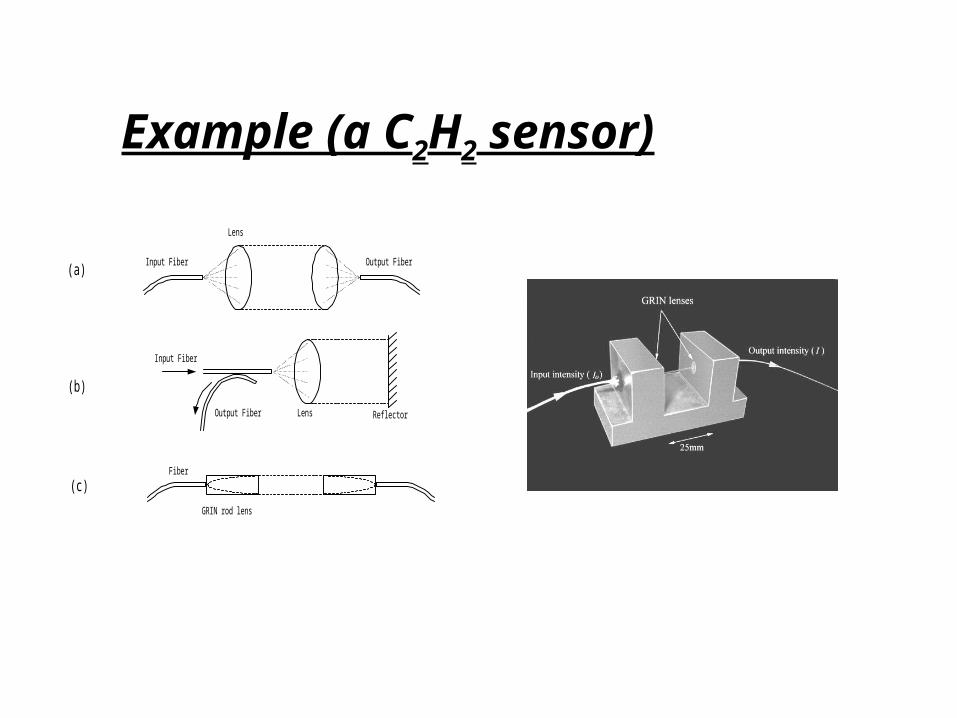
Output FiberInput Fiber
Lens
Input Fiber
LensOutput Fiber Reflector
GRIN rod lens
Fiber
(a)
(b)
(c)
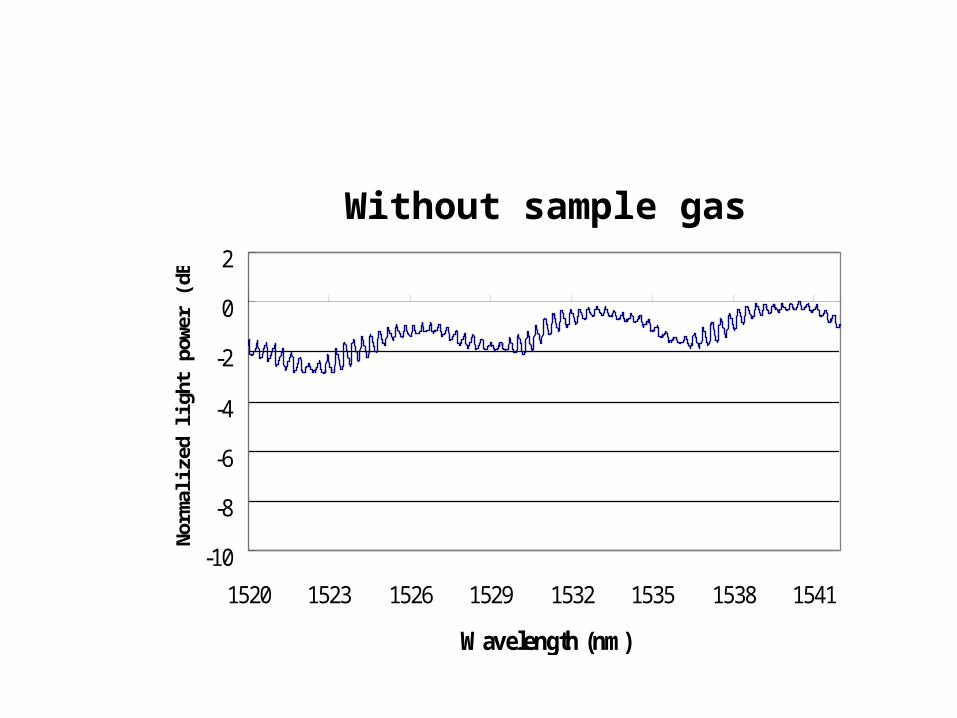
Example (a C2H2 sensor)
-10
-8
-6
-4
-2
0
2
1520 1523 1526 1529 1532 1535 1538 1541
Wavelength (nm)
No
rmali
zed
lig
ht
po
wer
(dB
)
Without sample gas
-10
-8
-6
-4
-2
0
2
1520 1523 1526 1529 1532 1535 1538 1541
Wavelength (nm)
No
rmali
ze
d l
igh
t p
ow
er
(dB
)
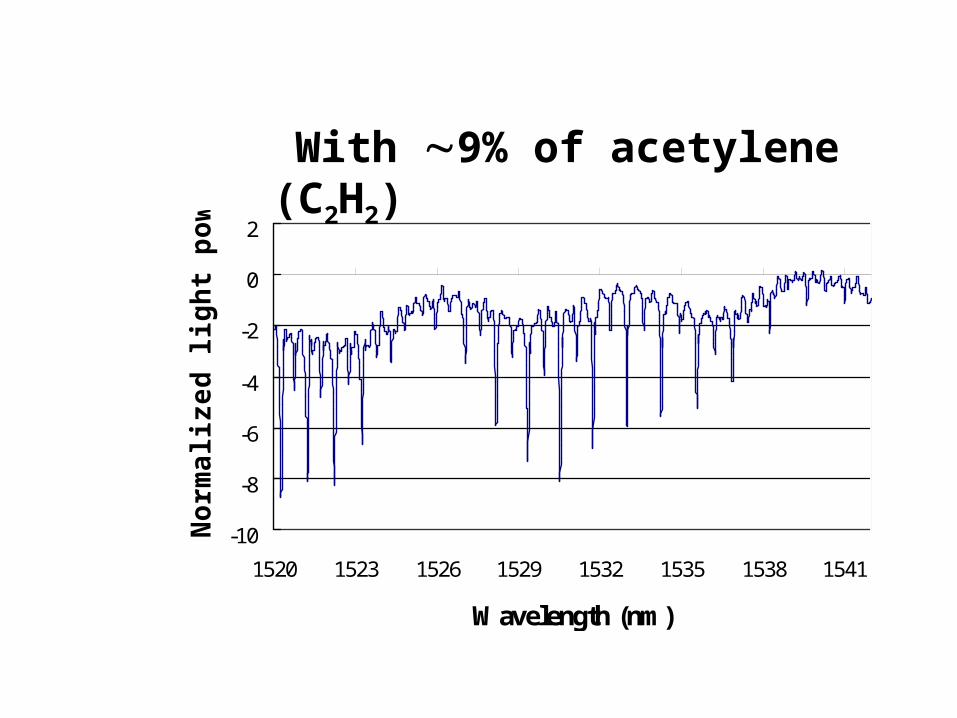
With 9% of acetylene (C2H2)
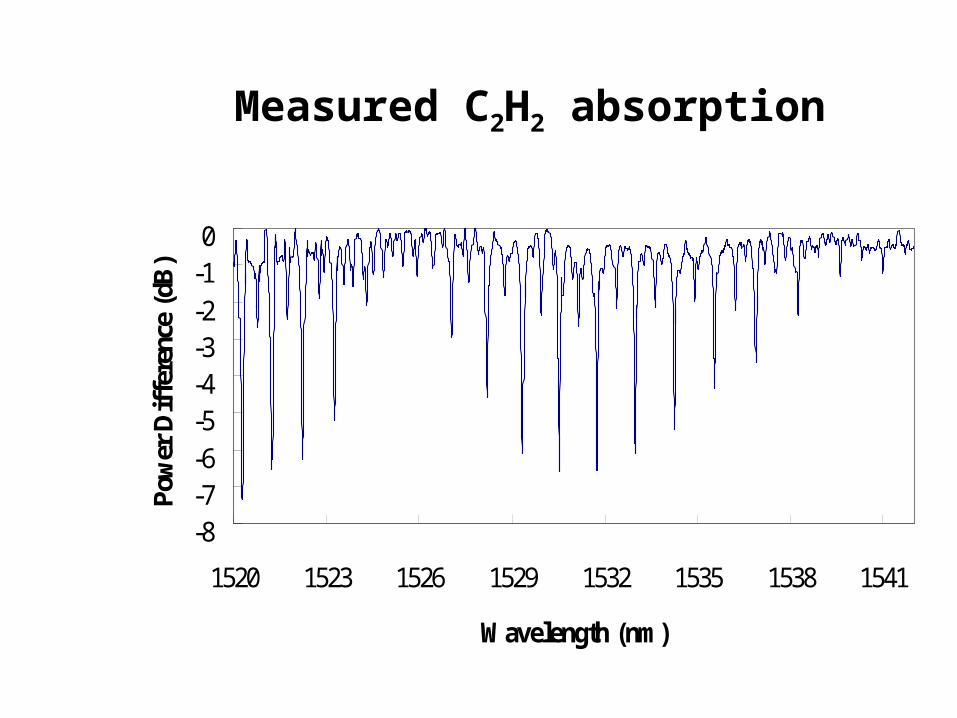
Measured C2H2 absorption
-8-7-6-5-4-3-2-10
1520 1523 1526 1529 1532 1535 1538 1541
Wavelength (nm)
Pow
er D
iffer
ence
(dB
)
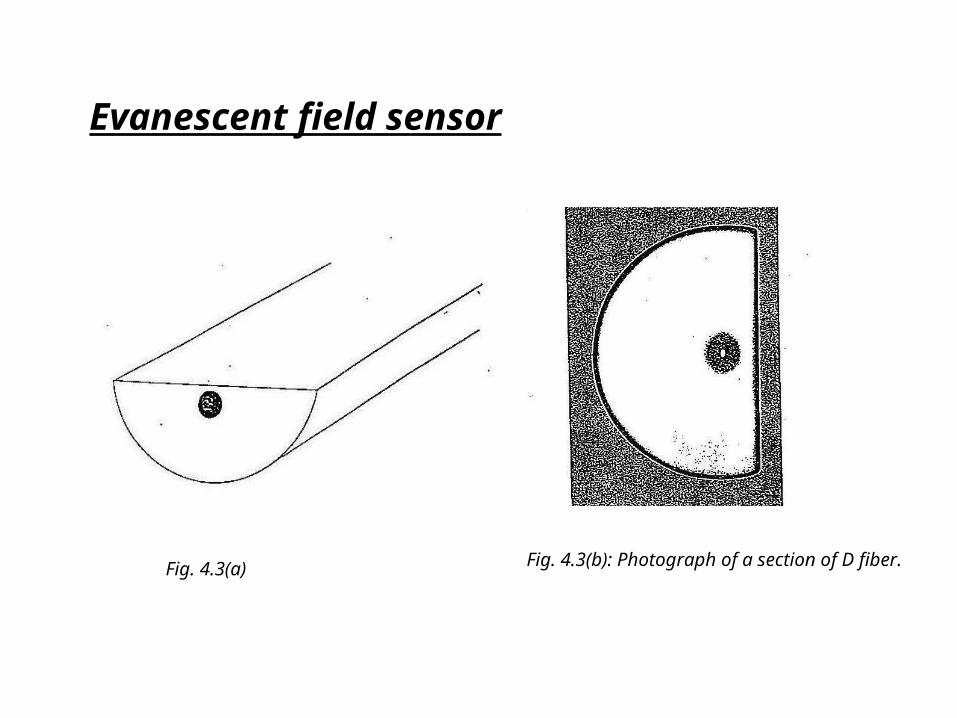
Evanescent field sensor
Fig. 4.3(a) Fig. 4.3(b): Photograph of a section of D fiber.
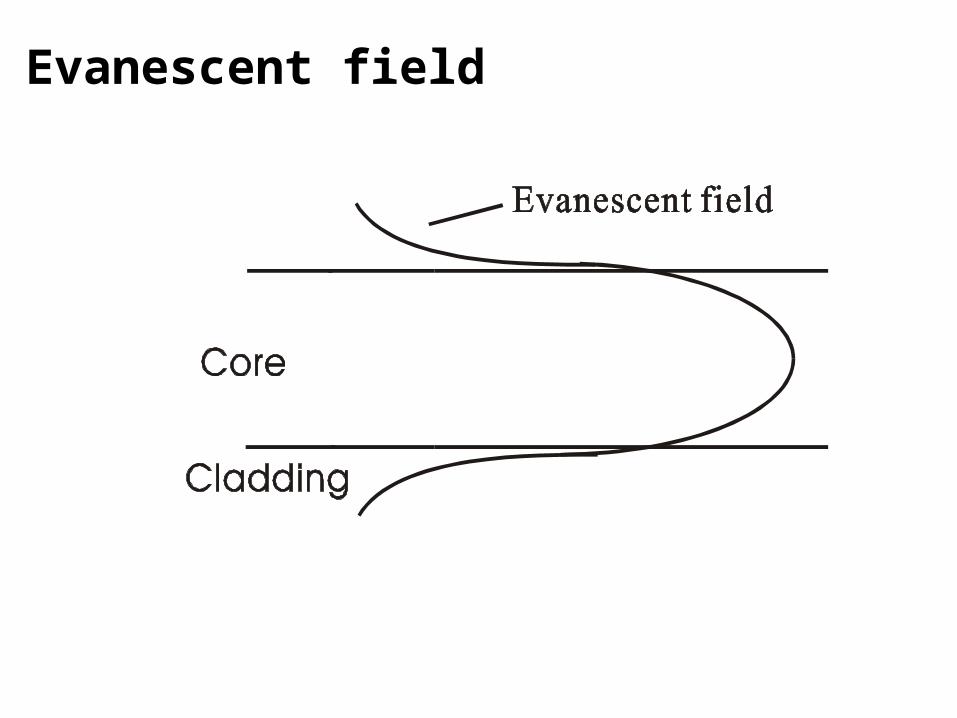
Evanescent field
Detection of intensity modulation:
The intensity variation can be converted into an electric signal (current or voltage) by a light detector (e.g., PIN photo-detector).
Phase modulation sensorsModulation mechanisms
The total phase ( = L = 2neff L /) of the light path along
an optical fiber depends on three properties of the fiber guide: Its total physical length L The refractive index and the index profile (affect neff) The geometrical transverse dimensions of the guide (affect neff)
The total physical length of an optical fiber may be modulated by:
Application of a longitudinal strain Thermal expansion Application of a hydrostatic pressure causing expansion via
Poisson’s ratio
The refractive index varies with:
Temperature Pressure and longitudinal strain via the photoelastic
effect
The guide dimensions varies with
Radial strain in a pressure field Longitudinal strain through Poisson’s ratio Thermal expansion
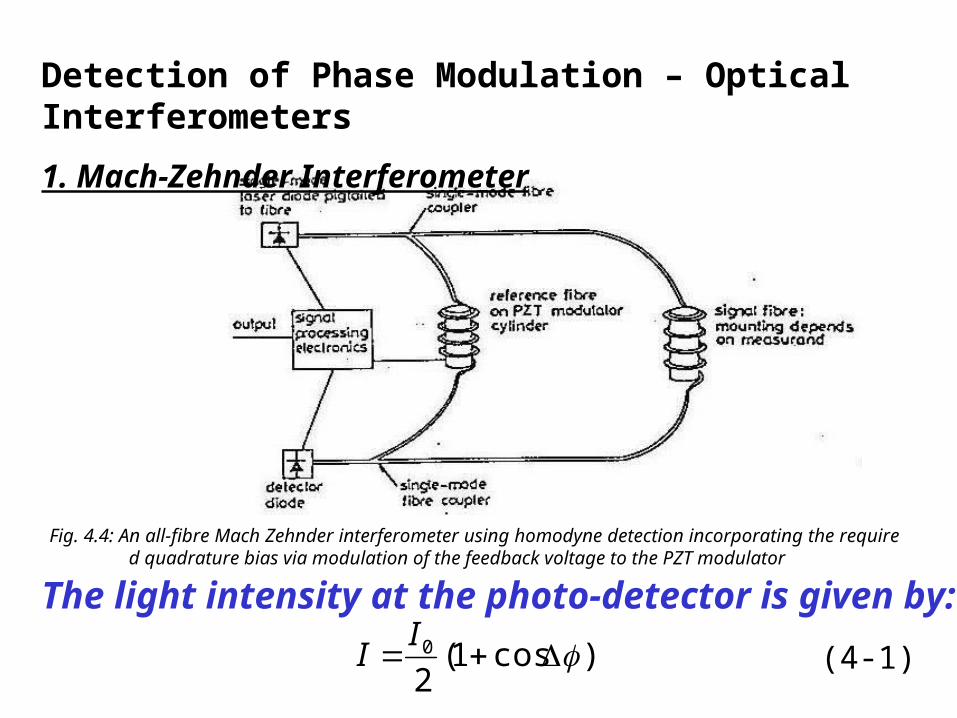
Fig. 4.4: An all-fibre Mach Zehnder interferometer using homodyne detection incorporating the required quadrature bias via modulation of the feedback voltage to the PZT modulator
The light intensity at the photo-detector is given by:
)cos1(20
II (4-1)
Detection of Phase Modulation – Optical Interferometers
1. Mach-Zehnder Interferometer
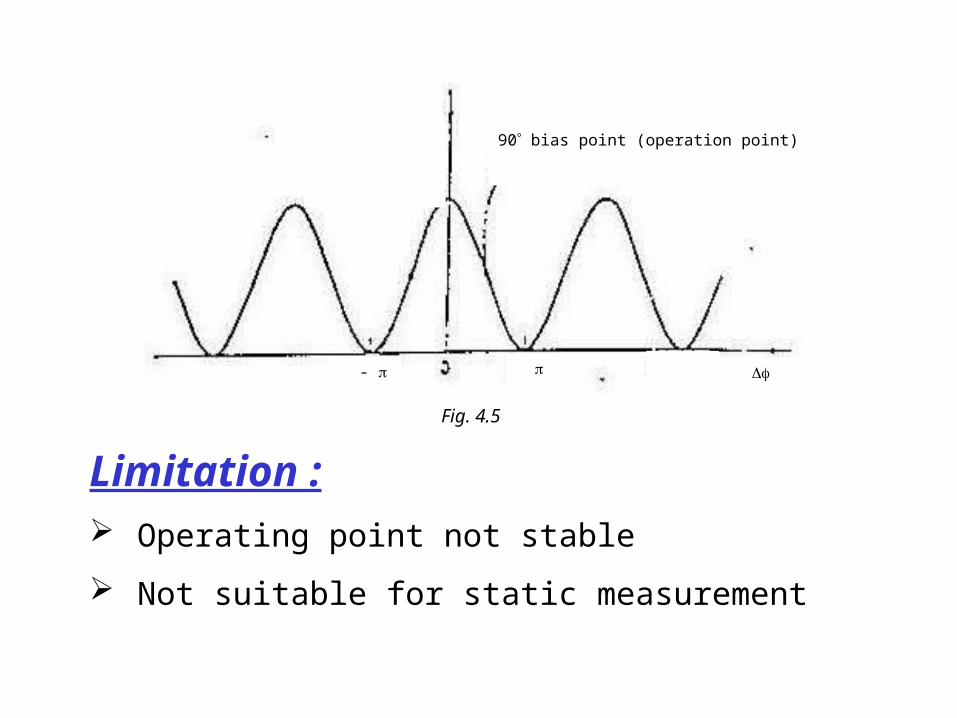
I
-
90 bias point (operation point)
Fig. 4.5
Limitation : Operating point not stable
Not suitable for static measurement
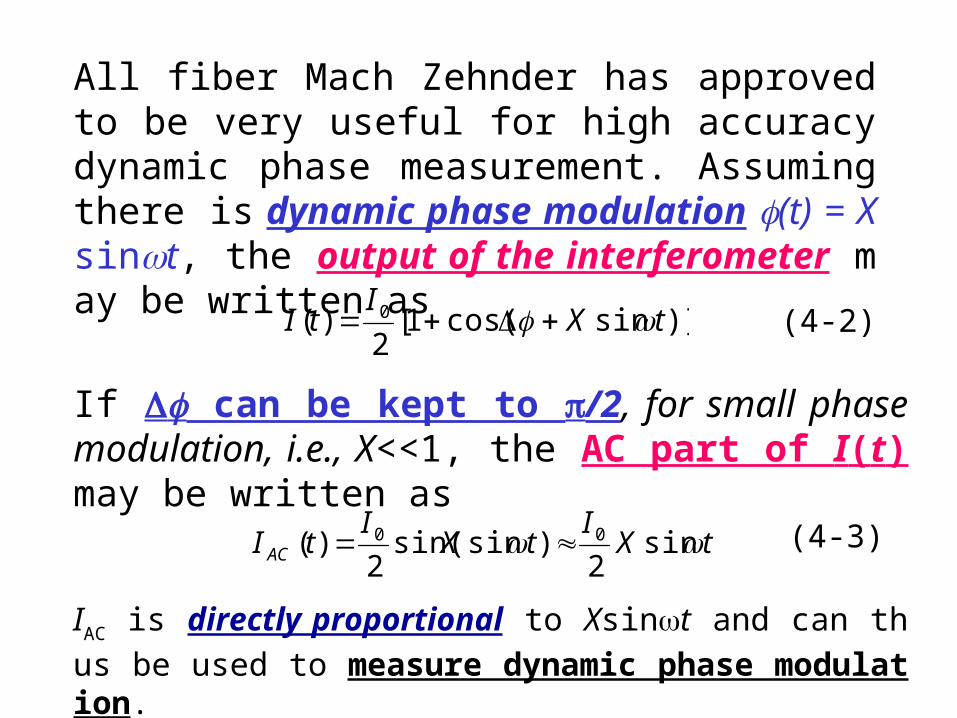
All fiber Mach Zehnder has approved to be very useful for high accuracy dynamic phase measurement. Assuming there is dynamic phase modulation (t) = Xsint, the output of the interferometer may be written as
)]sincos(1[2
)( 0 tXI
tI (4-2)
If can be kept to /2, for small phase modulation, i.e., X<<1, the AC part of I(t) may be written as
tXI
tXI
tI AC sin2
)sinsin(2
)( 00 (4-3)
IAC is directly proportional to Xsint and can thus be used to me
asure dynamic phase modulation.
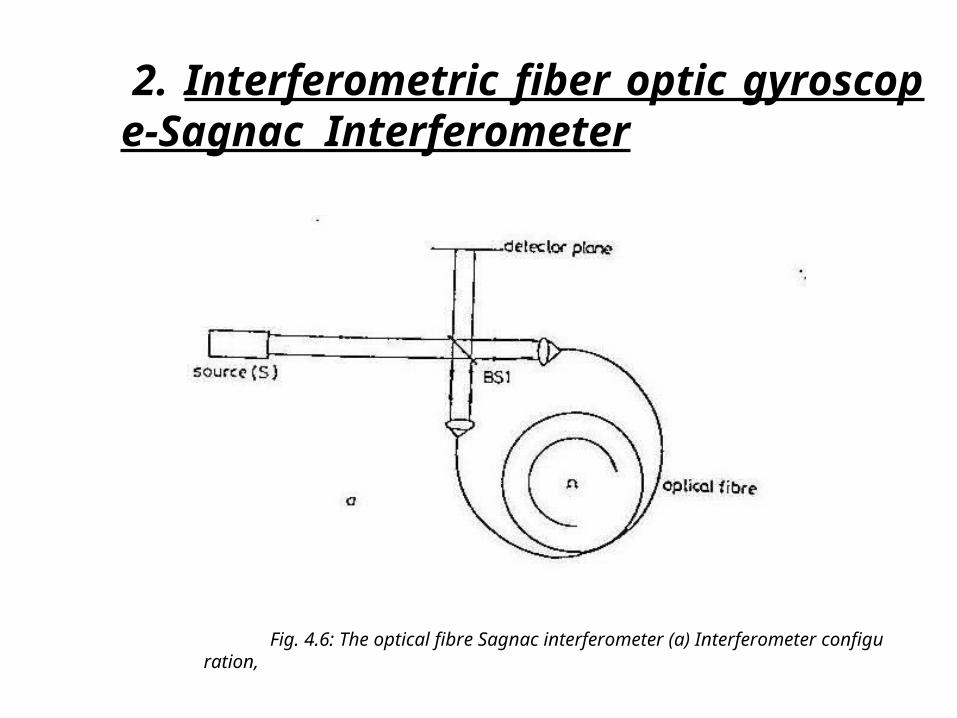
Fig. 4.6: The optical fibre Sagnac interferometer (a) Interferometer configuration,
2. Interferometric fiber optic gyroscope-Sagnac Interferometer
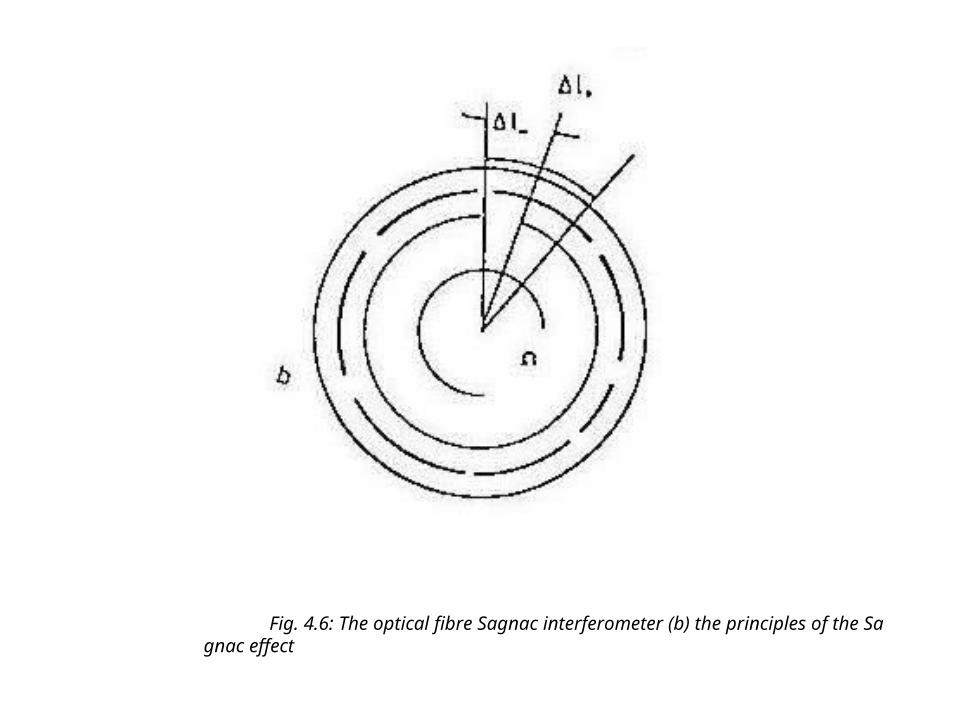
Fig. 4.6: The optical fibre Sagnac interferometer (b) the principles of the Sagnac effect
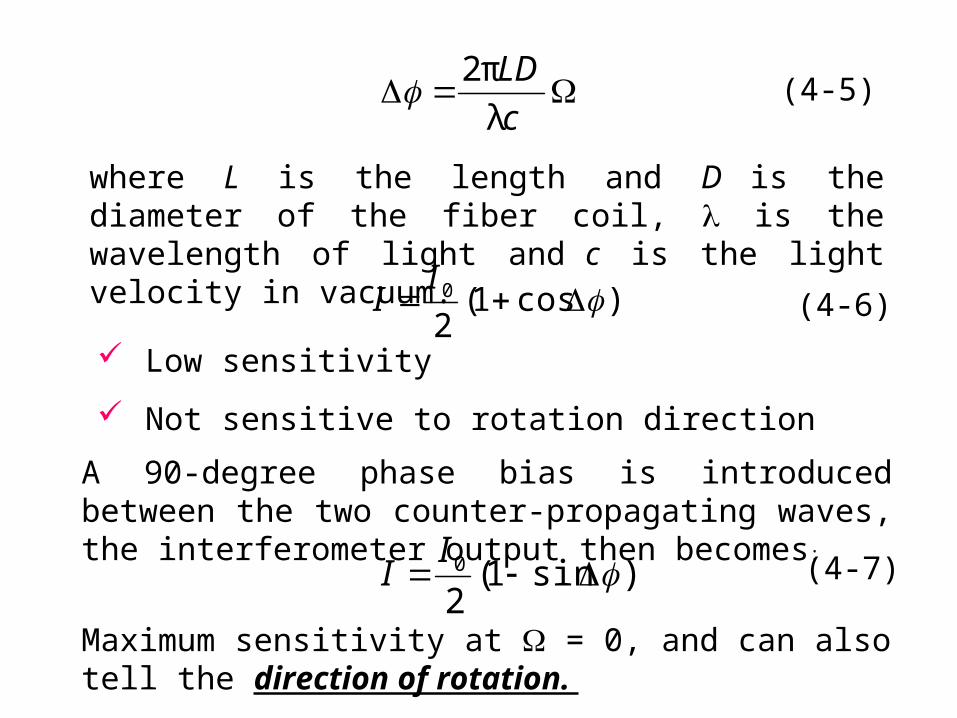
c
LD
λ
π2 (4-5)
where L is the length and D is the diameter of the fiber coil, is the wavelength of light and c is the light velocity in vacuum.
)cos1(20
II (4-6)
Low sensitivity
Not sensitive to rotation direction
A 90-degree phase bias is introduced between the two counter-propagating waves, the interferometer output then becomes:
)sin1(20
II (4-7)
Maximum sensitivity at = 0, and can also tell the direction of rotation.
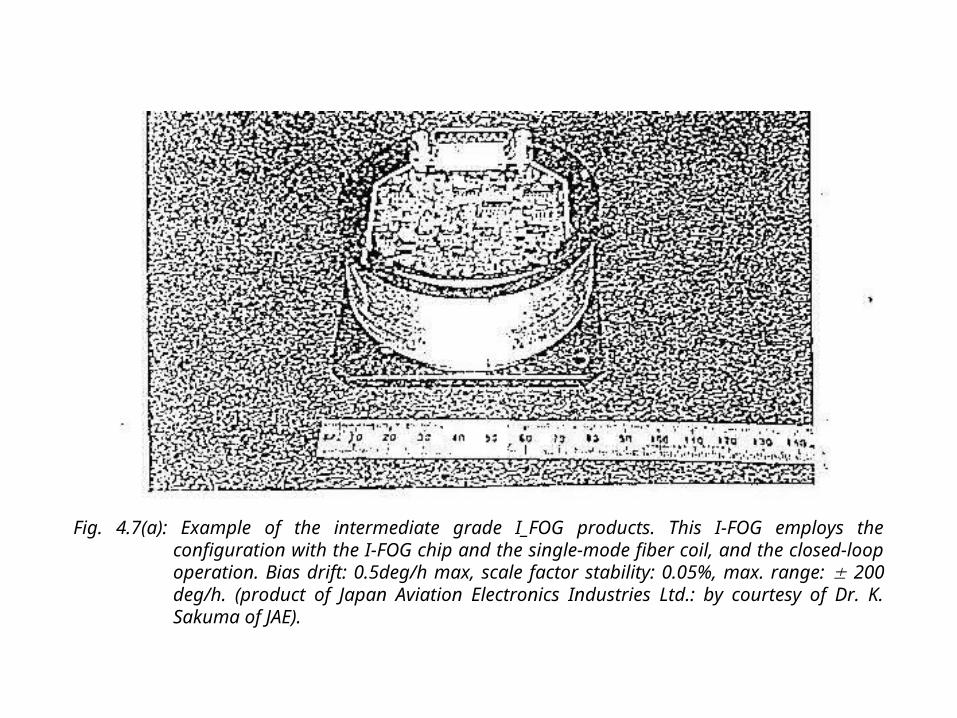
Fig. 4.7(a): Example of the intermediate grade I_FOG products. This I-FOG employs the configuration with the I-FOG chip and the single-mode fiber coil, and the closed-loop operation. Bias drift: 0.5deg/h max, scale factor stability: 0.05%, max. range: 200 deg/h. (product of Japan Aviation Electronics Industries Ltd.: by courtesy of Dr. K. Sakuma of JAE).
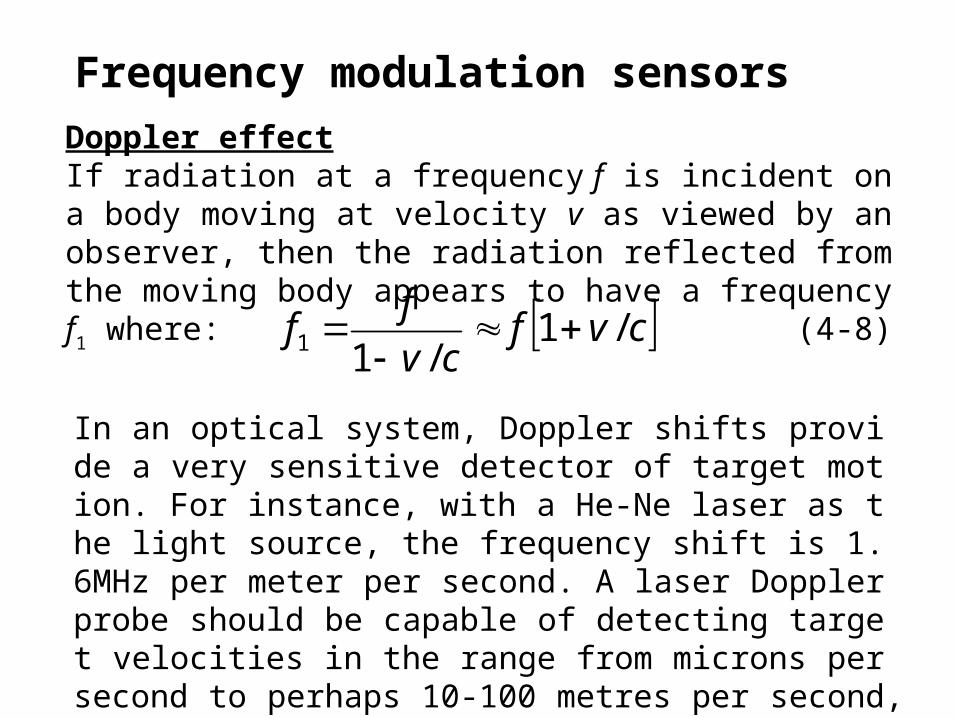
Frequency modulation sensors
Doppler effectIf radiation at a frequency f is incident on a body moving at velocity v as viewed by an observer, then the radiation reflected from the moving body appears to have a frequency f1 where:
cvfcv
ff /1
/11
(4-8)
In an optical system, Doppler shifts provide a very sensitive detector of target motion. For instance, with a He-Ne laser as the light source, the frequency shift is 1.6MHz per meter per second. A laser Doppler probe should be capable of detecting target velocities in the range from microns per second to perhaps 10-100 metres per second, depending on the choice of the detection electronics.
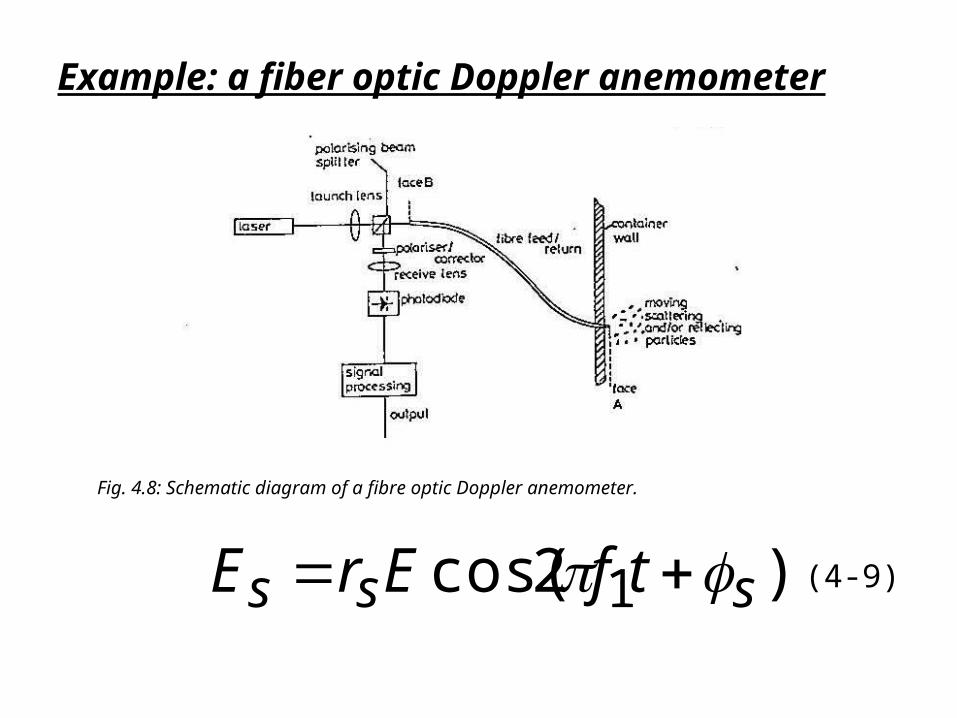
Fig. 4.8: Schematic diagram of a fibre optic Doppler anemometer.
Example: a fiber optic Doppler anemometer
)2cos( 1 sss tfErE (4-9)
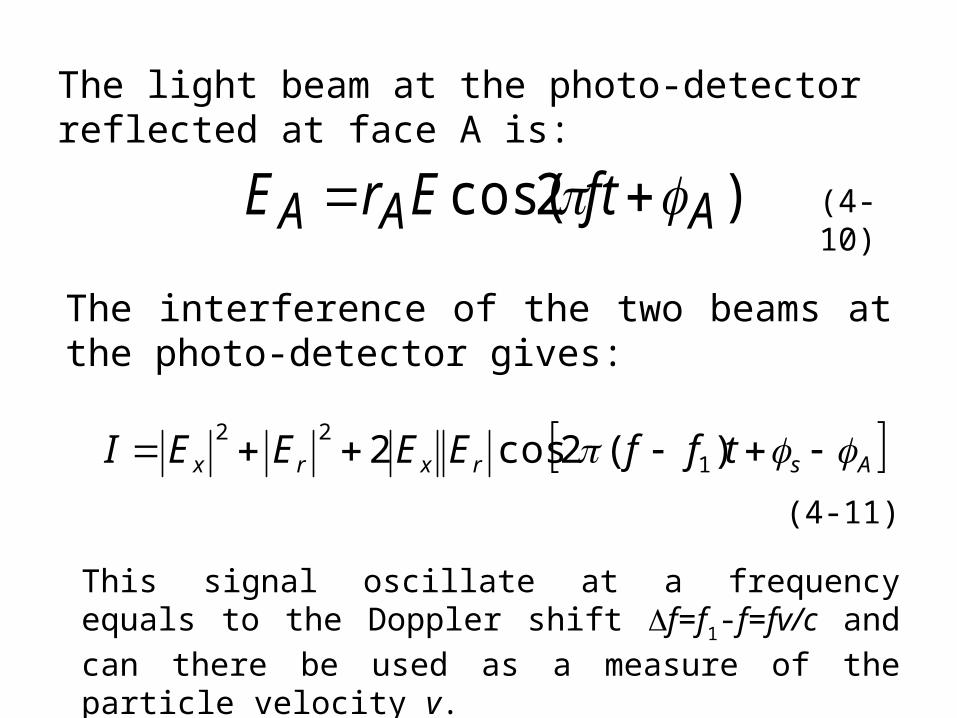
The light beam at the photo-detector reflected at face A is:
)2cos( AAA ftErE (4-10)
The interference of the two beams at the photo-detector gives:
Asrxrx tffEEEEI )(2cos2 1
22
(4-11)
This signal oscillate at a frequency equals to the Doppler shift f=f1-f=fv/c and can there be used as a measure of the particle
velocity v.
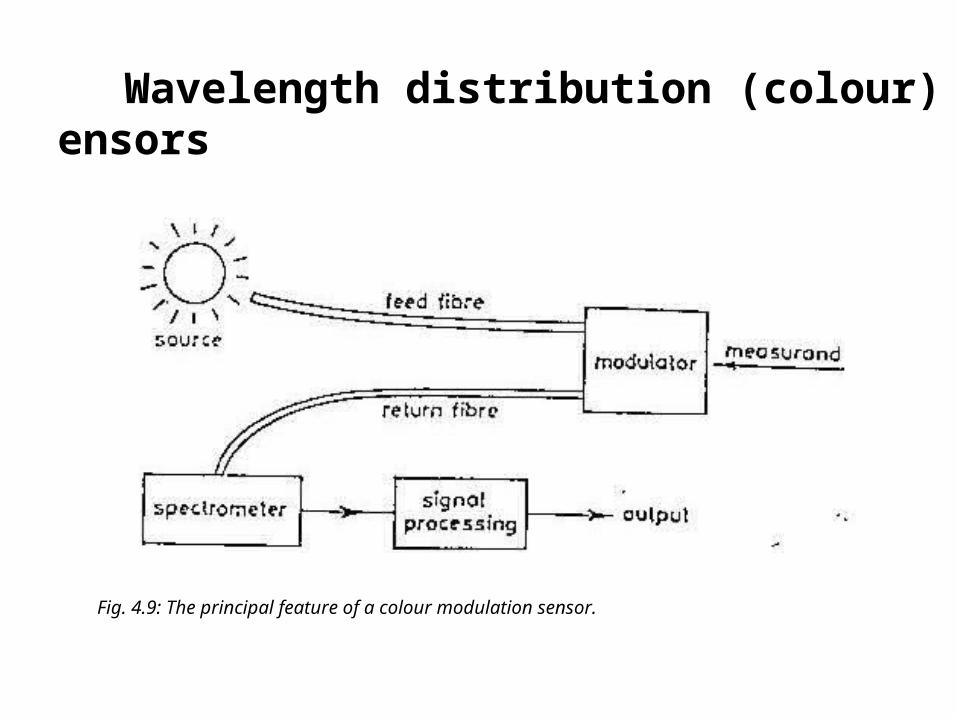
Fig. 4.9: The principal feature of a colour modulation sensor.
Wavelength distribution (colour) sensors
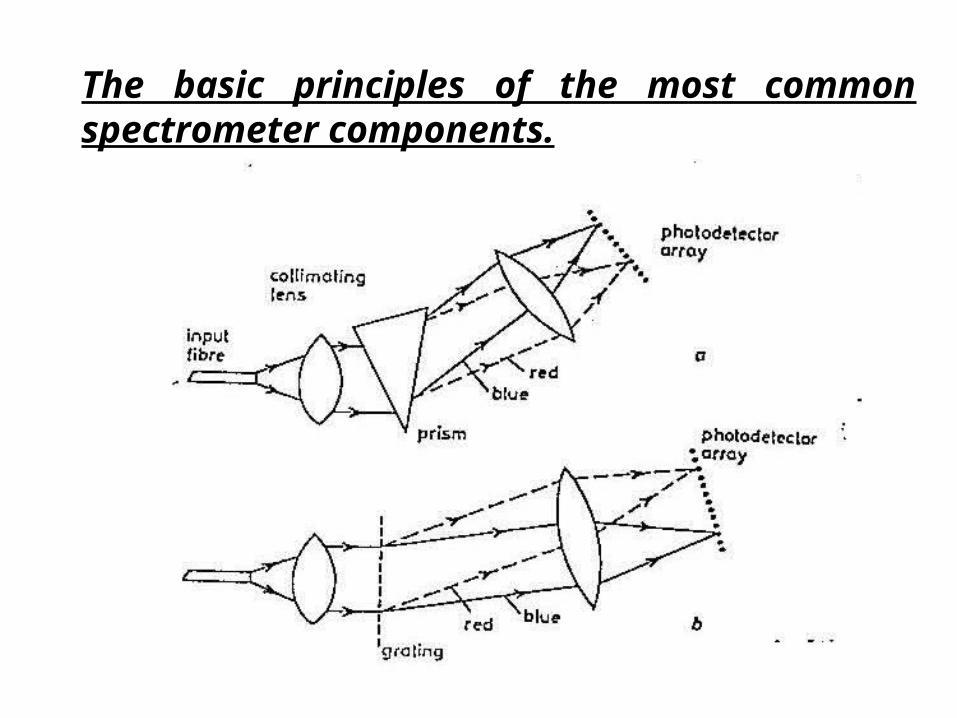
The basic principles of the most common spectrometer components.
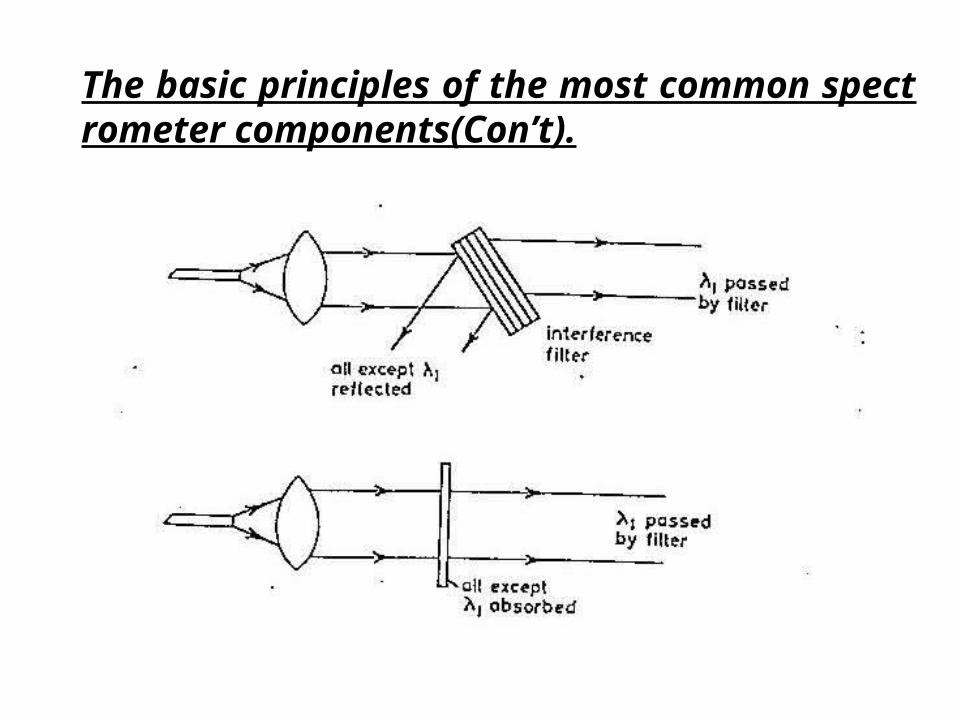
The basic principles of the most common spectrometer components(Con’t).
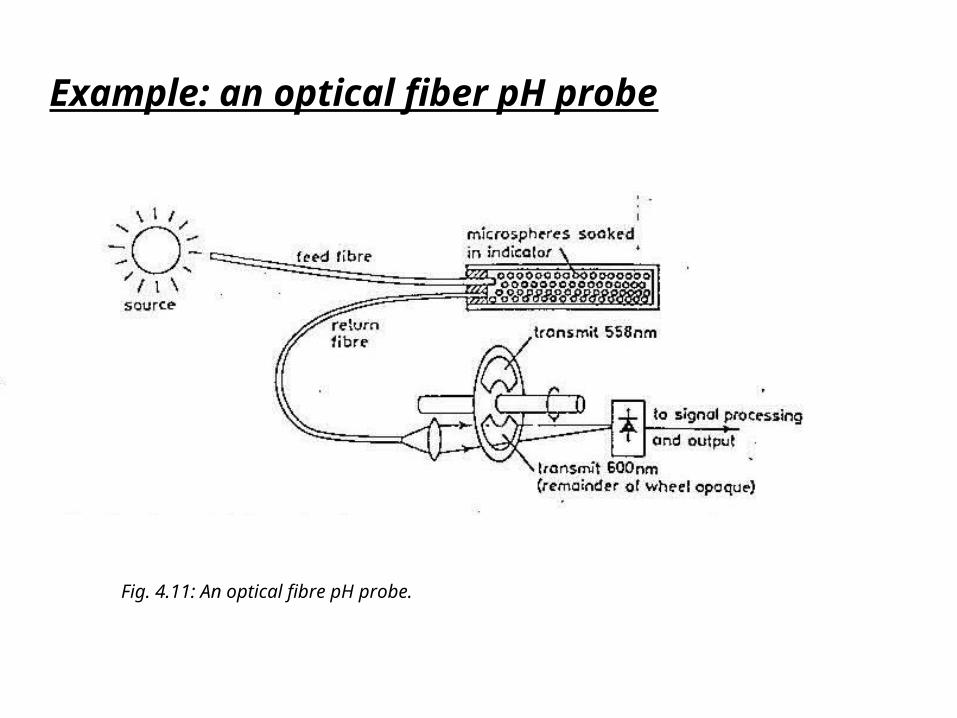
Fig. 4.11: An optical fibre pH probe.
Example: an optical fiber pH probe
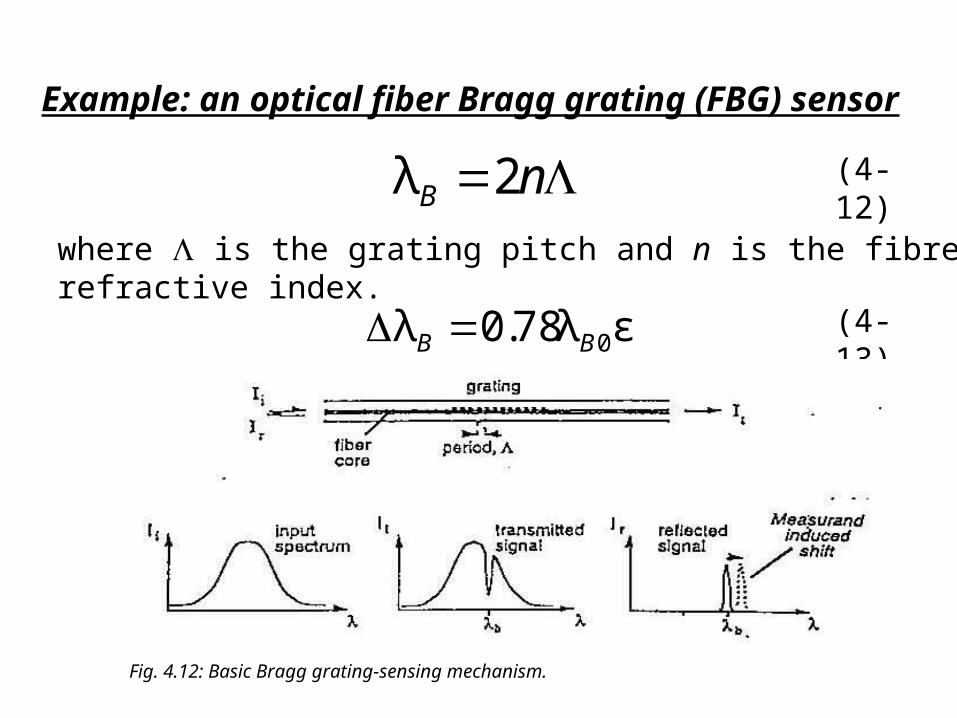
Example: an optical fiber Bragg grating (FBG) sensor
nB 2λ
(4-13)
where is the grating pitch and n is the fibre refractive index.
ελ78.0λ 0BB
(4-12)
Fig. 4.12: Basic Bragg grating-sensing mechanism.
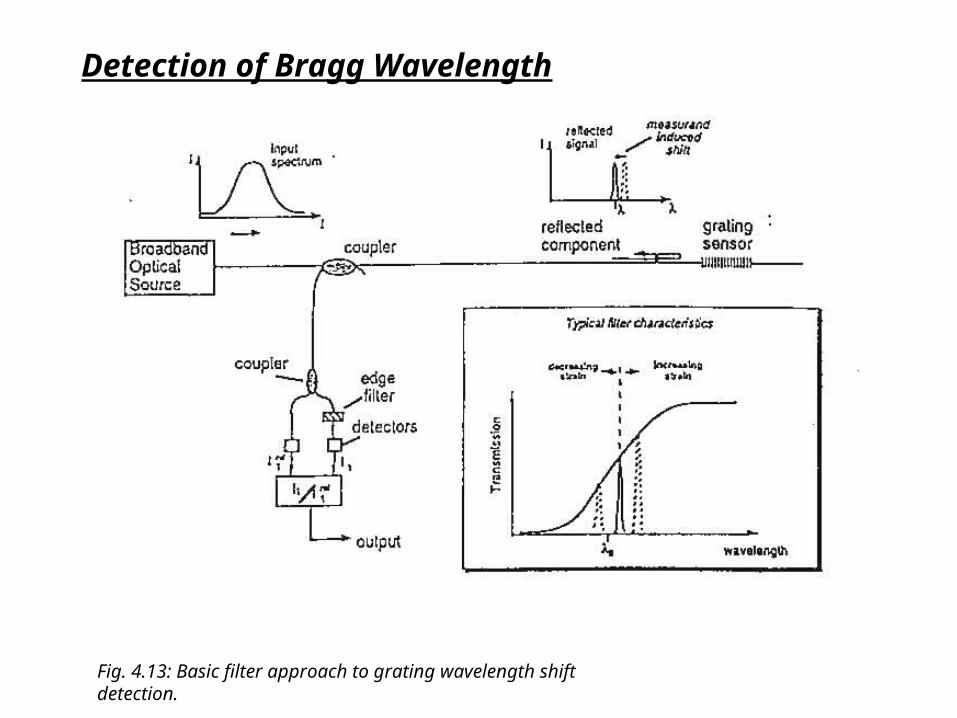
Detection of Bragg Wavelength
Fig. 4.13: Basic filter approach to grating wavelength shift detection.
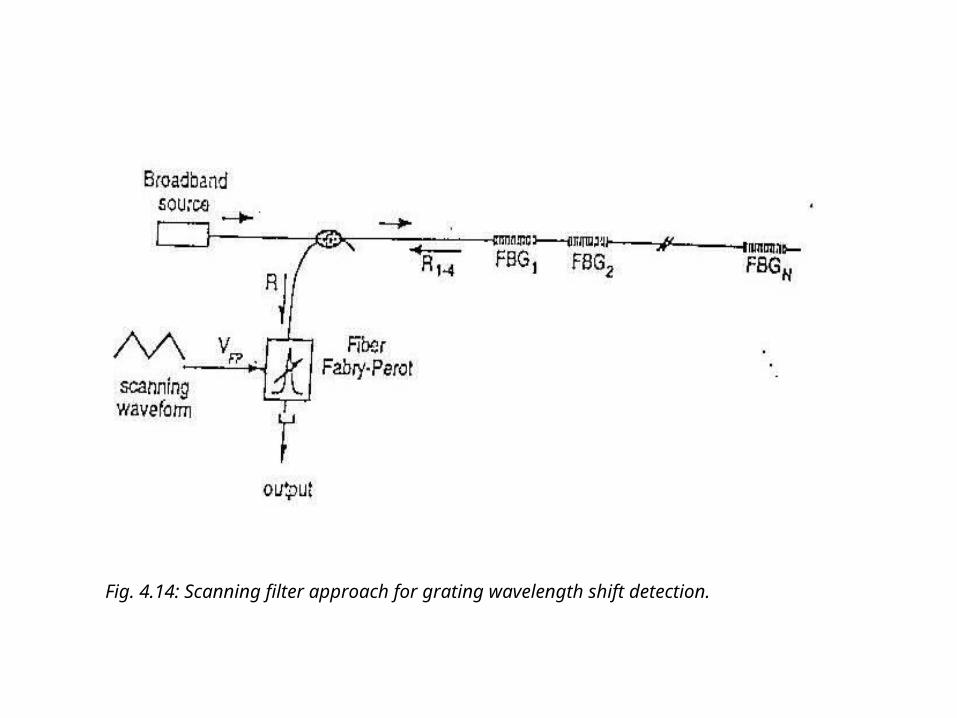
Fig. 4.14: Scanning filter approach for grating wavelength shift detection.
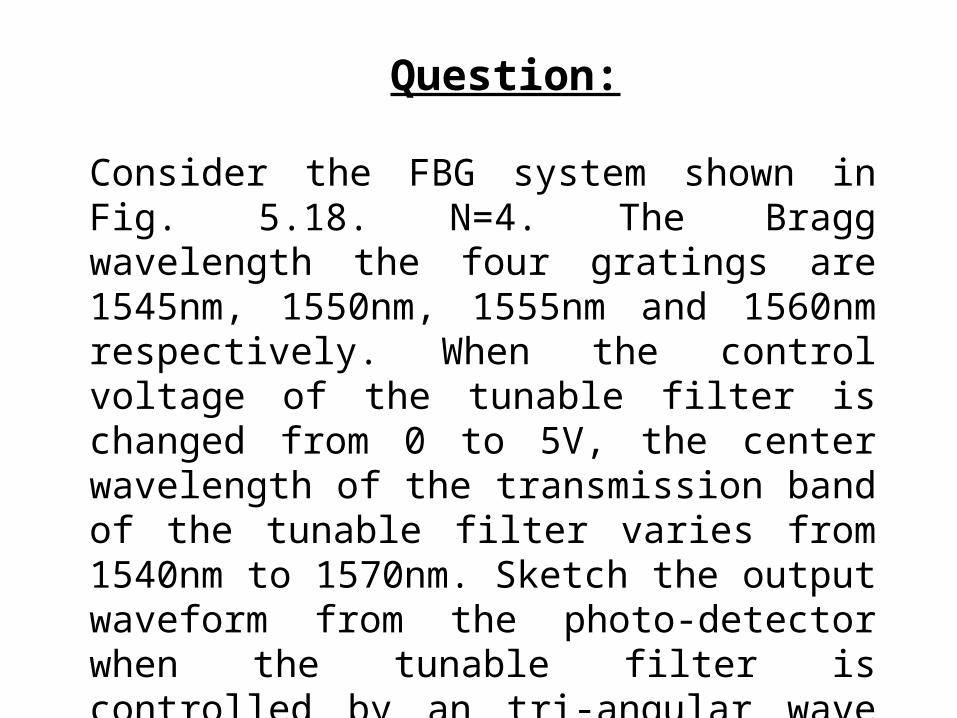
Consider the FBG system shown in Fig. 5.18. N=4. The Bragg wavelength the four gratings are 1545nm, 1550nm, 1555nm and 1560nm respectively. When the control voltage of the tunable filter is changed from 0 to 5V, the center wavelength of the transmission band of the tunable filter varies from 1540nm to 1570nm. Sketch the output waveform from the photo-detector when the tunable filter is controlled by an tri-angular wave within its voltage varies from 0 to 5V.
Question:
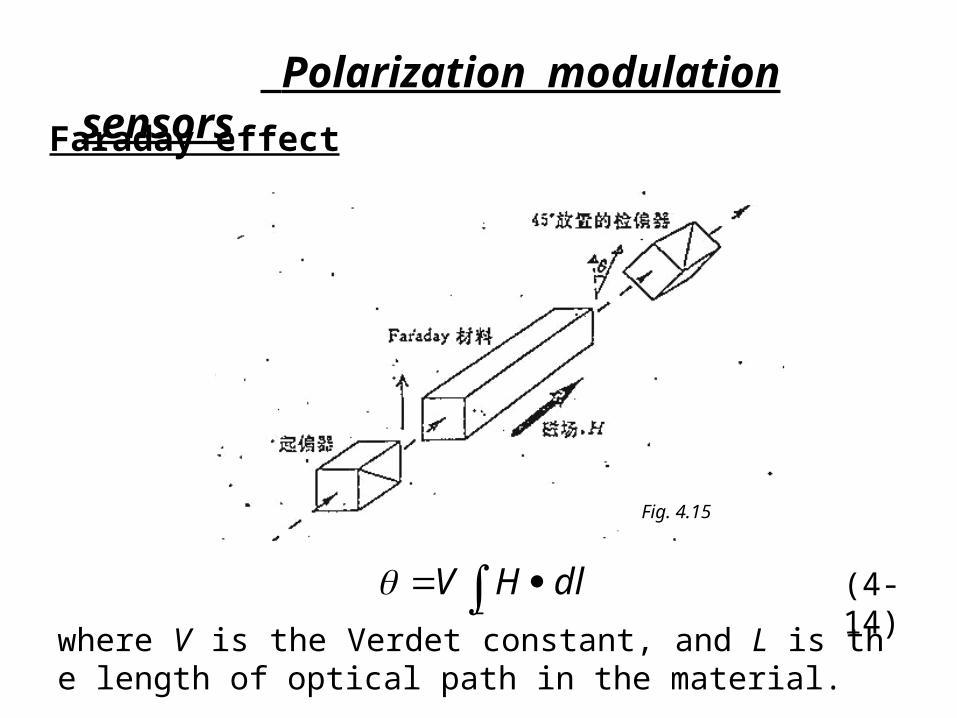
Polarization modulation sensors
Faraday effect
Fig. 4.15
L
dlHV (4-14)
where V is the Verdet constant, and L is the length of optical path in the material.
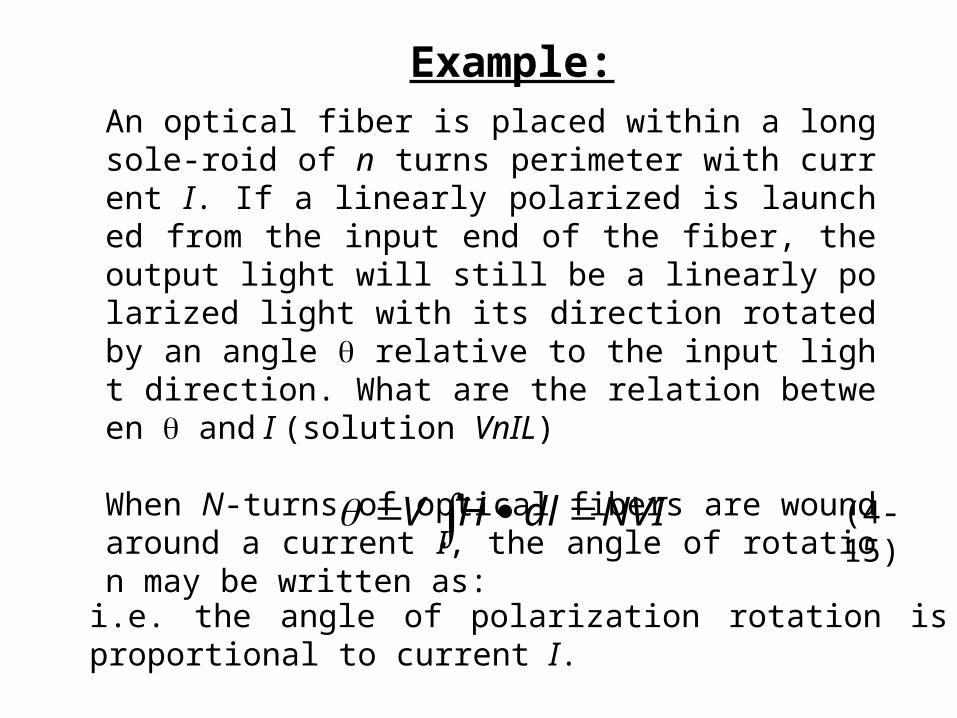
An optical fiber is placed within a long sole-roid of n turns perimeter with current I. If a linearly polarized is launched from the input end of the fiber, the output light will still be a linearly polarized light with its direction rotated by an angle relative to the input light direction. What are the relation between and I (solution VnIL) When N-turns of optical fibers are wound around a current I, the angle of rotation may be written as:
Example:
NVIdlHV (4-15)
i.e. the angle of polarization rotation is proportional to current I.
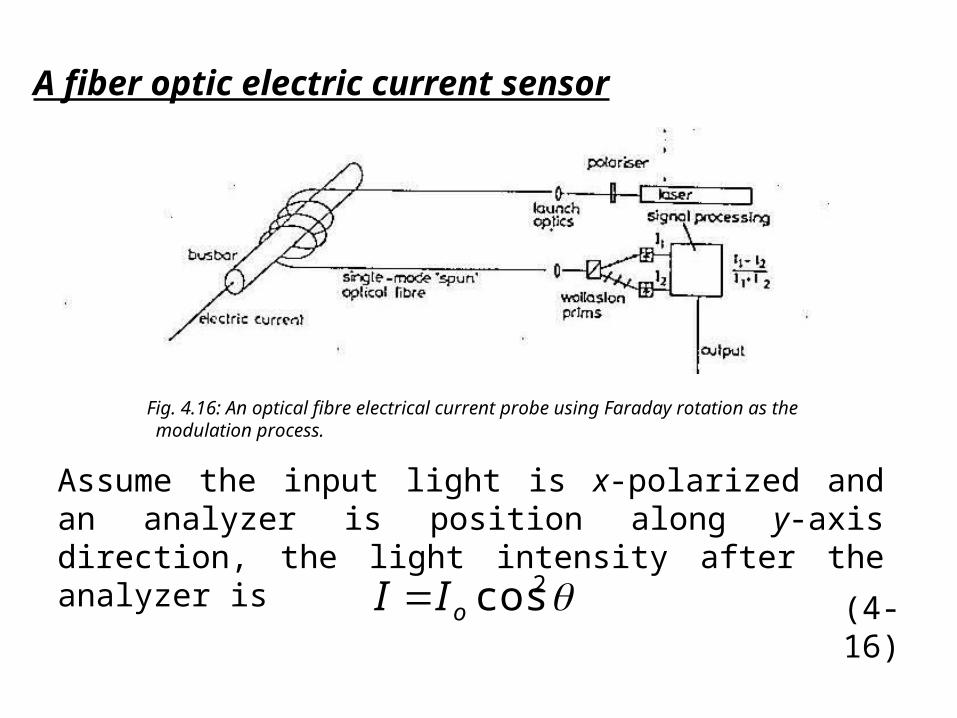
Fig. 4.16: An optical fibre electrical current probe using Faraday rotation as the modulation process.
A fiber optic electric current sensor
Assume the input light is x-polarized and an analyzer is position along y-axis direction, the light intensity after the analyzer is
2cosoII (4-16)
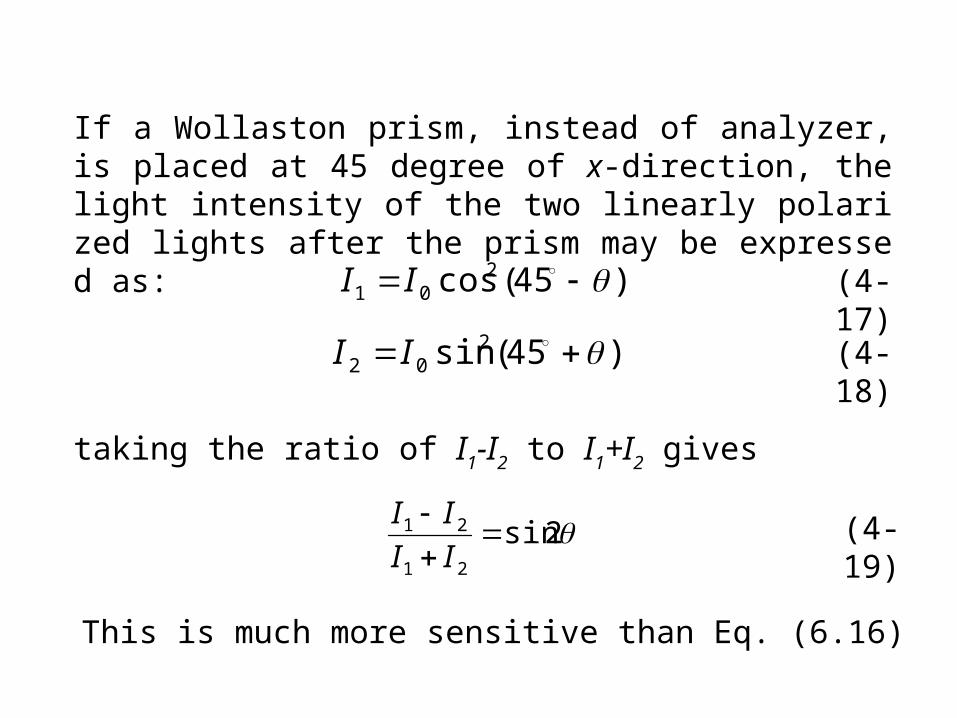
If a Wollaston prism, instead of analyzer, is placed at 45 degree of x-direction, the light intensity of the two linearly polarized lights after the prism may be expressed as:
)45(cos201 II
)45(sin 202 II
(4-17)
(4-18)
taking the ratio of I1-I2 to I1+I2 gives
2sin21
21
II
II (4-19)
This is much more sensitive than Eq. (6.16)
The sensitivity of Faraday rotation current sensor may be calculated from the Verdet constant of silica (3.3x10⁻⁴ degrees/ampere turn) and by assuming that a polarimeter with a resolution of 0.1 degrees is available. The resolution is then 300 ampere turns, so that a 10-turn coil of fiber will resolve 30 amperes. The dynamic range is determined by the detection technique. The simple ratio intensity polarimeter is linear to 1% to a total rotation of 7 degree, giving a maximum current of 2.1kA and a resolution of slightly worse than 1% over this range.