self-consistent residual dipolar coupling based model … · rdc ¼ 0:72 0:02 com-pared to s2 ls =...
TRANSCRIPT
ARTICLE
Self-consistent residual dipolar coupling based model-free analysisfor the robust determination of nanosecond to microsecondprotein dynamics
Nils-Alexander Lakomek Æ Korvin F. A. Walter ÆChristophe Fares Æ Oliver F. Lange Æ Bert L. de Groot ÆHelmut Grubmuller Æ Rafael Bruschweiler Æ Axel Munk ÆStefan Becker Æ Jens Meiler Æ Christian Griesinger
Received: 3 March 2008 / Accepted: 22 April 2008 / Published online: 4 June 2008
� The Author(s) 2008
Abstract Residual dipolar couplings (RDCs) provide
information about the dynamic average orientation of inter-
nuclear vectors and amplitudes of motion up to millisec-
onds. They complement relaxation methods, especially on
a time-scale window that we have called supra-sc (sc \supra-sc \ 50 ls). Here we present a robust approach
called Self-Consistent RDC-based Model-free analysis
(SCRM) that delivers RDC-based order parameters—
independent of the details of the structure used for align-
ment tensor calculation—as well as the dynamic average
orientation of the inter-nuclear vectors in the protein
structure in a self-consistent manner. For ubiquitin, the
SCRM analysis yields an average RDC-derived order
parameter of the NH vectors S2rdc
� �¼ 0:72� 0:02 com-
pared to S2LS
� �= 0.778 ± 0.003 for the Lipari–Szabo order
parameters, indicating that the inclusion of the supra-sc
window increases the averaged amplitude of mobility
observed in the sub-sc window by about 34%. For the
b-strand spanned by residues Lys48 to Leu50, an alter-
nating pattern of backbone NH RDC order parameter
S2rdcðNHÞ = (0.59, 0.72, 0.59) was extracted. The backbone
of Lys48, whose side chain is known to be involved in the
poly-ubiquitylation process that leads to protein degrada-
tion, is very mobile on the supra-sc time scale (S2rdcðNHÞ =
0.59 ± 0.03), while it is inconspicuous (S2LSðNHÞ = 0.82) on
the sub-sc as well as on ls–ms relaxation dispersion time
scales. The results of this work differ from previous RDC
dynamics studies of ubiquitin in the sense that the results
are essentially independent of structural noise providing a
much more robust assessment of dynamic effects that
underlie the RDC data.
Keywords Dynamics � Proteins � RDCs �Structural noise � Ubiquitin
Introduction
Insight in protein dynamics is crucial for understanding
protein function (Palmer 2004). NMR relaxation methods
provide ideal tools for studying motions faster than the
overall tumbling correlation time of a protein, i.e. sub-sc
motion (sc is ca. 4 ns for ubiquitin at room temperature).
Such motion has been proposed to contribute mostly to the
entropy of proteins (Schneider et al. 1992; Li et al. 1996;
Nils-Alexander Lakomek and Korvin F. A. Walter contributed
equally to this work.
Electronic supplementary material The online version of thisarticle (doi:10.1007/s10858-008-9244-4) contains supplementarymaterial, which is available to authorized users.
N.-A. Lakomek � K. F. A. Walter � C. Fares � S. Becker �C. Griesinger (&)
Department for NMR-based Structural Biology, Max-Planck
Institute for Biophysical Chemistry, Am Fassberg 11,
Goettingen 37077, Germany
e-mail: [email protected]
O. F. Lange � B. L. de Groot � H. Grubmuller
Department for Theoretical and Computational Biophysics,
Max-Planck Institute for Biophysical Chemistry, Goettingen,
Germany
R. Bruschweiler
NHFML, Florida State University, Tallahassee, FL, USA
A. Munk
Institut for Mathematical Stochastics, University of Goettingen,
Goettingen, Germany
J. Meiler
Department of Chemistry, Center of Structural Biology,
Vanderbilt University, Nashville, TN, USA
123
J Biomol NMR (2008) 41:139–155
DOI 10.1007/s10858-008-9244-4
Prompers and Bruschweiler 2000; Lee and Wand 2001).
Slow time scale motion (ca. 50 ls up to several ms) can be
probed by relaxation dispersion measurements (Akke and
Palmer 1996; Kay 1998; Kay et al. 1989; Palmer 2004).
These experiments isolate the contribution of conforma-
tion-dependent modulation of isotropic chemical shifts to
NMR line widths from alternative spin-spin or spin-lattice
relaxation effects. Such relaxation dispersion experiments
are sensitive to conformational changes of proteins in
catalytic cycles (Eisenmesser et al. 2005; Henzler-Wild-
man et al. 2007; Kern et al. 2005; Kern and Zuiderweg
2003; Mulder et al. 2002; Stevens et al. 2001; Tollinger
et al. 2001). Slow time scale motions have also been
detected in several cross-correlated relaxation experiments
(Dittmer and Bodenhausen 2004; Ferrage et al. 2006;
Pelupessy et al. 2003).
Relaxation methods are not suitable for the study of
dynamics between the sub-sc and the relaxation dispersion
time scale. This time scale window can thus far only be
addressed by measurements of residual dipolar couplings
(RDCs) as they are time-averaged from femtoseconds up to
milliseconds (Blackledge 2005; Tolman and Ruan 2006). It
has been proposed that this time window could be relevant
for protein–protein recognition (Bertoncini et al. 2005;
Bouvignies et al. 2005b). After the renaissance of RDCs in
liquid-state protein NMR spectroscopy (Tjandra and Bax
1997; Tolman et al. 1995), the potential of RDCs to study
protein dynamics has been recognized (Tolman et al. 1997)
and several methods have been developed to extract
dynamic information from RDCs: The RDC-based model-
free approach relies on the measurement of NH RDCs for
five linearly independent alignment tensor orientations in at
least five different media (Meiler et al. 2001; Peti et al.
2002; Lakomek et al. 2005, 2006). Using a high-resolution
structure to determine the alignment tensors, structural as
well as dynamic information can be deduced. The Direct
Interpretation of Dipolar Couplings (DIDC) approach
(Tolman 2002) is conceptually similar but does not require
a structural model of the protein. Both the structural and
dynamical models as well as the underlying alignment
tensors are obtained simultaneously. The DIDC approach
minimizes the variation of RDC-based order parameters
(see, e.g., Tolman 2002, Eq. 15). This is also true for a
recent extension of this approach (Yao et al. 2008). In an
alternative model-based approach several RDCs for protein
G (Ulmer et al. 2003) were fitted using a three-dimensional
Gaussian Axial Fluctuation (3D GAF) model (Bouvignies
et al. 2005b). These studies strongly suggest that RDC-
derived order parameters are on average smaller than the
relaxation-derived order parameters, indicating the pres-
ence of supra-sc motion. In a follow-up study, Blackledge
and co-workers were able to determine the average protein
backbone conformation and the nature and extent of
motional disorder about this average structure ab initio
from measured RDCs for protein G, using their dynamic-
meccano approach and assuming fixed peptide plane
geometry (Bouvignies et al. 2006, 2007).
Recently, high mobility in the sub-microsecond time scale
was detected using heteronuclear dipolar couplings for the
ubiquitin backbone in the microcrystalline state (Lorieau and
McDermott 2006). Furthermore, several promising approa-
ches have been undertaken to combine or compare RDC
information with motional models derived from molecular
dynamics simulations (Bouvignies et al. 2007; Markwick
et al. 2007; Nederveen and Bonvin 2005; Showalter and
Bruschweiler 2007a, b; Showalter et al. 2007). Loop
dynamics comparable to or longer than sc have been
observed for the backbone of ubiquitin in an 1.2 ls explicit
solvent MD simulation very recently (Maragakis et al. 2008).
For the model-free approach (Meiler et al. 2001; Peti
et al. 2002; Lakomek et al. 2005, 2006), it was suggested
that structural noise introduced by the usage of a single
high-resolution structure may contribute a systematic error
(Bouvignies et al. 2005a; Clore 2004; Clore and Schwieters
2006; Zweckstetter and Bax 2002). Therefore, the major
focus of the present work is to introduce a Self-Consistent
RDC-based Model-free (SCRM) analysis to alleviate this
model bias. This analysis is here applied to the protein
ubiquitin.
Materials and methods
Experimental part
Alignment media preparation
All together, 36 NH RDC data sets from the backbone of
the wild-type human ubiquitin were available for the new
SCRM analysis. Previous measurements (Peti et al. 2002),
data sets D1–D5 in (Lakomek et al. 2006) were replaced by
measurements with increased concentration of ubiquitin.15N,13C-labeled human ubiquitin (wt) was expressed
according to (Johnson et al. 1999). Thirteen new alignment
conditions, A1–A13, were prepared as described in the fol-
lowing. In every case, 2.5 mg of ubiquitin were dissolved in a
50 mM Na phosphate buffer at pH 6.5. The final ubiquitin
concentration varied between 0.75 and 0.9 mM, and 10–20%
(v/v) D2O were added for field locking. The following briefly
describes the individual new alignment conditions.
A1: A 7% positively charged gel sample was prepared
according to (Cierpicki and Bushweller 2004).
The positive charge was introduced by addition of
(3-acrylamidopropyl)-trimethylammonium chloride (APT-
MAC, Sigma-Aldrich, Inc.) in a ratio of APTMAC:
acrylamide = 1:3.
140 J Biomol NMR (2008) 41:139–155
123

A2: A 7% positively charged gel was prepared as for A1
but with a ratio APTMAC:acrylamide = 1:1.
A3: A 5% negatively charged gel was prepared according
to (Cierpicki and Bushweller 2004). The negative charge
was introduced by addition of acrylic acid (Sigma-
Aldrich, Inc.) in a ratio of acrylic acid: acryl amide = 1:1.
A4: The ubiquitin solution was added to dodecyl-
penta(ethylene glycol) (C12E5) stock solution (15%
w/v) in a ratio of 2:1 and vortexed. The solution became
opalescent after addition of 1.5% (v/v) hexanol (Ruckert
and Otting 2000).
A5: Ubiquitin was dissolved in a suspension of 25 mg/ml
Pf-1 phage (ASLA Ltd., Riga, Lativa) in 50 mM Na
phosphate buffer with 100 mM NaCl (Zweckstetter and
Bax 2001).
A6: Same as A5 but with a Pf-1 phage concentration of
20 mg/ml.
A7: A 1,2-dimyristoyl-sn-glycero-3-phosphatidylcholine
(DMPC)/1,2-dihexanoyl-sn-glycero-3-phosphatidylcho-
line (DHPC) = 3:1 mixture (Avanti Polar Lipids,
Alabama) of 15% w/v was dissolved in buffer containing
50 mM NaCl and 50 mM Na phosphate buffer (pH = 6.5)
with 0.02% sodium azide, and 10% D2O. The final
ubiquitin concentration was 0.9 mM (Triba et al. 2005).
A8: DMPC, DHPC and SDS (sodium dodecyl sulfate,
Serva, Heidelberg, Germany) were mixed in a ratio of
30:10:2 and dissolved in a 50 mM Na phosphate buffer
with pH = 6.5, containing 15–20% D2O until a total lipid
concentration of 5%(w/v) was reached. The composition
was vortexed at 0�C until the solution became clear.
Ubiquitin was dispersed in this solution with a final
concentration of 0.75 mM.
A9–A13: Bicelle media were prepared similarly to A7 and
A8. Ingredients and total lipid concentration can be found
in Table 1. The ubiquitin concentration was 0.75 mM.
To complement the data sets obtained from these
alignment conditions (in order to better span the
5-dimensional RDC space) the following data sets have
been used: A14–A18: NH data set E1 to E5 measured in a
previous analysis (Lakomek et al. 2006).
A19–A36: NH RDC data sets published by Bax and
coworkers (Ottiger et al. 1998) and Tolman and coworkers
(Ruan and Tolman 2005; Briggman and Tolman 2003).
The collection of 36 NH RDC data sets will be referred
to as D36M. A table containing all NH RDC data sets used
for the analysis is provided in the Supporting Information
(Table S5). All relevant alignment conditions used for the
different data sets are listed in a second table in the Sup-
porting Information (Table S6).
NMR Spectroscopy
NH RDC data for all new aligned media A1–A13 as well as
the isotropic reference experiment were measured using
2D-IPAP-15N,1H-HSQC experiments (Ottiger and Bax
1998). All data were recorded at a sample temperature of
308 K. Measurements were performed on either a Bruker-
Avance 700 MHz (Bruker AG, Karlsruhe, Germany), a
Bruker-DRX 600 MHz or a Bruker-Avance 600 MHz
spectrometer equipped with a TXI cryogenic probe head or
a Bruker 800 MHz spectrometer equipped with a TCI
cryogenic probe head. The time domain was either
TD1 9 TD2 = 1 k 9 2 k or TD1 9 TD2 = 2 k 9 2 k with
a spectral width of X1� X2 = 25 ppm 9 15 ppm (besides
X1� X2 = 30 ppm 9 15 ppm for data set A5 and A6). The
number of scans was 32 and higher.
For processing, data were zero-filled to TD1 9 TD2 =
32 k 9 4 k and processed with the NMRPipe software
package (Delaglio et al. 1995). (J + D)- and J-coupling
constants were extracted using NMRPipe. One-bond 15N,1H RDCs were derived from the difference in coupling
between aligned samples and the isotropic sample. The
experimental error was conservatively estimated to be less
than 0.3 Hz. Alignment tensors were calculated using the
software PALES (Zweckstetter and Bax 2000).
SECONDA analysis
In order to quantify the similarity of structure and
dynamics in the different alignment media (homogeneity of
RDC data), a SECONDA analysis was applied (Hus and
Table 1 Bicelle media preparation (See chapter Materials and methods, alignment media preparation)
Alignment condition Liquid crystalline media Mixing ratio Total lipid concentration/(w/v), (%)
A9 DLPC:DHPC:SDS 30:10:2 10
A10 DMPC:DHPC:C14PC 30:10:1 5
A11 DMPC:DHPC:C14PC 30:10:2 10
A12 DMPC:CHAPSO:CTAB 50:10:1 10
A13 DMPC:DHPC:CTAB 30:10:1 8
The following abbreviation are used, additionally to those already explained before: C14PC = tetradecylphosphatidylcholine, CHAPSO =
3-[(3-cholamidopropyl)dimethylammonio]-2-hydroxyl-1-propanesulfonate (Sigma-Aldrich, Inc.), CTAB = N-cetyl-N,N,N-trimethylammonium
bromide (Roth, Karlsruhe, Germany)
J Biomol NMR (2008) 41:139–155 141
123
Bruschweiler 2002; Hus et al. 2003). The SECONDA
method analyzes the covariance matrix constructed of all
RDC data obtained under different alignment conditions. It
performs a principal component analysis (PCA) of the
RDC covariance matrix, which is equivalent to a singular
value decomposition (SVD) of the RDC matrix. The sin-
gular values are sorted according to decreasing size.
Structural and dynamic information is contained in the first
five singular values, since dipolar couplings are a second
rank symmetric tensor interaction and hence reside in a
linear 5-dimensional space. Accordingly, only noise, sys-
tematic errors, and structural and dynamic heterogeneity
may cause the 6th and higher singular values to differ from
zero. The ratio of the 5th and 6th singular values (called
SECONDA gap in the following) is a measure of the
homogeneity of RDC data and the magnitude of noise.
The larger the SECONDA gap, the more self-consistent are
the RDC data in the different alignment media.
For D36M, the SECONDA gap was 5.66 after normali-
zation. Starting from these 36 NH RDC data sets, a subset of
23 NH RDC data sets (D23M) was selected that increased
homogeneity of the RDC data with still adequate sampling of
alignment tensor orientations in the 5-dimensional tensor-
space (as described in the Supporting Information). The data
sets contained in the subset D23M are displayed in Table S5
in the Supporting Information. The SECONDA gap of subset
D23M was 6.81 after normalization.
Self-Consistent RDC-based Model-free (SCRM)
approach
The Self-Consistent RDC-based Model-free (SCRM)
method was developed from the theory of the original
RDC-based model-free approach. RDCs are measured in at
least five linear independent alignment conditions for each
single inter-nuclear vector (e.g. the NH). The RDC-based
model-free approach extracts dynamically averaged second
order spherical harmonics Y2;M
�ðh;/Þi from these RDCs,
Dexp� �
¼ffiffiffiffiffiffi4p5
r
Dzz Y2;0ðh;uÞ� ��
þffiffiffi3
8
r
R Y2;2ðh;uÞ� �
þ Y2;�2ðh;uÞ� �� ��
: ð1:1Þ
For each NH vector j, the five averaged second order
spherical harmonics Y2;M
�ðhmol
j ;/molj Þi are derived by
solving the F-matrix equation (1.2). This equation
describes for each alignment condition the residual
dipolar coupling equation (1.1) in the molecular frame.
The F-Matrix relates the spherical harmonics in the
molecular frame to the measured RDCs by a Wigner
rotation from the molecular frame to the alignment frame
(Lakomek et al. 2006; Meiler et al. 2001):
Dexpij
Di;zz¼X2
M¼�2
Fi;M Y2;M
�ðhmol
j ;/molj Þi ð1:2Þ
with
Fi;M ¼ffiffiffiffiffiffi4p5
r �D2
M0ðai; bi; ciÞ þffiffiffi3
8
r
R�D2
M2ðai; bi; ciÞ
þ D2M�2ðai; bi; ciÞ
�
¼ffiffiffiffiffiffi4p5
r �e�iMai
d2M0ðb
iÞ þffiffiffi3
8
r
Rðe�iMai
d2M2ðb
iÞe�2ici
þ e�iMai
d2M�2ðb
iÞe2iciÞ: ð1:3Þ
From the dynamically averaged spherical harmonics,
RDC-based order parameters S2rdc are determined which are
sensitive to all motions faster than the millisecond time
scale. This is in contrast to Lipari–Szabo order parameters
S2LS (Lipari and Szabo 1982) obtained from relaxation
measurements which are only sensitive up to the overall
tumbling correlation time sc (ca. 4 ns for ubiqutin at room
temperature):
S2rdc ¼
4p5
X2
M¼�2
Y2;M h;/ð Þ� �ms
psY�2;M h;/ð ÞD E
ms
ps
S2LS ¼
4p5
X2
M¼�2
Y2;M h;/ð Þ� �sc
psY�2;M h;/ð ÞD E
sc
psð1:4Þ
In addition to RDC-based order parameters S2rdc, the
dynamic average orientations of inter-nuclear vectors can
also be determined. After performing a coordinate
transformation that maximizes Y2;0 h0;/0ð Þ� �
, the NH
vector points along the z0 axis of the new primed
reference frame:
max Y2;0 h0;/0ð Þ� �
¼X2
M¼�2
DM;0 /av; hav; 0ð Þ Y2;M h;/ð Þ� �
¼ffiffiffiffiffiffi4p5
rX2
M¼�2
Y�2;M hav;/avð Þ Y2;M h;/ð Þ� �
:
ð1:5Þ
The first and second Euler angle of the respective
Wigner rotation DM;0 /av; hav; 0� �
corresponds to the
dynamic average orientation of the inter-nuclear NH
vector /av; havð Þ. Furthermore, the amplitude g and
direction of anisotropy /rdc (Lakomek et al. 2006; Peti
et al. 2002) are determined.
The goal of the Self-Consistent RDC-based Model-free
(SCRM) approach was to remove a possible bias due to the
protein structure used for the initial determination of the
alignment tensors. To this aim, we proceeded as follows.
The first step of the SCRM method was the application of
142 J Biomol NMR (2008) 41:139–155
123
the standard RDC-based model-free analysis as described
in (Lakomek et al. 2006): First, alignment tensors were
calculated from the measured RDCs using the PALES
(Zweckstetter and Bax 2000) or DipoCoup software
(Meiler et al. 2000) and from the X-ray structure 1ubi
(Ramage et al. 1994) to which protons were added with
MOLMOL (Koradi et al. 1996). Naturally, the dynamically
averaged orientations /av; havð Þ calculated from the RDC-
based model-free approach will exhibit deviations from the
orientations in the X-ray structure. In an iterative fashion,
the NH vector orientations used for the tensor calculation
were replaced by the resulting /av; havð Þ after each model-
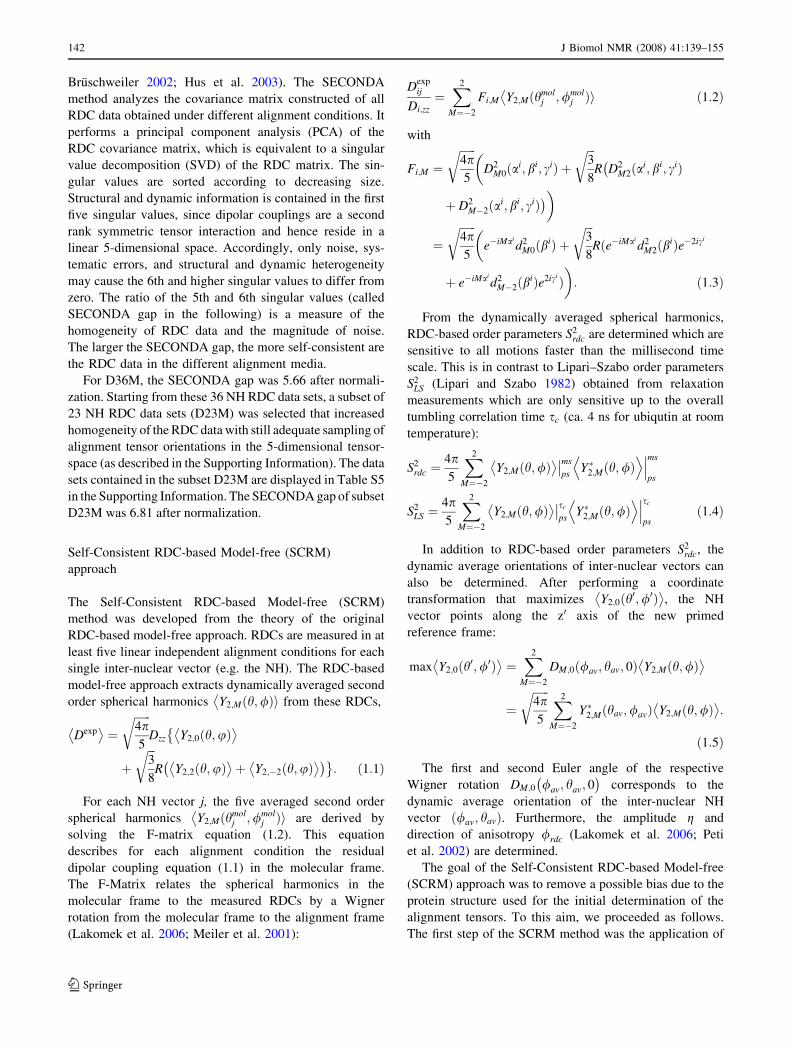
free analysis cycle (Fig. 1).
An N–H bond length of 1.04 A (Ottiger and Bax 1998) has
been used to calculate the new proton coordinates. (Note that
the SCRM results are independent of the used bond-length.)
Each cycle i of model-free analysis an alignment tensor
recalculation was conducted until convergence of the
order parameters S2rdc;i � S2
rdc;i�1
¼ 1
n
Pnj¼1 S2
rdc;iðNHjÞ�
S2rdc;i�1ðNHjÞj � 0:01 was achieved. Note that in every
step of the SCRM approach the five time-averaged second
order spherical harmonics are calculated in the same way
as in the original rdc-based model-free approach for each
residue. From those the five rdc-based model-free
parameters S2rdc;/av; hav; g;/
0rdc are derived. In the fol-
lowing discussion we will focus on the first three
parameters S2rdc and /av; havð Þ.
The SCRM procedure was implemented in a semi-
automated manner using a Mathematica 5.2 protocol,
PALES, and several Python scripts. To assess the fit of the
alignment tensor to the experimental RDC data, static
Q-factors Qstatic ¼ffiffiffi2p
Rdip as defined in (Bax and Grishaev
2005) and the Pearson correlation coefficients q were
extracted from PALES after each cycle. Additional criteria
and error measures were implemented for the SCRM
analysis as explained below.
Back-calculated RDCs and dynamic Q-values assess
the fitting quality of SCRM
RDCs were back-calculated from the time-averaged second
order spherical harmonics Y2;M
�ðh;/Þi (Eq. 1.1). Consis-
tency of the model-free approach on a per-residue-basis
(running index j) was assessed by computing the root mean
square deviation (rmsd) between back-calculated RDCs
DMF and experimental RDCs Dexp (RDC-rmsd):
rmsdðrdc; jÞ ¼
ffiffiffiffiffiffiffiffiffiffiffiffiffiffiffiffiffiffiffiffiffiffiffiffiffiffiffiffiffiffiffiffiffiffiffiffiffiffiffiffiffiffiffiffiffiffiffiffiPKi¼1 ðDi;j;MF � Di;j;expÞ2
K
s
ð1:6Þ
where K is the number of alignment media. We also
introduced dynamic Q-values Qdyn utilizing the DMF RDCs:
Qdyn;i ¼
ffiffiffiffiffiffiffiffiffiffiffiffiffiffiffiffiffiffiffiffiffiffiffiffiffiffiffiffiffiffiffiffiffiffiffiffiffiffiffiffiffiffiffiffiffiffiPNj¼1 ðDij;MF � Dij expÞ2PN
j¼1 D2ij;exp
vuut ð1:7Þ
where N is the number of RDCs available in medium i. The
dynamic Q-value Qdyn measures the quality of fit of the
model-free solution for the different alignment media. It is
a straightforward extension of the well-known Q-value that
measures the quality of fit of experimental RDCs over a
single static structure.
Error calculation for the SCRM analysis
To estimate the error of the RDC-based order parameters
S2rdcðjÞ for each residue j, the experimental error was modelled
by adding Gaussian noise to the measured RDCs. The input
RDCs with added noise Di;j;noise were generated by drawing
N = 1000 random samples Di;j;noise ¼ random½pðDi;jÞ� from a
Gaussian distribution pðDÞ with standard deviation rj.
Two different standard deviations rj were considered to
study the propagation of different sources of errors to the
SCRM derived order parameters: first, in order to assess the
impact of the experimental error from the RDC data alone
rexpj = 0.3 Hz was used. Second, the residue-specific
rrmsdj ¼ rmsdðrdc; jÞ was used in order to assess the com-
bined effect of experimental error and additional
systematic errors introduced by the model-free analysis.
Examples for the latter are a possible correlation between
alignment tensor fluctuations and internal dynamics, or the
single tensor approximation. This analysis was repeated
N = 1000 times. The error is evaluated as the standard
deviation of the resulting N = 1000 S2rdcðjÞ:
new structureold structure
alignment tensorcalculation
Da,R,α,β,γ
+
model-freeapproach
N
Hθ,φN
avHθav,φav
θav,φav
Fig. 1 Sketch of the SCRM cycles: RDC-based model-free results
are calculated using NH RDC data as well as inter-nuclear NH vectors
for tensor calculation. Starting from a first structural model (e.g. the
X-ray structure 1ubi with protons added with standard geometry), the
inter-nuclear NH vector orientations are adjusted in each SCRM cycle
towards the true dynamic average orientation. Consequently, the fit of
the alignment tensor to the RDC data is improved in each step and as
result the fit of the model-free results to the RDCs as well
J Biomol NMR (2008) 41:139–155 143
123
DS2rdcðjÞ ¼
ffiffiffiffiffiffiffiffiffiffiffiffiffiffiffiffiffiffiffiffiffiffiffiffiffiffiffiffiffiffiffiffiffiffiffiffiffiffiffiffiffiffiffiffiffiffiffiffiffiffiffiffiffiffiffiffiffi1
N
XN
k¼1
S2rdc;kðjÞ � S2
rdcðjÞ� �� �2
vuut : ð1:8Þ
Selection of the set of RDCs for alignment tensor
calculation
The RDC-based model-free analysis assumes that internal
protein dynamics of the backbone NH vectors are not cor-
related with the alignment tensor modulations. This
assumption allows working with a single average alignment
tensor for each medium. Simulations indicated that this
assumption is correct for secondary structure elements, at
least for steric alignment (Louhivuori et al. 2006; Salvatella
et al. 2008). Correlations between alignment tensor fluctu-
ations and backbone NH vector dynamics have been
observed only for more mobile loop regions in ubiquitin
(Salvatella et al. 2008). Consequently, we excluded the most
mobile residues from the alignment tensor calculation.
However, reducing the number of residues from which the
alignment tensor is determined may lead to an inhomoge-
neous sampling of the three principal axes and may amplify
structural noise. Thus, a consensus set of RDCs had to be
found, which provides a nearly complete sampling of ori-
entations while still avoiding correlations between tensor
modulations and internal protein dynamics.
To this end, we followed an approach similar to the one
introduced by (Bouvignies et al. 2005b): In a first step,
alignment tensors are calculated using the experimental
data for all residues 2–72. (The highly flexible C-terminus
of ubiquitin (residues 73–76) was always excluded.) Four
iterations of the SCRM protocol were performed. Then, the
20% most mobile residues (S2rdc;unscaled � 0:95) were
excluded from the alignment tensor calculation and the
SCRM analysis was re-started using the remaining set of
residues for alignment tensor calculation. To ensure an
adequate sampling of the three principal axes of the
alignment tensor, an eigenvalue analysis of the matrix
C ¼ BT B ð1:9Þ
where B ¼ ðe1; e2; . . .eNÞ is the 39 N matrix containing the
normalized NH vectors of the average structure, was per-
formed and the diagonalized matrix D = (d(1),d(2),d(3))
was obtained that contains the three eigenvalues of C
sorted according to magnitude (see Prompers and
Bruschweiler 2002). It was ensured that the selected base
of residues adequately samples the three tensor axes as
described in the Supporting Information.
Determination of Soverall
Since experimental RDCs are scaled by internal motion and
the alignment tensor is determined from experimental RDCs
fitted to a rigid protein structure, the derived alignment tensor
will be dynamically averaged and therefore reduced in size.
Isotropic internal dynamics leaves the rhombicity and the
orientation of the tensor with respect to the molecular frame
unaffected but leads to a reduction of the overall magnitude
(Lakomek et al. 2006; Meiler et al. 2001). Therefore, the true
value of the principal tensor Di;zz is not known and can only
be estimated from the experimentally accessible dynami-
cally averaged ~Di;zz. As has been shown previously (Meiler
et al. 2001), ~Di;zz is determined such that the average over the
S2rdc;unscaled equals 1 (when taking all residues for alignment
tensor calculation), because the average dynamics is absor-
bed in the alignment tensor.
Therefore, the S2rdc;unscaled provide only relative values for
the dynamic amplitudes, but have to be scaled against the
Lipari–Szabo order parameters S2LS which contain absolute
mobility information given a fixed distance between the amide
proton and nitrogen and assuming a constant chemical shift
anisotropy. The downscaling of S2rdc;unscaled to S2
rdc is accom-
panied by an up-scaling of ~Di;zz to Di;zz. As explained in detail
in (Lakomek et al. 2006), the scaling factor Soverall therefore
fulfills: ~Di;zz ¼ Soverall � Di;zz and Sj;rdc ¼ Soverall � Sj;rdc;unscaled.
Using this definition, Eq. (1.2) can be rewritten:
Dexpij
~Di;zz
� Soverall ¼X2
M¼�2
Fi;M Y2;M
�ðhmol
j ;/molj Þi ð1:10Þ
Subsequently, for clarity we will omit the indices i and j.
Solving the F-matrix equation yields Y2;M h;/ð Þ� �
scaledð Þ¼Soverall � Y2;M h;/ð Þ
� �unscaledð Þ and finally S2
rdc. It should be
noted that Soverall is a mathematical parameter without a
direct physical meaning. The only values that have physical
meaning are the scaled order parameters S2rdc. Determining
the scaling factor Soverall is non-trivial. Since RDC-based
order parameters are sensitive up to the millisecond time
scale while the Lipari–Szabo ones only up to the overall
tumbling correlation time sc, the condition S2rdc� S2
LS or
S2overall � S2
rdc;unscaled � S2LS must hold within experimental
error. This relationship is used to estimate the overall scaling
factor Soverall by requiring S2overall� S2
LS=S2rdc;unscaled within
the experimental error of S2rdc and S2
LS. It is further assumed
that several residues do not show supra-sc motion resulting in
identical S2rdc and S2
LS for those residues. Lipari–Szabo order
parameters S2LS measured at 308 K by Tjandra and
co-workers were used (Chang and Tjandra 2005). Details can
be found in the Supporting Information.
Application to experimental data
The SCRM method has been applied to both experimental
NH RDC data sets D36M and D23M using the X-ray
structure 1 ubi (Ramage et al. 1994) as starting structure
(with protons added in standard positions with MOLMOL
144 J Biomol NMR (2008) 41:139–155
123
(Koradi et al. 1996) using a bond length of 1.04 A). The
influence of structural noise on the SCRM analysis was
tested as described in the following paragraph.
Structural noise analysis
The influence of structural noise on the SCRM approach
was tested for two different scenarios, A and B:
In scenario A, synthetic Gaussian noise was added on
the NH vector orientation of the X-ray 1ubi structure (with
hydrogen atoms added according to standard geometry).
Using PALES (Zweckstetter and Bax 2000), the NH vector
is tilted Gaussian distributed with opening angle h and an
equally distributed polar angle / as described in (Zweck-
stetter and Bax 2002). For the standard deviation of the
Gaussian distribution values of (a) r = 10�, (b) r = 20� or
(c) r = 30� were chosen, subsequently referred to as
structural noise of 10�, 20� or 30� respectively. For each
case (a)–(c) three different random noise structures were
generated. These random noise structures were used as
starting structures for the alignment tensor calculation in
the SCRM analysis.
For scenario B we used nine crystal structures of ubiquitin
bound to its recognition proteins as input. These structures
deviate from the free ubiquitin crystal structure 1ubi by
backbone RMSD values between 0.3 and 0.6 A. These
structures are 1cmx (Johnston et al. 1999), 1uzx (Teo et al.
2004), 1xd3 (Misaghi et al. 2005), 1yiw (Bang et al. 2005),
2c7n (Penengo et al. 2006), 2d3g (two structures, (Hirano
et al. 2006)), 2fif (two structures, (Lee et al. 2006)).
For both scenarios, the RDC-based order parameters S2rdc
are compared to those derived from the ‘‘noise-free’’ 1ubi
X-ray structure to analyze the influence of structural noise.
Statistical analysis of S2rdc and S2
LS distributions
We describe the spread of the S2rdcand S2
LS distributions over
all residues of ubiquitin in terms of P-percentiles. The 25th
percentile P25 is the value compared to which 25% of the
distribution is lower. For the 75th percentile P75, 75% of
the distribution have lower values. The interquantile range
(IQR) is defined as the difference between P75 and P25.
The IQR covers 50% of the distribution and is a direct
measure for the spread of a distribution.
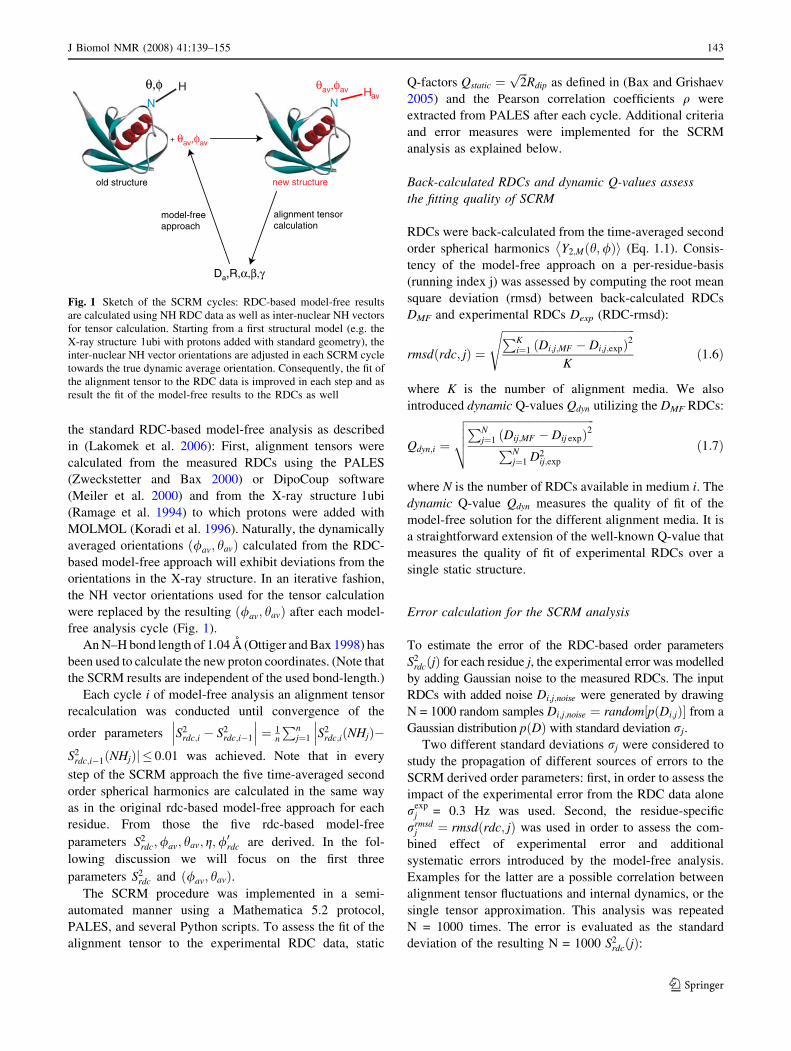
Results and discussion
SCRM on experimental NH RDC data (D23M
and D36M)
The SCRM method was applied to both NH RDC experi-
mental data sets D23M and D36M using the X-ray
structure 1ubi as starting input structure for the first cycle
of the SCRM method.
The static X-ray structure 1ubi (with hydrogen atoms
added according to standard geometry) yields static
Q-values of Qstatich i = 0.178 for D23M and Qstatich i = 0.193
for D36M averaged over all alignment conditions. The
Pearson correlation coefficients between experimental
RDCs and those back-calculated from the static X-ray
structure are qh i = 0.977 for D23M and qh i = 0.972 for
D36M respectively, on average over all conditions.
As described in the Material and methods section, the
SCRM method was designed to iteratively improve the
accuracy of the alignment tensor determination and to
adjust the average inter-nuclear vector orientations, and as
a result, to further reduce the static Q-values Qstatich i and
increase the Pearson correlation coefficient q. Indeed, after
already 4 SCRM-cycles, the static Q-values decreased to
less than half of the original value with Qstatich i = 0.062 for
both D23M and D36M (Fig. 2a, b). Simultaneously, the
correlation coefficients q increased to qh i = 0.997 on
average (Fig. 2c, d). Convergence was attained in already 4
cycles of SCRM after which the inter-nuclear vector ori-
entations /av; havð Þ were found to deviated by less than 0.5
between consecutive SCRM cycles (Figure S2a and S2b in
the Supporting Information). Thus the iterative procedure
rapidly improves the fit of the static structure to the RDCs
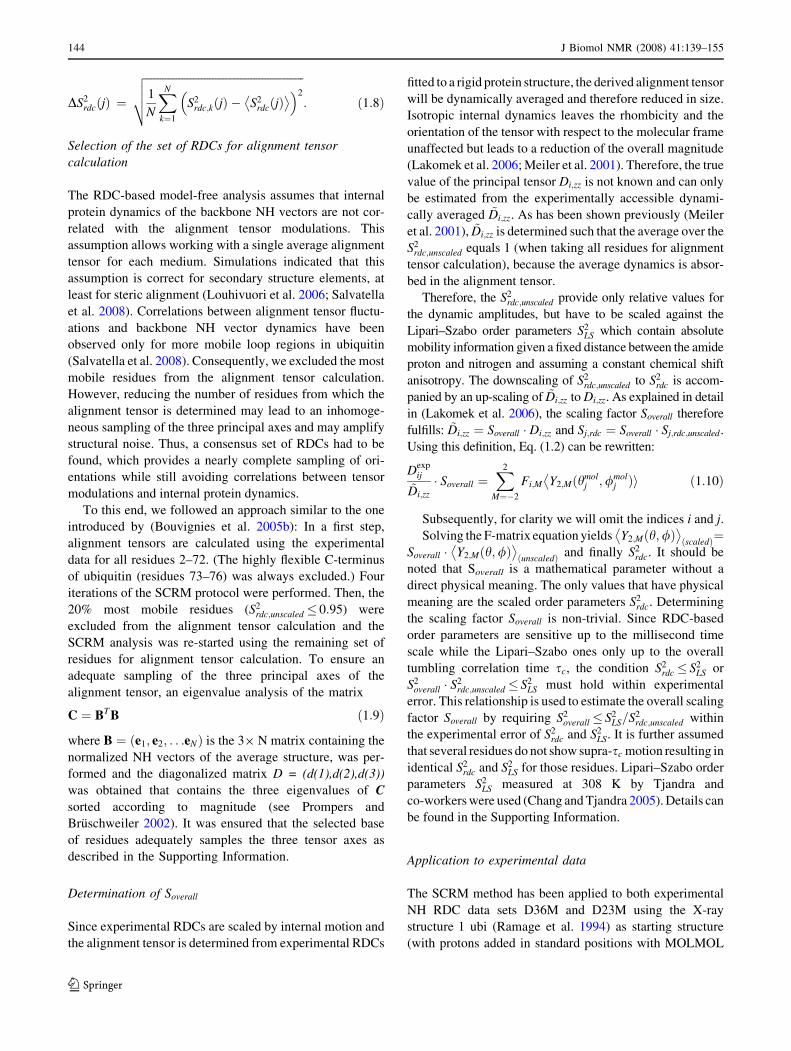
as compared to the input X-ray structure.
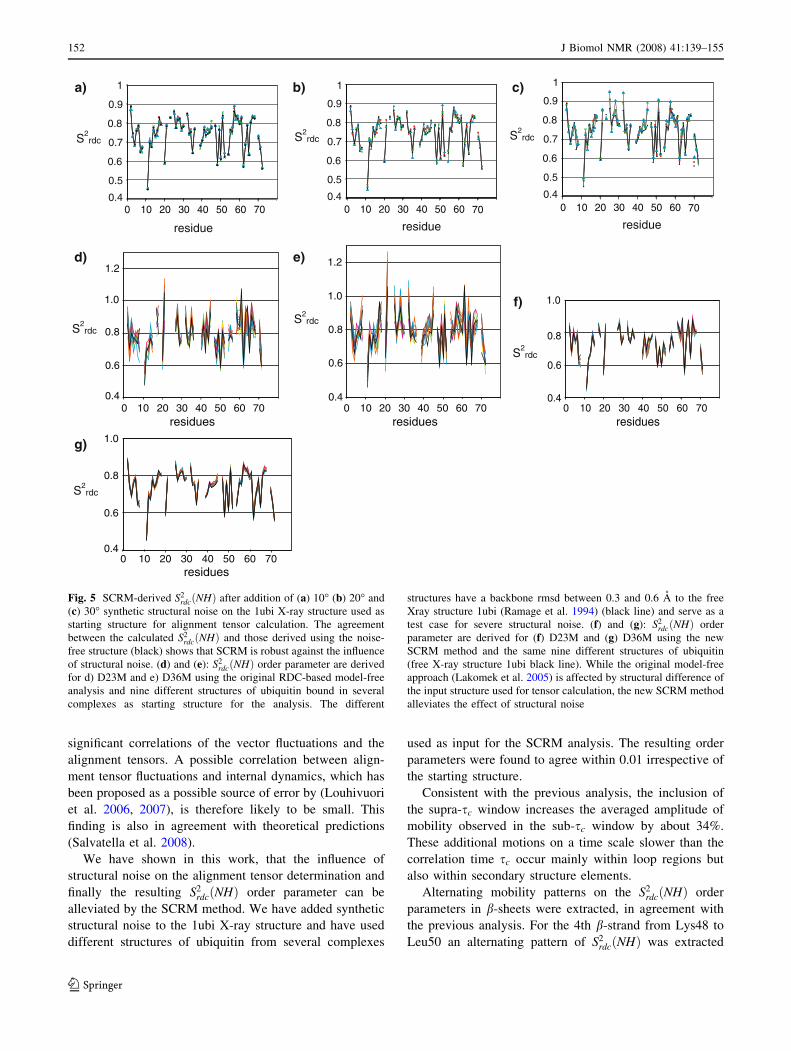
In Fig. 2(e, f) the inter-nuclear angles jj enclosed
between the dynamic average NH vector orientations and
the NH vectors of the starting X-ray structure 1ubi are
shown. For better comparison, the dynamic average NH
vector orientations have been rotated to a best-fit super-
position with the NH vectors of the 1ubi structure (with
protons added according to standard geometry).
Most of the dynamic average inter-nuclear vector orien-
tations obtained after 4 SCRM cycles differ from those of the
1ubi X-ray structure by less than 10� for jj (Fig. 2e, f). The
average angular deviation is 6.97� for D23M and 6.87� for
D36M. Deviations larger than 10� are observed for Lys6,
Lys11, Ile13, Ser20, Lys33, Glu34, Arg42, Lys48, Leu50,
Asp52, Arg54, Leu67, Val70 and Leu71 for D23M. The
largest deviation is 20.3� for Arg54 (compare Fig. 2e, f).
Most of these residues are highly mobile with S2rdcðNHÞ\
0.7. Exceptions are Lys6 in the first b-strand, Lys33 and
Glu34 in the a-helix, Leu43 in the third b-strand and Leu67
and Val70 in the fifth b-strand. Despite the fact that S2rdcðNHÞ
[ 0.7 for Lys33 and Glu34, they appear relatively mobile
compared to the surrounding residues in the a-helix. Values
for all residues have been listed in the Supporting Informa-
tion in Table S3 for D23M and S4 for D36M. The derived
dynamic average NH orientations have been compared to the
NMR 1d3z structure (Cornilescu et al.1998) (first structure
of the ensemble) as well (Fig. 2g, h). The average deviation
J Biomol NMR (2008) 41:139–155 145
123
to the NMR structure is 4.84� for D23M and 4.52� for D36M.
Thus, the agreement between the derived dynamic average
NH vector orientations and the NMR structure is signifi-
cantly better than for the 1ubi structure. Interestingly, most
of those dynamic average NH vectors that showed the largest
deviations to the 1ubi X-ray structure, for example K6, L67
and V70, did not show large deviations compared to the
NMR structure. Only Lys11 and Asp52 show large dis-
crepancies both for the X-ray and NMR structure. Both are
highly dynamic. In the 1ubi structure Lys6, Lys48 and Arg54
appear to be affected by crystal packing. Indeed, the largest
deviation between 1ubi and 1d3z is observed for Arg54 with
j = 22.4�, also for Lys48 and Lys6 the deviations are high
with j = 9.3� and 12.3�. A tendency was observed that NH
vectors involved in hydrogen bonds became more collinear
to the electron donating carbonyl groups upon application of
SCRM. Considering only changes greater than three of the
NH vector orientation, 15 out 23 backbone amide groups
became more parallel to the carbonyl group.
For comparison, the SCRM analysis was repeated using
the 1d3z NMR structure as starting structure. As expected,
the results are almost identical and corroborate the
a) b)
c) d)
alignment condition
Q
0
0.05
0.10
0.15
0.20
alignment condition
Q
0 5 10 15 20 25 30 35
alignment condition
0 5 10 15 20 25 30 350.95
0.96
0.97
0.98ρρ
alignment condition
0
0.05
0.10
0.15
0.20
0.99
1.00
0.95
0.96
0.97
0.98
0.99
1.00
0 5 10 15 20
0 5 10 15 20
e) f) 25
0 10 20 30 60 70
residue40 50
5
10
15
20
25
0
κ /°
residue 0 10 20 30 60 7040 50
5
10
15
20
0
κ /°
g) h)
10 20 30 60 70
residue
40 50
residue 0 10 20 30 60 7040 50
5
10
15
20
25
0 0
5
10
15
20
25
0
κ /° κ /°
Fig. 2 (a) and (b) show
Q-values for back-calculated
RDCs using the X-ray
structure 1ubi for alignment
tensor determination (dashed
line) and after 4 SCRM cycles
using the fitted dynamic average
NH vector orientations (black
line) both for (a) D23M and (b)
D36M. The fit of inter-nuclear
vector orientations and
determined alignment tensor to
the experimental data is
improved significantly: starting
from Qh i = 0.178 for D23M and
Qh i = 0.193 for D36M on
average, the Q-values decrease
to Qh i = 0.062 for both D23M
and D36M after 4 SCRM-
cycles. (c) and (d) same as (a)
and (b) but for qh i instead of Q-
values. Starting from qh i =
0.977 for D23M and qh i = 0.972
for D36M on average, qh iimproves to qh i = 0.997 after 4
SCRM cycles. (e) and (f): The
inter-nuclear angles jj enclosed
between the dynamic average
NH vector orientations and the
NH vectors of the starting X-ray
structure 1ubi are shown. The
average angular deviation is
6.97� for D23M and 6.87� for
D36M. (g) and (h): Same as for
e and f, but compared to the
1d3z NMR structures. The
average deviation to the NMR
structure is 4.84� for D23M and
4.52� for D36M. Thus, the
agreement between the derived
dynamic average NH vector
orientations and the NMR
structure is significantly better
than for the 1ubi structure
146 J Biomol NMR (2008) 41:139–155
123
robustness of the SCRM approach. The resulting S2rdcðNHÞ
and jj are listed in the supporting information as well, in
Table S3 for D23M and S4 for D36M, compare also Figure
S2c and S2d.
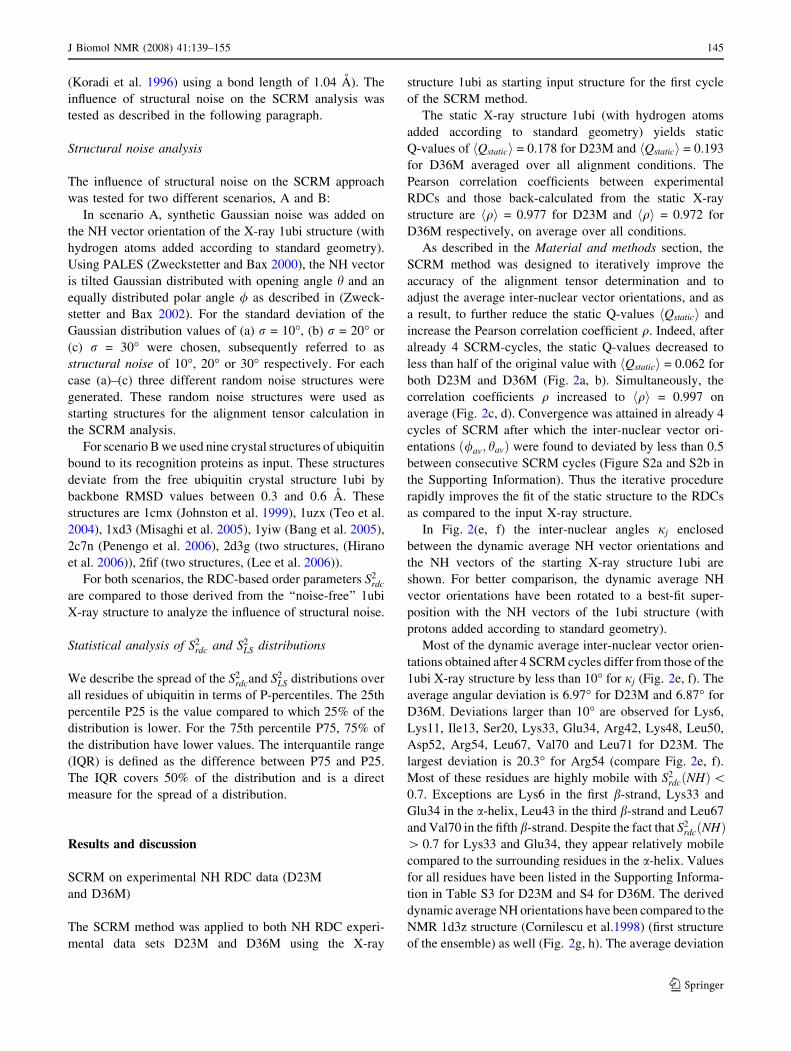
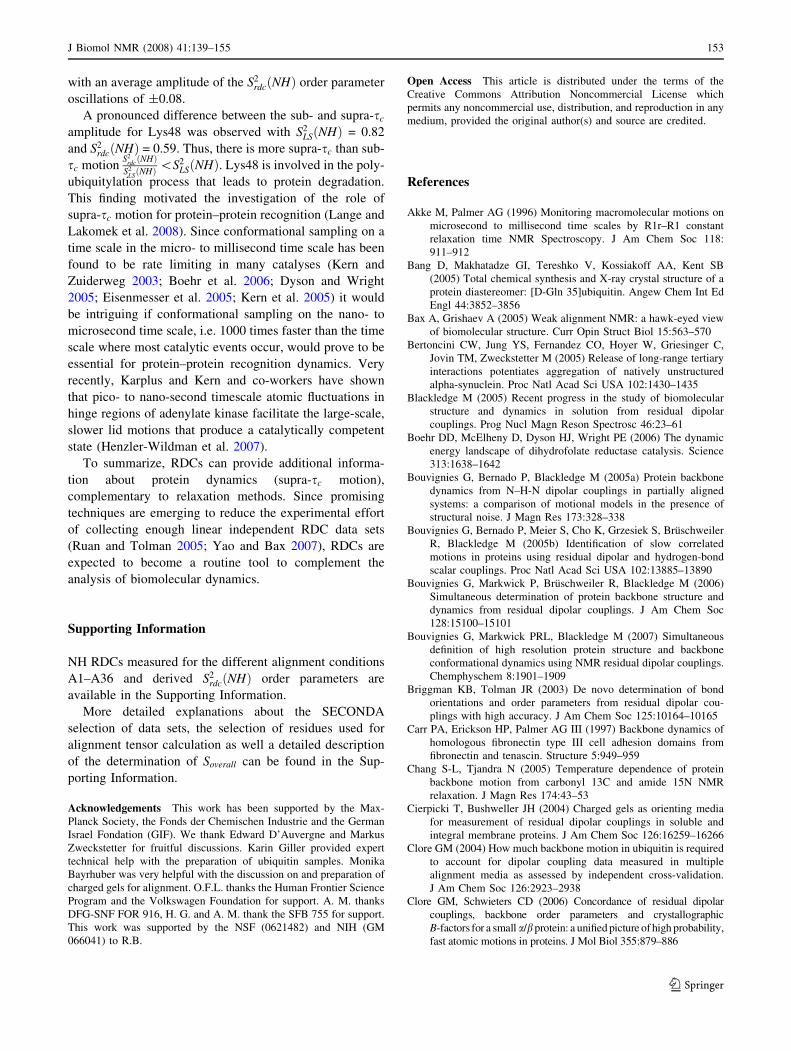
In parallel with the improvement of the static Q-values
Qstatich i and correlation coefficients q, the RDC-based
order parameters S2rdc also converged after 4 cycles of
SCRM (Fig. 3a, b).
A more specific measure of the fit of the SCRM results
to the experimental RDCs are residue-specific RDC-rmsd
values which can be back-calculated from the model-free
derived dynamic averaged second order spherical har-
monics (compare Fig. 3c, d). For D23M, the average RDC-
rmsd was strongly reduced to rmsdðrdc; jÞh i = 0.28 Hz after
four SCRM-cycles compared to rmsdðrdc; jÞh i = 0.52 Hz
for D36M.
To estimate the remaining inhomogeneity in the data,
we added Gaussian noise to the noise-free back-calculated
RDCs until the SECONDA gap reached 6.8, the value
found for D23M (see Supporting Information for details).
That analysis yields an estimated inhomogeneity for the
D23M dataset of 0.22 Hz.
Since it is not expected that removal of only 13 data sets
reduces the RDC-rmsd by almost a factor of 2, this result
indicates that the resulting set D23M is more homoge-
neous, consistent with the SECONDA analysis. As
mentioned above, SECONDA homogeneity is neither
compatible with significant structural changes induced by
the alignment media nor with significant correlation of the
vector fluctuations and the alignment tensor. Thus, for
D23M the error introduced by ignoring a possible corre-
lation between internal protein dynamics and alignment
tensor fluctuation is small. Further, also the use of a single
dynamically average alignment tensor does not seem to
introduce a considerable error. Significant deviations of
rmsdðrdc; jÞ values from the average can mainly be
observed for loop regions indicating a possible correlation
between internal dynamics and alignment tensor
SCRM cycle
2 3 4 5 6 7 8 9 10
0.01
0.02
0.03
0.04
9 102 3 4 5 6 7 8
0.01
0.02
0.04
0.03
SCRM cycle
|S2 rd
c(i)-S
2 rdc(
i-1)|
|S2 rd
c(i)-S
2 rdc(
i-1)|
a) b)
c) d)
10 20 30 40 50 60 70
residue
rdc-
rmsd
0.2
0.4
0.6
0.8 <rdc-rmsd>=0.28 Hz
e) f)
0.04
0.02
0.06
5 10 15 20 25 30 35
Qdy
n
Qdy
n
<Qdyn>= 0.037
00.00
0.08<Qdyn>=0.027
5 10 15 200
0.02
0.04
0.06
0.00
0.08
alignment condition
0.8
0.2
0.4
0.6
10 20 30 40 50 60 70
rdc-
rmsd
<rdc-rmsd>=0.52 Hz
residue
alignment condition
Fig. 3 (a) and (b): The average
difference D of RDC-based
S2rdcðNHÞ order parameter
between subsequent SCRM
cycles for (a) D23M and (b)
D36M is shown:
S2rdc;i � S2
rdc;i�1
¼ 1
n
Pnj¼1
S2rdc;iðNHjÞ � S2
rdc;i�1ðNHjÞ
.
RDC-based order parameters
S2rdc have converged after 4
cycles of SCRM with less than
0.01 difference S2rdc;i � S2
rdc;i�1
between subsequent SCRM
cycles. (c) and (d): Residue-
specific RDC-rmsd values
rmsdðrdc; jÞ are shown for (c)
D23M and (d) D36M after 4
SCRM cycles. For D23M, the
average RDC-rmsd is
rmsdðrdc; jÞh i = 0.28 Hz and
0.52 Hz for D36M. (e) and (f):Dynamic Q-values Qdyn for the
different alignment conditions
are back-calculated, for D23M
the average dynamic Q-value is
Qdyn
� �= 0.027 and for D36M
Qdyn
� �= 0.037
J Biomol NMR (2008) 41:139–155 147
123
fluctuations for these regions, in agreement with (Salvatella
et al. 2008). Possible complications as addressed in (Lou-
hivuori et al. 2007) are thus unlikely for the alignment
conditions in the D23M subset.
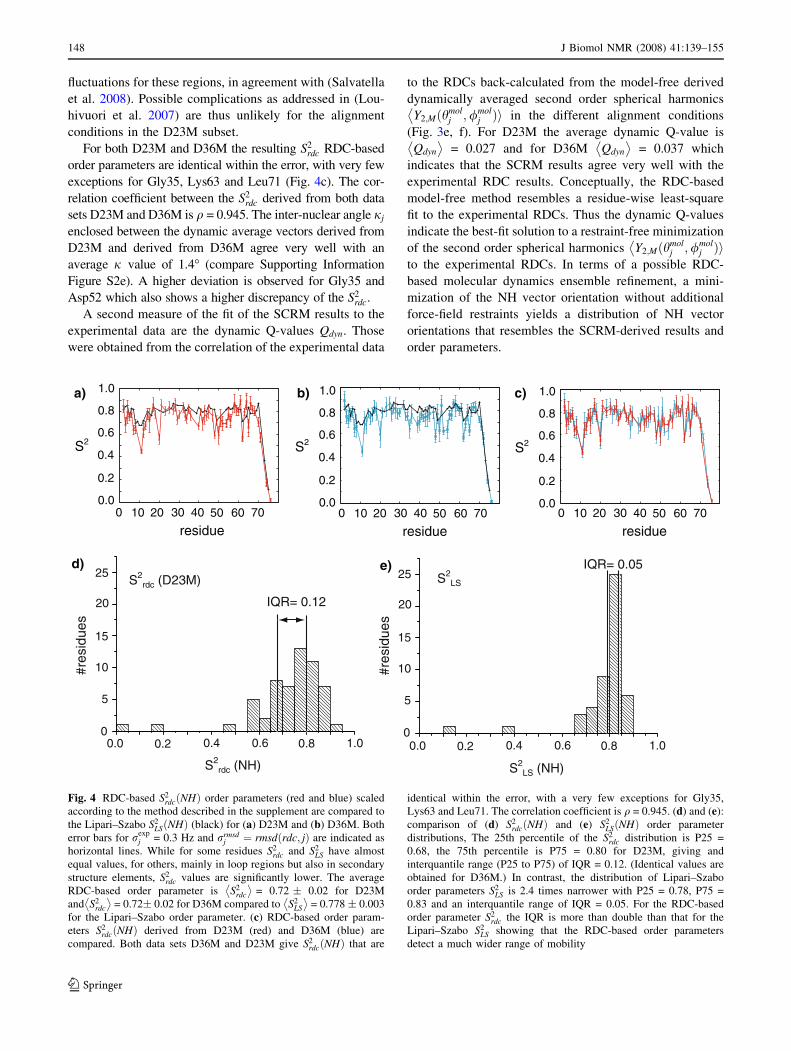
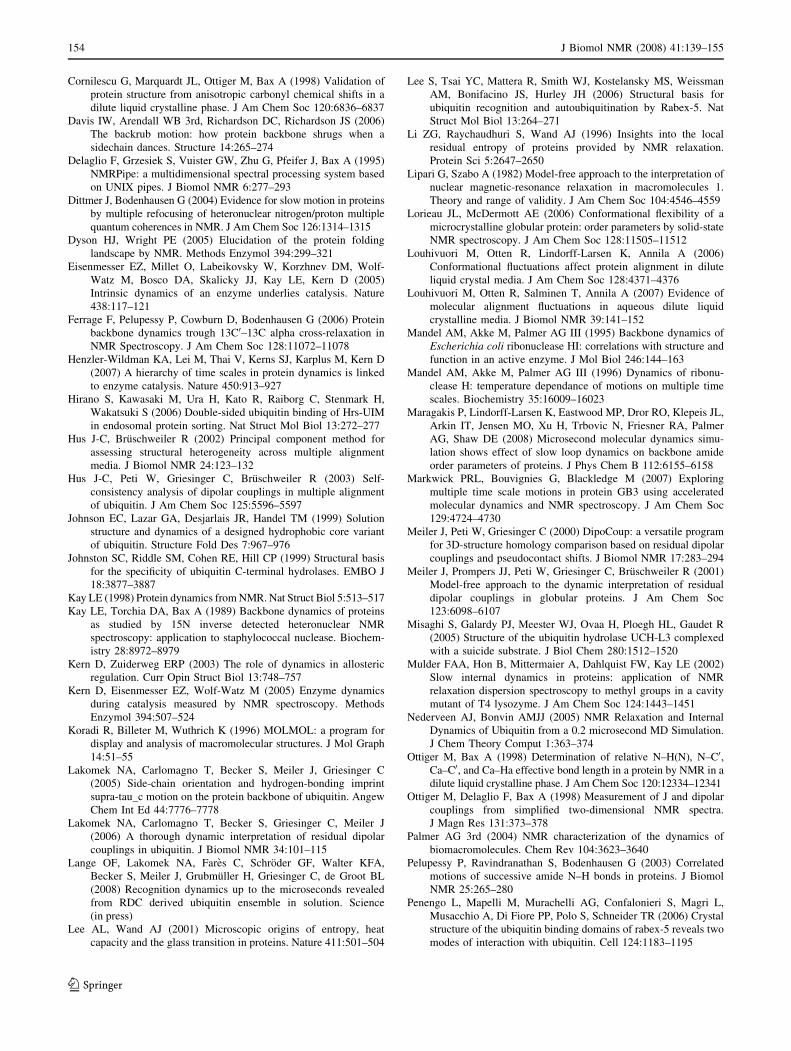
For both D23M and D36M the resulting S2rdc RDC-based
order parameters are identical within the error, with very few
exceptions for Gly35, Lys63 and Leu71 (Fig. 4c). The cor-
relation coefficient between the S2rdc derived from both data
sets D23M and D36M is q = 0.945. The inter-nuclear angle jj
enclosed between the dynamic average vectors derived from
D23M and derived from D36M agree very well with an
average j value of 1.4� (compare Supporting Information
Figure S2e). A higher deviation is observed for Gly35 and
Asp52 which also shows a higher discrepancy of the S2rdc.
A second measure of the fit of the SCRM results to the
experimental data are the dynamic Q-values Qdyn. Those
were obtained from the correlation of the experimental data
to the RDCs back-calculated from the model-free derived
dynamically averaged second order spherical harmonics
Y2;M
�ðhmol
j ;/molj Þi in the different alignment conditions
(Fig. 3e, f). For D23M the average dynamic Q-value is
Qdyn
� �= 0.027 and for D36M Qdyn
� �= 0.037 which
indicates that the SCRM results agree very well with the
experimental RDC results. Conceptually, the RDC-based
model-free method resembles a residue-wise least-square
fit to the experimental RDCs. Thus the dynamic Q-values
indicate the best-fit solution to a restraint-free minimization
of the second order spherical harmonics Y2;M
�ðhmol
j ;/molj Þi
to the experimental RDCs. In terms of a possible RDC-
based molecular dynamics ensemble refinement, a mini-
mization of the NH vector orientation without additional
force-field restraints yields a distribution of NH vector
orientations that resembles the SCRM-derived results and
order parameters.
0 10 20 30 40 50 60 70
0.2
0.4
0.6
0.8
1.0
residue0 10 20 30 40 50 60 70
residue0 10 20 30 40 50 60 70
residue
S2
0.0
0.2
0.4
0.6
0.8
1.0
S2
0.0
0.2
0.4
0.6
0.8
1.0
S2
0.0
IQR= 0.12
0.0 0.2 0.4 0.6 0.8 1.0
5
10
15
20
S2rdc (D23M)
#res
idue
s
S2rdc (NH)
0
25
0.0 0.2 0.4 0.6 0.8 1.0
S2LS (NH)
5
10
15
20
#res
idue
s
0
25IQR= 0.05
S2LS
a)
d) e)
b) c)
Fig. 4 RDC-based S2rdcðNHÞ order parameters (red and blue) scaled
according to the method described in the supplement are compared to
the Lipari–Szabo S2LSðNHÞ (black) for (a) D23M and (b) D36M. Both
error bars for rexpj = 0.3 Hz and rrmsd
j ¼ rmsdðrdc; jÞ are indicated as
horizontal lines. While for some residues S2rdc and S2
LS have almost
equal values, for others, mainly in loop regions but also in secondary
structure elements, S2rdc values are significantly lower. The average
RDC-based order parameter is S2rdc
� �= 0.72 � 0.02 for D23M
and S2rdc
� �= 0.72� 0.02 for D36M compared to S2
LS
� �= 0.778 ± 0.003
for the Lipari–Szabo order parameter. (c) RDC-based order param-
eters S2rdcðNHÞ derived from D23M (red) and D36M (blue) are
compared. Both data sets D36M and D23M give S2rdcðNHÞ that are
identical within the error, with a very few exceptions for Gly35,
Lys63 and Leu71. The correlation coefficient is q = 0.945. (d) and (e):
comparison of (d) S2rdcðNHÞ and (e) S2
LSðNHÞ order parameter
distributions, The 25th percentile of the S2rdc distribution is P25 =
0.68, the 75th percentile is P75 = 0.80 for D23M, giving and
interquantile range (P25 to P75) of IQR = 0.12. (Identical values are
obtained for D36M.) In contrast, the distribution of Lipari–Szabo
order parameters S2LS is 2.4 times narrower with P25 = 0.78, P75 =
0.83 and an interquantile range of IQR = 0.05. For the RDC-based
order parameter S2rdc the IQR is more than double than that for the
Lipari–Szabo S2LS showing that the RDC-based order parameters
detect a much wider range of mobility
148 J Biomol NMR (2008) 41:139–155
123
Determination of Soverall
A rigorous statistical analysis yields that Soverall is smaller
than 0.89 with a confidence level (see Supporting Informa-
tion) of 95% using only the experimental error rexpj of 0.3 Hz.
The confidence level drops to 67% using the total error rrmsdj .
This result is consistent with an independent statistical
analysis based on a hypothesis test (see Supporting Infor-
mation). The Soverall found in this work deviates from our
previous analysis (Soverall = 0.83) (Lakomek et al. 2006)
since now the most mobile NH amide groups have been
excluded from the alignment tensor calculation resulting in a
smaller downscaling of Di;zz caused by isotropic internal
dynamics. Consequently, Soverall is expected to be larger than
the value of 0.83 obtained in the previous analysis (Lakomek
et al. 2006). Note that the average S2rdc
� �= 0.72 are equal in
this and the previous analyses (vide infra).
Analysis of S2rdc order parameter distribution shows
supra-sc motion
In Fig. 4(a, b) the derived NH RDC-based order parameters
S2rdcðNHÞ for D23M and D36M are compared to the Lipari–
Szabo S2LSðNHÞ order parameters. The derived S2
rdcðNHÞorder parameters are listed in the supporting information.
While for some residues S2rdc and S2
LS are very similar, for
others, mainly in loop regions but also in secondary
structure elements, significantly lower S2rdc values are
observed. The average RDC-based order parameter is
S2rdc
� �= 0.72 ± 0.02 for D23M and for D36M compared to
S2LS
� �= 0.778 ± 0.003 for the Lipari–Szabo order param-
eter. The order parameter S2LS
� �is a measure for the
remaining rigidity in the sub-sc window. For the mobility
in that window, 1� S2LS
� �is the appropriate measure.
Similarly, the supra-sc mobility is measured by
1� S2supra�sc
D E¼ 1�
S2rdc
� �
S2LS
� � :
Accordingly, inclusion of the supra-sc window increases
the averaged amplitude of mobility observed in the sub-sc
window by:
supra�sc �mobility
sub�sc �mobility¼
1� S2supra�sc
D E
1� S2sub�sc
D E ¼1� S2
rdch iS2
LSh i1� S2
LS
� �
¼ 34%:
For D23M, N = 57S2rdc order parameters were derived
and N = 62 for D36M. For the S2LS N = 49 S2
LS were
available. The correlation coefficient between S2rdc and S2
LS
is q = 0.45 for D23M (and q = 0.41 for D36M).
For both data sets, S2rdc order parameters show a sig-
nificantly broader spread than those derived from
relaxation, S2LS. With an interquantile range of IQR = 0.12
for D23M (and 0.12 for D36M) compared to IQR = 0.05
for the Lipari–Szabo S2LS order parameters, the distribution
of S2rdc order parameters is 2.4 times wider than for S2
LS
(Fig. 4d, e). In conclusion the RDC-based order parameters
sample additional motion beyond sc. The fact that all S2rdc
must be smaller than the S2LS, together with the much wider
spread of the S2rdc distribution, leads on average to lower
RDC-based order parameters S2rdc.
Supra-sc motion is observed mainly in loop regions like
(7–11, 20, 36–40, 46–47, 50–56, 60–65, 72–76), but also
for several residues in secondary structure elements (2–6,
12–17, 22–35, 41–45, 48–49, 57–59, 66–71). The average
RDC-based order parameter is S2rdc;loop
D E= 0.66 ± 0.04
from D23M and S2rdc;loop
D E= 0.65 ± 0.04 from D36M for
loop regions. These values are about 10% smaller than the
Lipari–Szabo value of S2LS;loop
D E= 0.72 ± 0.04 for the loop
regions. For secondary structure elements the average
RDC-based order-parameter is S2rdc;sec
D E= 0.77 ± 0.01
(both for D23M and D36M) and still about 5% smaller than
the S2LS;sec
D E= 0.81 ± 0.01. The presence of supra-sc
motion in secondary structure elements is emphasized by
comparing the 25th and 75th percentile P25 = 0.72 and P75
= 0.82 of the RDC-based order parameter in secondary
structure elements S2rdc;sec
D Ederived from D23M (P25 =
0.75 and P75 = 0.83 in the case of D36M) to P25 = 0.79
and P75 = 0.85 for the Lipari–Szabo ones S2LS;sec
D E.
Table 2 lists all parameters describing the S2rdc
� �distribu-
tion and the S2LS
� �distribution.
Interestingly, an alternating pattern of S2rdcðNHÞ order
parameters was extracted for residues Lys48 to Leu50 in
the 4th b-strand. The backbone of Lys48, whose side chain
is known to be involved in the poly-ubiquitination process
that leads to protein trafficking and degradation, appears
very mobile with an order parameter of S2rdcðNHÞ = 0.59 ±
0.03 for D23M (S2rdcðNHÞ = 0.58 ± 0.07 for D36M)
compared to S2LSðNHÞ = 0.82 for the Lipari–Szabo value.
Other alternating patterns of S2rdcðNHÞ in b-sheets like
Gln41 to Phe45 that have been described before (Lak-
omek et al. 2005) are reproduced in this analysis for
D23M, however with reduced amplitude. The same
alternating pattern is observed weakly also for Lipari–
Szabo order parameters S2LSðNHÞ (Chang and Tjandra
2005). These findings are consistent with our earlier
analyses (Lakomek et al. 2005), independent findings for
protein G using the 3D-GAF analysis (Bouvignies et al.
2005b) and even earlier results by Palmer and
co-workers for Ribonuclease H (Mandel et al. 1995;
Mandel et al. 1996) and Fibronectin type III (Carr et al.
1997) using relaxation methods. A correlation between
backbone mobility and side-chain orientation has recently
also been extracted from ultra high-resolution X-ray
structures (Davis et al. 2006).
J Biomol NMR (2008) 41:139–155 149
123
Focus on supra-sc motion
To distinguish supra-sc motion from sub-sc motion, the
distribution of S2rdc=S2
LSðNHÞ was analyzed along the amino
acid sequence of ubiquitin (Table 3). For residues with
solvent-exposed side chains, the backbone amide groups
appear more mobile, while residues with side chains
pointing to the hydrophobic core of the protein appear
more rigid in the protein backbone, in agreement with
(Lakomek et al. 2005). The analysis has been applied in the
same way as presented in (Lakomek et al. 2005). A very
simple two-state model has been applied. All residues with
Table 2 Statistics on the RDC-based order parameters S2rdcðNHÞ: (a) derived from D23M; (b) derived from D36M
All S2rdcðNHÞ All S2
LSðNHÞ Sec. Struct. S2rdcðNHÞ Sec. Struct. S2
LSðNHÞ Loops S2rdcðNHÞ Loops S2
LSðNHÞ
(a) Derived from D23M
�h i 0.72 ± 0.02 0.778 ± 0.003 0.77 ± 0.01 0.81 ± 0.01 0.66 ± 0.04 0.72 ± 0.04
P25 0.68 0.78 0.72 0.79 0.59 0.69
P75 0.80 0.83 0.82 0.85 0.77 0.82
IQR 0.12 0.05 0.10 0.05 0.18 0.13
N 57 49 34 31 23 18
(b) Derived from D36M
�h i 0.72 ± 0.02 0.778 ± 0.003 0.77 ± 0.01 0.81 ± 0.01 0.65 ± 0.04 0.72 ± 0.04
P25 0.68 0.78 0.75 0.79 0.61 0.69
P75 0.80 0.83 0.83 0.85 0.78 0.82
IQR 0.12 0.05 0.08 0.05 0.17 0.13
N 62 49 37 31 25 18
The average values, the 25th and 75th percentile as well as the interquantile range IQR and the number of analysed residues N are shown and
compared to the data from relaxation S2LSðNHÞ. The 1st and 2nd column show the values for the complete distribution, in the 3rd and 4th columns
and the 5th and 6th columns we distinguish between secondary structure elements and loop regions
The percentile values reveal a much wider distribution of S2rdcðNHÞ order parameter than for the S2
LSðNHÞ. This effect is most visible for loop
regions but also for secondary structure elements
(b): The same statistics as in (a) but for S2rdcðNHÞ derived from D36M
Table 3 Statistics on the RDC-based order parameters S2rdc=S2
LSðNHÞ: (a) derived from D23M; (b) derived from D36M which describe the supra-
sc contribution to mobility
S2rdc=S2
LSðNHÞ Core(i) Solvent(i) 0 hb 1 hb 2 hb
(a) Derived from D23M
S2rdc=S2
LSðNHÞ� �
0.93 ± 0.03 0.90 ± 0.02 0.81 ± 0.05 0.92 ± 0.02 0.92 ± 0.02
P25 0.87 0.81 0.78 0.87 0.85
P75 1.00 0.97 0.85 1.00 0.98
IQR 0.13 0.16 0.07 0.13 0.13
N 10 28 5 22 11
(b) Derived from D36M
S2rdc=S2
LSðNHÞ� �
0.93 ± 0.02 0.90 ± 0.02 0.82 ± 0.04 0.92 ± 0.02 0.93 ± 0.02
P25 0.92 0.81 0.78 0.92 0.91
P75 1.00 1.00 0.87 1.00 1.00
IQR 0.08 0.19 0.09 0.08 0.09
N 11 31 6 23 13
The average values, the 25th and 75th percentile as well as the interquantile range IQR and the number of analyzed residues N are shown. The 1st
and 2nd column distinguish between residues with solvent-exposed side chains and those pointing towards the hydrophobic core
The average S2rdc=S2
LSðNHÞ reveals a slight tendency for core residues to be more rigid. 25% of the S2rdc=S2
LSðNHÞ distribution are lower than the
25th percentile which is P25 = 0.81 for the class of solvent-exposed residues and P25 = 0.87 for the core residues in the case of D23M. This
reveals a tendency for residues with solvent exposed side-chains to be more mobile in the protein backbone (Lakomek et al. 2005). The
dependence of S2rdc=S2
LSðNHÞ values on the number of hydrogen bonds the residue is involved in is analyzed columns 3 to 5. Peptide planes that
are not involved in a hydrogen bond (hb0) appear more mobile than those that are hydrogen-bonded
(b): The same statistics as in (a) but for S2rdc=S2
LSðNHÞ derived from D36M
150 J Biomol NMR (2008) 41:139–155
123
a solvent accessibility less than 11.5% were considered as
core residues, all others as solvent-exposed. Solvent
accessibility has been calculated using MOLMOL (Koradi
et al. 1996). The average S2rdc=S2
LSðNHÞ value is 0.90 ±
0.02 for solvent-exposed residues and 0.93 ± 0.03 for core
residues in the case of D23M (and 0.90 ± 0.02 and 0.93 ±
0.02 for D36M) which reveals a tendency of core residues
to be more rigid. The 25th percentile is P25 = 0.81 for the
class of solvent-exposed residues and P25 = 0.87 for the
core residues for D23M (and P25 = 0.81 and P25 = 0.92 for
D36M). This indicates a tendency for residues with solvent
exposed side-chains to be more mobile in the protein
backbone than those with side chains pointing towards the
hydrophobic core (Lakomek et al. 2005).
The dependence of S2rdc=S2
LSðNHÞ values on the number
of hydrogen bonds on the corresponding peptide plane
(including the amino group NH(i) and the preceding car-
bonyl group CO(i-1)) is analyzed in the same way as in
(Lakomek et al. 2005). Peptide planes that are not involved
in a hydrogen bond appear more mobile than those that are
hydrogen-bonded: The average RDC-based order parame-
ter is S2rdc=S2
LSðNHÞ = 0.81 ± 0.05 for D23M (0.82 ± 0.05
for D36M) when the peptide plane is not involved in
hydrogen bonds, compared to 0.92 ± 0.02 (D23M and
D36M) when the peptide plane is involved in at least one
hydrogen bond. For details, see Table 3.
Comparison to previous analyses
The correlation coefficient between the S2rdcðNHÞ derived in
this analysis and the previous one (Lakomek et al. 2006) is
q = 0.80 for D23M and q = 0.82 for D36M. Both analyses
yield an average S2rdc
� �of 0.72, which underlines the
presence of motion beyond the overall tumbling correlation
time sc. These results also highlight that it is important to
remove the possible bias introduced by the structure used
for the tensor calculation. In the previous analysis (Lak-
omek et al. 2006) some outliers were present, for which
S2rdcðNHÞ order parameters were larger than the corre-
sponding Lipari–Szabo ones S2LSðNHÞ. These were Leu8,
Asp32, Gln49 and Ser57. In the SCRM analysis these
residues show S2rdcðNHÞ values lower than the corre-
sponding S2LSðNHÞ and are less conspicuous. These
previous outliers are attributed to the influence of structural
noise. As described in the next paragraph, the new SCRM
method can efficiently avoid such outliers.
SCRM analysis is robust against the influence
of structural noise
For synthetic structural noise added to the starting structure
for the SCRM analysis (see M&M scenario A), the
resulting S2rdcðNHÞ order parameters (using D36M) after 4
SCRM cycles are in excellent agreement with those
obtained using the noise-free structure 1ubi), both for 10�and 20� Gaussian noise, as seen in Fig. 5(a, b). Even for
30� structural noise the agreement is reasonably good (see
Fig. 5c).
The SCRM approach has been tested on nine different
input structures that deviate considerably from the free
ubiquitin crystal (see Materials and methods case B).
While the original model-free approach (Lakomek et al.
2006) is affected by structural differences of the input
structures used for tensor calculation (Fig. 5d, e), the new
SCRM method alleviates the effect of structural noise
(Fig. 5f, g). After only 4 SCRM cycles the S2rdcðNHÞ order
parameters of the nine different test cases have converged
and agree very well with those for the free form 1ubi
(Fig. 5c, d). The standard deviation of S2rdcðNHÞ order
parameters is r = 0.033 for the original RDC-based model-
free approach applied on D23M (r = 0.039 for D36M) and
r = 0.010 after 4 SCRM cycles applied on D23M (r =
0.006 for D36M). This illustrates nicely that the SCRM
method is able to accurately determine alignment tensors
and inter-nuclear vector orientations almost independently
from the quality of the starting structure (within a certain
range). This is an important prerequisite for reliable
quantification of macromolecular dynamics. We are cur-
rently exploring how strongly the initial structure can
deviate from the final structure to still obtain a converged,
correct structure. Already now, it would be possible to
derive an initial structure using the DIDC approach (Tol-
man 2002) or a recent extension of this approach (Yao
et al. 2008). In a second step the SCRM approach could
then be applied.
Conclusions
A Self-Consistent RDC-based Model-free (SCRM)
approach has been developed based on the RDC-based
model-free approach as implemented in (Lakomek et al.
2005, 2006). It differs from the previous approach in that it
reduces the influence of the details of the structure used for
the tensor calculation from the RDCs. Therefore, it makes
the model-free analysis robust against the influence of
structural noise.
SCRM was applied on two NH RDC data set collections,
D36M and D23M. For both NH RDC data collections, the
new SCRM approach gives almost identical S2rdcðNHÞ order
parameters (correlation factor of 0.945). According to
SECONDA analysis D23M increases homogeneity of the
RDC data with still adequate sampling of alignment tensor
orientations in the 5-dimensional tensor-space.
For D23M we conclude that there are neither significant
structural changes induced by the alignment media nor
J Biomol NMR (2008) 41:139–155 151
123
significant correlations of the vector fluctuations and the
alignment tensors. A possible correlation between align-
ment tensor fluctuations and internal dynamics, which has
been proposed as a possible source of error by (Louhivuori
et al. 2006, 2007), is therefore likely to be small. This
finding is also in agreement with theoretical predictions
(Salvatella et al. 2008).
We have shown in this work, that the influence of
structural noise on the alignment tensor determination and
finally the resulting S2rdcðNHÞ order parameter can be
alleviated by the SCRM method. We have added synthetic
structural noise to the 1ubi X-ray structure and have used
different structures of ubiquitin from several complexes
used as input for the SCRM analysis. The resulting order
parameters were found to agree within 0.01 irrespective of
the starting structure.
Consistent with the previous analysis, the inclusion of
the supra-sc window increases the averaged amplitude of
mobility observed in the sub-sc window by about 34%.
These additional motions on a time scale slower than the
correlation time sc occur mainly within loop regions but
also within secondary structure elements.
Alternating mobility patterns on the S2rdcðNHÞ order
parameters in b-sheets were extracted, in agreement with
the previous analysis. For the 4th b-strand from Lys48 to
Leu50 an alternating pattern of S2rdcðNHÞ was extracted
0.4
0.5
0.6
0.7
0.8
0.9
1
residue
S2rdc S2
rdc S2rdc
S2rdc
S2rdc
S2rdc
S2rdc
0.4
0.5
0.6
0.7
0.8
0.9
1
0.4
0.5
0.6
0.7
0.8
0.9
1
0 10 20 30 40 50 60 70
0.6
0.8
1.0
residues
1.2
0.4
0.6
0.8
1.0
1.2
0.40 10 20 30 40 50 60 70
residues
1.0
0.8
0.6
0.40 10 20 30 40 50 60 70
0 10 20 30 40 50
residue
0 10 20 30 40 50 60 70
residue
0 10 20 30 40 50 60 7060 70
residues1.0
0.8
0.6
0.40 10 20 30 40 50 60 70
residues
a)
d)
g)
e)
f)
b) c)
Fig. 5 SCRM-derived S2rdcðNHÞ after addition of (a) 10� (b) 20� and
(c) 30� synthetic structural noise on the 1ubi X-ray structure used as
starting structure for alignment tensor calculation. The agreement
between the calculated S2rdcðNHÞ and those derived using the noise-
free structure (black) shows that SCRM is robust against the influence
of structural noise. (d) and (e): S2rdcðNHÞ order parameter are derived
for d) D23M and e) D36M using the original RDC-based model-free
analysis and nine different structures of ubiquitin bound in several
complexes as starting structure for the analysis. The different
structures have a backbone rmsd between 0.3 and 0.6 A to the free
Xray structure 1ubi (Ramage et al. 1994) (black line) and serve as a
test case for severe structural noise. (f) and (g): S2rdcðNHÞ order
parameter are derived for (f) D23M and (g) D36M using the new
SCRM method and the same nine different structures of ubiquitin
(free X-ray structure 1ubi black line). While the original model-free
approach (Lakomek et al. 2005) is affected by structural difference of
the input structure used for tensor calculation, the new SCRM method
alleviates the effect of structural noise
152 J Biomol NMR (2008) 41:139–155
123
with an average amplitude of the S2rdcðNHÞ order parameter
oscillations of ±0.08.
A pronounced difference between the sub- and supra-sc
amplitude for Lys48 was observed with S2LSðNHÞ = 0.82
and S2rdcðNHÞ = 0.59. Thus, there is more supra-sc than sub-
sc motionS2
rdcðNHÞS2
LSðNHÞ\S2
LSðNHÞ. Lys48 is involved in the poly-
ubiquitylation process that leads to protein degradation.
This finding motivated the investigation of the role of
supra-sc motion for protein–protein recognition (Lange and
Lakomek et al. 2008). Since conformational sampling on a
time scale in the micro- to millisecond time scale has been
found to be rate limiting in many catalyses (Kern and
Zuiderweg 2003; Boehr et al. 2006; Dyson and Wright
2005; Eisenmesser et al. 2005; Kern et al. 2005) it would
be intriguing if conformational sampling on the nano- to
microsecond time scale, i.e. 1000 times faster than the time
scale where most catalytic events occur, would prove to be
essential for protein–protein recognition dynamics. Very
recently, Karplus and Kern and co-workers have shown
that pico- to nano-second timescale atomic fluctuations in
hinge regions of adenylate kinase facilitate the large-scale,
slower lid motions that produce a catalytically competent
state (Henzler-Wildman et al. 2007).
To summarize, RDCs can provide additional informa-
tion about protein dynamics (supra-sc motion),
complementary to relaxation methods. Since promising
techniques are emerging to reduce the experimental effort
of collecting enough linear independent RDC data sets
(Ruan and Tolman 2005; Yao and Bax 2007), RDCs are
expected to become a routine tool to complement the
analysis of biomolecular dynamics.
Supporting Information
NH RDCs measured for the different alignment conditions
A1–A36 and derived S2rdcðNHÞ order parameters are
available in the Supporting Information.
More detailed explanations about the SECONDA
selection of data sets, the selection of residues used for
alignment tensor calculation as well a detailed description
of the determination of Soverall can be found in the Sup-
porting Information.
Acknowledgements This work has been supported by the Max-
Planck Society, the Fonds der Chemischen Industrie and the German
Israel Fondation (GIF). We thank Edward D’Auvergne and Markus
Zweckstetter for fruitful discussions. Karin Giller provided expert
technical help with the preparation of ubiquitin samples. Monika
Bayrhuber was very helpful with the discussion on and preparation of
charged gels for alignment. O.F.L. thanks the Human Frontier Science
Program and the Volkswagen Foundation for support. A. M. thanks
DFG-SNF FOR 916, H. G. and A. M. thank the SFB 755 for support.
This work was supported by the NSF (0621482) and NIH (GM
066041) to R.B.
Open Access This article is distributed under the terms of the
Creative Commons Attribution Noncommercial License which
permits any noncommercial use, distribution, and reproduction in any
medium, provided the original author(s) and source are credited.
References
Akke M, Palmer AG (1996) Monitoring macromolecular motions on
microsecond to millisecond time scales by R1r–R1 constant
relaxation time NMR Spectroscopy. J Am Chem Soc 118:
911–912
Bang D, Makhatadze GI, Tereshko V, Kossiakoff AA, Kent SB
(2005) Total chemical synthesis and X-ray crystal structure of a
protein diastereomer: [D-Gln 35]ubiquitin. Angew Chem Int Ed
Engl 44:3852–3856
Bax A, Grishaev A (2005) Weak alignment NMR: a hawk-eyed view
of biomolecular structure. Curr Opin Struct Biol 15:563–570
Bertoncini CW, Jung YS, Fernandez CO, Hoyer W, Griesinger C,
Jovin TM, Zweckstetter M (2005) Release of long-range tertiary
interactions potentiates aggregation of natively unstructured
alpha-synuclein. Proc Natl Acad Sci USA 102:1430–1435
Blackledge M (2005) Recent progress in the study of biomolecular
structure and dynamics in solution from residual dipolar
couplings. Prog Nucl Magn Reson Spectrosc 46:23–61
Boehr DD, McElheny D, Dyson HJ, Wright PE (2006) The dynamic
energy landscape of dihydrofolate reductase catalysis. Science
313:1638–1642
Bouvignies G, Bernado P, Blackledge M (2005a) Protein backbone
dynamics from N–H-N dipolar couplings in partially aligned
systems: a comparison of motional models in the presence of
structural noise. J Magn Res 173:328–338
Bouvignies G, Bernado P, Meier S, Cho K, Grzesiek S, Bruschweiler
R, Blackledge M (2005b) Identification of slow correlated
motions in proteins using residual dipolar and hydrogen-bond
scalar couplings. Proc Natl Acad Sci USA 102:13885–13890
Bouvignies G, Markwick P, Bruschweiler R, Blackledge M (2006)
Simultaneous determination of protein backbone structure and
dynamics from residual dipolar couplings. J Am Chem Soc
128:15100–15101
Bouvignies G, Markwick PRL, Blackledge M (2007) Simultaneous
definition of high resolution protein structure and backbone
conformational dynamics using NMR residual dipolar couplings.
Chemphyschem 8:1901–1909
Briggman KB, Tolman JR (2003) De novo determination of bond
orientations and order parameters from residual dipolar cou-
plings with high accuracy. J Am Chem Soc 125:10164–10165
Carr PA, Erickson HP, Palmer AG III (1997) Backbone dynamics of
homologous fibronectin type III cell adhesion domains from
fibronectin and tenascin. Structure 5:949–959
Chang S-L, Tjandra N (2005) Temperature dependence of protein
backbone motion from carbonyl 13C and amide 15N NMR
relaxation. J Magn Res 174:43–53
Cierpicki T, Bushweller JH (2004) Charged gels as orienting media
for measurement of residual dipolar couplings in soluble and
integral membrane proteins. J Am Chem Soc 126:16259–16266
Clore GM (2004) How much backbone motion in ubiquitin is required
to account for dipolar coupling data measured in multiple
alignment media as assessed by independent cross-validation.
J Am Chem Soc 126:2923–2938
Clore GM, Schwieters CD (2006) Concordance of residual dipolar
couplings, backbone order parameters and crystallographic
B-factors for a small a/bprotein: a unified picture of high probability,
fast atomic motions in proteins. J Mol Biol 355:879–886
J Biomol NMR (2008) 41:139–155 153
123
Cornilescu G, Marquardt JL, Ottiger M, Bax A (1998) Validation of
protein structure from anisotropic carbonyl chemical shifts in a
dilute liquid crystalline phase. J Am Chem Soc 120:6836–6837
Davis IW, Arendall WB 3rd, Richardson DC, Richardson JS (2006)
The backrub motion: how protein backbone shrugs when a
sidechain dances. Structure 14:265–274
Delaglio F, Grzesiek S, Vuister GW, Zhu G, Pfeifer J, Bax A (1995)
NMRPipe: a multidimensional spectral processing system based
on UNIX pipes. J Biomol NMR 6:277–293
Dittmer J, Bodenhausen G (2004) Evidence for slow motion in proteins
by multiple refocusing of heteronuclear nitrogen/proton multiple
quantum coherences in NMR. J Am Chem Soc 126:1314–1315
Dyson HJ, Wright PE (2005) Elucidation of the protein folding
landscape by NMR. Methods Enzymol 394:299–321
Eisenmesser EZ, Millet O, Labeikovsky W, Korzhnev DM, Wolf-
Watz M, Bosco DA, Skalicky JJ, Kay LE, Kern D (2005)
Intrinsic dynamics of an enzyme underlies catalysis. Nature
438:117–121
Ferrage F, Pelupessy P, Cowburn D, Bodenhausen G (2006) Protein
backbone dynamics trough 13C0–13C alpha cross-relaxation in
NMR Spectroscopy. J Am Chem Soc 128:11072–11078
Henzler-Wildman KA, Lei M, Thai V, Kerns SJ, Karplus M, Kern D
(2007) A hierarchy of time scales in protein dynamics is linked
to enzyme catalysis. Nature 450:913–927
Hirano S, Kawasaki M, Ura H, Kato R, Raiborg C, Stenmark H,
Wakatsuki S (2006) Double-sided ubiquitin binding of Hrs-UIM
in endosomal protein sorting. Nat Struct Mol Biol 13:272–277
Hus J-C, Bruschweiler R (2002) Principal component method for
assessing structural heterogeneity across multiple alignment
media. J Biomol NMR 24:123–132
Hus J-C, Peti W, Griesinger C, Bruschweiler R (2003) Self-
consistency analysis of dipolar couplings in multiple alignment
of ubiquitin. J Am Chem Soc 125:5596–5597
Johnson EC, Lazar GA, Desjarlais JR, Handel TM (1999) Solution
structure and dynamics of a designed hydrophobic core variant
of ubiquitin. Structure Fold Des 7:967–976
Johnston SC, Riddle SM, Cohen RE, Hill CP (1999) Structural basis
for the specificity of ubiquitin C-terminal hydrolases. EMBO J
18:3877–3887
Kay LE (1998) Protein dynamics from NMR. Nat Struct Biol 5:513–517
Kay LE, Torchia DA, Bax A (1989) Backbone dynamics of proteins
as studied by 15N inverse detected heteronuclear NMR
spectroscopy: application to staphylococcal nuclease. Biochem-
istry 28:8972–8979
Kern D, Zuiderweg ERP (2003) The role of dynamics in allosteric
regulation. Curr Opin Struct Biol 13:748–757
Kern D, Eisenmesser EZ, Wolf-Watz M (2005) Enzyme dynamics
during catalysis measured by NMR spectroscopy. Methods
Enzymol 394:507–524
Koradi R, Billeter M, Wuthrich K (1996) MOLMOL: a program for
display and analysis of macromolecular structures. J Mol Graph
14:51–55
Lakomek NA, Carlomagno T, Becker S, Meiler J, Griesinger C
(2005) Side-chain orientation and hydrogen-bonding imprint
supra-tau_c motion on the protein backbone of ubiquitin. Angew
Chem Int Ed 44:7776–7778
Lakomek NA, Carlomagno T, Becker S, Griesinger C, Meiler J
(2006) A thorough dynamic interpretation of residual dipolar
couplings in ubiquitin. J Biomol NMR 34:101–115
Lange OF, Lakomek NA, Fares C, Schroder GF, Walter KFA,
Becker S, Meiler J, Grubmuller H, Griesinger C, de Groot BL
(2008) Recognition dynamics up to the microseconds revealed
from RDC derived ubiquitin ensemble in solution. Science
(in press)
Lee AL, Wand AJ (2001) Microscopic origins of entropy, heat
capacity and the glass transition in proteins. Nature 411:501–504
Lee S, Tsai YC, Mattera R, Smith WJ, Kostelansky MS, Weissman
AM, Bonifacino JS, Hurley JH (2006) Structural basis for
ubiquitin recognition and autoubiquitination by Rabex-5. Nat
Struct Mol Biol 13:264–271
Li ZG, Raychaudhuri S, Wand AJ (1996) Insights into the local
residual entropy of proteins provided by NMR relaxation.
Protein Sci 5:2647–2650
Lipari G, Szabo A (1982) Model-free approach to the interpretation of
nuclear magnetic-resonance relaxation in macromolecules 1.
Theory and range of validity. J Am Chem Soc 104:4546–4559
Lorieau JL, McDermott AE (2006) Conformational flexibility of a
microcrystalline globular protein: order parameters by solid-state
NMR spectroscopy. J Am Chem Soc 128:11505–11512
Louhivuori M, Otten R, Lindorff-Larsen K, Annila A (2006)
Conformational fluctuations affect protein alignment in dilute
liquid crystal media. J Am Chem Soc 128:4371–4376
Louhivuori M, Otten R, Salminen T, Annila A (2007) Evidence of
molecular alignment fluctuations in aqueous dilute liquid
crystalline media. J Biomol NMR 39:141–152
Mandel AM, Akke M, Palmer AG III (1995) Backbone dynamics of
Escherichia coli ribonuclease HI: correlations with structure and
function in an active enzyme. J Mol Biol 246:144–163
Mandel AM, Akke M, Palmer AG III (1996) Dynamics of ribonu-
clease H: temperature dependance of motions on multiple time
scales. Biochemistry 35:16009–16023
Maragakis P, Lindorff-Larsen K, Eastwood MP, Dror RO, Klepeis JL,
Arkin IT, Jensen MO, Xu H, Trbovic N, Friesner RA, Palmer
AG, Shaw DE (2008) Microsecond molecular dynamics simu-
lation shows effect of slow loop dynamics on backbone amide
order parameters of proteins. J Phys Chem B 112:6155–6158
Markwick PRL, Bouvignies G, Blackledge M (2007) Exploring
multiple time scale motions in protein GB3 using accelerated
molecular dynamics and NMR spectroscopy. J Am Chem Soc
129:4724–4730
Meiler J, Peti W, Griesinger C (2000) DipoCoup: a versatile program
for 3D-structure homology comparison based on residual dipolar
couplings and pseudocontact shifts. J Biomol NMR 17:283–294
Meiler J, Prompers JJ, Peti W, Griesinger C, Bruschweiler R (2001)
Model-free approach to the dynamic interpretation of residual
dipolar couplings in globular proteins. J Am Chem Soc
123:6098–6107
Misaghi S, Galardy PJ, Meester WJ, Ovaa H, Ploegh HL, Gaudet R
(2005) Structure of the ubiquitin hydrolase UCH-L3 complexed
with a suicide substrate. J Biol Chem 280:1512–1520
Mulder FAA, Hon B, Mittermaier A, Dahlquist FW, Kay LE (2002)
Slow internal dynamics in proteins: application of NMR
relaxation dispersion spectroscopy to methyl groups in a cavity
mutant of T4 lysozyme. J Am Chem Soc 124:1443–1451
Nederveen AJ, Bonvin AMJJ (2005) NMR Relaxation and Internal
Dynamics of Ubiquitin from a 0.2 microsecond MD Simulation.
J Chem Theory Comput 1:363–374
Ottiger M, Bax A (1998) Determination of relative N–H(N), N–C0,Ca–C0, and Ca–Ha effective bond length in a protein by NMR in a
dilute liquid crystalline phase. J Am Chem Soc 120:12334–12341
Ottiger M, Delaglio F, Bax A (1998) Measurement of J and dipolar
couplings from simplified two-dimensional NMR spectra.
J Magn Res 131:373–378
Palmer AG 3rd (2004) NMR characterization of the dynamics of
biomacromolecules. Chem Rev 104:3623–3640
Pelupessy P, Ravindranathan S, Bodenhausen G (2003) Correlated
motions of successive amide N–H bonds in proteins. J Biomol
NMR 25:265–280
Penengo L, Mapelli M, Murachelli AG, Confalonieri S, Magri L,
Musacchio A, Di Fiore PP, Polo S, Schneider TR (2006) Crystal
structure of the ubiquitin binding domains of rabex-5 reveals two
modes of interaction with ubiquitin. Cell 124:1183–1195
154 J Biomol NMR (2008) 41:139–155
123
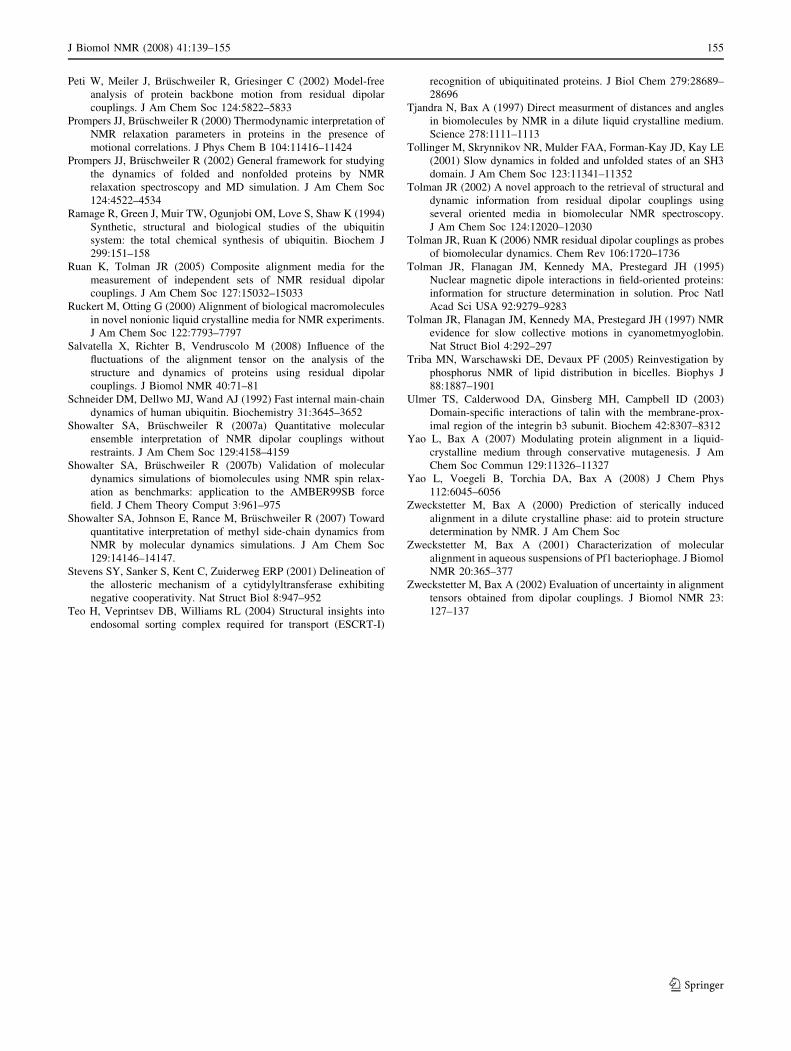
Peti W, Meiler J, Bruschweiler R, Griesinger C (2002) Model-free
analysis of protein backbone motion from residual dipolar
couplings. J Am Chem Soc 124:5822–5833
Prompers JJ, Bruschweiler R (2000) Thermodynamic interpretation of
NMR relaxation parameters in proteins in the presence of
motional correlations. J Phys Chem B 104:11416–11424
Prompers JJ, Bruschweiler R (2002) General framework for studying
the dynamics of folded and nonfolded proteins by NMR
relaxation spectroscopy and MD simulation. J Am Chem Soc
124:4522–4534
Ramage R, Green J, Muir TW, Ogunjobi OM, Love S, Shaw K (1994)
Synthetic, structural and biological studies of the ubiquitin
system: the total chemical synthesis of ubiquitin. Biochem J
299:151–158
Ruan K, Tolman JR (2005) Composite alignment media for the
measurement of independent sets of NMR residual dipolar
couplings. J Am Chem Soc 127:15032–15033
Ruckert M, Otting G (2000) Alignment of biological macromolecules
in novel nonionic liquid crystalline media for NMR experiments.
J Am Chem Soc 122:7793–7797
Salvatella X, Richter B, Vendruscolo M (2008) Influence of the
fluctuations of the alignment tensor on the analysis of the
structure and dynamics of proteins using residual dipolar
couplings. J Biomol NMR 40:71–81
Schneider DM, Dellwo MJ, Wand AJ (1992) Fast internal main-chain
dynamics of human ubiquitin. Biochemistry 31:3645–3652
Showalter SA, Bruschweiler R (2007a) Quantitative molecular
ensemble interpretation of NMR dipolar couplings without
restraints. J Am Chem Soc 129:4158–4159
Showalter SA, Bruschweiler R (2007b) Validation of molecular
dynamics simulations of biomolecules using NMR spin relax-
ation as benchmarks: application to the AMBER99SB force
field. J Chem Theory Comput 3:961–975
Showalter SA, Johnson E, Rance M, Bruschweiler R (2007) Toward
quantitative interpretation of methyl side-chain dynamics from
NMR by molecular dynamics simulations. J Am Chem Soc
129:14146–14147.
Stevens SY, Sanker S, Kent C, Zuiderweg ERP (2001) Delineation of
the allosteric mechanism of a cytidylyltransferase exhibiting
negative cooperativity. Nat Struct Biol 8:947–952
Teo H, Veprintsev DB, Williams RL (2004) Structural insights into
endosomal sorting complex required for transport (ESCRT-I)
recognition of ubiquitinated proteins. J Biol Chem 279:28689–
28696
Tjandra N, Bax A (1997) Direct measurment of distances and angles
in biomolecules by NMR in a dilute liquid crystalline medium.
Science 278:1111–1113
Tollinger M, Skrynnikov NR, Mulder FAA, Forman-Kay JD, Kay LE
(2001) Slow dynamics in folded and unfolded states of an SH3
domain. J Am Chem Soc 123:11341–11352
Tolman JR (2002) A novel approach to the retrieval of structural and
dynamic information from residual dipolar couplings using
several oriented media in biomolecular NMR spectroscopy.
J Am Chem Soc 124:12020–12030
Tolman JR, Ruan K (2006) NMR residual dipolar couplings as probes
of biomolecular dynamics. Chem Rev 106:1720–1736
Tolman JR, Flanagan JM, Kennedy MA, Prestegard JH (1995)
Nuclear magnetic dipole interactions in field-oriented proteins:
information for structure determination in solution. Proc Natl
Acad Sci USA 92:9279–9283
Tolman JR, Flanagan JM, Kennedy MA, Prestegard JH (1997) NMR
evidence for slow collective motions in cyanometmyoglobin.
Nat Struct Biol 4:292–297
Triba MN, Warschawski DE, Devaux PF (2005) Reinvestigation by
phosphorus NMR of lipid distribution in bicelles. Biophys J
88:1887–1901
Ulmer TS, Calderwood DA, Ginsberg MH, Campbell ID (2003)
Domain-specific interactions of talin with the membrane-prox-
imal region of the integrin b3 subunit. Biochem 42:8307–8312
Yao L, Bax A (2007) Modulating protein alignment in a liquid-
crystalline medium through conservative mutagenesis. J Am
Chem Soc Commun 129:11326–11327
Yao L, Voegeli B, Torchia DA, Bax A (2008) J Chem Phys
112:6045–6056
Zweckstetter M, Bax A (2000) Prediction of sterically induced
alignment in a dilute crystalline phase: aid to protein structure
determination by NMR. J Am Chem Soc
Zweckstetter M, Bax A (2001) Characterization of molecular
alignment in aqueous suspensions of Pf1 bacteriophage. J Biomol
NMR 20:365–377
Zweckstetter M, Bax A (2002) Evaluation of uncertainty in alignment
tensors obtained from dipolar couplings. J Biomol NMR 23:
127–137
J Biomol NMR (2008) 41:139–155 155
123