self-association of hypericin analyzed by light absorption and fluorescence spectroscopy and...
TRANSCRIPT
Accepted Manuscript
Self-association of hypericin analyzed by light absorption and fluorescencespectroscopy and molecular dynamics simulations
Monika Pietrzak, Maciej Maciejczyk, Mariusz Szabelski, Adam Kasparek,Zbigniew Wieczorek
PII: S0009-2614(14)00236-XDOI: http://dx.doi.org/10.1016/j.cplett.2014.03.076Reference: CPLETT 32067
To appear in: Chemical Physics Letters
Received Date: 29 January 2014Accepted Date: 26 March 2014
Please cite this article as: M. Pietrzak, M. Maciejczyk, M. Szabelski, A. Kasparek, Z. Wieczorek, Self-associationof hypericin analyzed by light absorption and fluorescence spectroscopy and molecular dynamics simulations,Chemical Physics Letters (2014), doi: http://dx.doi.org/10.1016/j.cplett.2014.03.076
This is a PDF file of an unedited manuscript that has been accepted for publication. As a service to our customerswe are providing this early version of the manuscript. The manuscript will undergo copyediting, typesetting, andreview of the resulting proof before it is published in its final form. Please note that during the production processerrors may be discovered which could affect the content, and all legal disclaimers that apply to the journal pertain.
Title
Self-association of hypericin analyzed by light absorption and fluorescence spectroscopy and
molecular dynamics simulations
Authors:
Monika Pietrzak, Maciej Maciejczyk, Mariusz Szabelski, Adam Kasparek and Zbigniew
Wieczorek
1Department of Physics and Biophysics, University of Warmia and Mazury in Olsztyn,
Oczapowskiego 4, 10-719 Olsztyn, Poland;
Corresponding author:
Monika Pietrzak
telephone/fax number: +48 89 523 34 32/+48 089 523 38 61
e-mail: [email protected]
Abstract:
Self-association of hypericin was investigated with absorption and fluorescence spectroscopy
methods. Constants of hypericin association in a 50% aqueous solution of DMSO were
determined in the function of temperature, and absorption spectra of the monomer and
molecules participating in the complex were examined. Changes in enthalpy ∆HӨ and entropy
∆SӨ in the process of hypericin association accounted for -46 kJ⋅mol
-1 and -55 J⋅mol
-1⋅K-1,
respectively. Molecular dynamics simulations methods were applied to determine
conformations of the hypericin complex, and “head-to-head” and “head-to-tail” models of
interaction were proposed. The “head-to-head” conformation turned out to be the most stable
one.
Key words: hypericin, self-association, absorption, fluorescence, molecular dynamics
simulations
Introduction
Hypericin is a natural substance synthesized by plants of the Hypericaceae family. It is
derived in the highest quantities from common St. John’s wort (Hypericum perforatum L.).
Different extracts from St. John’s wort have for years been applied in herbal therapy as
cholagogic and digestion-enhancing agents. Hypericin has also other medical applications. It
is widely used as a natural, herbal anti-depressant which is often offered as an alternative to
synthetic agents (Mennini and Gobbi 2004, Kubin et al. 2005). Hypericin is a photo-
sensitizing substance, susceptible to the action of sunrays, hence avoidance of sharp sun is
recommended while taking hypericin-containing medicines. Hypericin is a potential drug in
photodynamic therapy, however its properties, poor solubility in water in particular, curb its
medical applicability (Skalkos et al. 2006).
Hypericin may affect metabolism of other orally-administered drugs, e.g. cyclosporin, HIV
protease inhibitors, or oral contraceptives, by reducing their therapeutic concentration in
plasma and thus debilitating their efficacy (Henderson et al. 2002). Mechanisms of hypericin
interaction with other molecules have not been entirely explored so far. The characteristic
structure of this compound, i.e. high contribution of condensed rings, predisposes hypericin to
act as an interceptor molecule (Hartman and Shankel 1992). Hypericin molecules have been
shown capable of forming stacking complexes with other flat, aromatic molecules, thereby
decreasing their bioavailability likewise chlorophyllin or resveratrol (Pietrzak et al. 2003,
Pietrzak et al. 2006, Osowski et al. 2010). Studies on the intercepting role of hypericin are,
however, impaired by its poor solubility in water. The presence of water in a solution
facilitates the formation of dimers and, probably, higher aggregates. The higher the water
content in the solution, the greater the self-association of hypericin is (Falk and Meyer 1994).
Many authors (Beshnova and Evstigneev 2007, Evstigneev et al. 2008, Buchelnikov et al.
2012) have postulated that during determining a correlation between the interceptor molecule
and the intercepted molecules consideration should be given to any possible objects formed in
the analyzed system, including dimers and higher order aggregates of both the trapping and
the trapped compound. When discussing heteroassociation of hypericin and other molecules it
is also necessary to take account of the self-association mechanism and to determine
association constants at specified experimental conditions, considering the specific character
of the measuring methods applied.
The methods used in our previous investigations addressing heteroassociation of
chlorophyllin and xanthines with DNA intercalators allowed neglecting the effect of self-
association of these compounds. In the case of hypericin, however, the use of even relatively
low concentrations as enabled by spectroscopic methods, does not justify this negligence.
This manuscript describes a tentative study introducing investigations on the potential
classification of hypericin as an interceptor molecule. For the first time we present the self-
association process of hypericin in water solution containing 50% DMSO. We used
absorbance and emission spectra to calculate the self-association constant. Additional we
perform theoretical simulation to visualize hypericin-hypericin dimer in aqueous solutions of
DMSO by using molecular dynamics methods. Our results indicate that interpretation of
previously published data was not correct e.g. Falk and Meyer (1994) observed the same
changes in absorbance spectra in case of concentration changing of hypericin or DMSO. In
this paper we proved that increasing concentration of hypericin generate hypochromic and
batochromic effects.
Experimental
2.1. Reagents
Hypericin (1,3,4,6,8,13-hexahydroxy-10,11-dimethylphenanthro[1,10,9,8-opqra]perylene-
7,14-dione) (HWI Analytic GmbH, Ruelzheim, Germany), DMSO (dimethyl sulfoxide pure
p.a.) (PPH Polskie Odczynniki Chemiczne, Gliwice, Poland), Tris (Tris-(hydroxymethyl)-
aminomethane) (Fluka Chemie AG, Buchs, Switzerland).
2.2. Solutions
Hypericin was dissolved in pure DMSO. The resultant stock solution was then mixed with 30
mM Tris–HCl buffer (pH 7.4) until reaching solutions with desired concentrations of
hypericin and appropriate percentage content of DMSO.
2.3. Absorption measurements
Measurements of absorption spectra were carried out using a Cary 5000 spectrophotometer
(Varian, Australia). Hypericin absorption spectra were measured in the function of
concentration (in a concentration range of: 1.3×10⁻⁶M – 2.7×10⁻⁵M) and temperature (283 K,
293 K, 303 K, 313 K, 323 K, and 333 K) in solutions with various percentage contents of
DMSO. The measurements were carried out in a 1-cm cuvette, in a wavelength range of 300 –
790 nm.
The self-association constants Ka and the absorption spectra of hypericin in the monomeric
form and in complexes were estimated numerically. Analyses were conducted using a
fragment of spectrum in a wavelength range of 400 – 700 nm. The isodesmic model was
applied for non-linear regression analysis according to Eq. 1.
�(λ, �) = ��() − ��() ��������������
�����
+ ��()� (1)
where A(λ,C) – absorbance at wavelength λ of the measured sample at total concentration of
hypericin C in solution; �() and ��() – the extinction coefficients for the monomeric and
the aggregated hypericin, respectively; and Ka – self-association constants.
2.4. Fluorescence measurement
Fluorescence measurements were carried out using a Cary Eclipse spectrophotometer (Varian
Australia), in 0.4 × 1 cm cuvettes, using excitation wavelength of 570 nm with a 2.5 and 5 nm
excitation and emission spectral width. Concentration and temperature ranges were as in the
absorption measurements.
Fluorescence measurements enabled determining association constants Ka. Fluorescence
intensities at various temperatures were corrected considering the relative quantum yield
achieved based on fluorescence lifetimes. Analyses were carried out using a fragment of
spectrum in a wavelength range of 650 – 660 nm.
2.5. Time-resolved fluorescence
Measurements were performed using Fluo Time 200 (PicoQuanta, Germany). Hypericin
fluorescence lifetimes were measured in solutions with different concentrations of hypericin
and DMSO and at various temperatures. Fluorescence was excited with a 574 nm diode and
observed at 600 nm with a 2 nm excitation and emission spectral width.
2.6. Molecular dynamics simulations
All molecular dynamics simulations were performed with Desmond package as implemented
in the Maestro Suite from Schrödinger. All parameters, including partial charges, of hypericin
were assigned from OPLS2005 force-field (Banks et al. 2005).
Vacuum simulation was performed in the NVT ensemble with 2fs time-step and no cutoffs
applied to electrostatic interactions. The geometry of molecule was optimized by energy
minimization and initial velocities were drawn from Maxwell distribution and the system was
coupled to 300 K thermal bath with Nose-Hoover thermostat (Nose 1984, Hoover 1985).
The following protocol was used for simulations of hypericin dimerization process in a water-
DMSO mixture. Two hypericin molecules were immersed in 37 A cubic box filled with
DMSO molecules. The overlapping DMSO molecules were removed. Then the system was
immersed in 46.6 A cubic box filled with TIP3P water molecules and overlapping water
molecules were removed. The system was heated up and equilibrated with the standard
Desmond Maestro protocol. All simulations were run in NPT ensemble with Nose-Hoover
thermal bath (coupling time 1.0 ps, T=300 K) and Martyna-Tobias-Klein pressure coupling
(coupling time 2.0 ps, p=1 atm). Equations of motion were integrated numerically with
multiple time-step RESPA algorithm (Tuckerman et al. 1992). Bonded and near non-bonded
interactions were computed every 2.0 fs and far non-bonded interactions were integrated
every 6.0 fs. The 9.0 A cutoff was applied to electrostatic interactions and particle-mesh
Ewald summation (Ewald 1921, Darden et al. 1999) was applied for particles placed beyond
this distance. The snapshots were recorded every 4.8 ps. Total length of gas-phase simulation
was 1µs. A single hypericin molecule in a water-DMSO mixture was simulated for 200 ns.
The simulation of hypericin dimerization in a water-+DMSO mixture was 55 ns-long.
Metadynamics method (Laio and Parinello 2002) was applied to two hypericins placed in the
small water+DMSO box in the “head-to-head” conformation. Two collective variables (CV)
were defined as follows: dihedral angle responsible for the relative rotation of molecules
around the axis perpendicular to their contact surface and the distance between two central
carbon atoms of hypericins. The later CV was restricted by the wall-potential placed at 6.5 A,
preventing dissociation of molecules. Gauss kernels of height of 0.03 kcal/mole were dropped
every 0.09 ps. Widths of gauss kernels were 50 for dihedral angle CV and 0.05 A for distance
CV. The simulation was 70ns-long.
Results and discussion
Many works have shown interactions of hypericin with different pharmaceuticals and
therefore the need of their cautious application (Henderson et al. 2002). The analysis of
interactions with biologically-active compounds usually requires water presence in the
solution. Hypericin is insoluble in water, but DMSO appears a good solvent to introduce it
into the water medium. Falk and Mayer (1994) demonstrated that the higher the water content
in the solution, the more aggregated hypericin is, however they did no determine values of
association constants.
Spectroscopic properties of hypericin
At constant temperature, fluorescence extinction was mono-exponential and did not depend
on hypericin concentration (data not shown). Both these facts confirm explicitly that only one
type of object was fluorescing, namely hypericin monomers. Fluorescence intensities are not
proportional to hypericin concentrations but to the concentration of the monomeric form. As
the fluorescence lifetime is proportional to the fluorescence quantum yield (Lakowicz 2006),
it was feasible to determine the relative quantum yield of hypericin (Tab. 1). The measured
fluorescence spectra were corrected considering the determined relative quantum yield and in
this form served to determine association constants Ka, for different temperatures (Tab. 2).
Simultaneously, the fluorescence lifetime was observed to shorten along with measurement
temperature increase, i.e. from 5.84 ns (��� 0.962) at 288 K to 5.18 ns (��
� 0.975) at 333 K,
which is a typical phenomenon for most chromophores. Hypericin emission spectra are two-
banded and constitute a mirror image of monomer absorption spectra. The fluorescence band
at λmax 598 nm strongly overlaps the absorption band at λmax 594 nm, which is the reason
behind reabsorption and internal filter phenomena (Wieczorek et al. 1993). In order to neglect
these effects in association constants determination (Tab. 2), used was made of a short
spectrum fragment at a spectrum edge.
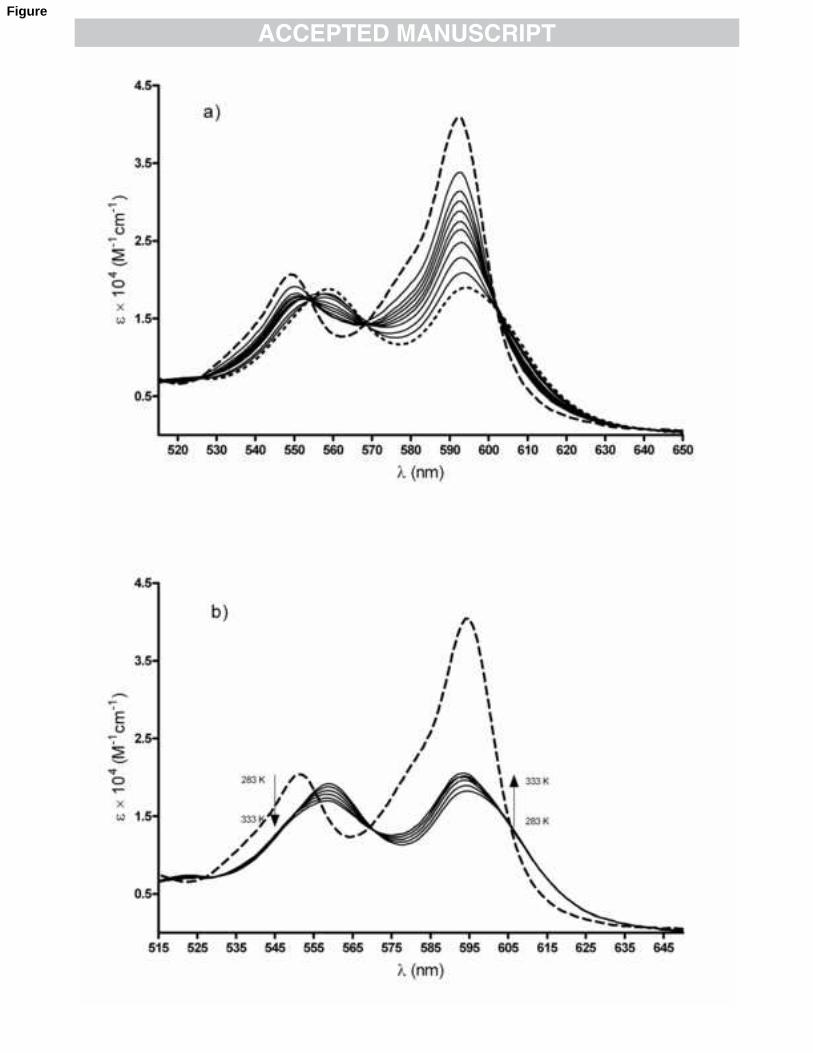
In absorption spectra measured in the function of both DMSO concentration (data not shown)
and hypericin concentration, changes were observed in the intensity of absorption bands, and
especially noticeable isosbestic points were noticed at ca. 554 nm, 569 nm and 602 nm. The
determined molar coefficients of absorption are consistent with literature data (Falk and
Mayer 1994). In absorption spectra we also observed clear batochromic effects (Fig. 1a). This
results indicate that interpretation of previously published data was not correct e.g. Xia et al.
(1998) published that the absorption spectrum of the aggregate was the same as the monomer
except the lower intensity of absorption. Our measurements indicated that the spectrum of
aggregated molecules was shifted to longer wavelength compared to the absorption spectrum
of monomer.
Association constants of hypericin complexes (Tab. 2) were determined with the use of the
Equal K (EK) model which assumes equal association constants in every consecutive step
(Martin 1996). The author recommends this model as the simplest and the most useful one.
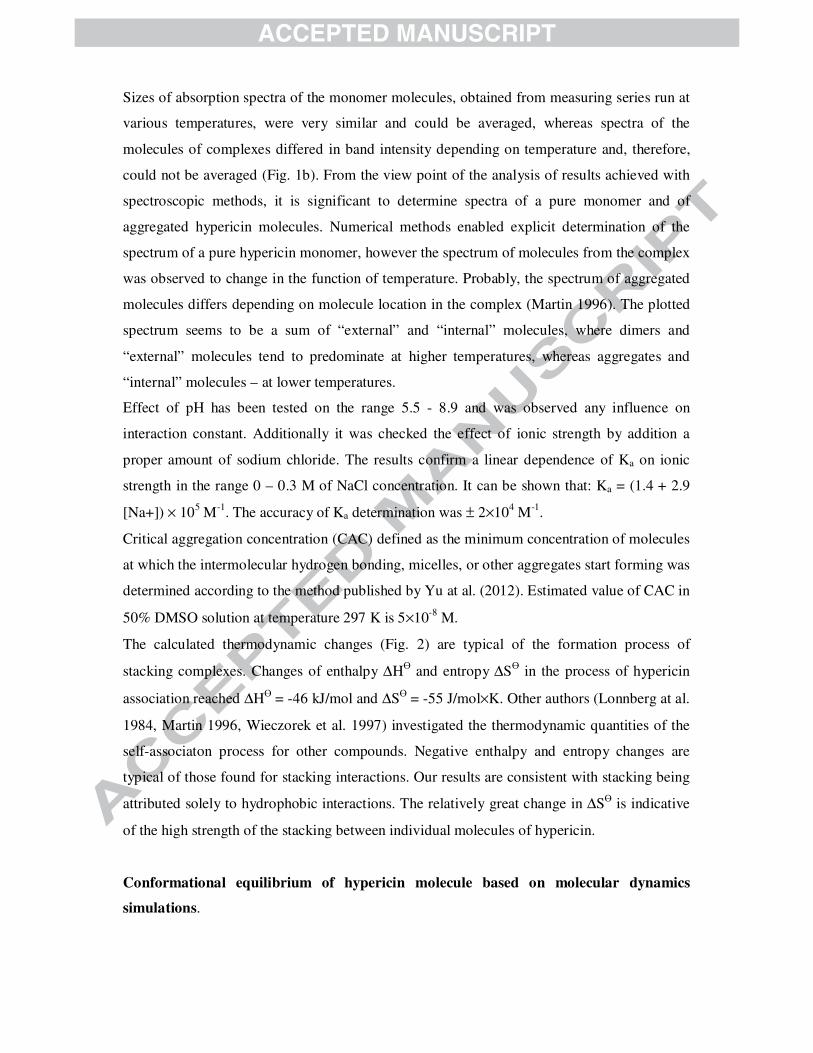
Sizes of absorption spectra of the monomer molecules, obtained from measuring series run at
various temperatures, were very similar and could be averaged, whereas spectra of the
molecules of complexes differed in band intensity depending on temperature and, therefore,
could not be averaged (Fig. 1b). From the view point of the analysis of results achieved with
spectroscopic methods, it is significant to determine spectra of a pure monomer and of
aggregated hypericin molecules. Numerical methods enabled explicit determination of the
spectrum of a pure hypericin monomer, however the spectrum of molecules from the complex
was observed to change in the function of temperature. Probably, the spectrum of aggregated
molecules differs depending on molecule location in the complex (Martin 1996). The plotted
spectrum seems to be a sum of “external” and “internal” molecules, where dimers and
“external” molecules tend to predominate at higher temperatures, whereas aggregates and
“internal” molecules – at lower temperatures.
Effect of pH has been tested on the range 5.5 - 8.9 and was observed any influence on
interaction constant. Additionally it was checked the effect of ionic strength by addition a
proper amount of sodium chloride. The results confirm a linear dependence of Ka on ionic
strength in the range 0 – 0.3 M of NaCl concentration. It can be shown that: Ka = (1.4 + 2.9
[Na+]) × 105 M
-1. The accuracy of Ka determination was ± 2×10
4 M
-1.
Critical aggregation concentration (CAC) defined as the minimum concentration of molecules
at which the intermolecular hydrogen bonding, micelles, or other aggregates start forming was
determined according to the method published by Yu at al. (2012). Estimated value of CAC in
50% DMSO solution at temperature 297 K is 5×10⁻⁸
M.
The calculated thermodynamic changes (Fig. 2) are typical of the formation process of
stacking complexes. Changes of enthalpy ∆HӨ and entropy ∆S
Ө in the process of hypericin
association reached ∆HӨ = -46 kJ/mol and ∆SӨ = -55 J/mol×K. Other authors (Lonnberg at al.
1984, Martin 1996, Wieczorek et al. 1997) investigated the thermodynamic quantities of the
self-associaton process for other compounds. Negative enthalpy and entropy changes are
typical of those found for stacking interactions. Our results are consistent with stacking being
attributed solely to hydrophobic interactions. The relatively great change in ∆SӨ is indicative
of the high strength of the stacking between individual molecules of hypericin.
Conformational equilibrium of hypericin molecule based on molecular dynamics
simulations.
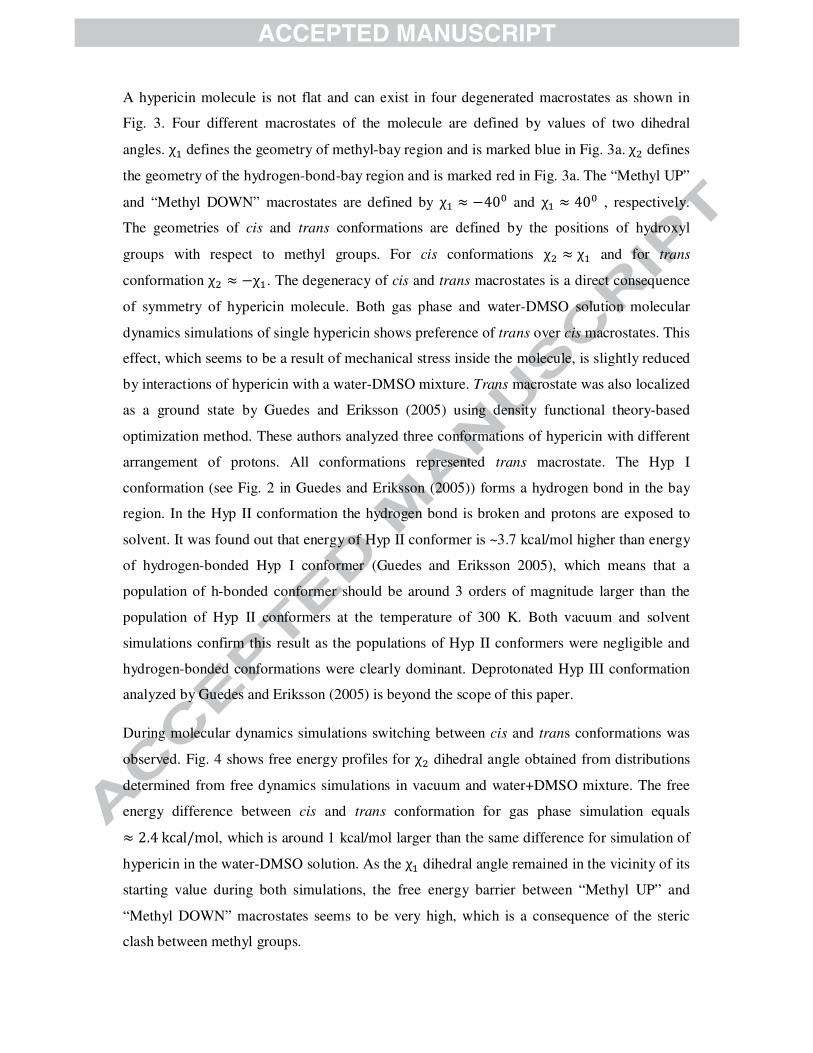
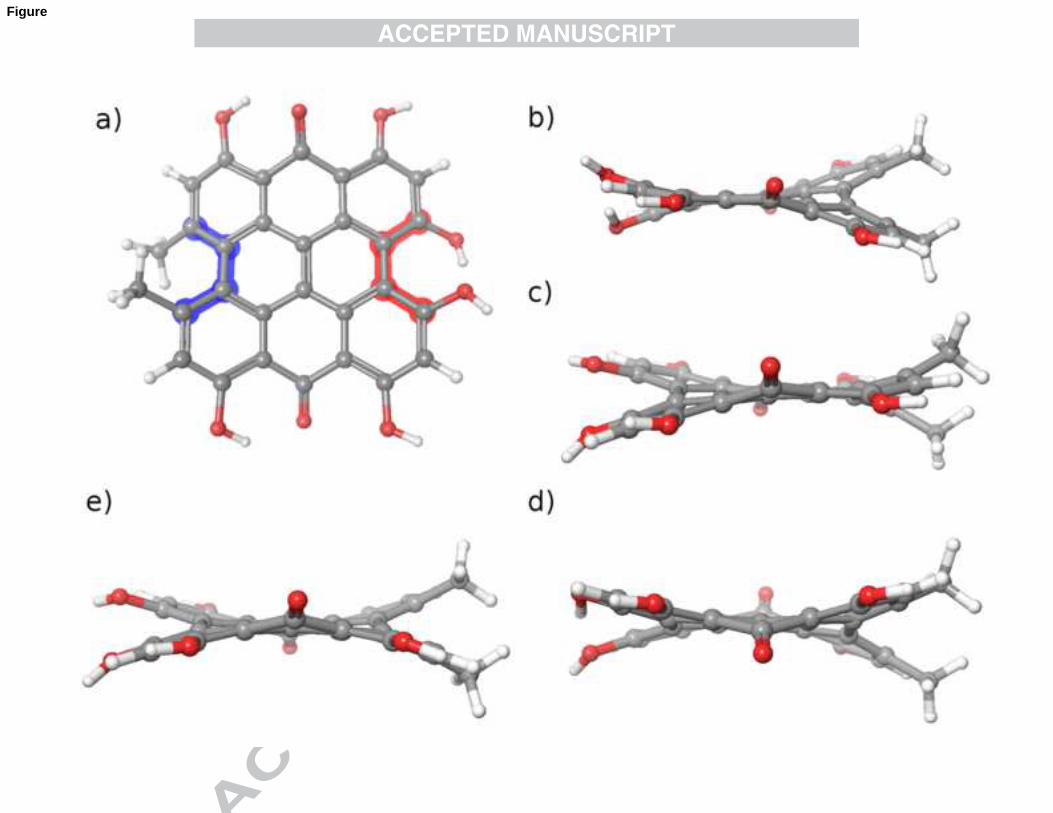
A hypericin molecule is not flat and can exist in four degenerated macrostates as shown in
Fig. 3. Four different macrostates of the molecule are defined by values of two dihedral
angles. χ� defines the geometry of methyl-bay region and is marked blue in Fig. 3a. χ� defines
the geometry of the hydrogen-bond-bay region and is marked red in Fig. 3a. The “Methyl UP”
and “Methyl DOWN” macrostates are defined by χ� ≈ −40! and χ� ≈ 40! , respectively.
The geometries of cis and trans conformations are defined by the positions of hydroxyl
groups with respect to methyl groups. For cis conformations χ� ≈ χ� and for trans
conformation χ� ≈ −χ�. The degeneracy of cis and trans macrostates is a direct consequence
of symmetry of hypericin molecule. Both gas phase and water-DMSO solution molecular
dynamics simulations of single hypericin shows preference of trans over cis macrostates. This
effect, which seems to be a result of mechanical stress inside the molecule, is slightly reduced
by interactions of hypericin with a water-DMSO mixture. Trans macrostate was also localized
as a ground state by Guedes and Eriksson (2005) using density functional theory-based
optimization method. These authors analyzed three conformations of hypericin with different
arrangement of protons. All conformations represented trans macrostate. The Hyp I
conformation (see Fig. 2 in Guedes and Eriksson (2005)) forms a hydrogen bond in the bay
region. In the Hyp II conformation the hydrogen bond is broken and protons are exposed to
solvent. It was found out that energy of Hyp II conformer is ~3.7 kcal/mol higher than energy
of hydrogen-bonded Hyp I conformer (Guedes and Eriksson 2005), which means that a
population of h-bonded conformer should be around 3 orders of magnitude larger than the
population of Hyp II conformers at the temperature of 300 K. Both vacuum and solvent
simulations confirm this result as the populations of Hyp II conformers were negligible and
hydrogen-bonded conformations were clearly dominant. Deprotonated Hyp III conformation
analyzed by Guedes and Eriksson (2005) is beyond the scope of this paper.
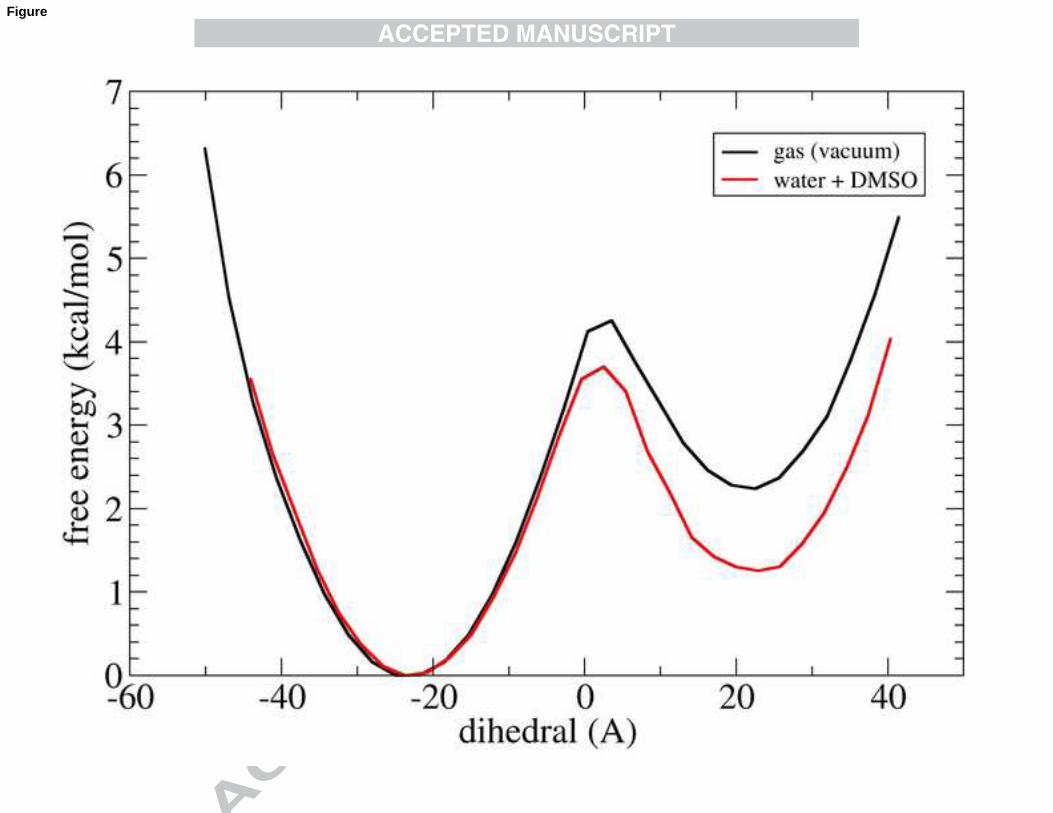
During molecular dynamics simulations switching between cis and trans conformations was
observed. Fig. 4 shows free energy profiles for χ� dihedral angle obtained from distributions
determined from free dynamics simulations in vacuum and water+DMSO mixture. The free
energy difference between cis and trans conformation for gas phase simulation equals
≈ 2.4 kcal/mol, which is around 1 kcal/mol larger than the same difference for simulation of
hypericin in the water-DMSO solution. As the χ� dihedral angle remained in the vicinity of its
starting value during both simulations, the free energy barrier between “Methyl UP” and
“Methyl DOWN” macrostates seems to be very high, which is a consequence of the steric
clash between methyl groups.
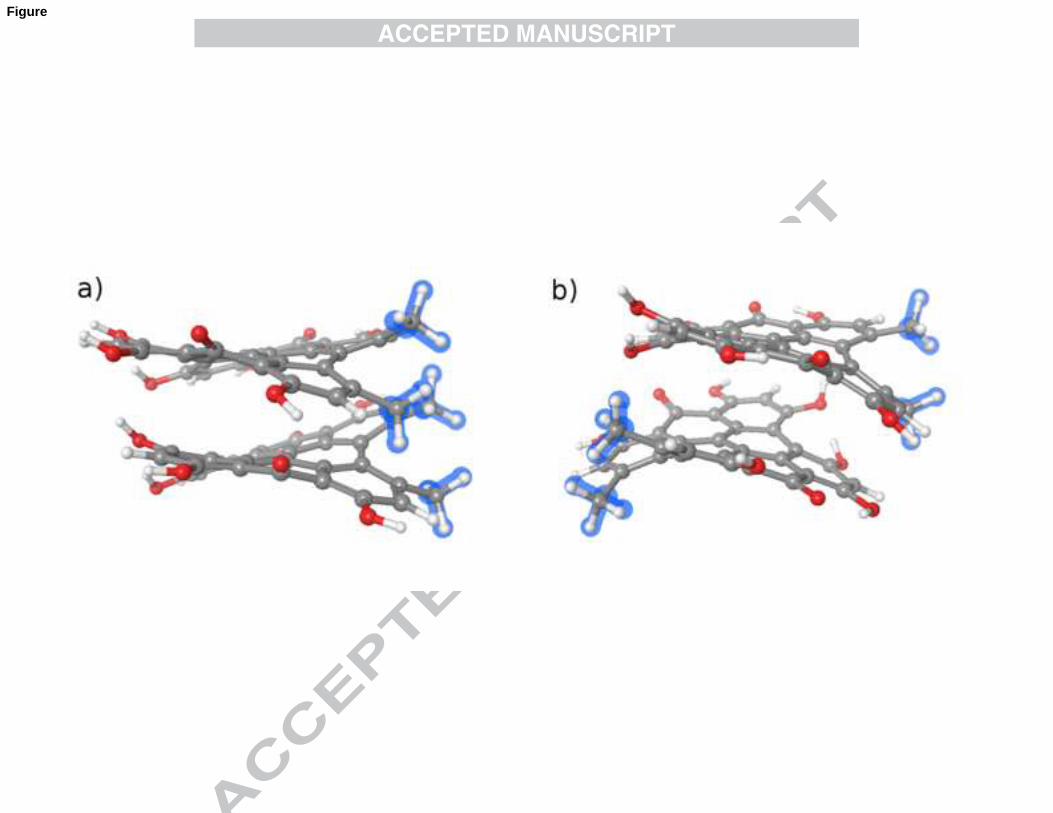
Spatial arrangement of hypericin molecules in a dimmer based on molecular dynamics
simulations.
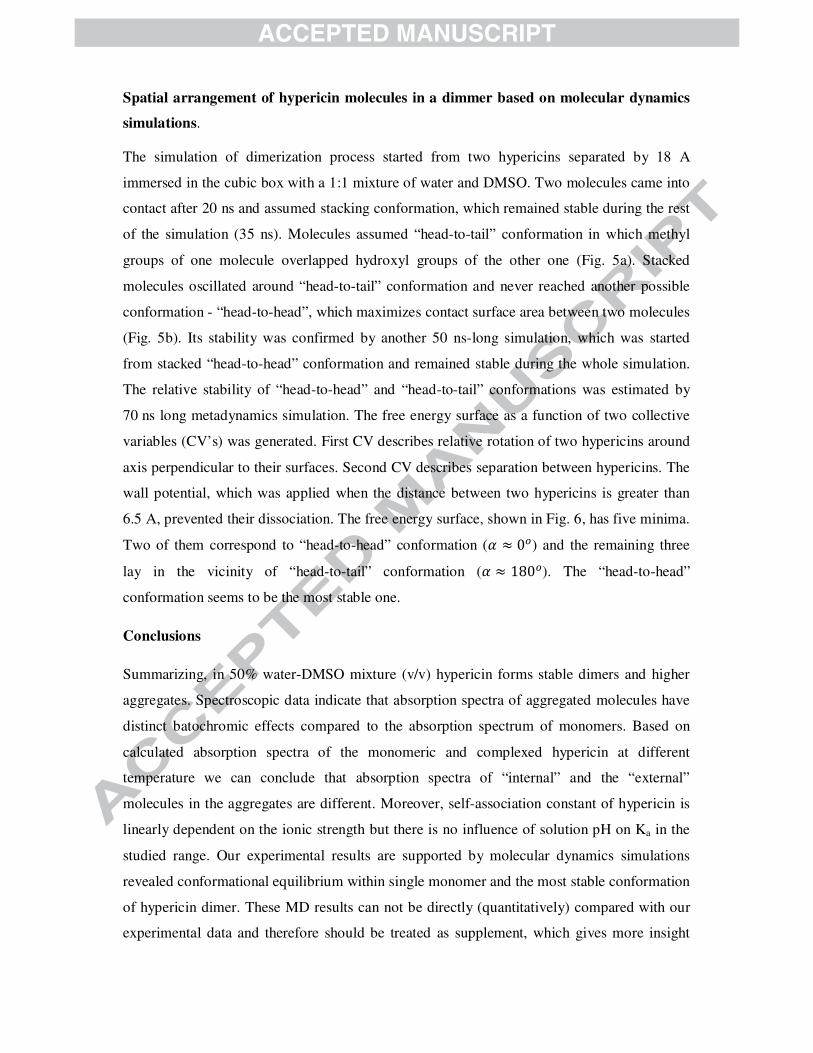
The simulation of dimerization process started from two hypericins separated by 18 A
immersed in the cubic box with a 1:1 mixture of water and DMSO. Two molecules came into
contact after 20 ns and assumed stacking conformation, which remained stable during the rest
of the simulation (35 ns). Molecules assumed “head-to-tail” conformation in which methyl
groups of one molecule overlapped hydroxyl groups of the other one (Fig. 5a). Stacked
molecules oscillated around “head-to-tail” conformation and never reached another possible
conformation - “head-to-head”, which maximizes contact surface area between two molecules
(Fig. 5b). Its stability was confirmed by another 50 ns-long simulation, which was started
from stacked “head-to-head” conformation and remained stable during the whole simulation.
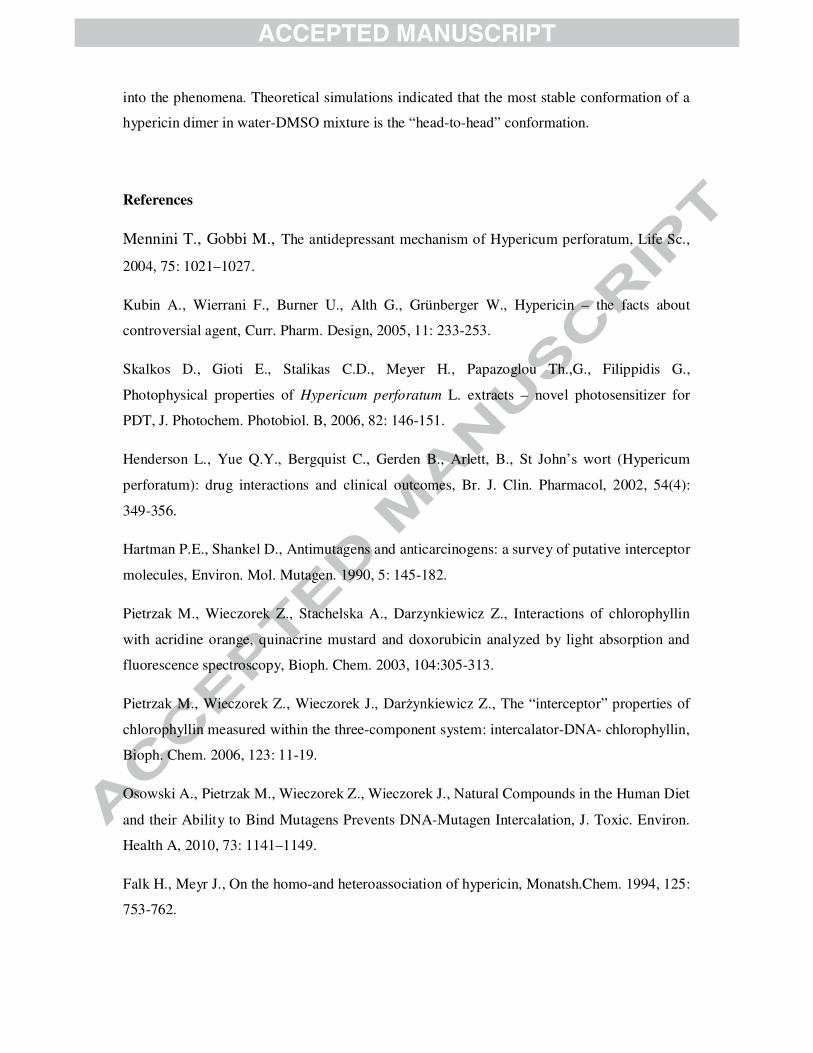
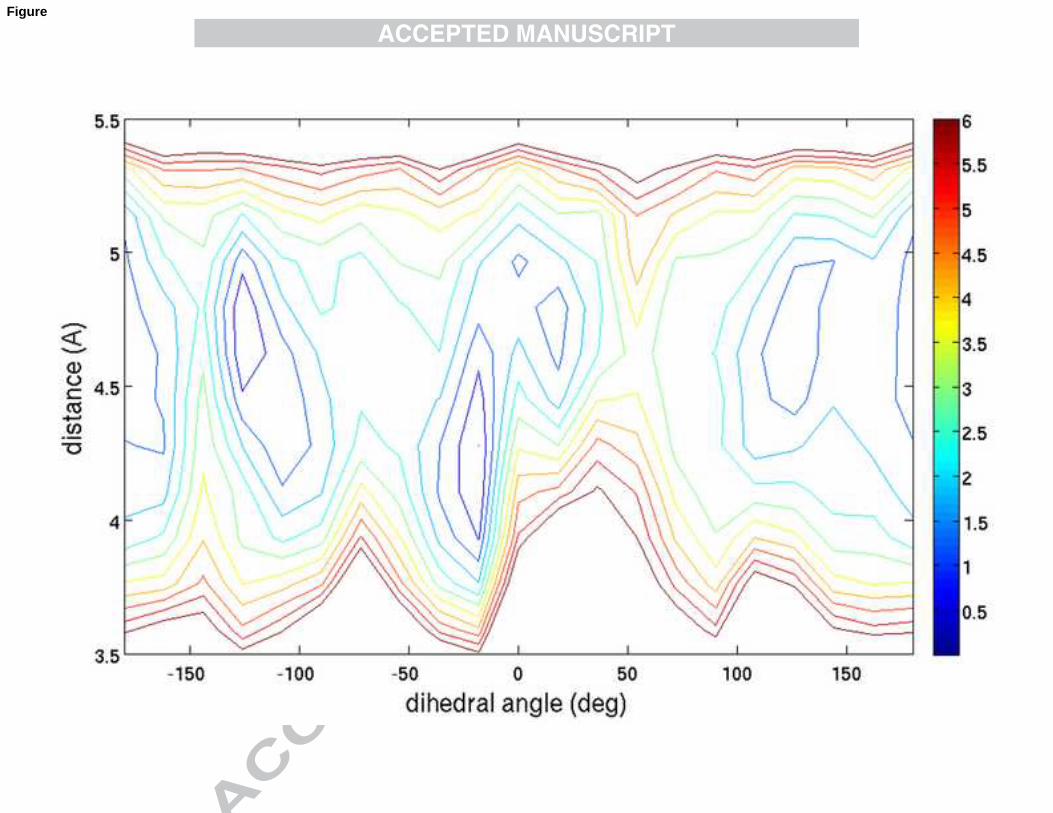
The relative stability of “head-to-head” and “head-to-tail” conformations was estimated by
70 ns long metadynamics simulation. The free energy surface as a function of two collective
variables (CV’s) was generated. First CV describes relative rotation of two hypericins around
axis perpendicular to their surfaces. Second CV describes separation between hypericins. The
wall potential, which was applied when the distance between two hypericins is greater than
6.5 A, prevented their dissociation. The free energy surface, shown in Fig. 6, has five minima.
Two of them correspond to “head-to-head” conformation (+ ≈ 0,) and the remaining three
lay in the vicinity of “head-to-tail” conformation (+ ≈ 180,). The “head-to-head”
conformation seems to be the most stable one.
Conclusions
Summarizing, in 50% water-DMSO mixture (v/v) hypericin forms stable dimers and higher
aggregates. Spectroscopic data indicate that absorption spectra of aggregated molecules have
distinct batochromic effects compared to the absorption spectrum of monomers. Based on
calculated absorption spectra of the monomeric and complexed hypericin at different
temperature we can conclude that absorption spectra of “internal” and the “external”
molecules in the aggregates are different. Moreover, self-association constant of hypericin is
linearly dependent on the ionic strength but there is no influence of solution pH on Ka in the
studied range. Our experimental results are supported by molecular dynamics simulations
revealed conformational equilibrium within single monomer and the most stable conformation
of hypericin dimer. These MD results can not be directly (quantitatively) compared with our
experimental data and therefore should be treated as supplement, which gives more insight
into the phenomena. Theoretical simulations indicated that the most stable conformation of a
hypericin dimer in water-DMSO mixture is the “head-to-head” conformation.
References
Mennini T., Gobbi M., The antidepressant mechanism of Hypericum perforatum, Life Sc.,
2004, 75: 1021–1027.
Kubin A., Wierrani F., Burner U., Alth G., Grünberger W., Hypericin – the facts about
controversial agent, Curr. Pharm. Design, 2005, 11: 233-253.
Skalkos D., Gioti E., Stalikas C.D., Meyer H., Papazoglou Th.,G., Filippidis G.,
Photophysical properties of Hypericum perforatum L. extracts – novel photosensitizer for
PDT, J. Photochem. Photobiol. B, 2006, 82: 146-151.
Henderson L., Yue Q.Y., Bergquist C., Gerden B., Arlett, B., St John’s wort (Hypericum
perforatum): drug interactions and clinical outcomes, Br. J. Clin. Pharmacol, 2002, 54(4):
349-356.
Hartman P.E., Shankel D., Antimutagens and anticarcinogens: a survey of putative interceptor
molecules, Environ. Mol. Mutagen. 1990, 5: 145-182.
Pietrzak M., Wieczorek Z., Stachelska A., Darzynkiewicz Z., Interactions of chlorophyllin
with acridine orange, quinacrine mustard and doxorubicin analyzed by light absorption and
fluorescence spectroscopy, Bioph. Chem. 2003, 104:305-313.
Pietrzak M., Wieczorek Z., Wieczorek J., Darżynkiewicz Z., The “interceptor” properties of
chlorophyllin measured within the three-component system: intercalator-DNA- chlorophyllin,
Bioph. Chem. 2006, 123: 11-19.
Osowski A., Pietrzak M., Wieczorek Z., Wieczorek J., Natural Compounds in the Human Diet
and their Ability to Bind Mutagens Prevents DNA-Mutagen Intercalation, J. Toxic. Environ.
Health A, 2010, 73: 1141–1149.
Falk H., Meyr J., On the homo-and heteroassociation of hypericin, Monatsh.Chem. 1994, 125:
753-762.
Beshnova D.A., Evstigneev M.P., Estimation of the mean number of molecules in association
of aromatic compounds, Rus. J. Phys.Chem. A, 2007, 81 (11): 1888-1890.
Buchelnikov A.S., Hernandez Santiago A.A., Gonzales Flores M., Vazquez Ramirez R.,
Davies B.D., Evstigneev M.P., General analysis of competitive binding in drug-interceptor-
DNA systems, Eur. Biophys. J., 2012, 41: 273-282.
Evstigneev M.P., Lantushenko A.O., Evstigneev V.P., Mykhina Yu. V., Davies D.B.,
Quantitation of the molecular mechanisms of biological synergism in a mixture of DNA-
acting aromatic drugs, Biophys. Chem., 2008, 132: 148-158.
Martin R.B., Comparisons of Indefinite Self-Association Models, Chem. Rev., 1996, 96:
3043-3064.
Pietrzak M., Halicka H.D., Wieczorek Z., Wieczorek J., Darzynkiewicz Z. Attenuation of
acridine mutagen ICR-191 — DNA interactions and DNA damage by the mutagen interceptor
chlorophyllin, Bioph. Chem., 2008,135: 69-75.
Wieczorek Z., Stepinski J., Darzynkiewicz E., Lönnberg H. Association of nucleosides and
their 5’–monophosphates with a tryptophan containing tripeptide, Trp-Leu-Glu by
fluorescence spectroscopy, Biophys. Chem., 1993, 47: 233-240.
Xia G., He X., Zhou Y., Zhang M., Shen T. A study of photoinduced electron transfer and
redox properties of hypericin, J. Photochem. Photobiol A, 1998, 114: 31-35.
Yu D., Huang F., Xu H. Determination of critical concentrations by synchronous fluorescence
spectrometry, Anal. Methods, 2012, 4: 47-49.
Lonnberg H., Ylikosk Y., Vesala A. Effect of alkyl substituents on the thermodynamics of the
self-association of purine in aqueous solution. J. Chem. Soc., Faraday Trans. I , 1984, 80:
2439-2444.
Wieczorek Z., Zdanowski K., Chlebicka L., Stępiński J., Jankowska M., Kierdaszuk B.,
Temeriusz A., Darzynkiewicz E., Stolarski R. Fluorescence and NMR studies of
intramolecular stacking of mRNA cap-analogues, Biochim. Biophys. Acta, 1997, 1354: 145–
152.

Gai F., Fehr M.J., Petrich J.W., Observation of excited-state tautomerization in the antiviral
agent hypericin and identification of its fluorescent species, J. Phys. Chem., 1994, 98: 5784-
5795.
Lakowicz J.R. Principles of fluorescence spectroscopy. Third Edition, Springer 2006.
Banks J.L., Beard H.S., Cao Y., Cho A.E., Damm W., Farid R., Felts A.K., Halgren T.A.,
Mainz D.T., Maple J.R., Murphy R., Philipp D.M., Repasky M.P., Zhang L.Y., Berne B.J.,
Friesner R.A., Gallicchio E., Levy R.M. Integrated Modeling Program, Applied Chemical
Theory (IMPACT), J. Comp. Chem., 2005, 26: 1752-1780.
Darden T., Perera L., Li L., Pedersen, L. New tricks for modelers from the crystallography
toolkit: the particle mesh Ewald algorithm and its use in nucleic acid simulations, Structure,
1999, 7: 55-60.
Ewald P. Die Berechnung optischer und elektrostatischer Gitterpotentiale, Ann. Phys. 1921,
369: 253-287.
Guedes R.C., Eriksson L.A. Theoretical study of hypericin, J. Photochem. Photobiol A, 2005,
127: 293-299.
Hoover W.G. Canonical dynamics: Equilibrium phase-space distributions. Phys. Rev. A,
1985, 31(3): 1695-1697.
Laio A., Parinello M. Escaping free-energy minima, PNAS, 2002, 99(20): 12562-12566.
Nose S. A unified formulation of the constant temperature molecular-dynamics methods, J.
Chem. Phys.,1984, 81(1): 511-519.
Tuckerman M.E., Berne B.J., Martyna G.J. Reversible multiple time scale molecular
dynamics, J. Chem. Phys., 1992, 97: 1990-2001.
Figure captions
Figure 1. a) Apparent molar extinction coefficients of hypericin with a concentration range of
1.3 µM – 27 µM (solid lines) and determined molar extinction coefficients of hypericin
monomer (dashed line) and molecule in a complex (dotted line) at 293 K in 50% DMSO
solution. b) Molar extinction coefficients of hypericin monomer (dashed line) and molecule in
a complex (solid lines) at temperatures of 283 K, 293 K, 303 K, 313 K, 323 K and 333 K in
50% DMSO solution.
Figure 2. Van’t Hoff plot achieved from the analysis of absorption spectra (circles) and
fluorescence (triangles).
Figure 3. Hypericin molecule (a). Dihedral angles related to internal conformational changes
are marked red (hydrogen-bond bay region) and blue (methyl bay region). Four distinct
macrostates of hypericin molecule are: Methyl-UP trans (b), Methyl-DOWN trans (c),
Methyl-DOWN cis (d), and Methyl-UP cis (e).
Figure 4. Two binding modes of hypericin dimer. a) “head-to-head” conformation, b) “head-
to-tail” conformation. Methyl groups are marked blue.
Figure 5. Free energy profiles of �� dihedral angle for gas-phase hypericin (black line) and
hypericin in 50% water – DMSO solution (red line).
Figure 6. Free energy profile of “Methyl UP”-“Methyl UP” hypericin dimer. The deepest
minimum corresponds to “head-to-head” conformation.
Tables captions
Tab.1. Fluorescence lifetimes and relative quantum yields of hypericin determined in 50%
aqueous solution of DMSO.
Tab.2. The self-association constants Ka of the hypericin complexes estimated respectively by
spectrophotometry and spectrofluorometry in 50% DMSO solution.
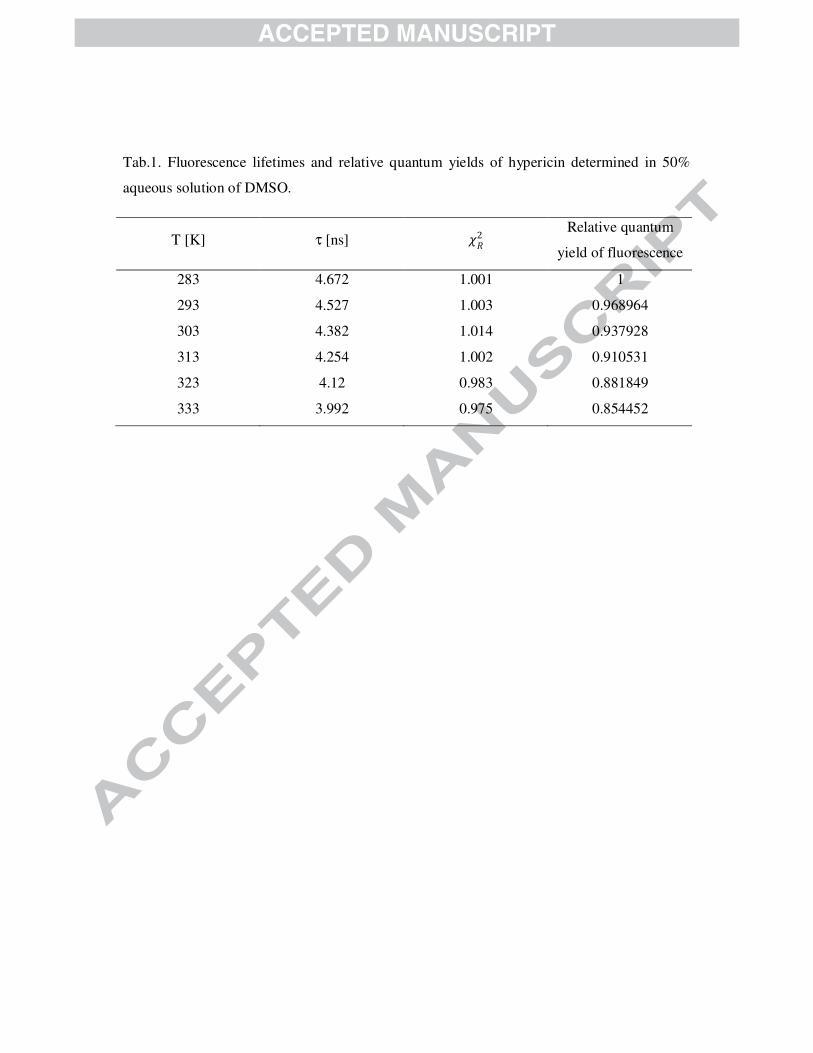
Tab.1. Fluorescence lifetimes and relative quantum yields of hypericin determined in 50%
aqueous solution of DMSO.
T [K] τ [ns] �/2
Relative quantum
yield of fluorescence
283 4.672 1.001 1
293 4.527 1.003 0.968964
303 4.382 1.014 0.937928
313 4.254 1.002 0.910531
323 4.12 0.983 0.881849
333 3.992 0.975 0.854452
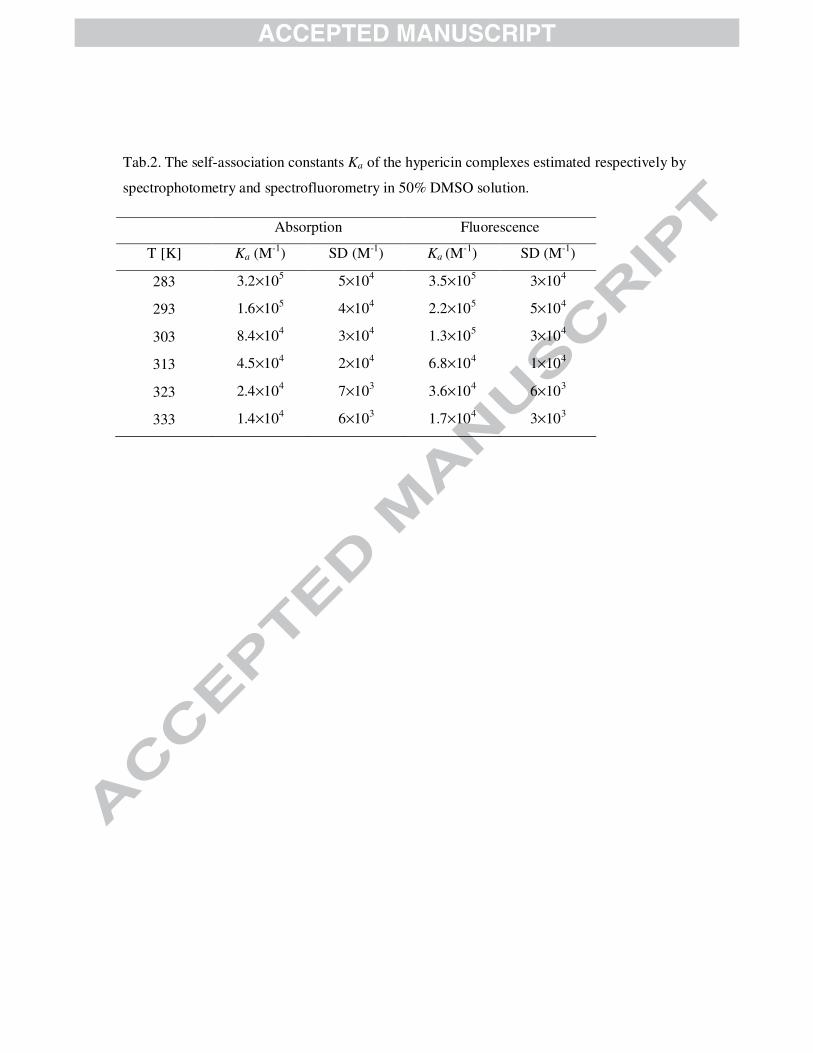
Tab.2. The self-association constants Ka of the hypericin complexes estimated respectively by
spectrophotometry and spectrofluorometry in 50% DMSO solution.
Absorption Fluorescence
T [K] Ka (M-1) SD (M-1) Ka
(M-1) SD (M-1)
283 3.2×10⁵ 5×10
4 3.5×10
5 3×10
4
293 1.6×10⁵ 4×10⁴ 2.2×10⁵ 5×10⁴
303 8.4×10⁴ 3×10
4 1.3×10
5 3×10
4
313 4.5×10⁴ 2×10⁴ 6.8×10⁴ 1×10⁴
323 2.4×10⁴ 7×10
3 3.6×10
4 6×10
3
333 1.4×10⁴ 6×10³ 1.7×10⁴ 3×10³
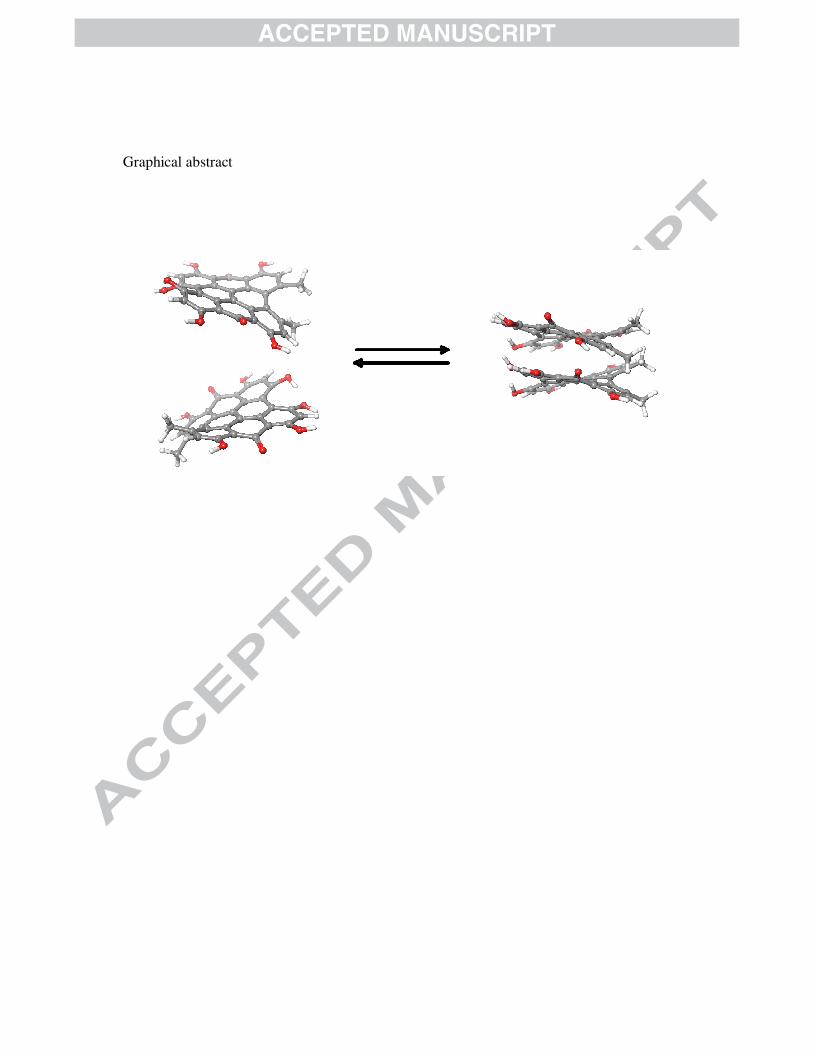
Graphical abstract
Highlights
• Self-association constants of hypericin was determined.
• Changes in enthalpy ∆H and entropy ∆S in the process of hypericin association was
accounted.
• Two models of conformations of the hypericin dimer was proposed.