selection of the mars exploration rover landing sites
TRANSCRIPT
Selection of the Mars Exploration Rover landing sites
M. P. Golombek,1 J. A. Grant,2 T. J. Parker,1 D. M. Kass,1 J. A. Crisp,1 S. W. Squyres,3
A. F. C. Haldemann,1 M. Adler,1 W. J. Lee,1 N. T. Bridges,1 R. E. Arvidson,4 M. H. Carr,5
R. L. Kirk,6 P. C. Knocke,1 R. B. Roncoli,1 C. M. Weitz,7 J. T. Schofield,1 R. W. Zurek,1
P. R. Christensen,8 R. L. Fergason,8 F. S. Anderson,1,9 and J. W. Rice Jr.8
Received 26 February 2003; revised 23 July 2003; accepted 25 August 2003; published 10 December 2003.
[1] The selection of Meridiani Planum and Gusev crater as the Mars Exploration Roverlanding sites took over 2 years, involved broad participation of the science community viafour open workshops, and narrowed an initial �155 potential sites (80–300 � 30 km) tofour finalists based on science and safety. Engineering constraints important to theselection included (1) latitude (10�N–15�S) for maximum solar power, (2) elevation (lessthan �1.3 km) for sufficient atmosphere to slow the lander, (3) low horizontal winds,shear, and turbulence in the last few kilometers to minimize horizontal velocity, (4) low10-m-scale slopes to reduce airbag spin-up and bounce, (5) moderate rock abundanceto reduce abrasion or strokeout of the airbags, and (6) a radar-reflective, load-bearing, andtrafficable surface safe for landing and roving that is not dominated by fine-grained dust.The evaluation of sites utilized existing as well as targeted orbital information acquiredfrom the Mars Global Surveyor and Mars Odyssey. Three of the final four landingsites show strong evidence for surface processes involving water and appear capable ofaddressing the science objectives of the missions, which are to determine the aqueous,climatic, and geologic history of sites on Mars where conditions may have been favorableto the preservation of evidence of possible prebiotic or biotic processes. The evaluation ofscience criteria placed Meridiani and Gusev as the highest-priority sites. The evaluation ofthe three most critical safety criteria (10-m-scale slopes, rocks, and winds) andlanding simulation results indicated that Meridiani and Elysium Planitia are the safestsites, followed by Gusev and Isidis Planitia. INDEX TERMS: 6225 Planetology: Solar System
Objects: Mars; 5470 Planetology: Solid Surface Planets: Surface materials and properties; 5499 Planetology:
Solid Surface Planets: General or miscellaneous; 5409 Planetology: Solid Surface Planets: Atmospheres—
structure and dynamics; 5455 Planetology: Solid Surface Planets: Origin and evolution; KEYWORDS: Mars
Exploration Rover, landing sites, remote sensing, aqueous climatic and geologic histories, Meridiani, Gusev
Citation: Golombek, M. P., et al., Selection of the Mars Exploration Rover landing sites, J. Geophys. Res., 108(E12), 8072,
doi:10.1029/2003JE002074, 2003.
1. Introduction
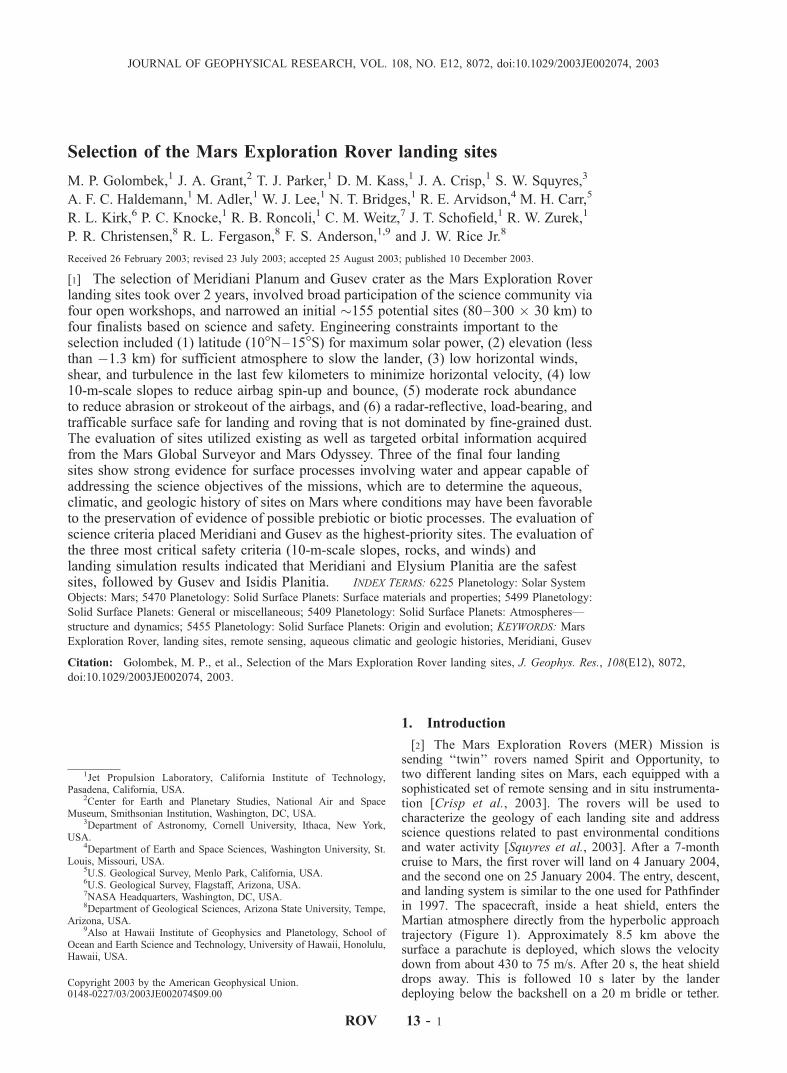
[2] The Mars Exploration Rovers (MER) Mission issending ‘‘twin’’ rovers named Spirit and Opportunity, totwo different landing sites on Mars, each equipped with asophisticated set of remote sensing and in situ instrumenta-tion [Crisp et al., 2003]. The rovers will be used tocharacterize the geology of each landing site and addressscience questions related to past environmental conditionsand water activity [Squyres et al., 2003]. After a 7-monthcruise to Mars, the first rover will land on 4 January 2004,and the second one on 25 January 2004. The entry, descent,and landing system is similar to the one used for Pathfinderin 1997. The spacecraft, inside a heat shield, enters theMartian atmosphere directly from the hyperbolic approachtrajectory (Figure 1). Approximately 8.5 km above thesurface a parachute is deployed, which slows the velocitydown from about 430 to 75 m/s. After 20 s, the heat shielddrops away. This is followed 10 s later by the landerdeploying below the backshell on a 20 m bridle or tether.
JOURNAL OF GEOPHYSICAL RESEARCH, VOL. 108, NO. E12, 8072, doi:10.1029/2003JE002074, 2003
1Jet Propulsion Laboratory, California Institute of Technology,Pasadena, California, USA.
2Center for Earth and Planetary Studies, National Air and SpaceMuseum, Smithsonian Institution, Washington, DC, USA.
3Department of Astronomy, Cornell University, Ithaca, New York,USA.
4Department of Earth and Space Sciences, Washington University, St.Louis, Missouri, USA.
5U.S. Geological Survey, Menlo Park, California, USA.6U.S. Geological Survey, Flagstaff, Arizona, USA.7NASA Headquarters, Washington, DC, USA.8Department of Geological Sciences, Arizona State University, Tempe,
Arizona, USA.9Also at Hawaii Institute of Geophysics and Planetology, School of
Ocean and Earth Science and Technology, University of Hawaii, Honolulu,Hawaii, USA.
Copyright 2003 by the American Geophysical Union.0148-0227/03/2003JE002074$09.00
ROV 13 - 1
A series of descent images are taken and processed todetermine the direction and magnitude of the horizontalvelocity relative to the surface. At about 2.4 km above thesurface, the radar altimeter acquires the ground and triggersinflation of the airbags that surround the lander. Retrorock-ets start firing at about 115 m above the ground to bring thevertical velocity to near zero (at about 15 m). If necessary,transverse rockets on the backshell are also fired to reducehorizontal velocity. The bridle is cut at about 15 m abovethe surface, releasing the airbag landing system, which thenimpacts the surface and bounces many times, likely travel-ing up to a kilometer before coming to rest. The airbags aredeflated and retracted, and the lander petals open so that therover can stand up and drive off. The rover carries its owncomputer and antennas for communication with orbiters anddirectly to Earth. The mobility system is capable of up to40 m drive distance in one Martian day (a Sol), and the totalmission odometry is expected to be at least 600 m. A stereopanoramic camera [Bell et al., 2003] and infrared spectrom-eter [Christensen et al., 2003b] scan the surrounding terrainand sky from a mast height of 1.5 m. A robotic arm carries arock abrasion tool [Gorevan et al., 2003], Mossbauerspectrometer [Klingelhofer et al., 2003], alpha particleX-ray spectrometer [Rieder et al., 2003], and a Microscopicimager [Herkenhoff et al., 2003] for close-up examinationof rocks and soils. The mission lifetime is expected to be atleast 91 Martian sols (93.5 Earth days).[3] The process used for selection of the MER landing
sites was broadly based on that used for selection of theMars Pathfinder landing site [Golombek et al., 1997a],
including a close coordination between the engineeringand science teams to identify potential landing sites andassess their safety and involvement of the science commu-nity via a series of open workshops. Like previous siteselection efforts, selection of landing sites for MER hasinvolved two parallel and intertwined activities. First, theengineering constraints on the landing site were definedbased on preliminary spacecraft design and the landingscenario. These engineering constraints on the landing sitewere continually revised and reassessed as the spacecraftdesign matured and as testing was conducted. At the sametime, the preliminary engineering constraints were mappedinto suitable areas of Mars (i.e., elevation and latitudeconstraints) and the search for potential landing sites beganearly to allow time for the acquisition of new remotesensing data by operating orbital spacecraft (initially MarsGlobal Surveyor, MGS, and later Mars Odyssey). Environ-mental information was provided to the engineers to aid inspacecraft design as more information was gathered andanalyzed. These two activities (defining the engineeringconstraints and searching for potential sites) were iterative,with the results of one affecting the other. As an example,changes in ellipse size based on tracking methods and thenumber and time of trajectory correction maneuvers rippledthrough the identification of potential landing sites after theinitial definition, and lander susceptibility to horizontalwinds had a major impact on site selection three fifths ofthe way through the process. Site safety has been ofparamount importance in this landing site selection effort(like all to date), for the simple reason that the spacecraft
Figure 1. Illustration of the entry, descent, and landing sequence of the Mars Exploration Rover (MER)landers. See [Crisp et al., 2003] for a description of the spacecraft configuration.
ROV 13 - 2 GOLOMBEK ET AL.: SELECTION OF MER LANDING SITES
must land safely before any science results can be obtained.Any other approach would place both the mission and theprogram at risk.[4] The landing site selection process for MER has
spanned more than two and a half years and incorporatedthe participation of broad sections of the planetary sciencescommunity (Table 1). The process began with definition ofpreliminary science and engineering constraints for themission in September 2000, and the identification of 185potential landing ellipses on Mars. These sites were prior-
itized according to their science potential at the first opencommunity landing site workshop held in January 2001 andabout 25 sites were targeted for acquisition of MGS MarsOrbiter Camera (MOC) images. Six sites were selected formore detailed analysis at the Second Landing Site Work-shop in October 2001. Additional MOC images and MarsOdyssey (which had just arrived at Mars) Thermal EmissionImaging System (THEMIS) images were also acquired ofthese sites. The six sites were evaluated in detail (andprioritized) in terms of both science and safety at the Third
Table 1. Major MER Landing Site Activities
Date Event/Activity
Sept. 2000 Preliminary MER engineering constraints identified.Sept. 2000 One hundred eighty-five potential sites identified based on accessible terrain/engineering constraints.
Invitation made to the Science Community to identify additional sites.Jan. 2001 First Open Community Landing Site Workshop held at NASA Ames, California.
Included presentation and discussion of all proposed sites.Used community consensus to prioritize based on science/safety requirements.Identification of seven highest priority and 17 other sites (some with multiple ellipses).Highest priority targeted for ‘‘ROTO’’a MOC imaging, others nadir-onlyb imaging.
March 2001 Refined thermal inertia and albedo requirements of potential landing sites.Resulted in elimination of first primary Elysium site and some nadir sites.
June 2001 Remaining Ganges and Candor Chasma sites eliminated based on landing safety concerns.Aug. 2001 MER Project approves TCM-5/DeltaDOR tracking, thereby reducing ellipse size slightly.
Leads to search for new sites by Steering Committee, Community, and Project.Search included review of sites previously proposed for Mars 2001 Lander.
Process identified nine new sites, including Athabasca Vallis in Elysium.Sept. 2001 Refined landing safety and engineering concerns caused growth of ellipses.
Leads to elimination of three of the new TCM-5/DeltaDOR ellipses.Oct. 2001 Second Open Community Landing Site Workshop held in Pasadena, California.
Discussion of sites in context of mission science and safety requirements.Selected four ellipses/regions and two alternate sites based on community voting.Primary sites: Meridiani Planum, Gusev Crater, Melas, Athabasca Vallis.Alternate sites: Isidis Planitia and Eos Chasma.
MOC image acquisition focused on the four primary and two alternate sites.Project begins detailed evaluation of primary sites.Project decisions made on amount of MOC coverage desired for sites.
Jan. 2002 Athabasca Vallis demoted to alternate site, Isidis Planitia elevated to primary.Decision based on radar reflectivity in Athabasca and potential decimeter roughness.
Mars Odyssey THEMIS imaging begins of sites remaining under consideration.March 2002 Third Open Community Landing Site Workshop held in Pasadena, California.
Discussion of remaining sites in context of MER-testable hypotheses.Provided first look at THEMIS images of the remaining sites.Sites evaluated on the basis of science, safety, and public engagement criteria.Retained Meridiani, Gusev, Isidis as primary sites; Athabasca as alternate.Eliminated Melas and Eos due to expected high winds and slopes.Later eliminated Athabasca due to radar roughness.
June 2002 Identified two Elysium ‘‘Wind Safe’’ sites; initiated by results of wind models.Aug. 2002 Steering Committee Meeting held at Arizona State University to review THEMIS data.
Selected EP78B2 ‘‘Wind Safe’’ site, discussed site science context.Oct. 2002 Continued imaging of four remaining sites by MOC and THEMIS.
Defined MOC stereo coverage and resolution desires and THEMIS coverage for sites.Jan. 2003 Fourth Open Community Landing Site Workshop held in Pasadena, California.
Confirmed Meridiani Planum and Gusev Crater as highest-priority science sites.Generated site-specific lists of testable hypotheses for remaining sites.Created lists of science ‘‘pros’’ and ‘‘cons’’ for each site.
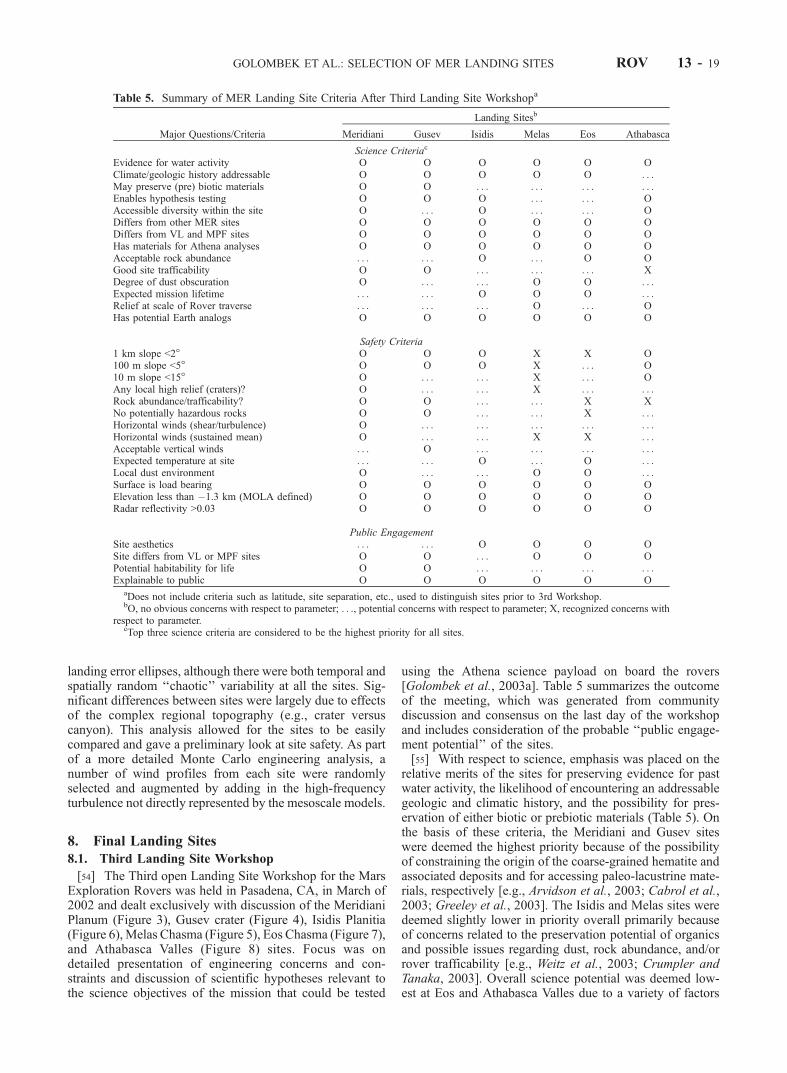
Jan. 2003 Athena Science Team Meeting in Pasadena, California.Near-unanimous support for Meridiani and Gusev as highest-priority science sites.If Gusev and Isidis eliminated, near-unanimous support for Meridiani and Elysium.Above is favored over sending both vehicles to Meridiani.If necessary to choose a single site, 2:1 margin for Meridiani over Gusev.
Feb. 2003 Project recommendation of Gusev for MER-A and Meridiani for MER-B.On the basis of sites satisfying safety and engineering parameters as well as science.
March 2003 External peer review of landing site selection and process.Approved of project recommendation and selection process.
April 2003 NASA Headquarters selected Meridiani and Gusev landing sites.Dr. Ed Weiler, Associate Administrator for Space Science was selecting official.Accepted slightly greater risk at Gusev for greater potential science return.
aROTO imaging with the Mars Orbiter Camera (MOC) involves rotating laterally off track.bNadir imaging with MOC involves downward viewing without changing spacecraft orientation.
GOLOMBEK ET AL.: SELECTION OF MER LANDING SITES ROV 13 - 3
Landing Site Workshop held in March 2002. Three siteswere removed due to safety concerns at this workshop and afourth site was added based on safety considerations. TheFourth Landing Site Workshop held in January 2003 con-firmed two sites (Meridiani and Gusev) as the highestscience priority sites and these two sites were endorsednear unanimously by the Athena Science Team (the NASAselected science team that is carrying out the mission [Crispet al., 2003; Squyres et al., 2003]). The MER project alsorecommended the Meridiani and Gusev sites on the basis ofsafety and science in March 2003. This recommendationwas endorsed and the selection process approved by anexternal peer review panel in late March 2003, and theMeridiani and Gusev landing sites were selected by NASAHeadquarters in April 2003 (Table 1).[5] A theme that has been adhered to throughout the
landing site selection activities is that the process has beencompletely open to involvement by any and all interestedparties and that there were no predetermined outcomes. Inaddition to broadcast invitations to the science community,several groups of individuals were specifically targeted forinput and attendance at the landing site workshops. The firstgroup comprised a Steering Committee (Table 2) thatoversaw the site selection process and provided focusedinput upon request. Committee membership was largelyNASA-appointed, with the exception of the two co-chairs,who were competitively selected, and was designed toencompass a range of critical experience and missioninvolvement. A group of ex-officio members from NASAHeadquarters were invited to ensure participation of repre-sentatives from all active and planned Mars missions.Similarly, additional invitations were extended to individu-als associated with ongoing or past missions. Finally,investigators receiving funding from the NASA Mars DataAnalysis Program were solicited to ensure all relevant datasets were brought to bear in consideration of the proposedsites.
2. Landing Site Engineering Constraints
2.1. Ellipse Size
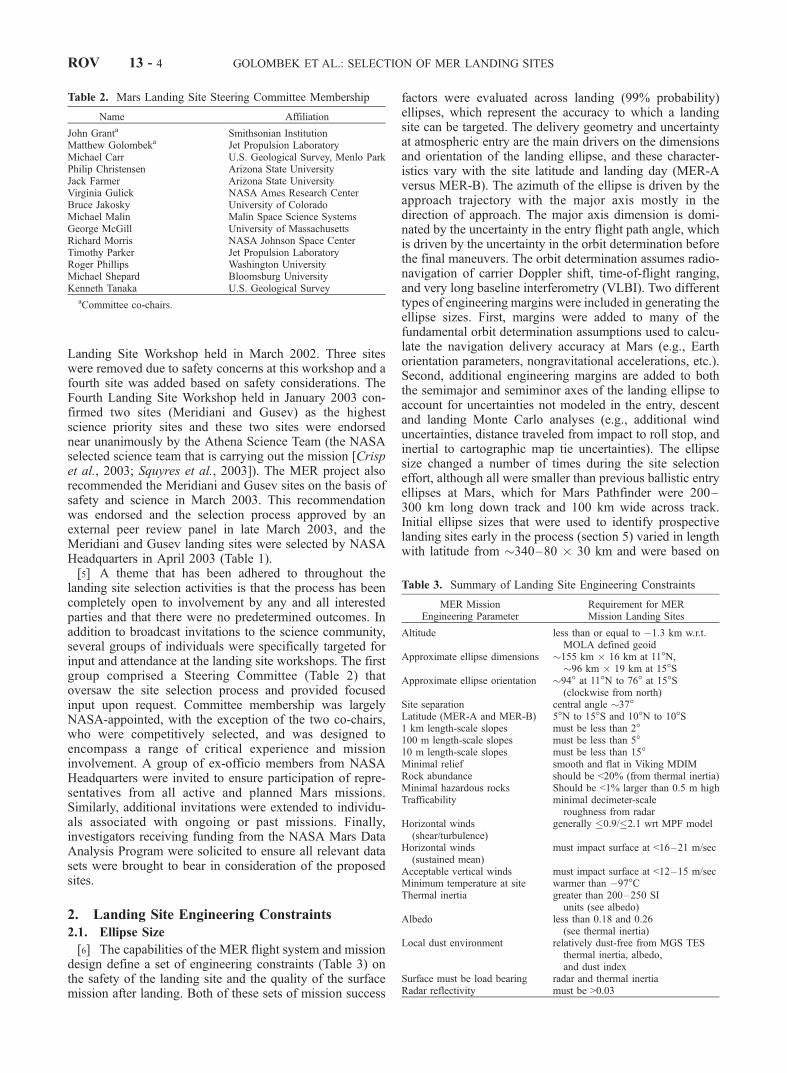
[6] The capabilities of the MER flight system and missiondesign define a set of engineering constraints (Table 3) onthe safety of the landing site and the quality of the surfacemission after landing. Both of these sets of mission success
factors were evaluated across landing (99% probability)ellipses, which represent the accuracy to which a landingsite can be targeted. The delivery geometry and uncertaintyat atmospheric entry are the main drivers on the dimensionsand orientation of the landing ellipse, and these character-istics vary with the site latitude and landing day (MER-Aversus MER-B). The azimuth of the ellipse is driven by theapproach trajectory with the major axis mostly in thedirection of approach. The major axis dimension is domi-nated by the uncertainty in the entry flight path angle, whichis driven by the uncertainty in the orbit determination beforethe final maneuvers. The orbit determination assumes radio-navigation of carrier Doppler shift, time-of-flight ranging,and very long baseline interferometry (VLBI). Two differenttypes of engineering margins were included in generating theellipse sizes. First, margins were added to many of thefundamental orbit determination assumptions used to calcu-late the navigation delivery accuracy at Mars (e.g., Earthorientation parameters, nongravitational accelerations, etc.).Second, additional engineering margins are added to boththe semimajor and semiminor axes of the landing ellipse toaccount for uncertainties not modeled in the entry, descentand landing Monte Carlo analyses (e.g., additional winduncertainties, distance traveled from impact to roll stop, andinertial to cartographic map tie uncertainties). The ellipsesize changed a number of times during the site selectioneffort, although all were smaller than previous ballistic entryellipses at Mars, which for Mars Pathfinder were 200–300 km long down track and 100 km wide across track.Initial ellipse sizes that were used to identify prospectivelanding sites early in the process (section 5) varied in lengthwith latitude from �340–80 � 30 km and were based on
Table 2. Mars Landing Site Steering Committee Membership
Name Affiliation
John Granta Smithsonian InstitutionMatthew Golombeka Jet Propulsion LaboratoryMichael Carr U.S. Geological Survey, Menlo ParkPhilip Christensen Arizona State UniversityJack Farmer Arizona State UniversityVirginia Gulick NASA Ames Research CenterBruce Jakosky University of ColoradoMichael Malin Malin Space Science SystemsGeorge McGill University of MassachusettsRichard Morris NASA Johnson Space CenterTimothy Parker Jet Propulsion LaboratoryRoger Phillips Washington UniversityMichael Shepard Bloomsburg UniversityKenneth Tanaka U.S. Geological Survey
aCommittee co-chairs.
Table 3. Summary of Landing Site Engineering Constraints
MER MissionEngineering Parameter
Requirement for MERMission Landing Sites
Altitude less than or equal to �1.3 km w.r.t.MOLA defined geoid
Approximate ellipse dimensions �155 km � 16 km at 11�N,�96 km � 19 km at 15�S
Approximate ellipse orientation �94� at 11�N to 76� at 15�S(clockwise from north)
Site separation central angle �37�Latitude (MER-A and MER-B) 5�N to 15�S and 10�N to 10�S1 km length-scale slopes must be less than 2�100 m length-scale slopes must be less than 5�10 m length-scale slopes must be less than 15�Minimal relief smooth and flat in Viking MDIMRock abundance should be <20% (from thermal inertia)Minimal hazardous rocks Should be <1% larger than 0.5 m highTrafficability minimal decimeter-scale
roughness from radarHorizontal winds(shear/turbulence)
generally �0.9/�2.1 wrt MPF model
Horizontal winds(sustained mean)
must impact surface at <16–21 m/sec
Acceptable vertical winds must impact surface at <12–15 m/secMinimum temperature at site warmer than �97�CThermal inertia greater than 200–250 SI
units (see albedo)Albedo less than 0.18 and 0.26
(see thermal inertia)Local dust environment relatively dust-free from MGS TES
thermal inertia, albedo,and dust index
Surface must be load bearing radar and thermal inertiaRadar reflectivity must be >0.03
ROV 13 - 4 GOLOMBEK ET AL.: SELECTION OF MER LANDING SITES

ranging and two-way Doppler tracking of the spacecraft withfive trajectory correction maneuvers (with the 4th, 8 daysbefore entry and the 5th, 12 hours before entry). Incorpora-tion of VLBI measurement techniques and moving the 5thtrajectory correction maneuver to 2 days before atmosphericentry (and adding a contingency 6th opportunity for amaneuver 6 hours before atmospheric entry) yielded ellipsesthat were 95–155 � 16–20 km. These ellipses were used inthe evaluation of the science objectives (section 9) andsurface characteristics (section 11) of the sites. Ellipses usedfor siting the final sites (section 12.4) were based on updatedanalysis of margins and navigation delivery accuracy andvaried from 80 to 115 km long and 10 to 12 km wide forMER-A and MER-B, respectively.
2.2. Elevation and Atmosphere
[7] Analysis of the entry, descent and landing system andatmospheric profiles for the season and time of arrival(described later) indicates that the MER spacecraft arecapable of landing below �1.3 km, with respect to theMOLA (Mars Orbiter Laser Altimeter) defined geoid [Smithand Zuber, 1998]. This requirement stems mostly from theneed for an adequate atmospheric density column to deploythe parachute, bring the spacecraft to the correct terminalvelocity, and provide enough time for subsequent events(jettison the heat shield, separate the lander from the backshell, measure the descent rate with the radar altimeter,inflate the airbags and fire the solid rockets) to be completedbefore the lander hits the surface.[8] Constant horizontal wind over the last few kilometers
of the descent results in the lander’s horizontal speed match-ing the wind speed. Unchecked, this horizontal velocity isadded to the vertical velocity, possibly increasing the totalimpact velocity beyond the airbag capabilities. Wind gustscan also induce horizontal velocity through oscillations in thethree-body system (parachute, backshell, and lander), result-ing in the backshell pointing off vertical when the decelera-tion rockets fire. Three small horizontal rockets in thebackshell can be fired either singly or in pairs to compensateeither the affects of wind gusts or constant horizontal winds.By changing the attitude of the large descent rockets, thesesmall horizontal rockets impart an effective velocity of about27 m/s in one of six directions. This system can countersustained winds of 35–50 m/s, bringing the tangentialvelocity of impact into a range that the airbags can survive.Similarly, the system can counter the effect of backshellangles up to roughly 20�. Significant changes in verticalwinds between the radar solution and landing can also resultin excessive impact velocities, however modeled winds at thesites show only small variations in the vertical component, sothis was not a discriminator.
2.3. Latitude and Spacing
[9] The lifetime of the rover is determined by its ability tocollect energy during the day, and its ability to use thatenergy to maintain thermal control during the night. Duringthe day the rover will collect energy, heat up an insulatedbox containing the rover electronics, and charge batteriesfor use during the night. At night, the rover uses energyfrom the batteries, the stored thermal energy in the insulatedbox, and heat energy from radioisotope heater units to keepfrom getting too cold. The rover cannot survive the night
when the energy it is able to collect and store is less than theenergy needed to survive nighttime temperatures. As aresult, landing sites near the subsolar latitude will receivemore solar energy with a cosine loss for angles off of 90�,mitigated slightly by atmospheric diffusion of the light. Thesubsolar latitude starts at around 13�S (at the landing ofMER-A) and heads north through the required 90 sollifetimes of MER-A and MER-B. The lifetime requirement,the assumed solar panel degradation due to dust accumula-tion, and the modeled nighttime temperatures resulted inlanding site latitude constraints of 15�S to 5�N for MER-Aand 10�S to 10�N for MER-B.[10] The MER rovers return approximately 70% of their
data through the Odyssey and Mars Global Surveyor (MGS)orbiters. These relays can each only communicate with onerover at a time, and so if two rovers are too close to eachother, then their data return would be reduced by the fractionof time that they had to share an orbiter pass. In the extremecase, if the rovers land at the same location, all orbiter passeswould have to be shared, and the overall data return wouldbe reduced by approximately 30%. In order to maximize thedata return of both missions, the landing sites are constrainedto be separated by at least 37� in central angle.
2.4. Slopes
[11] A radar altimeter measures the distance to the surfaceand the descent velocity. The final measurement is takenjust before airbag inflation about 9 s before landing. If thereare significant changes in the elevation between the finalmeasurement and landing, then the lander altitude estimatewill be incorrect, which is called ‘‘spoofing’’ the radar. Inthat case, the solution for when to fire the descent rocketsand when to cut the bridle in order to minimize the impactvelocity will be incorrect, possibly resulting in an impactthat exceeds the capability of the airbag system. The landercan move on the order of 100 m horizontally between thelast radar solution and landing. The altitude change overthat distance should be limited to less than 9 m, which givesmaximum slopes at these scales of about 5�.[12] The multiple bounces of the lander on a relatively
flat surface with an overall tilt in one direction could causethe lander to bounce in that direction and experience anincrease in energy instead of a decrease. This would lead toan excessive impact velocity and system failure. Suchfailures can be avoided if slopes on the scale of 1 km arelimited to about 2� or less.[13] High slopes on the scale of the airbags (�10 m), can
result in an increased chance of failure through inopportuneconversions between horizontal and vertical velocity. Forexample, the lander may have a barely acceptable combi-nation of horizontal and vertical velocity on the first impact,but the encountered slope results in bouncing the landerstraight up. The vertical velocity on the second impact thenexceeds the capability of the airbags, and the system fails.As a rough guide, the slopes at the �3 m scale should notexceed 15� in order to avoid these failures. Finally, extremeroughness at the scale of the rover wheel (26 cm diameter)is probably not trafficable.
2.5. Rocks
[14] Rocks can cause failure of the airbags by ripping theouter layers or by tensile failure of the interior bladder
GOLOMBEK ET AL.: SELECTION OF MER LANDING SITES ROV 13 - 5
against triangular or pyramid shaped rocks. Ripping of theouter layers is exacerbated by high tangential velocity.Tensile failure of the inner bladder is more likely with highnormal velocity, although this failure has been largelyameliorated by the addition of a second interior bladder.In either case the system failure is not immediate, but ratherthe failure of the bladder results in a loss of pressure,increasing the risk of failure on the next impact. The airbagshave been repeatedly successful in tests against rocks 0.5 mhigh, and engineering analysis suggests that the likelihoodof failure does not increase significantly until the heightexceeds 0.7 m. For rocks higher than 0.7 m, the hazardousnature of the rock increases slowly with increasing height asa function of the lander velocity at impact and orientation ofthe lander (tetrahedral corners having less stroke thantetrahedral faces). Airbag drop tests on 0.5 m high rocksshow they can withstand total impact velocities as high as26 m/s, normal impact velocities as high as 16 m/s, andsurface impact grazing angles as low as �15�. Initiallybased on the Mars Pathfinder constraint [Golombek et al.,1997a], an upper limit of 20% rock coverage was set on thelanding sites, which corresponds to roughly 1% area cov-ered by 0.5 m high rocks based on rock size-frequencydistributions [Golombek and Rapp, 1997]. Because simu-lations suggest the first four and occasionally one in the nextsix bounces may be energetic enough to cause failure if thelander is traveling at a high velocity, a large area is sampledby the lander (9–17 m2 per bounce) and the probability ofimpacting a potentially hazardous rock rises significantlyfor areas with >10% rock coverage [Golombek et al.,2003b]. Tests show that the rovers can drive through areaswith 20% rock coverage, although progress slows with rockabundances >15%.
2.6. Radar Reflectivity and Surface Dust
[15] The radar altimeter requires a radar reflective surfaceto properly measure the closing velocity. Areas with weakradar echoes, generally interpreted as very dusty areas withlow bulk densities are not suitable. Such areas may not beload bearing, which would inhibit rover operations. Dustcould also coat rocks, obscuring their composition and/ormineralogy to remote sensing instruments and dust could bedeposited on the solar panels, reducing the surface missionlifetime. The descent imaging and processing systemrequires an adequate surface contrast in order to locateand match features for the measurement of horizontalvelocity and very dusty areas have uniform albedo, whichcould impede the effectiveness of this system. Finally, verydusty areas have high albedo and low thermal inertia, whichresults in cold near-surface atmospheric temperatures.Nighttime temperatures below �97�C would limit missionlifetime and the spacecraft was not qualified to temperaturescolder than �120�C (which may be insufficient marginbelow this nighttime temperature) during thermal vacuumtesting.
3. Potential Landing Sites
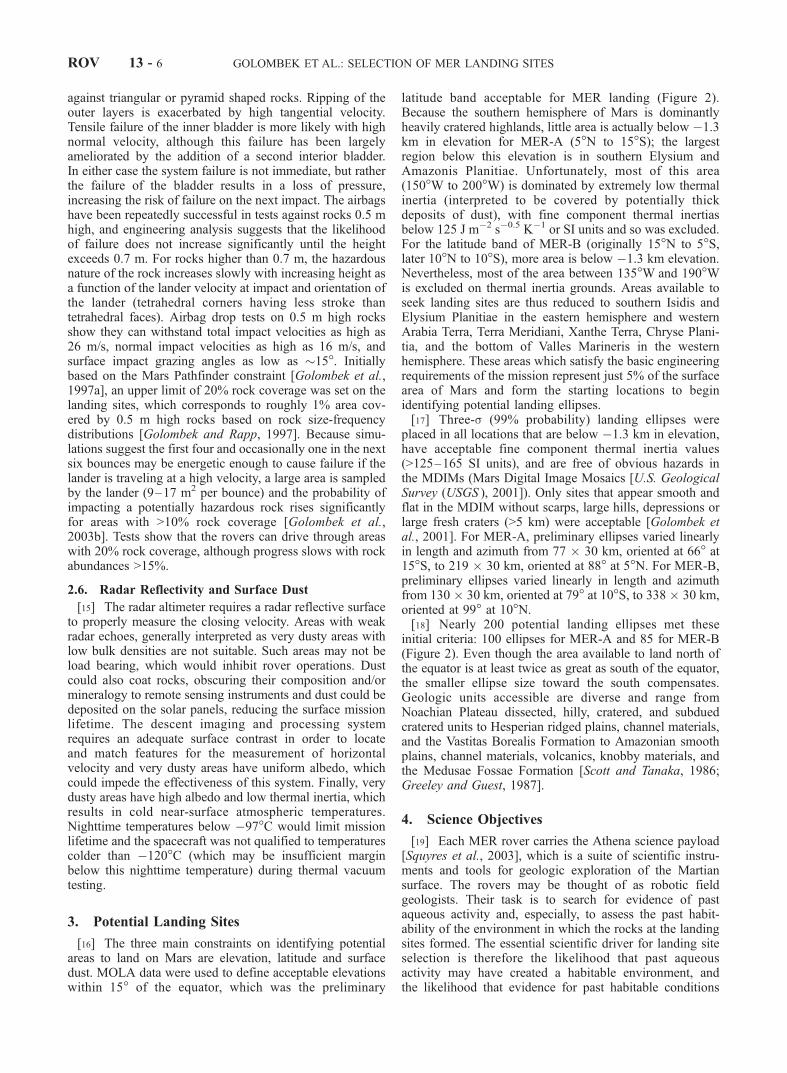
[16] The three main constraints on identifying potentialareas to land on Mars are elevation, latitude and surfacedust. MOLA data were used to define acceptable elevationswithin 15� of the equator, which was the preliminary
latitude band acceptable for MER landing (Figure 2).Because the southern hemisphere of Mars is dominantlyheavily cratered highlands, little area is actually below �1.3km in elevation for MER-A (5�N to 15�S); the largestregion below this elevation is in southern Elysium andAmazonis Planitiae. Unfortunately, most of this area(150�W to 200�W) is dominated by extremely low thermalinertia (interpreted to be covered by potentially thickdeposits of dust), with fine component thermal inertiasbelow 125 J m�2 s�0.5 K�1 or SI units and so was excluded.For the latitude band of MER-B (originally 15�N to 5�S,later 10�N to 10�S), more area is below �1.3 km elevation.Nevertheless, most of the area between 135�W and 190�Wis excluded on thermal inertia grounds. Areas available toseek landing sites are thus reduced to southern Isidis andElysium Planitiae in the eastern hemisphere and westernArabia Terra, Terra Meridiani, Xanthe Terra, Chryse Plani-tia, and the bottom of Valles Marineris in the westernhemisphere. These areas which satisfy the basic engineeringrequirements of the mission represent just 5% of the surfacearea of Mars and form the starting locations to beginidentifying potential landing ellipses.[17] Three-s (99% probability) landing ellipses were
placed in all locations that are below �1.3 km in elevation,have acceptable fine component thermal inertia values(>125–165 SI units), and are free of obvious hazards inthe MDIMs (Mars Digital Image Mosaics [U.S. GeologicalSurvey (USGS ), 2001]). Only sites that appear smooth andflat in the MDIM without scarps, large hills, depressions orlarge fresh craters (>5 km) were acceptable [Golombek etal., 2001]. For MER-A, preliminary ellipses varied linearlyin length and azimuth from 77 � 30 km, oriented at 66� at15�S, to 219 � 30 km, oriented at 88� at 5�N. For MER-B,preliminary ellipses varied linearly in length and azimuthfrom 130 � 30 km, oriented at 79� at 10�S, to 338 � 30 km,oriented at 99� at 10�N.[18] Nearly 200 potential landing ellipses met these
initial criteria: 100 ellipses for MER-A and 85 for MER-B(Figure 2). Even though the area available to land north ofthe equator is at least twice as great as south of the equator,the smaller ellipse size toward the south compensates.Geologic units accessible are diverse and range fromNoachian Plateau dissected, hilly, cratered, and subduedcratered units to Hesperian ridged plains, channel materials,and the Vastitas Borealis Formation to Amazonian smoothplains, channel materials, volcanics, knobby materials, andthe Medusae Fossae Formation [Scott and Tanaka, 1986;Greeley and Guest, 1987].
4. Science Objectives
[19] Each MER rover carries the Athena science payload[Squyres et al., 2003], which is a suite of scientific instru-ments and tools for geologic exploration of the Martiansurface. The rovers may be thought of as robotic fieldgeologists. Their task is to search for evidence of pastaqueous activity and, especially, to assess the past habit-ability of the environment in which the rocks at the landingsites formed. The essential scientific driver for landing siteselection is therefore the likelihood that past aqueousactivity may have created a habitable environment, andthe likelihood that evidence for past habitable conditions
ROV 13 - 6 GOLOMBEK ET AL.: SELECTION OF MER LANDING SITES
will be preserved in a form that can be studied using theAthena payload.[20] The Athena payload is described in detail elsewhere
in this issue. The topography, morphology, and mineralogyof the scene around each rover will be revealed by Pancam[Bell et al., 2003] and Mini-TES [Christensen et al., 2003b].Pancam is a high-resolution, multispectral stereo camera.Mini-TES is an infrared spectrometer that produces highspectral resolution images in the wavelength range of 5–29 mm. Once promising targets have been identified usingPancam and Mini-TES, they will be studied in more detailusing two in situ compositional instruments mounted on aninstrument arm. These are an alpha particle X-ray spec-trometer (APXS) [Rieder et al., 2003] for elemental chem-istry and a Mossbauer Spectrometer (MB) [Klingelhofer etal., 2003] for the mineralogy of Fe-bearing species. Theinstrument arm also carries a Microscopic Imager (MI)[Herkenhoff et al., 2003] that will obtain high-resolutionimages of the same materials for which compositional datawill be obtained, as well as a Rock Abrasion Tool (RAT)[Gorevan et al., 2003] that can remove the outer, potentiallyweathered, surface material of rocks, exposing fresh materi-als underneath for examination by all the instruments.
5. Initial Landing Site Identification
[21] Because the number of sites that meet the basicengineering constraints is large, the selection process usedthe science objectives of the mission as the main discrimi-nator of sites to be investigated in detail. This contrastsmarkedly with previous site selection efforts for the Vikingand Mars Pathfinder missions, in which the sites studied indetail were dominated by engineering considerations[Masursky and Crabill, 1976a, 1976b, 1981; Golombek etal., 1997a]. Because of this approach, the evaluation of thosefactors that distinguish potential landing sites with respect tomission success for MER has had to go beyond what wasrequired to only find the two safest sites. Furthermore, thesafety evaluation for the MER landing sites has beenexhaustive in the identification of all mission success factorsthat depend on the landing site environment, and in thegeneration of environmental models to address all of thosefactors quantitatively in the evaluation of mission success.[22] The first landing site workshop occurred in January
2001 and included presentations on various aspects of
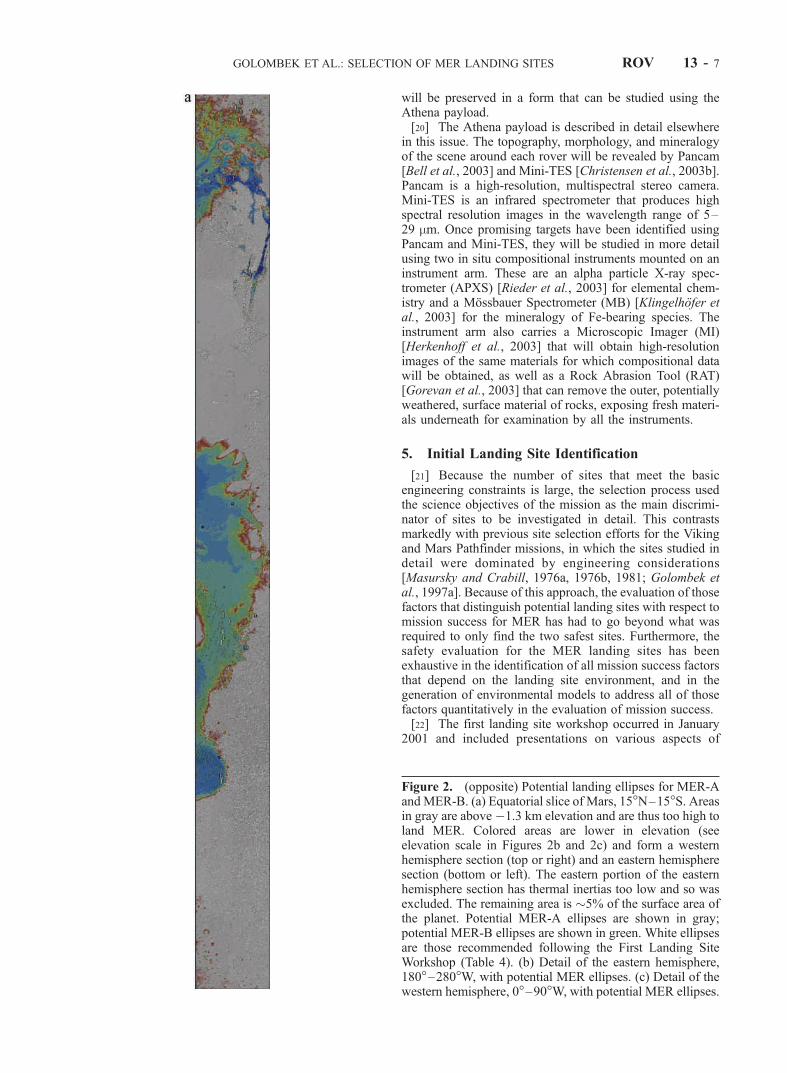
Figure 2. (opposite) Potential landing ellipses for MER-AandMER-B. (a) Equatorial slice of Mars, 15�N–15�S. Areasin gray are above �1.3 km elevation and are thus too high toland MER. Colored areas are lower in elevation (seeelevation scale in Figures 2b and 2c) and form a westernhemisphere section (top or right) and an eastern hemispheresection (bottom or left). The eastern portion of the easternhemisphere section has thermal inertias too low and so wasexcluded. The remaining area is �5% of the surface area ofthe planet. Potential MER-A ellipses are shown in gray;potential MER-B ellipses are shown in green. White ellipsesare those recommended following the First Landing SiteWorkshop (Table 4). (b) Detail of the eastern hemisphere,180�–280�W, with potential MER ellipses. (c) Detail of thewestern hemisphere, 0�–90�W, with potential MER ellipses.
GOLOMBEK ET AL.: SELECTION OF MER LANDING SITES ROV 13 - 7
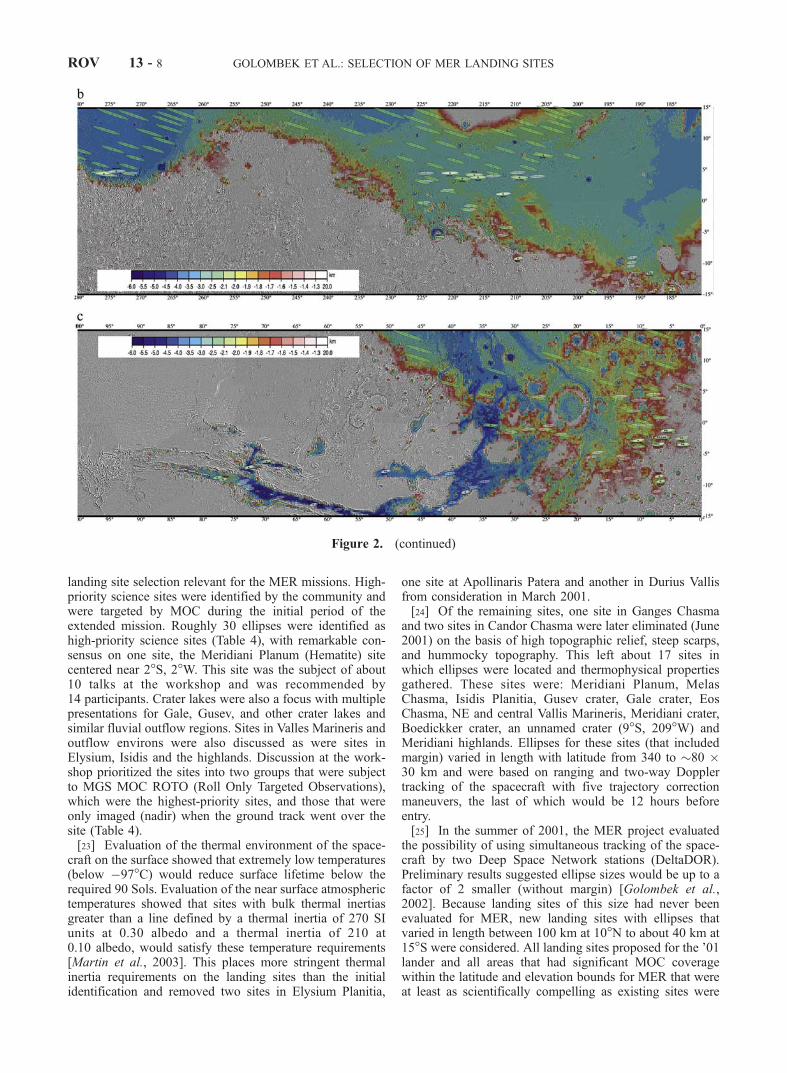
landing site selection relevant for the MER missions. High-priority science sites were identified by the community andwere targeted by MOC during the initial period of theextended mission. Roughly 30 ellipses were identified ashigh-priority science sites (Table 4), with remarkable con-sensus on one site, the Meridiani Planum (Hematite) sitecentered near 2�S, 2�W. This site was the subject of about10 talks at the workshop and was recommended by14 participants. Crater lakes were also a focus with multiplepresentations for Gale, Gusev, and other crater lakes andsimilar fluvial outflow regions. Sites in Valles Marineris andoutflow environs were also discussed as were sites inElysium, Isidis and the highlands. Discussion at the work-shop prioritized the sites into two groups that were subjectto MGS MOC ROTO (Roll Only Targeted Observations),which were the highest-priority sites, and those that wereonly imaged (nadir) when the ground track went over thesite (Table 4).[23] Evaluation of the thermal environment of the space-
craft on the surface showed that extremely low temperatures(below �97�C) would reduce surface lifetime below therequired 90 Sols. Evaluation of the near surface atmospherictemperatures showed that sites with bulk thermal inertiasgreater than a line defined by a thermal inertia of 270 SIunits at 0.30 albedo and a thermal inertia of 210 at0.10 albedo, would satisfy these temperature requirements[Martin et al., 2003]. This places more stringent thermalinertia requirements on the landing sites than the initialidentification and removed two sites in Elysium Planitia,
one site at Apollinaris Patera and another in Durius Vallisfrom consideration in March 2001.[24] Of the remaining sites, one site in Ganges Chasma
and two sites in Candor Chasma were later eliminated (June2001) on the basis of high topographic relief, steep scarps,and hummocky topography. This left about 17 sites inwhich ellipses were located and thermophysical propertiesgathered. These sites were: Meridiani Planum, MelasChasma, Isidis Planitia, Gusev crater, Gale crater, EosChasma, NE and central Vallis Marineris, Meridiani crater,Boedickker crater, an unnamed crater (9�S, 209�W) andMeridiani highlands. Ellipses for these sites (that includedmargin) varied in length with latitude from 340 to �80 �30 km and were based on ranging and two-way Dopplertracking of the spacecraft with five trajectory correctionmaneuvers, the last of which would be 12 hours beforeentry.[25] In the summer of 2001, the MER project evaluated
the possibility of using simultaneous tracking of the space-craft by two Deep Space Network stations (DeltaDOR).Preliminary results suggested ellipse sizes would be up to afactor of 2 smaller (without margin) [Golombek et al.,2002]. Because landing sites of this size had never beenevaluated for MER, new landing sites with ellipses thatvaried in length between 100 km at 10�N to about 40 km at15�S were considered. All landing sites proposed for the ’01lander and all areas that had significant MOC coveragewithin the latitude and elevation bounds for MER that wereat least as scientifically compelling as existing sites were
Figure 2. (continued)
ROV 13 - 8 GOLOMBEK ET AL.: SELECTION OF MER LANDING SITES
considered. Nine new locations met these criteria: Margar-itifer Valles, Crommelin crater, two Athabasca Valles sitesin Elysium Planitia, Ares Vallis tributary, Sinus Meridiani,Highlands (8�N, 12�W), and additional sites in Melas (SE)and Isidis.[26] In September 2001, the MER project completed a
full analysis of landing ellipse sizes that included DeltaDORtracking, a 5th trajectory correction maneuver 2 days beforeatmospheric entry, a new arrival date for MER-B, and a fullassessment of navigation errors and margin. The new arrivaldate for MER-B shifted the latitude band from the initial15�N–5�S to 10�N–10�S. and corresponding landingellipse lengths grew to 140–95 km, depending on latitude,with widths of 16–20 km. Three of these new sites(Margaritifer Valles, Crommelin crater, and SE Melas) wereremoved based on these longer ellipses.[27] The remaining 24 sites were discussed at the Second
Landing Site Workshop, 17–18 October 2001, in Pasadena,CA [Golombek et al., 2002]. This workshop focused onevaluation of the science that can be accomplished at eachsite. Each site had a science spokesperson who discussedthe science potential, the testable hypotheses, and specificmeasurements and investigations possible by the Athenascience instruments at that site. In addition, safety consid-erations for the sites were discussed (ellipses did not fitwithin Gale, Boedickker, and the unnamed craters, or
central and NE Valles Marineris, Table 4). Consensus wasreached on four prime sites: Meridiani Planum (Figure 3),Gusev crater (Figure 4), Melas Chasma (Figure 5), andIsidis Planitia (Figure 6); and two backups: Eos Chasma(Figure 7) and Athabasca Valles (Figure 8). Ellipse locationswere moved slightly after the workshop to improve theirscience potential or safety. Presentations at the workshopindicate all of the sites show evidence for surface processesinvolving water and appear capable of addressing thescience objectives of the MER missions.
6. Data and Models Used to Evaluate SurfaceCharacteristics and Safety
6.1. Introduction
[28] Unlike all previous landing site selection activities,MER had an unprecedented profusion of new informationavailable and the ability to acquire data from two orbitingspacecraft during the selection process. In contrast, theViking landing site selection activity relied mostly onMariner 9 information prior to arrival and then an intenseeffort to find new sites after arrival when previouslyidentified sites appeared too dangerous in orbiter images[Masursky and Crabill, 1976a, 1976b, 1981]. AlthoughMars Pathfinder had little new data since Viking, therewas a much greater appreciation and models of how the
Table 4. Landing Sites Being Considered After the First Site Selection Workshop
Location Location of Ellipse Center, deg MER-A MER-B Geological Unita Elevation, km Identifier
Highest-Priority Sitesb
Eos Chasma 13.34S, 41.39W X Hch �4.0 VM41AElysium Outflow 7.40N, 205.60W X Ael1 �3.0 EP49BGale 5.81S, 222.23W X S �4.5 EP82AGusev 14.85S, 184.16W X Hch �1.9 EP55A (S)Meridiani 2.50S, 3.30W X Npl2 �1.3 TM21B
1.99S, 6.01W X Npl2 �1.3 TM20B1.20S, 5.30W X Npl2 �1.3 TM19B2.20S, 6.60W X Npl2 �1.7 TM10A1.20S, 5.60W X Npl2 �1.3 TM9A
Isidis 4.64N, 275.88W X Aps �4.0 IP98B4.7N, 274.68W X Aps �4.5 IP85A
Melas Chasma 8.8S, 77.8W X Avf �3.5 VM53A8.8S, 77.8W X Avf �3.5 B Site
High-Priority Sitesc
Apollinaris �9.50S, 190.20W TBD TBD AHa �2 TBDBoedickker Crater 15.30S, 197.44W X Npl1 �2.1 EP64ACentral Valles Marineris 13.10S, 62.50W X Avf �4.5 VM44ADurius Valles 14.6S, 188.1W Npl1 EP56AMeridiani 3.40S, 7.20W X Npl2 �1.7 TM22B
3.10S, 3.10W X Npl2 �1.4 TM23B3.60S, 2.90W X Npl2 �1.3 TM12A3.40S, 6.90W X Npl2 �1.6 TM11A
Isidis 4.50N, 271.90W X Aps �4.5 IP84A4.48N, 271.60W X Aps �4.5 IP96B
Meridiani Crater 8.60S, 7.1W X S �1.9 TM15A9.36S, 6.76W X S �1.9 TM16A
Meridiani Highlands 3.00S, 10.00W X Hr �1.8 TM13A2.80S, 10.10W X Hr �1.8 TM24B
NE Valles Marineris Outflow 11.10S, 38.05W X Hch �4.0 VM37AUnnamed crater 9.20S, 209.60W X Npl1 �1.7 EP69A
aGeological units from maps by Scott and Tanaka [1986] and Greeley and Guest [1987]. The first letter refers to the age: N, Noachian; H, Hesperian; andA, Amazonian. Hch, channel and chaotic material; Aps, smooth plains material; Ael1, Elysium Formation (unit 1); Avf, Valles Marineris floor material;AHa, Apollinarus Patera Formation; Hr, ridged plains material; Npl1, cratered plateau material; Npl2, subdued crater plateau material; S, smooth crater floormaterial.
bTargeted by MGS MOC when accessible by rotating off the orbit track (ROTO) and during nadir passes.cTargeted by MGS MOC during nadir passes only.
GOLOMBEK ET AL.: SELECTION OF MER LANDING SITES ROV 13 - 9
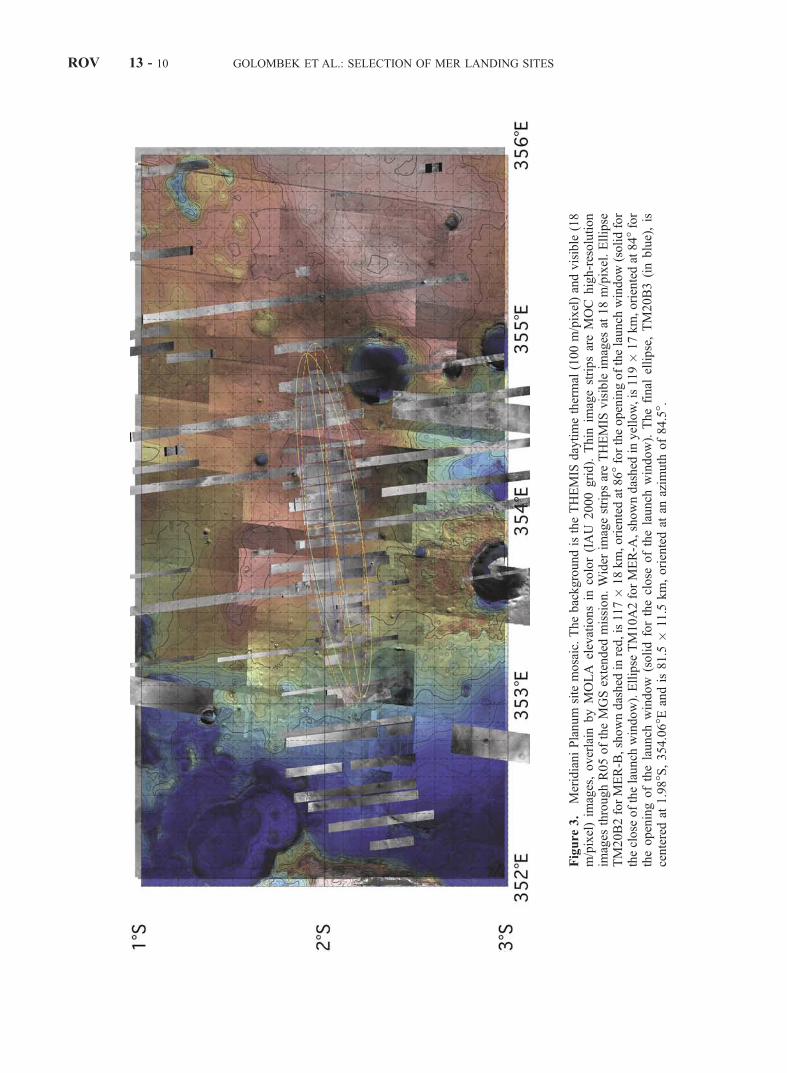
Figure
3.
MeridianiPlanum
site
mosaic.ThebackgroundistheTHEMIS
daytimethermal
(100m/pixel)andvisible
(18
m/pixel)im
ages,overlain
byMOLA
elevationsin
color(IAU
2000grid).Thin
imagestripsareMOC
high-resolution
images
throughR05oftheMGSextended
mission.Wider
imagestripsareTHEMIS
visible
images
at18m/pixel.Ellipse
TM20B2forMER-B,showndashed
inred,is117�
18km,orientedat86�fortheopeningofthelaunch
window(solidfor
theclose
ofthelaunch
window).Ellipse
TM10A2forMER-A
,showndashed
inyellow,is119�
17km,orientedat84�for
theopeningofthelaunch
window
(solidfortheclose
ofthelaunch
window).Thefinal
ellipse,TM20B3(inblue),is
centeredat
1.98�S,354.06�E
andis81.5
�11.5
km,orientedat
anazim
uth
of84.5�.
ROV 13 - 10 GOLOMBEK ET AL.: SELECTION OF MER LANDING SITES
VL1 (Viking Lander 1) and VL2 (Viking Lander 2) landingsurfaces related to Viking Orbital data and a clear Earthanalog [Golombek et al., 1997a] that correctly predicted thesurface characteristics of the landing site [Golombek et al.,1997b, 1999]. In comparison, MER has received a plethoraof new information from MGS and Odyssey that hasresulted in the best-imaged, best-studied locations in thehistory of Mars exploration. These data have allowed themajor engineering constraints and the science potential(including specific testable hypotheses) to be addressed in
detail. Specific data used in the MER site selection effortinclude: Viking images, Viking Infrared Thermal Mapper(IRTM) data, data from the Viking and Mars Pathfinderlanding sites, Earth-based radar, MGS MOLA, TES (Ther-mal Emission Spectrometer) and MOC data, and MarsOdyssey THEMIS data.
6.2. Viking Image Data
[29] At the start of the MER landing site selection processthe digitally mosaiced Viking orbiter images (230 m/pixel)
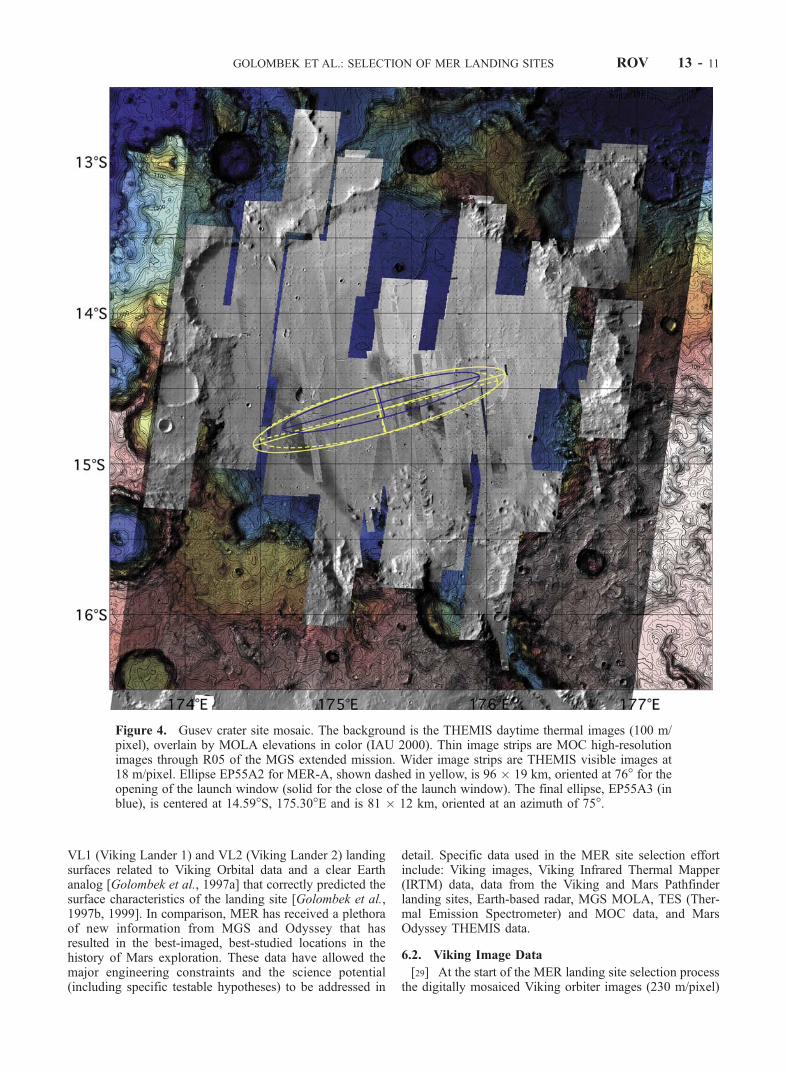
Figure 4. Gusev crater site mosaic. The background is the THEMIS daytime thermal images (100 m/pixel), overlain by MOLA elevations in color (IAU 2000). Thin image strips are MOC high-resolutionimages through R05 of the MGS extended mission. Wider image strips are THEMIS visible images at18 m/pixel. Ellipse EP55A2 for MER-A, shown dashed in yellow, is 96 � 19 km, oriented at 76� for theopening of the launch window (solid for the close of the launch window). The final ellipse, EP55A3 (inblue), is centered at 14.59�S, 175.30�E and is 81 � 12 km, oriented at an azimuth of 75�.
GOLOMBEK ET AL.: SELECTION OF MER LANDING SITES ROV 13 - 11
were used to assess areas that did not contain obvious scarpsor slopes at about 1 km scale. This MDIM 2.0 version(planetographic, positive west longitude) was produced atthe start of the MER landing site activity by the U. S.Geological Survey, Flagstaff [USGS, 2001] and included animproved cartographic frame that resulted from informationgathered by the Mars Pathfinder mission.
6.3. MOLA Data
[30] For the first time, definitive elevation data wereprovided by MOLA [Smith et al., 2001a] and when com-
bined with gravity data [Tyler et al., 2001] allowed thedefinition of the Martian geoid and its general relationshipwith atmospheric surface pressure [Smith and Zuber, 1998].The initial definition of potential MER ellipses was madeusing the MDIM 2.0 and the MOLA elevations; potentialellipses had to be entirely smooth and flat in the MDIM 2.0and be below �1.3 km. Standard mosaics produced for eachlanding site in this paper include the MDIM 2.0 and MOLAdata as bases for placing higher-resolution images. MOLAtopographic data in the mosaics were plotted on a positiveeast planetocentric coordinate system referenced to the IAU/
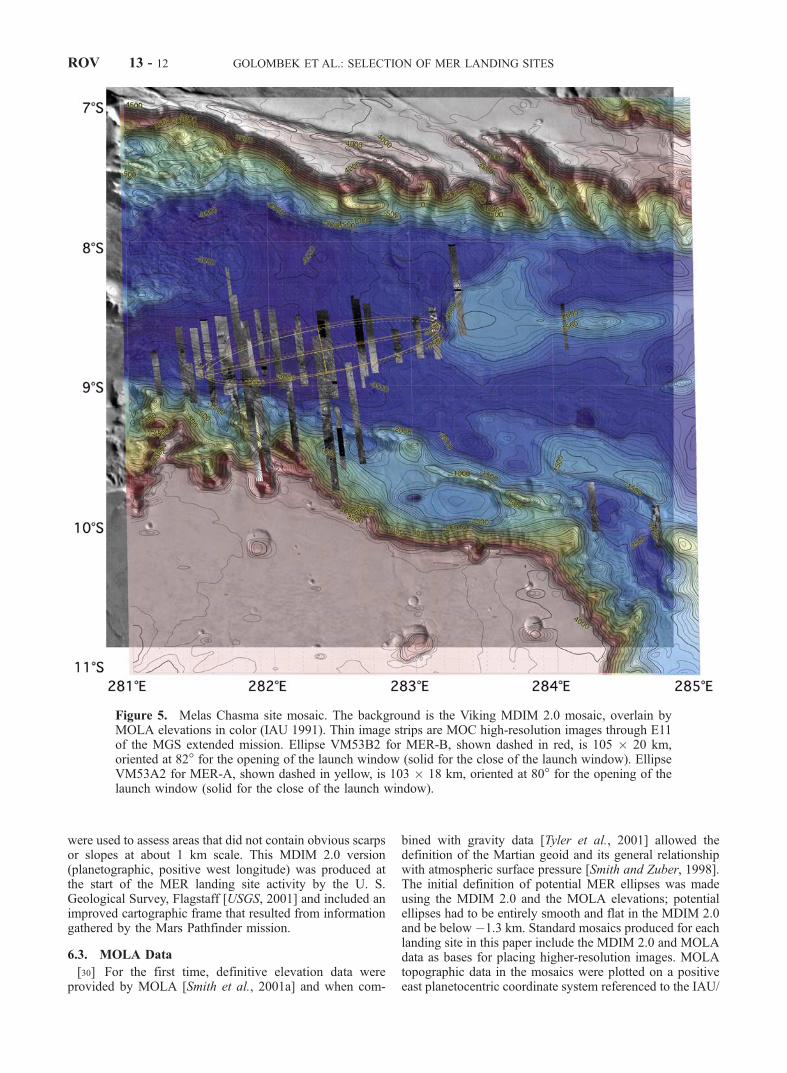
Figure 5. Melas Chasma site mosaic. The background is the Viking MDIM 2.0 mosaic, overlain byMOLA elevations in color (IAU 1991). Thin image strips are MOC high-resolution images through E11of the MGS extended mission. Ellipse VM53B2 for MER-B, shown dashed in red, is 105 � 20 km,oriented at 82� for the opening of the launch window (solid for the close of the launch window). EllipseVM53A2 for MER-A, shown dashed in yellow, is 103 � 18 km, oriented at 80� for the opening of thelaunch window (solid for the close of the launch window).
ROV 13 - 12 GOLOMBEK ET AL.: SELECTION OF MER LANDING SITES
IAG 1991 system (available when site analysis began) thatcontained an offset from the MDIM 2.0. Final maps werereferenced to the IAU/IAG 2000 frame, which can be easilyconverted to the inertia coordinates used by the spacecraftnavigation team. MOLA data also provided definitiveslopes at the 1 km scale as well as slopes at longer andshorter baselines down to the 300 m spacing between lasershots along orbit tracks [e.g., Smith et al., 2001a; Kreslavskyand Head, 1999, 2000; Aharonson et al., 2001]. The Allanvariation (relief) at a number of length scales was used toinfer roughness at smaller scales by extrapolation of theHurst exponent [Shepard et al., 2001; Campbell et al.,2003; Anderson et al., 2003]. At most of the landing sitesthese results generally compare favorably with estimates ofroughness at the 75–150 m scale derived from the spread ofthe returned MOLA laser pulse, with and without the longerslopes subtracted out [Garvin et al., 1999; Smith et al.,2001a; Neumann et al., 2003]. As a result, in addition toproviding definitive elevations and geopotential surfaces forlocating potential landing sites, MOLA data also directlyassessed slopes at 1 km and 100 m scale, which are ofengineering concern. Finally, gridded MOLA data wereused to construct shaded relief maps to evaluate surfacemorphology and geology [e.g., Smith et al., 2001a].
6.4. Thermophysical Properties
[31] Data on the thermosphysical properties of the surfaceinclude data from the Viking era, as well as from MGS andOdyssey. Thermal inertia measures the rate at which surfacematerials change temperature, which can be related to
particle size and cohesion [Kieffer et al., 1977; Jakosky,1986; Christensen, 1986a; Christensen and Moore, 1992].Surfaces dominated by loose dust have low thermal inertiaand high albedo, whereas those dominated by rock orduricrust have high thermal inertia and typically (but notalways) lower albedo. The fine component thermal inertia isthe thermal inertia of the surface after the thermal radianceattributable to the rocky component is factored out [Kieffer etal., 1977;Christensen, 1986b]. A combined digital data set ofIRTM thermal inertia measurements was used that included(1) bulk inertia in 2� � 2� footprints [Kieffer et al., 1977;Palluconi and Kieffer, 1981], (2) high-resolution bulk inertiain 0.5� � 0.5� footprints [Christensen and Malin, 1988], (3)rock abundance in 1� � 1� footprints [Christensen, 1986b],(4) fine component thermal inertia in 1� � 1� footprints[Christensen, 1982, 1986a, 1986b], and albedo in 1� � 1�footprints [Pleskot and Miner, 1981]. For initial MER ellip-ses, fine component thermal inertia had to be greater than125–165 J m�2 s�0.5 K�1 or as commonly abbreviated, SIunits, to avoid surfaces dominated by potentially thickdeposits of dust. These same data were used to help selectthe Pathfinder landing site [Golombek et al., 1997a] andproved their worth by making predictions of surface charac-teristics that were ultimately verified by ground truth datareturned by the Pathfinder lander [Golombek et al., 1997b,1999]. Acceptable thermal inertias for landed missions thatare load bearing, trafficable and not dominated by loose dustare outlined in Golombek et al. [1997a].[32] Later in the site selection process high-resolution
TES thermal inertia and albedo became available, initially at
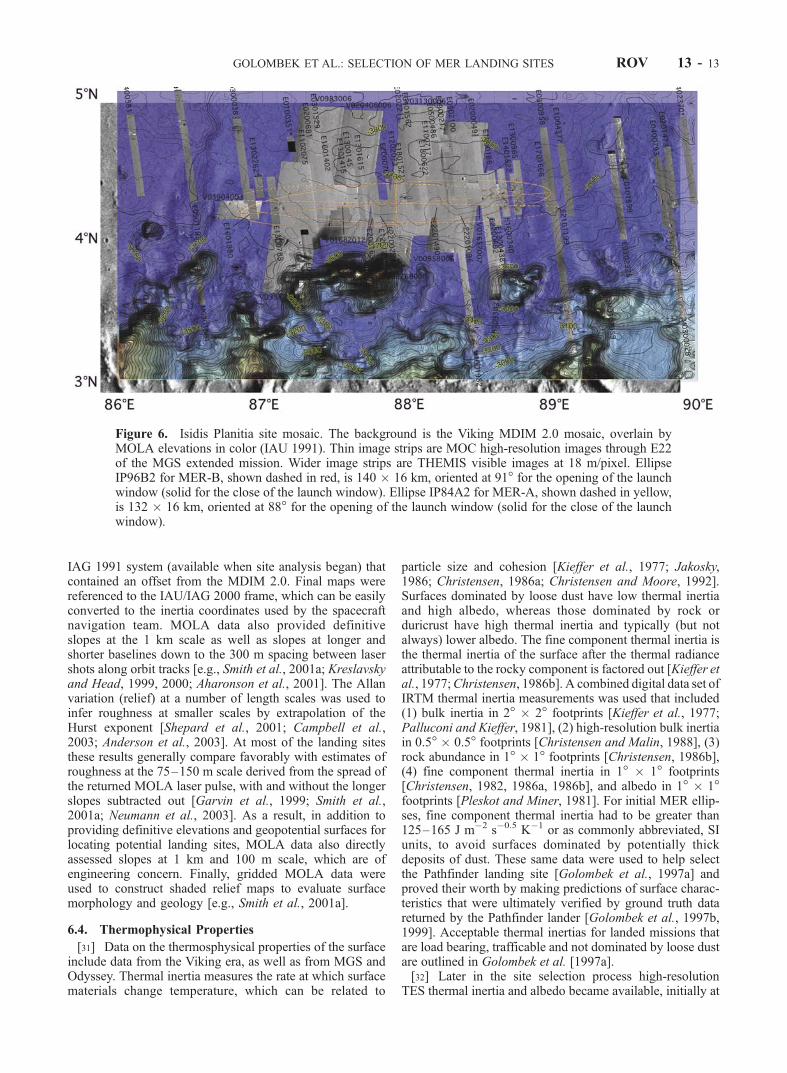
Figure 6. Isidis Planitia site mosaic. The background is the Viking MDIM 2.0 mosaic, overlain byMOLA elevations in color (IAU 1991). Thin image strips are MOC high-resolution images through E22of the MGS extended mission. Wider image strips are THEMIS visible images at 18 m/pixel. EllipseIP96B2 for MER-B, shown dashed in red, is 140 � 16 km, oriented at 91� for the opening of the launchwindow (solid for the close of the launch window). Ellipse IP84A2 for MER-A, shown dashed in yellow,is 132 � 16 km, oriented at 88� for the opening of the launch window (solid for the close of the launchwindow).
GOLOMBEK ET AL.: SELECTION OF MER LANDING SITES ROV 13 - 13
broad 100 km scale [Jakosky et al., 2000] and later in15 km/pixel [Mellon et al., 2000; Christensen et al., 2001a]and at roughly 3 km/pixel bins [Jakosky and Mellon, 2001].TES data confirmed the broad regions of low thermalinertia/high albedo observed in the IRTM data, but alsoshowed more variability at smaller spatial scale, includingthe identification of areas with high thermal inertia [Mellonet al., 2000], likely resulting from the greater presence ofrock and duricrust [e.g., Jakosky and Christensen, 1986;Mellon et al., 2000; Golombek et al., 2003b]. The amount ofdust cover at the landing sites was evaluated by the generalthermal inertia and albedo and the TES dust index, whichincludes a more explicit measure of the particle size [Ruffand Christensen, 2002]. High-resolution TES thermal iner-
tia data were also used to evaluate the surface properties ofthe landing sites [Jakosky and Mellon, 2001; Pelkey andJakosky, 2002]. These data were used to evaluate theminimum 1 m atmospheric temperature requirement of�97�C that placed more stringent constraints on bulkthermal inertia, which had to be greater than a line definedby a thermal inertia of 270 SI units at 0.30 albedo and athermal inertia of 210 SI units at 0.10 albedo [Martin et al.,2003]. Finally, THEMIS daytime and nighttime thermalimages at 100 m/pixel scale offered the ability to separateout thermophysical units that could be mapped contiguouslyacross the surface [Christensen et al., 2003a]. These imagesreveal the thermophysical properties of surface units atunprecedented scale, showing bare outcrop, rocky crater
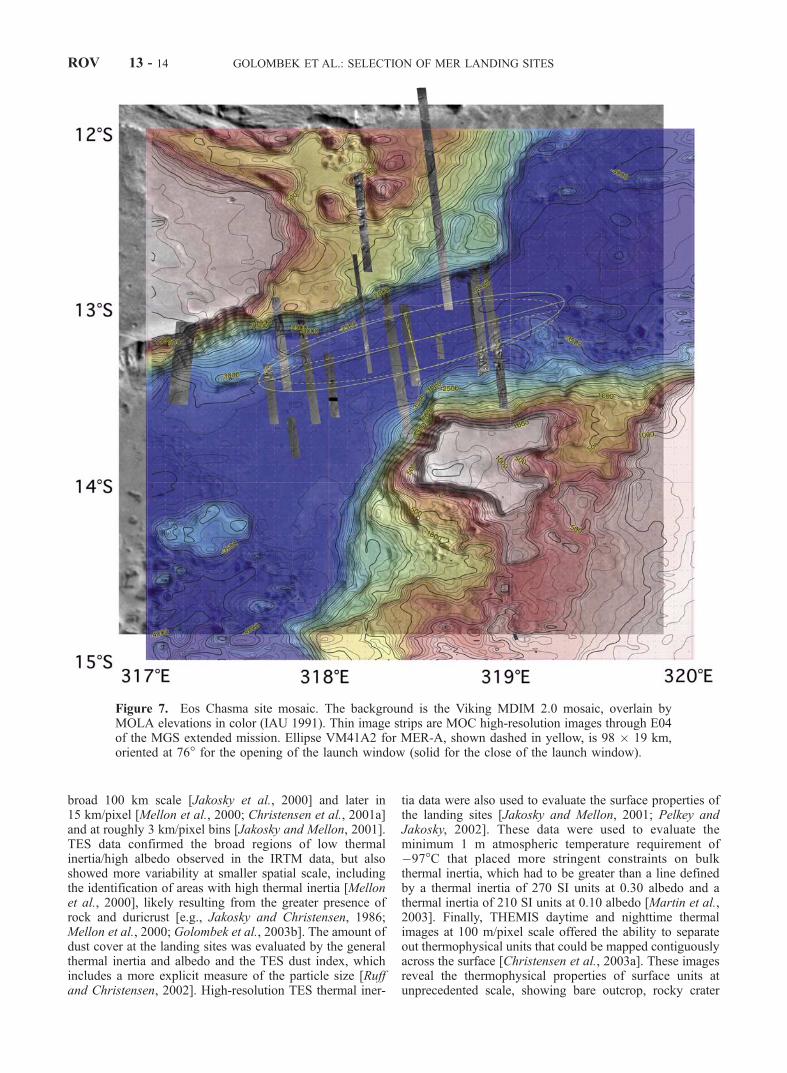
Figure 7. Eos Chasma site mosaic. The background is the Viking MDIM 2.0 mosaic, overlain byMOLA elevations in color (IAU 1991). Thin image strips are MOC high-resolution images through E04of the MGS extended mission. Ellipse VM41A2 for MER-A, shown dashed in yellow, is 98 � 19 km,oriented at 76� for the opening of the launch window (solid for the close of the launch window).
ROV 13 - 14 GOLOMBEK ET AL.: SELECTION OF MER LANDING SITES
ejecta, areas covered by significant thicknesses of dust, andmapable areas with different thermal inertia. Nighttimethermal images also provided a predawn estimate of thesurface temperature that were used to constrain the atmo-spheric temperatures the spacecraft will encounter.
6.5. Rocks
[33] Spectral differencing of the IRTM thermal data allowthe separation of the high-inertia and low-inertia compo-nents of the bulk inertia [Christensen, 1982, 1986a, 1986b].The models assume that rocky components make up thehigh-inertia component and are composed of rocks ofdiameter 0.1–0.15 m or greater. Despite the inability ofdistinguishing hazardous rocks from outcrop and nonuni-form distributions of rocks possible over the scale of thepixel (1� latitude � 1� longitude), all three landing siteshave rock abundance estimates within 20% relative to theIRTM value [Christensen, 1986b; Moore and Jakosky,1989; Moore and Keller, 1990, 1991; Golombek et al.,1999, 2003b]. Later preliminary TES estimates of rockabundance show similar average values at the landing sites,albeit with a greater range [Nowicki and Christensen, 1999].However, these estimates were not validated in time for usein the MER site evaluation effort.[34] Model rock size-frequency distributions for Mars
based on the Viking landing sites and a wide variety ofrocky locations on the Earth also allow an estimate of thenumber or area of rocks of any size range [Golombek andRapp, 1997]. The cumulative fractional area versus diameterdistributions follow simple exponential equations with thetotal area covered by all rocks provided by the IRTMestimate [Christensen, 1986b]. These models accuratelypredicted the overall rock distributions measured at the
Mars Pathfinder landing site as well as the number andarea of potentially hazardous rocks (diameters greater than1 m or 0.5 m high) [Golombek et al., 1999, 2003b].Golombek et al. [2003b] uses these model distributions tocalculate the probability of impacting potentially hazardousrocks at the prospective MER landing sites.
6.6. MOC and THEMIS Imaging Data
[35] Once specific landing sites were defined, requestswere made to obtain high-resolution MOC images at 1.5–6 m/pixel [Malin and Edgett, 2001]. These images are at anunprecedented resolution allowing identification of featuresat scales approaching that of the airbag-encased lander(�3 m). Although these images cover a small area (typicallanding site images were acquired at 3 m/pixel and are 3 kmwide and a few tens of kilometers long), over time most ofthe high-priority sites and ellipses had received significantMOC coverage. These closely spaced MOC images in theellipses allowed the first decameter-scale high-resolutionphotogeologic mapping on Mars. In addition, MOC imageswere acquired in both nadir views as well as pointed viaROTO maneuvers, which allowed the targeted acquisitionof stereo images at �3 m/pixel. Most nadir MOC imagesalso have a MOLA elevation track that allows assessment ofrelief of features present in the images [Anderson andGolombek, 2001; Soderblom and Kirk, 2003; Anderson etal., 2003]. Finally, THEMIS visible images at 18 m/pixelshowed broader areas at intermediate resolution, which inmost cases allowed the precise placement of MOC imageswithin the ellipse mosaics.[36] To obtain quantitative information on topography
and slopes within the ellipses, digital stereogrammetryand two-dimensional photoclinometry (PC, known more
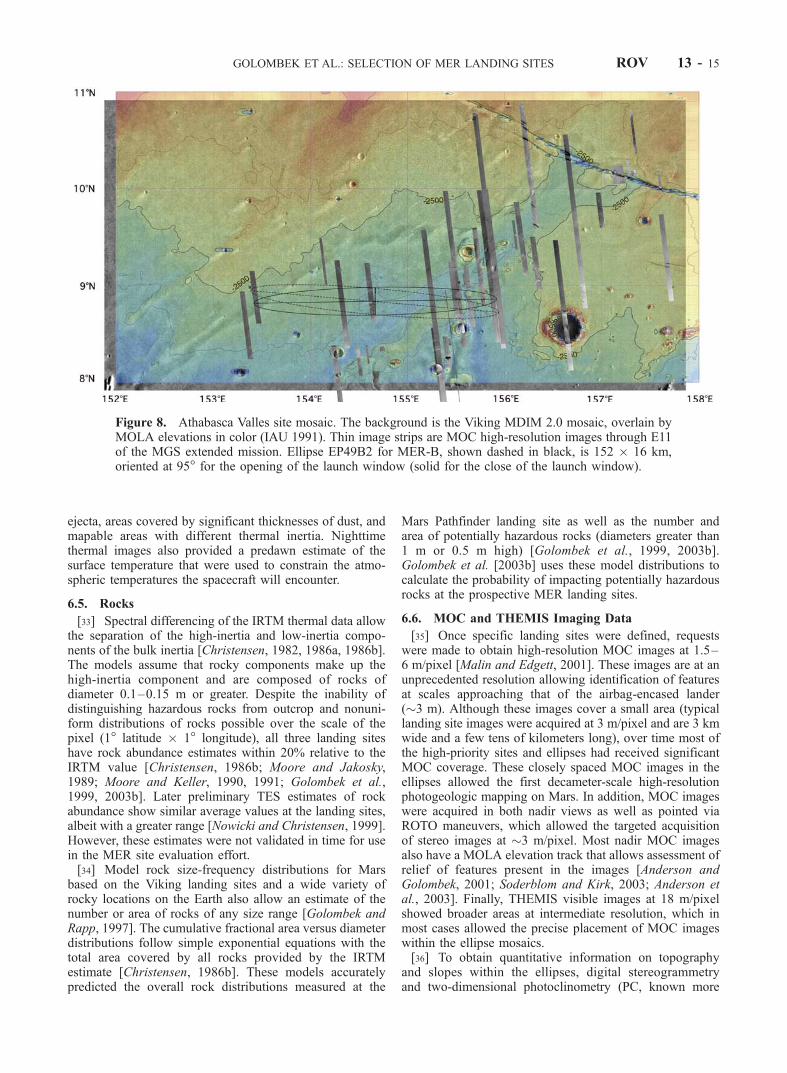
Figure 8. Athabasca Valles site mosaic. The background is the Viking MDIM 2.0 mosaic, overlain byMOLA elevations in color (IAU 1991). Thin image strips are MOC high-resolution images through E11of the MGS extended mission. Ellipse EP49B2 for MER-B, shown dashed in black, is 152 � 16 km,oriented at 95� for the opening of the launch window (solid for the close of the launch window).
GOLOMBEK ET AL.: SELECTION OF MER LANDING SITES ROV 13 - 15
descriptively as shape-from-shading) have been applied toMOC narrow-angle images of the candidate landing sites[Kirk et al., 2002, 2003; Ivanov and Lorre, 2002; Beyer andMcEwen, 2002; Beyer et al., 2003]. Because stereogram-metry is based on matching finite patches in two images, ityields digital elevation models (DEMs) with a horizontalresolution no better than 3 pixels, or 10 m for the 3 m/pixelMOC images used. Two-dimensional PC algorithms weretherefore used to construct DEMs of selected image regionswith single-pixel (�3 m) resolution [Kirk et al., 2003; Beyerand McEwen, 2002; Beyer et al., 2003]. The accuracy ofthese DEMs depends crucially on the validity of photomet-ric assumptions [Kirk et al., 2001]. While the surfacephotometry of Mars is adequately constrained [Kirk et al.,2000], the atmospheric haze contribution to any givenimage is essentially an unknown. The PC analysis istherefore calibrated by choosing a haze estimate that givesresults consistent with stereogrammetry. Such calibrationcan be uncertain to several tens of percent and is hence theleading error source in slope estimation by photoclinometry[Kirk et al., 2003], but morphologic units at the landing sitesare readily distinguished despite this level of error. Sum-mary statistics of roughness derived from the DEMs pro-duced by Kirk et al. [2003] provide an indication of therelative safety of different morphologic units in the landingsites and were used in numerical simulations of the landingprocess discussed in section 12. Slope maps of broadregions produced by point photoclinometry [Beyer andMcEwen, 2002; Beyer et al., 2003] were also used todelineate hazard units throughout the landing ellipses forcomparison with one another and with photogeologic map-ping results.
6.7. Radar Reflectivity and Roughness
[37] The MER landing depends critically upon the func-tioning of the on-board radar altimeter and decimeter todecameter length-scale roughness can negatively impact bothlanding and roving. Both of these properties can be addressedwith Earth-based radar data. Scattering of X-band (3.5 cmwavelength) and S-band (12.6 cm) radar energy is controlledin different incidence angle regions by surface roughnesselements at scales ranging from 1 to about 100 times thewavelength scale. Near nadir incidence backscattered energyis dominated bymirror-like, or specular reflections controlledby surface facets from 10 to 100 times the wavelength scale.The incidence angle dependence of this scattering behavior isdescribed well for Mars by the Hagfors model [Simpson etal., 1992; Butler, 1994; Haldemann et al., 1997], whichdepends on normal reflectivity, and a roughness parameter,related to root-mean-square (RMS) slope. Beyond the 10� ofnadir incidence, diffuse scattering is important. Diffusescattering as a function of backscatter incidence angle isgenerally well fit by a cosine raised to some power (generallybetween 1 and 2). Diffuse scattering is controlled by scales ofsurface roughness at or near the wavelength scale, which, forexample, can be associated with rocks. A more detailedsummary of the interpretation of Earth-based radar data forlanding site selection can be found in the work of Golombeket al. [1997a].[38] Generally however, the radar data are best evaluated
by comparing the information available for a proposed sitewith the information available from a known location,
either on Mars or Earth. Further, the radar data shouldnot be evaluated purely on their own merits, but inconjunction with other physical properties remote sensingdata sets. Haldemann et al. [2003; Radar properties of theproposed Mars Exploration Rover landing sites, submittedto Journal of Geophysical Research, 2003, hereinafterreferred to as Haldemann et al., submitted manuscript,2003] review all available Earth-based radar backscatterbehavior for all seven proposed landing sites as well as forboth Viking sites and the Pathfinder site. Specular anddiffuse scattering information is available at 3.5 cm for allthe landing sites from Goldstone Solar System Radar(GSSR) delay-Doppler experiments and GSSR-VLA (VeryLarge Array), respectively. Several of the landing ellipsesare sampled directly in both specular and diffuse scatteringregimes. When this is not the case, Haldemann et al. [2003;submitted manuscript, 2003] rely on data available for thesame Mars geologic unit as the ellipse. At 12.6 cm, AreciboObservatory data and some GSSR data exist for most of thesites in either or both scattering regimes. When data are notdirectly available at S-band, Haldemann et al. [2003;submitted manuscript, 2003] resort to the scattering modelparameters of Moore and Thompson [1991], which werebased on GSSR 12.6 cm experiments and other remotesensing properties.
7. Atmosphere Definition
7.1. Vertical Structure of the Atmosphere
[39] The atmosphere is one of the key constraints onwhere missions can land on Mars. Of particular importanceare the atmospheric density and vertical structure. Theycontrol a number of engineering issues in most landingsystems. In particular, they define the maximum elevation atwhich a given system can land safely. The main factorcontrolling the atmospheric density (and thus the potentiallanding elevations) is the CO2 seasonal cycle [Zurek et al.,1992]. Unfortunately for MER, the missions will land nearLs �335 which is near the minimum in the seasonalpressure cycle. This emphasized the need for accurateprofiles of temperature (T, in K), pressure ( p, in mbar)and density (r, in kg/m3) versus altitude (z, in km relative tothe MOLA geoid).[40] An atmospheric profile is affected by weather and
other time varying phenomena. Thus it is necessary toinvestigate the climatology for the landing site, seasonand local time. This leads to developing a set of dispersedprofiles covering the potential variability that can then beused in the Monte Carlo EDL modeling. These profiles needto capture the average behavior, the variability and thetypical vertical structure expected.[41] The MER atmosphere model was only developed for
two cases: MER-A at Ls �328, Local True Solar Time orLTST = 14:25 and MER-B at Ls �347, LTST = 12:40. TheMER-B landing changed to Ls = 339 and LTST �13:10after the case was developed, but this change will not have asignificant impact on the atmospheric model. Both modelsare designed to implicitly cover an equatorial latitude band(5�N to 15�S for MER-A and 10�N to 10�S for MER-B)and allow for the selection of surface elevations between�4.181 km and �0.3 km. For numerical simplicity, themodel uses the VL1 elevation (�3.681 km) as a reference
ROV 13 - 16 GOLOMBEK ET AL.: SELECTION OF MER LANDING SITES
altitude. To easily mesh with the rest of the EDL modeling,the atmosphere profiles are given a 1/4 km altitude grid.[42] In order to insure that each atmospheric profile is
internally consistent, we used the following approach. First,a reasonable random temperature profile is created. Next, asurface pressure at the VL1 reference elevation is randomlyselected. Combined with the hydrostatic approximation, thisdetermines the pressure profile. Using the temperature andpressure profiles, the density profile is easily derived fromthe ideal gas law with the appropriate Martian atmosphericconstants. This is done altitude by altitude based on thepressure and temperature profiles.[43] Constructing the temperature profile starts off with a
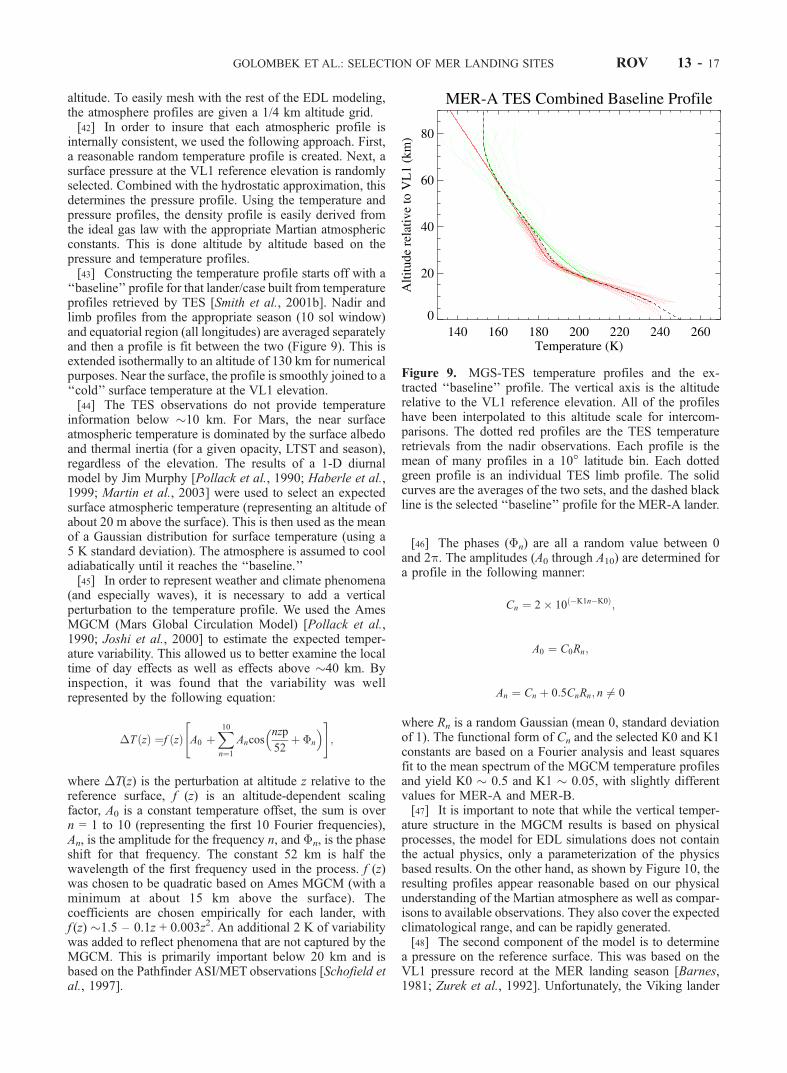
‘‘baseline’’ profile for that lander/case built from temperatureprofiles retrieved by TES [Smith et al., 2001b]. Nadir andlimb profiles from the appropriate season (10 sol window)and equatorial region (all longitudes) are averaged separatelyand then a profile is fit between the two (Figure 9). This isextended isothermally to an altitude of 130 km for numericalpurposes. Near the surface, the profile is smoothly joined to a‘‘cold’’ surface temperature at the VL1 elevation.[44] The TES observations do not provide temperature
information below �10 km. For Mars, the near surfaceatmospheric temperature is dominated by the surface albedoand thermal inertia (for a given opacity, LTST and season),regardless of the elevation. The results of a 1-D diurnalmodel by Jim Murphy [Pollack et al., 1990; Haberle et al.,1999; Martin et al., 2003] were used to select an expectedsurface atmospheric temperature (representing an altitude ofabout 20 m above the surface). This is then used as the meanof a Gaussian distribution for surface temperature (using a5 K standard deviation). The atmosphere is assumed to cooladiabatically until it reaches the ‘‘baseline.’’[45] In order to represent weather and climate phenomena
(and especially waves), it is necessary to add a verticalperturbation to the temperature profile. We used the AmesMGCM (Mars Global Circulation Model) [Pollack et al.,1990; Joshi et al., 2000] to estimate the expected temper-ature variability. This allowed us to better examine the localtime of day effects as well as effects above �40 km. Byinspection, it was found that the variability was wellrepresented by the following equation:
�TðzÞ ¼f ðzÞ A0 þX10n¼1
Ancosnzp
52þ �n
� �" #;
where �T(z) is the perturbation at altitude z relative to thereference surface, f (z) is an altitude-dependent scalingfactor, A0 is a constant temperature offset, the sum is overn = 1 to 10 (representing the first 10 Fourier frequencies),An, is the amplitude for the frequency n, and �n, is the phaseshift for that frequency. The constant 52 km is half thewavelength of the first frequency used in the process. f (z)was chosen to be quadratic based on Ames MGCM (with aminimum at about 15 km above the surface). Thecoefficients are chosen empirically for each lander, withf (z) �1.5 – 0.1z + 0.003z2. An additional 2 K of variabilitywas added to reflect phenomena that are not captured by theMGCM. This is primarily important below 20 km and isbased on the Pathfinder ASI/MET observations [Schofield etal., 1997].
[46] The phases (�n) are all a random value between 0and 2p. The amplitudes (A0 through A10) are determined fora profile in the following manner:
Cn ¼ 2� 10ð�K1n�K0Þ;
A0 ¼ C0Rn;
An ¼ Cn þ 0:5CnRn; n 6¼ 0
where Rn is a random Gaussian (mean 0, standard deviationof 1). The functional form of Cn and the selected K0 and K1constants are based on a Fourier analysis and least squaresfit to the mean spectrum of the MGCM temperature profilesand yield K0 � 0.5 and K1 � 0.05, with slightly differentvalues for MER-A and MER-B.[47] It is important to note that while the vertical temper-
ature structure in the MGCM results is based on physicalprocesses, the model for EDL simulations does not containthe actual physics, only a parameterization of the physicsbased results. On the other hand, as shown by Figure 10, theresulting profiles appear reasonable based on our physicalunderstanding of the Martian atmosphere as well as compar-isons to available observations. They also cover the expectedclimatological range, and can be rapidly generated.[48] The second component of the model is to determine
a pressure on the reference surface. This was based on theVL1 pressure record at the MER landing season [Barnes,1981; Zurek et al., 1992]. Unfortunately, the Viking lander
Figure 9. MGS-TES temperature profiles and the ex-tracted ‘‘baseline’’ profile. The vertical axis is the altituderelative to the VL1 reference elevation. All of the profileshave been interpolated to this altitude scale for intercom-parisons. The dotted red profiles are the TES temperatureretrievals from the nadir observations. Each profile is themean of many profiles in a 10� latitude bin. Each dottedgreen profile is an individual TES limb profile. The solidcurves are the averages of the two sets, and the dashed blackline is the selected ‘‘baseline’’ profile for the MER-A lander.
GOLOMBEK ET AL.: SELECTION OF MER LANDING SITES ROV 13 - 17

pressure data were coarsely digitized due to the limitedprecision of the lander electronics (despite the high preci-sion of the actual instrument), masking the diurnal cycle.The VL1 observations during the �60 sols of the pressureminimum (where the mean is constant) were averaged on anhourly basis. This produces the diurnal pressure cycle forthe season of interest. The cycle is very similar to the oneseen at Pathfinder (where it is clearly resolved in theobservations [Schofield et al., 1997; Haberle et al., 1999],despite it being at the opposite season.[49] The mean reference surface pressure for MER-A is
�8 mbar and for MER-B, �8.1 mbar. The difference is dueentirely to the diurnal cycle. After accounting for the diurnalcomponent, surface pressures at elevations of 0 km and�1.6 km are comparable to the ones estimated by Smith andZuber [1998] from preliminary MOLA data and AmesMGCM results. The mean is perturbed for each profile witha Gaussian random variable, using a standard deviation of�0.37 mbar. The variability is chosen to give about a 5%variation in surface density for a �1.3 km case. The MGCMresults and the Viking lander observations imply a variabil-ity closer to 0.2 mbar, but that is probably an underestimatefor the zonal band and elevation range the model covers. Itis also not clear that either the model or observationscaptures the full variability of Martian weather at thisseason.[50] Once the temperature profile and surface pressure
have been determined, the corresponding consistentpressure profile is then calculated using the hydrostaticapproximation:
pðziÞ ¼ pðzi�1Þ exp�2ðzi � zi�1Þ
HðziÞ þ Hðzi�1Þ
� �;
where p(zi) is the pressure at layer zi and H(zi) is the scaleheight at the altitude of layer zi. The starting altitude is the
VL1 reference altitude, using the surface temperature untilthe actual surface is reached. H(z) is calculated using
HðzÞ ¼ RTðzÞmgðzÞ ;
where R is the gas constant (8.3143 J/K/mol), m is the meanMartian atmospheric molecular weight (43.49 g/mol), andg(z) is the gravitational acceleration (m/s2) at an altitude of z(including the point source, J2 correction and corrioliscorrection). Note that while the units ofH are odd, they cancelcorrectly in the previous equation when z is in kilometers.
7.2. Wind Modeling
[51] The Pathfinder mission landed in the early morninghours during northern midsummer on the margins of theChryse basin, a time and place where the Martian atmo-sphere was relatively calm. By contrast, the MER rovers willbe landing just after midday, when the insolation is at thepeak and the atmosphere the most dynamic. Furthermore, theMER landing system has been modified from the Pathfindersystem and is quite sensitive to winds, wind shear (or gusts)and turbulence during the landing. Except at the two VikingLander sites and for a short period at the Mars Pathfindersite, there are few direct wind measurements from Marsitself. (Owing to payload mass and schedule constraints,neither MER carries a wind sensor and so will not add to thisdata set.) In the absence of representative wind data, numer-ical wind models, adapted to Mars from their terrestrialcounterparts, are used to provide estimates of the winds thatcould occur at selected landing sites. Previously (e.g., Vikingand Mars Polar Lander), GCMs [Pollack et al., 1990; Joshiet al., 2000; Richardson and Wilson, 2002] were used toestimate the meteorological environments for spacecraftlanding on Mars [e.g., Pollack et al., 1976]. These GCMshave global domains, but relatively coarse spatial resolution(many tens to a few hundred km).[52] Mesoscale Models (MMs) (MRAMS-Mars Regional
Atmospheric Modeling System [Rafkin and Michaels,2003]; Mars MM5 [Toigo and Richardson, 2003]) havemuch higher spatial resolution (�1 km horizontal gridspacing and vertical spacing that varies from �10 m nearthe surface to �300 m on average at higher altitudes).Current computational capabilities restrict their horizontaldomains to regions, whose time-dependent lateral boundaryconditions are specified. Often, the MMs use nested grids inwhich an outer grid is regional with resolutions matchingthe GCMs but then zoom in to much higher resolution on alocalized inner grid. Similar models have been used forweather forecasting on Earth for at least a decade but arenew to Mars. Because the lack of ‘‘ground truth’’ makes itdifficult to evaluate the numerical accuracy of the results,the analysis of the simulations reported herein focus onintercomparisons of the landing sites.[53] These models were analyzed in two ways to compare
the winds at the various landing sites [Kass et al., 2003]. Thefirst approach was a statistical analysis. This covered boththe effective (or mean) horizontal wind as it affects thelander as well as the shear and turbulence. An average overthe possible landing times and over the landing ellipse wasperformed. Given the smooth, flat nature of the landing sites,they did not show any geographic dependency within the
Figure 10. A family of 100 model temperature profilesproduced from the complete model for the MER-A case witha surface elevation of �1.3 km. The solid red curve is themean of the family (useful as a nominal case), and the dashedgreen lines show the one standard deviation in temperature ateach altitude. Note that these are not expected profiles(instead, each individual profile will vary with altitude).
ROV 13 - 18 GOLOMBEK ET AL.: SELECTION OF MER LANDING SITES
landing error ellipses, although there were both temporal andspatially random ‘‘chaotic’’ variability at all the sites. Sig-nificant differences between sites were largely due to effectsof the complex regional topography (e.g., crater versuscanyon). This analysis allowed for the sites to be easilycompared and gave a preliminary look at site safety. As partof a more detailed Monte Carlo engineering analysis, anumber of wind profiles from each site were randomlyselected and augmented by adding in the high-frequencyturbulence not directly represented by the mesoscale models.
8. Final Landing Sites
8.1. Third Landing Site Workshop
[54] The Third open Landing Site Workshop for the MarsExploration Rovers was held in Pasadena, CA, in March of2002 and dealt exclusively with discussion of the MeridianiPlanum (Figure 3), Gusev crater (Figure 4), Isidis Planitia(Figure 6),Melas Chasma (Figure 5), Eos Chasma (Figure 7),and Athabasca Valles (Figure 8) sites. Focus was ondetailed presentation of engineering concerns and con-straints and discussion of scientific hypotheses relevant tothe science objectives of the mission that could be tested
using the Athena science payload on board the rovers[Golombek et al., 2003a]. Table 5 summarizes the outcomeof the meeting, which was generated from communitydiscussion and consensus on the last day of the workshopand includes consideration of the probable ‘‘public engage-ment potential’’ of the sites.[55] With respect to science, emphasis was placed on the
relative merits of the sites for preserving evidence for pastwater activity, the likelihood of encountering an addressablegeologic and climatic history, and the possibility for pres-ervation of either biotic or prebiotic materials (Table 5). Onthe basis of these criteria, the Meridiani and Gusev siteswere deemed the highest priority because of the possibilityof constraining the origin of the coarse-grained hematite andassociated deposits and for accessing paleo-lacustrine mate-rials, respectively [e.g., Arvidson et al., 2003; Cabrol et al.,2003; Greeley et al., 2003]. The Isidis and Melas sites weredeemed slightly lower in priority overall primarily becauseof concerns related to the preservation potential of organicsand possible issues regarding dust, rock abundance, and/orrover trafficability [e.g., Weitz et al., 2003; Crumpler andTanaka, 2003]. Overall science potential was deemed low-est at Eos and Athabasca Valles due to a variety of factors
Table 5. Summary of MER Landing Site Criteria After Third Landing Site Workshopa
Major Questions/Criteria
Landing Sitesb
Meridiani Gusev Isidis Melas Eos Athabasca
Science Criteriac
Evidence for water activity O O O O O OClimate/geologic history addressable O O O O O . . .May preserve (pre) biotic materials O O . . . . . . . . . . . .Enables hypothesis testing O O O . . . . . . OAccessible diversity within the site O . . . O . . . . . . ODiffers from other MER sites O O O O O ODiffers from VL and MPF sites O O O O O OHas materials for Athena analyses O O O O O OAcceptable rock abundance . . . . . . O . . . O OGood site trafficability O O . . . . . . . . . XDegree of dust obscuration O . . . . . . O O . . .Expected mission lifetime . . . . . . O O O . . .Relief at scale of Rover traverse . . . . . . . . . O . . . OHas potential Earth analogs O O O O O O
Safety Criteria1 km slope <2� O O O X X O100 m slope <5� O O O X . . . O10 m slope <15� O . . . . . . X . . . OAny local high relief (craters)? O . . . . . . X . . . . . .Rock abundance/trafficability? O O . . . . . . X XNo potentially hazardous rocks O O . . . . . . X . . .Horizontal winds (shear/turbulence) O . . . . . . . . . . . . . . .Horizontal winds (sustained mean) O . . . . . . X X . . .Acceptable vertical winds . . . O . . . . . . . . . . . .Expected temperature at site . . . . . . O . . . O . . .Local dust environment O . . . . . . O O . . .Surface is load bearing O O O O O OElevation less than �1.3 km (MOLA defined) O O O O O ORadar reflectivity >0.03 O O O O O O
Public EngagementSite aesthetics . . . . . . O O O OSite differs from VL or MPF sites O O . . . O O OPotential habitability for life O O . . . . . . . . . . . .Explainable to public O O O O O O
aDoes not include criteria such as latitude, site separation, etc., used to distinguish sites prior to 3rd Workshop.bO, no obvious concerns with respect to parameter; . . ., potential concerns with respect to parameter; X, recognized concerns with
respect to parameter.cTop three science criteria are considered to be the highest priority for all sites.
GOLOMBEK ET AL.: SELECTION OF MER LANDING SITES ROV 13 - 19

(Table 5). Trafficability at Athabasca was as a major sourceof concern as limited mobility could preclude or hinderattaining mission science objectives [McEwen et al., 2001;Burr et al., 2002a, 2002b; Haldemann et al., submittedmanuscript, 2003].[56] Discussion of engineering, or safety criteria (Table 5)
produced a similar consensus on the relative merits and/orconcerns of the landing sites. The Meridiani site clearlypossesses the fewest potential risks to landing and mobility,whereas Gusev and Isidis are slightly riskier as a result ofconcerns related to the potential for relief and local slopes,dust, and winds (especially the horizontal component andpossible associated shear, see Kass et al. [2003]). Hazardsrelated to high horizontal winds and slopes at all lengthscales are even more apparent at the Melas and Eos canyonsites, with additional potential concerns related to high rockabundance. At Athabasca, concerns related mostly to radar-implied decimeter-scale roughness [McEwen et al., 2001;Haldemann et al., submitted manuscript, 2003] that couldsignificantly impact the ability to land safely and/or navi-gate on the surface. The expected low nighttime temper-atures, local dust environment, winds, and rock abundancecomprise additional potential issues at Athabasca.[57] The science and safety criteria discussed above
provided a template for more general decisions regardingthe status of the individual sites emerging from the thirdworkshop. The public engagement potential was deemedacceptable for all of the sites and was not used as a majordiscriminator. Broad concurrence was reached regarding thestatus of the Meridiani and Gusev sites as the highestpriority from a science perspective, with Gusev carryingsome uncertainty regarding potential wind shear (associatedwith the potential presence of a low-latitude jet crossingrelief forming the bounding crater rim, see section 10 andKass et al. [2003]) and accessibility of desired materials.Concerns related to the geologic provenance of materials atthe Isidis site and potential occurrence of significant slopewinds resulted in a slightly lower ranking, whereas concernsrelated to high winds, slopes, and rock abundance at Melasand Eos resulted in their being removed from considerationas potential sites. Finally, issues related to occurrence ofsignificant decimeter-scale surface roughness at the Atha-basca site coupled with somewhat lower perceived sciencepotential led to the demotion of this site to a backup andlater removal from further consideration.[58] All of the above events and decisions were unani-
mously supported by the Landing Site Steering Committeeand received the concurrence of both the MER Project andAthena Science Team. The realization, however, that the listof viable landing sites had been narrowed to Meridiani,
Gusev, and Isidis following the third workshop coupledwith the recognition that winds were an important safetyconsideration led to identification of a fourth ‘‘wind safe’’site located to the southwest of Elysium Mons in UtopiaPlanitia. A detailed discussion of the science and engineer-ing potential and concerns related to these final four sites setthe stage for discussions at the fourth open workshop.
8.2. Identification of a Low-Wind Site
[59] The search for a safe, low-wind site involved iden-tifying atmospherically quiet regions in two global circula-tion models (GCM) for the season and time of arrival [Joshiet al., 2000; Richardson and Wilson, 2002]. Both modelswere run in high-resolution modes (with �2� grids). Thiswas found to be marginal for resolving many intermediatesized topographic features (e.g., Gusev crater or VallesMarineris), but did resolve many larger features (e.g., Isidisbasin or Elysium Mons). For each model, the winds wereexamined at altitudes of �1 km, �3 km and �5 km. Ateach level, a 10-Sol mean and variance were calculated for aLTST window around the landing times. In addition theMRAMS medium resolution (�1� grid) results were alsoused, where available [Rafkin and Michaels, 2003].[60] Because definition of low-wind regions were the
prime consideration, latitudinal (15�S to 10�N) and eleva-tion (less than �1.3 km) constraints were relaxed from thoseoriginally considered to include areas up to 15�N and areasup to 0 km elevation (Figure 11). Four potential areas wereinvestigated: east of the existing Meridiani site, northernIsidis, southeast of Isidis, and Elysium Planitia. The regionssouth and east of VL1 were also considered briefly, butwere rejected given that the GCMs indicate these areas to bepotential pathways (i.e., ‘‘storm tracks’’) for weather sys-tems generated at high northern latitudes during the seasonof MER arrival and moving down over the Acidalia-Chryselowlands [Hollingsworth et al., 1996; Collins et al., 1996].Such storms could also reach into the northern Isidis regionvia the Utopia-Elysium pathway. In contrast, the GCMssuggested that the other regions would have light winds,and this was supported for the Meridiani and Elysium sitesby detailed mesoscale model runs [Rafkin and Michaels,2003].[61] A handful of prospective sites were identified in each
area and evaluated on the basis of science potential andsafety. The sites east of Meridiani are likely too cold (i.e.,low thermal inertia) and too close to the existing site(thereby reducing mission data return due to competitionfor UHF downlink relay via orbiters) and the areas southeastof Isidis were deemed to have low science appeal. The siteswith the highest science interest were in the highland/
Figure 11. Topographic map of 15�N–10�S showing areas evaluated for low-wind ellipses. Areas indeep blue are below �1.5 km elevation, and areas in green and orange are above 0 km elevation. Areas inlight blue are above �1.5 km and below 0 km in elevation. Four main areas in light blue are easternMeridiani (EM), southeast of Isidis (SEI), south of VL1 (SVL1), and Amazonis Planitia, which is toodusty (TD).
ROV 13 - 20 GOLOMBEK ET AL.: SELECTION OF MER LANDING SITES
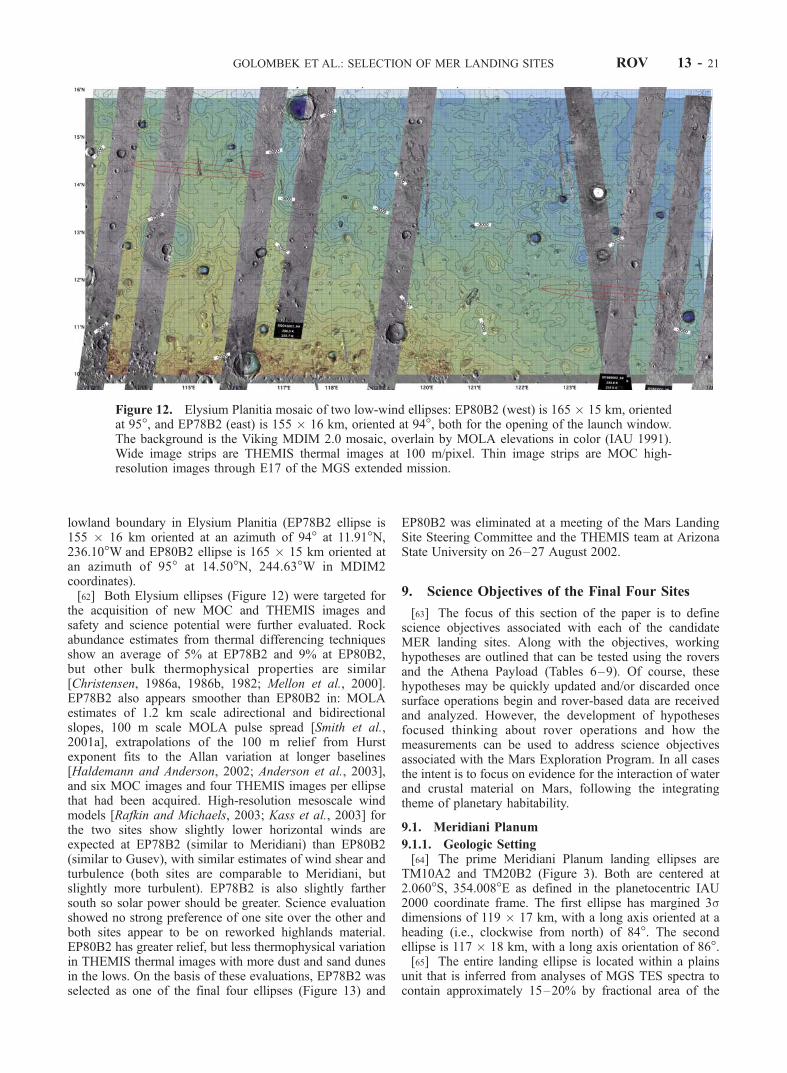
lowland boundary in Elysium Planitia (EP78B2 ellipse is155 � 16 km oriented at an azimuth of 94� at 11.91�N,236.10�W and EP80B2 ellipse is 165 � 15 km oriented atan azimuth of 95� at 14.50�N, 244.63�W in MDIM2coordinates).[62] Both Elysium ellipses (Figure 12) were targeted for
the acquisition of new MOC and THEMIS images andsafety and science potential were further evaluated. Rockabundance estimates from thermal differencing techniquesshow an average of 5% at EP78B2 and 9% at EP80B2,but other bulk thermophysical properties are similar[Christensen, 1986a, 1986b, 1982; Mellon et al., 2000].EP78B2 also appears smoother than EP80B2 in: MOLAestimates of 1.2 km scale adirectional and bidirectionalslopes, 100 m scale MOLA pulse spread [Smith et al.,2001a], extrapolations of the 100 m relief from Hurstexponent fits to the Allan variation at longer baselines[Haldemann and Anderson, 2002; Anderson et al., 2003],and six MOC images and four THEMIS images per ellipsethat had been acquired. High-resolution mesoscale windmodels [Rafkin and Michaels, 2003; Kass et al., 2003] forthe two sites show slightly lower horizontal winds areexpected at EP78B2 (similar to Meridiani) than EP80B2(similar to Gusev), with similar estimates of wind shear andturbulence (both sites are comparable to Meridiani, butslightly more turbulent). EP78B2 is also slightly farthersouth so solar power should be greater. Science evaluationshowed no strong preference of one site over the other andboth sites appear to be on reworked highlands material.EP80B2 has greater relief, but less thermophysical variationin THEMIS thermal images with more dust and sand dunesin the lows. On the basis of these evaluations, EP78B2 wasselected as one of the final four ellipses (Figure 13) and
EP80B2 was eliminated at a meeting of the Mars LandingSite Steering Committee and the THEMIS team at ArizonaState University on 26–27 August 2002.
9. Science Objectives of the Final Four Sites
[63] The focus of this section of the paper is to definescience objectives associated with each of the candidateMER landing sites. Along with the objectives, workinghypotheses are outlined that can be tested using the roversand the Athena Payload (Tables 6–9). Of course, thesehypotheses may be quickly updated and/or discarded oncesurface operations begin and rover-based data are receivedand analyzed. However, the development of hypothesesfocused thinking about rover operations and how themeasurements can be used to address science objectivesassociated with the Mars Exploration Program. In all casesthe intent is to focus on evidence for the interaction of waterand crustal material on Mars, following the integratingtheme of planetary habitability.
9.1. Meridiani Planum
9.1.1. Geologic Setting[64] The prime Meridiani Planum landing ellipses are
TM10A2 and TM20B2 (Figure 3). Both are centered at2.060�S, 354.008�E as defined in the planetocentric IAU2000 coordinate frame. The first ellipse has margined 3sdimensions of 119 � 17 km, with a long axis oriented at aheading (i.e., clockwise from north) of 84�. The secondellipse is 117 � 18 km, with a long axis orientation of 86�.[65] The entire landing ellipse is located within a plains
unit that is inferred from analyses of MGS TES spectra tocontain approximately 15–20% by fractional area of the
Figure 12. Elysium Planitia mosaic of two low-wind ellipses: EP80B2 (west) is 165 � 15 km, orientedat 95�, and EP78B2 (east) is 155 � 16 km, oriented at 94�, both for the opening of the launch window.The background is the Viking MDIM 2.0 mosaic, overlain by MOLA elevations in color (IAU 1991).Wide image strips are THEMIS thermal images at 100 m/pixel. Thin image strips are MOC high-resolution images through E17 of the MGS extended mission.
GOLOMBEK ET AL.: SELECTION OF MER LANDING SITES ROV 13 - 21
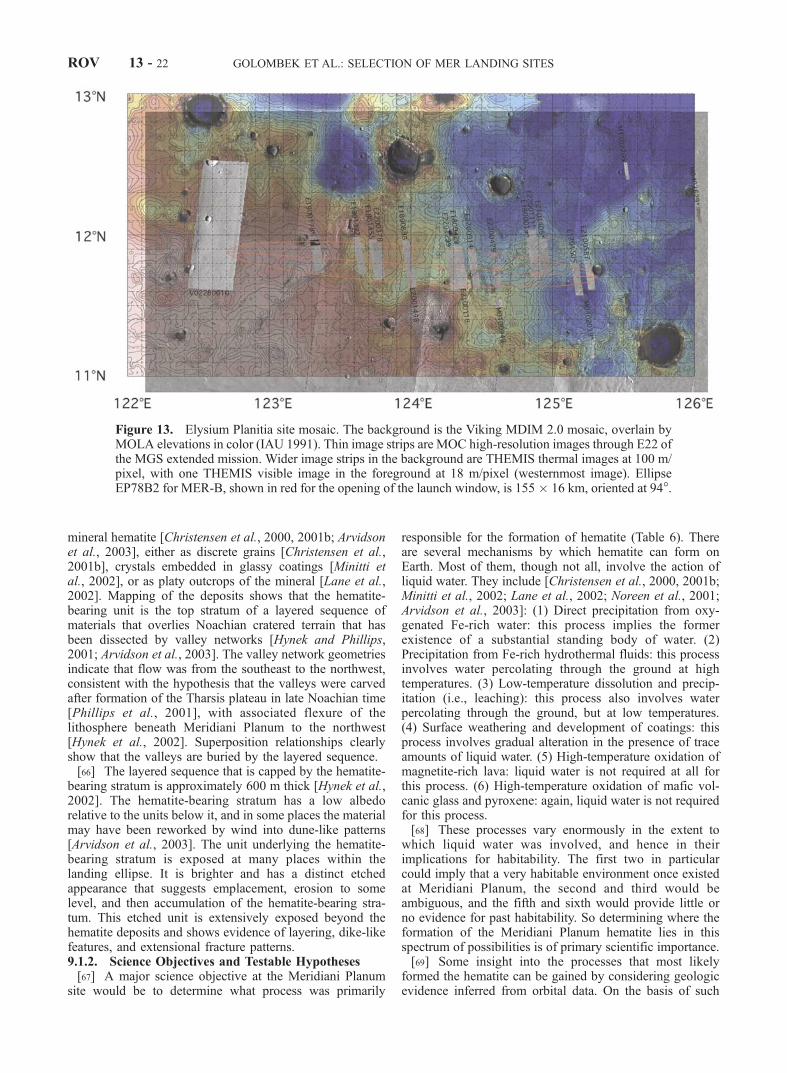
mineral hematite [Christensen et al., 2000, 2001b; Arvidsonet al., 2003], either as discrete grains [Christensen et al.,2001b], crystals embedded in glassy coatings [Minitti etal., 2002], or as platy outcrops of the mineral [Lane et al.,2002]. Mapping of the deposits shows that the hematite-bearing unit is the top stratum of a layered sequence ofmaterials that overlies Noachian cratered terrain that hasbeen dissected by valley networks [Hynek and Phillips,2001; Arvidson et al., 2003]. The valley network geometriesindicate that flow was from the southeast to the northwest,consistent with the hypothesis that the valleys were carvedafter formation of the Tharsis plateau in late Noachian time[Phillips et al., 2001], with associated flexure of thelithosphere beneath Meridiani Planum to the northwest[Hynek et al., 2002]. Superposition relationships clearlyshow that the valleys are buried by the layered sequence.[66] The layered sequence that is capped by the hematite-
bearing stratum is approximately 600 m thick [Hynek et al.,2002]. The hematite-bearing stratum has a low albedorelative to the units below it, and in some places the materialmay have been reworked by wind into dune-like patterns[Arvidson et al., 2003]. The unit underlying the hematite-bearing stratum is exposed at many places within thelanding ellipse. It is brighter and has a distinct etchedappearance that suggests emplacement, erosion to somelevel, and then accumulation of the hematite-bearing stra-tum. This etched unit is extensively exposed beyond thehematite deposits and shows evidence of layering, dike-likefeatures, and extensional fracture patterns.9.1.2. Science Objectives and Testable Hypotheses[67] A major science objective at the Meridiani Planum
site would be to determine what process was primarily
responsible for the formation of hematite (Table 6). Thereare several mechanisms by which hematite can form onEarth. Most of them, though not all, involve the action ofliquid water. They include [Christensen et al., 2000, 2001b;Minitti et al., 2002; Lane et al., 2002; Noreen et al., 2001;Arvidson et al., 2003]: (1) Direct precipitation from oxy-genated Fe-rich water: this process implies the formerexistence of a substantial standing body of water. (2)Precipitation from Fe-rich hydrothermal fluids: this processinvolves water percolating through the ground at hightemperatures. (3) Low-temperature dissolution and precip-itation (i.e., leaching): this process also involves waterpercolating through the ground, but at low temperatures.(4) Surface weathering and development of coatings: thisprocess involves gradual alteration in the presence of traceamounts of liquid water. (5) High-temperature oxidation ofmagnetite-rich lava: liquid water is not required at all forthis process. (6) High-temperature oxidation of mafic vol-canic glass and pyroxene: again, liquid water is not requiredfor this process.[68] These processes vary enormously in the extent to
which liquid water was involved, and hence in theirimplications for habitability. The first two in particularcould imply that a very habitable environment once existedat Meridiani Planum, the second and third would beambiguous, and the fifth and sixth would provide little orno evidence for past habitability. So determining where theformation of the Meridiani Planum hematite lies in thisspectrum of possibilities is of primary scientific importance.[69] Some insight into the processes that most likely
formed the hematite can be gained by considering geologicevidence inferred from orbital data. On the basis of such
Figure 13. Elysium Planitia site mosaic. The background is the Viking MDIM 2.0 mosaic, overlain byMOLA elevations in color (IAU 1991). Thin image strips are MOC high-resolution images through E22 ofthe MGS extended mission. Wider image strips in the background are THEMIS thermal images at 100 m/pixel, with one THEMIS visible image in the foreground at 18 m/pixel (westernmost image). EllipseEP78B2 for MER-B, shown in red for the opening of the launch window, is 155 � 16 km, oriented at 94�.
ROV 13 - 22 GOLOMBEK ET AL.: SELECTION OF MER LANDING SITES

Table
6.MeridianiPlanum
Sitea
Topic
Hypotheses
tobeEvaluated
Key
Observations
Key
MeasurementRequirem
ents
Implications
Hem
atiteoccurrence
Ishem
atitepresent?
Unequivocalevidence
forthe
presence
ofhem
atiteinferred
from
Athenaobservations.
Pancam
multispectral
and
Mini-TESmosaics,combined
withdetailedobservationsof
key
depositsto
deriveandanalyze
reflectance
andem
issionspectra.
Mossbauer
spectra.
Validationofinferencesfrom
TES.
Key
groundtruth
fororbital
observationsin
general
since
thesite
isthoughtto
beunusual
inmineralogical
properties.
Startingpointforfurther
dataacquisition
andhypothesistesting.
Hem
atiteform
ation
mechanisms
Did
hem
atiteform
via
aqueousprocesses
and
under
what
environmental
conditions?
Hem
atiteoccurrence
detailed
anddetermined
tobedueto
platy
outcrops,discrete
speculargrains,oras
hem
atite
particles
embedded
involcanic
glass
oras
coatingsonlithic
fragmentsofbasalticorother
composition.
Mineralsform
edwith
hem
atitedefined
andinferences
derived
asto
whether
theensemble
form
edvia
low-tem
perature
(lacustrine)
orhigh-tem
perature
(hydrothermal)aqueousprocesses
orvia
anhydrousoxidation
(magmatic
oram
bient).
Localgeologic
setting
defined,includinggrain
size
distributionsandother
textural
param
eters,presence
oflayering
andprimarysedim
entary
features,
includinghow
hem
atite-bearing
depositsfitin.
Ensemble
ofAthenaobservations.
Theextentto
whichthedepositsform
edorweremodifiedbyaqueousprocesses.
Environmentalconditionsassociated
withaqueousprocesses
(lacustrine,
hydrothermal)orperhapsanhydrous
oxidationandassociated
environmental
conditions.
Implicationsforpreservation
ofbiosignaturesthroughthedevelopment
ofcoatingsandother
mineralsthat
form
edwhen
hem
atiteform
ed(e.g.,silica
deposits).
Implicationsforgeochem
ical
cycles
of
biological
relevance.
Geologic
settingassociated
withhem
atite-bearing
materials
Are
hem
atite-bearing
materialsthetopstratum
ofan
extensivelayered
depositdraped
over
the
ancientcratered
terrain?
Did
thelayered
deposits
form
via
lacustrine,
volcaniclastic,orother
means?
Isbasaltpresentas
indicated
byTESspectra?
Explorationandcharacterization
ofthedarkmaterialsevidentat
thesite
asplainsanddarkdunes.
Explorationandcharacterization
ofthebrightsubstrate
evidentat
thesite
assubdued
crater
rims,
brightplains,andbrightdunes.
Searchforandcharacterize
crater
ejecta
from
underlyingcratered
terraincrust.
Use
alldatato
develop
stratigraphic
columnandtestthe
model
withcontinued
observations.
Mobilityto
get
tovarious
locationsandtheensemble
of
Athenaobservationsto
characterize
thesitesandmaterials.
OMEGA
hyperspectral
observations
(0.36-5.2
mm)to
providemineralogical
inferencesat
few
hundredmeter
scale
(acquisitionwhileMERisoperational).
Fundam
entalto
understandingifthelanding
site
islocatedontheupper
strata
ofavast
lacustrine(ormarine)
depositorifthesite
isonthetopofathick(hundredsofmeters)
volcaniclastic
pile,
withorwithoutevidence
foraqueousalterationprocesses.
Implicationsfordefiningplanetaryhabitability
andtheextentto
whichsubsurfaceorsurface
habitatsmay
haveexisted.
aCompiled
byR.ArvidsonandF.Seelos.Pros:specific,well-defined
hypotheses
canbetested
thatrelateto
thegeologichistory
andsetofprocesses
thathaveoperated,withafocusontheextentto
whichaqueous
processes
havebeeninvolved.TheAthenapayload
andtheMERmobilitysystem
areverywellmatched
totestingthehypotheses.Spectralsignaturesrelativeto
therestoftheplanetandthelow-albedo,dust-freenature
ofthesite
makeitagoodsite
forgroundtruth
calibrationoforbital
data.
Cons:theremay
notbeevidence
foraqueousprocesses
andthesite
does
nothavealotoftopographyforexcitingvistas.
GOLOMBEK ET AL.: SELECTION OF MER LANDING SITES ROV 13 - 23
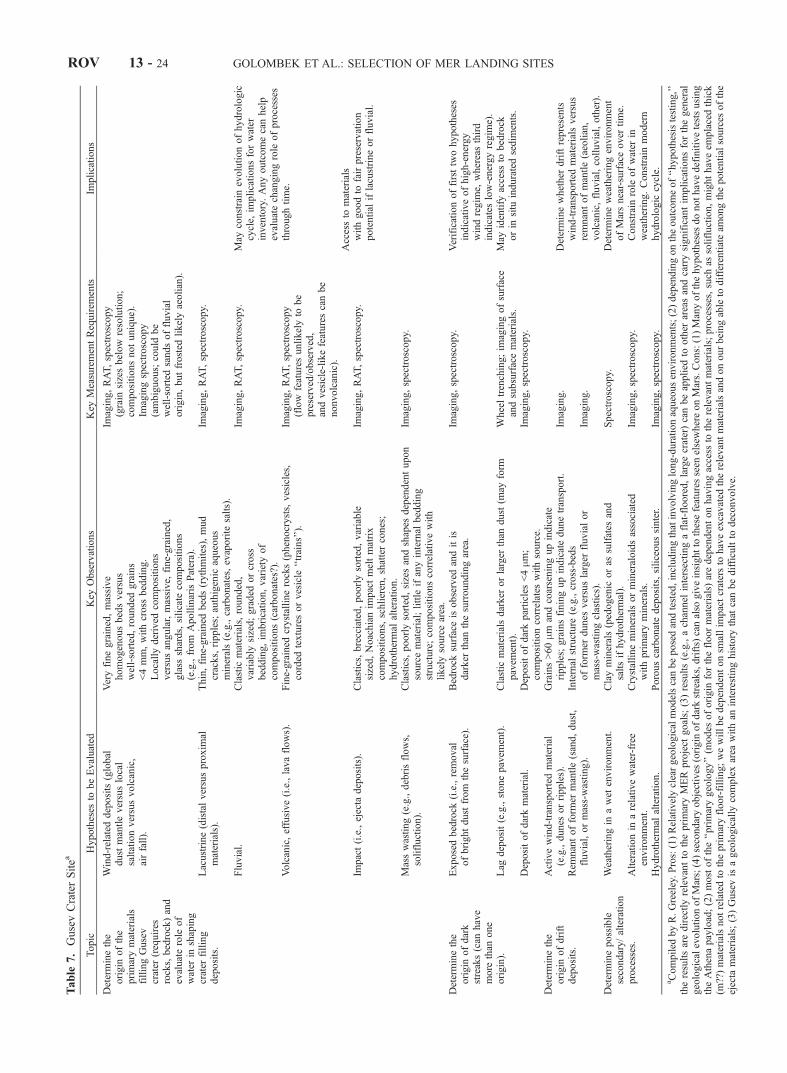
Table
7.GusevCraterSitea
Topic
Hypotheses
tobeEvaluated
Key
Observations
Key
MeasurementRequirem
ents
Implications
Determinethe
origin
ofthe
primarymaterials
fillingGusev
crater
(requires
rocks,bedrock)and
evaluaterole
of
water
inshaping
crater
filling
deposits.
Wind-related
deposits(global
dustmantleversuslocal
saltationversusvolcanic,
airfall).
Lacustrine(distalversusproxim
almaterials).
Fluvial.
Volcanic,effusive(i.e.,lavaflows).
Impact(i.e.,ejecta
deposits).
Masswasting(e.g.,debrisflows,
solifluction).
Veryfinegrained,massive
homogenousbedsversus
well-sorted,rounded
grains
<4mm,withcross
bedding.
Locallyderived
compositions
versusangular,massive,
fine-grained,
glass
shards,silicate
compositions
(e.g.,from
ApollinarisPatera).
Thin,fine-grained
beds(rythmites),mud
cracks,ripples;authigenic
aqueous
minerals(e.g.,carbonates,evaporite
salts).
Clastic
materials,rounded,
variably
sized;graded
orcross
bedding,im
brication,variety
of
compositions(carbonates?).
Fine-grained
crystallinerocks(phenocrysts,vesicles,
corded
texturesorvesicle
‘‘trains’’).
Clastics,brecciated,poorlysorted,variable
sized,Noachianim
pactmeltmatrix
compositions,schlieren,shattercones;
hydrothermal
alteration.
Clastics,poorlysorted,sizesandshapes
dependentupon
sourcematerial;little
ifanyinternal
bedding
structure;compositionscorrelativewith
likelysourcearea.
Imaging,RAT,spectroscopy
(grain
sizesbelow
resolution;
compositionsnotunique).
Imagingspectroscopy
(ambiguous;could
be
well-sorted
sandsoffluvial
origin,butfrosted
likelyaeolian).
Imaging,RAT,spectroscopy.
Imaging,RAT,spectroscopy.
Imaging,RAT,spectroscopy
(flow
featuresunlikelyto
be
preserved/observed,
andvesicle-likefeaturescanbe
nonvolcanic).
Imaging,RAT,spectroscopy.
Imaging,spectroscopy.
May
constrain
evolutionofhydrologic
cycle,
implicationsforwater
inventory.Anyoutcomecanhelp
evaluatechangingrole
ofprocesses
throughtime.
Accessto
materials
withgoodto
fairpreservation
potential
iflacustrineorfluvial.
Determinethe
origin
ofdark
streaks(can
have
more
than
one
origin).
Exposedbedrock
(i.e.,removal
ofbrightdustfrom
thesurface).
Lag
deposit(e.g.,stonepavem
ent).
Depositofdarkmaterial.
Bedrock
surfaceisobserved
anditis
darker
than
thesurroundingarea.
Clastic
materialsdarker
orlarger
than
dust(m
ayform
pavem
ent).
Depositofdarkparticles
<4mm
;compositioncorrelates
withsource.
Imaging,spectroscopy.
Wheeltrenching;im
agingofsurface
andsubsurfacematerials.
Imaging,spectroscopy.
Verificationoffirsttwohypotheses
indicativeofhigh-energy
windregim
e,whereasthird
indicates
low-energyregim
e).
May
identify
access
tobedrock
orin
situ
induratedsedim
ents.
Determinethe
origin
ofdrift
deposits.
Activewind-transported
material
(e.g.,dunes
orripples).
Rem
nantofform
ermantle(sand,dust,
fluvial,ormass-wasting).
Grains>60mm
andcoarseningupindicate
ripples;grainsfiningupindicatedunetransport.
Internal
structure
(e.g.,cross-beds
ofform
erdunes
versuslarger
fluvialor
mass-wastingclastics).
Imaging.
Imaging.
Determinewhether
driftrepresents
wind-transported
materialsversus
remnantofmantle(aeolian,
volcanic,fluvial,colluvial,other).
Determinepossible
secondary/alteration
processes.
Weatheringin
awet
environment.
Alterationin
arelativewater-free
environment.
Hydrothermal
alteration.
Clayminerals(pedogenic
oras
sulfates
and
saltsifhydrothermal).
Crystallinemineralsormineraloidsassociated
withprimaryminerals.
Porouscarbonatedeposits,siliceoussinter.
Spectroscopy.
Imaging,spectroscopy.
Imaging,spectroscopy.
Determineweatheringenvironment
ofMarsnear-surfaceover
time.
Constrain
role
ofwater
inweathering.Constrain
modern
hydrologic
cycle.
aCompiled
byR.Greeley.Pros:(1)Relativelycleargeologicalmodelscanbeposedandtested,includingthatinvolvinglong-durationaqueousenvironments;(2)dependingontheoutcomeof‘‘hypothesistesting,’’
theresultsaredirectlyrelevantto
theprimaryMERproject
goals;(3)results(e.g.,achannel
intersectingaflat-floored,largecrater)canbeapplied
toother
areasandcarrysignificantim
plicationsforthegeneral
geologicalevolutionofMars;(4)secondaryobjectives
(origin
ofdarkstreaks,drifts)canalso
giveinsightto
thesefeaturesseen
elsewhereonMars.Cons:(1)Manyofthehypotheses
donothavedefinitivetestsusing
theAthenapayload;(2)mostofthe‘‘primarygeology’’(m
odes
oforigin
forthefloormaterials)aredependentonhavingaccess
totherelevantmaterials;processes,such
assolifluction,mighthaveem
placedthick
(m??)materialsnotrelatedto
theprimaryfloor-filling;wewillbedependentonsm
allim
pactcratersto
haveexcavated
therelevantmaterialsandonourbeingableto
differentiateam
ongthepotentialsources
ofthe
ejecta
materials;(3)Gusevisageologically
complexarea
withan
interestinghistory
that
canbedifficultto
deconvolve.
ROV 13 - 24 GOLOMBEK ET AL.: SELECTION OF MER LANDING SITES
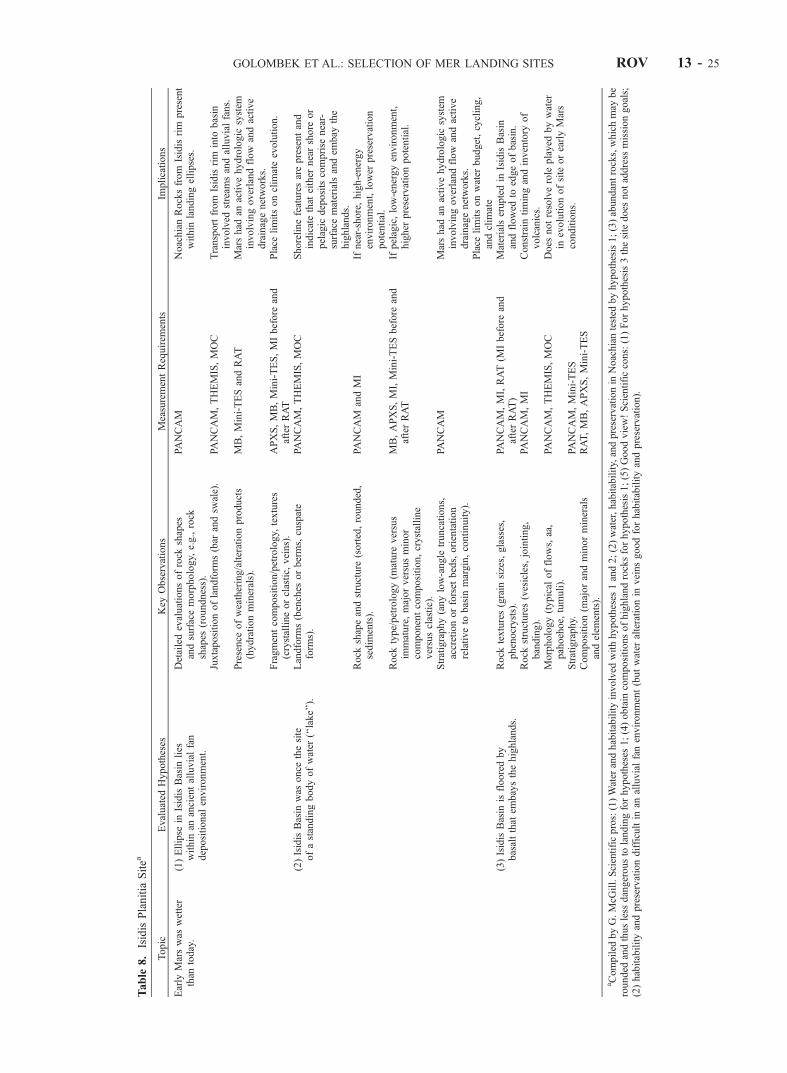
Table
8.IsidisPlanitia
Sitea
Topic
Evaluated
Hypotheses
Key
Observations
MeasurementRequirem
ents
Implications
Early
Marswas
wetter
than
today.
(1)Ellipse
inIsidisBasin
lies
within
anancientalluvialfan
depositional
environment.
Detailedevaluationsofrock
shapes
andsurfacemorphology,
e.g.,rock
shapes
(roundness).
PANCAM
NoachianRocksfrom
Isidisrim
present
within
landingellipses.
Juxtapositionoflandform
s(bar
andsw
ale).
PANCAM,THEMIS,MOC
Transportfrom
Isidisrim
into
basin
involved
stream
sandalluvialfans.
Presence
ofweathering/alterationproducts
(hydrationminerals).
MB,Mini-TESandRAT
Marshad
anactivehydrologic
system
involvingoverlandflow
andactive
drainagenetworks.
Fragmentcomposition/petrology,
textures
(crystallineorclastic,
veins).
APXS,MB,Mini-TES,MIbefore
and
afterRAT
Place
limitsonclim
ateevolution.
(2)IsidisBasin
was
once
thesite
ofastandingbodyofwater
(‘‘lake’’).
Landform
s(benches
orberms,cuspate
form
s).
PANCAM,THEMIS,MOC
Shorelinefeaturesarepresentand
indicatethat
either
nearshore
or
pelagic
depositscomprise
near-
surfacematerialsandem
bay
the
highlands.
Rock
shapeandstructure
(sorted,rounded,
sedim
ents).
PANCAM
andMI
Ifnear-shore,high-energy
environment,lower
preservation
potential.
Rock
type/petrology(m
ature
versus
immature,majorversusminor
componentcomposition,crystalline
versusclastic).
MB,APXS,MI,Mini-TESbefore
and
afterRAT
Ifpelagic,low-energyenvironment,
higher
preservationpotential.
Stratigraphy(anylow-angle
truncations,
accretionorforset
beds,orientation
relativeto
basin
margin,continuity).
PANCAM
Marshad
anactivehydrologic
system
involvingoverlandflow
andactive
drainagenetworks.
Place
limitsonwater
budget,cycling,
andclim
ate
(3)IsidisBasin
isflooredby
basaltthat
embaysthehighlands.
Rock
textures(grain
sizes,glasses,
phenocrysts).
PANCAM,MI,RAT(M
Ibefore
and
afterRAT)
Materialseruptedin
IsidisBasin
andflowed
toedgeofbasin.
Rock
structures(vesicles,jointing,
banding).
PANCAM,MI
Constrain
timingandinventory
of
volcanics.
Morphology(typical
offlows,aa,
pahoehoe,
tumuli).
PANCAM,THEMIS,MOC
Does
notresolverole
played
bywater
inevolutionofsite
orearlyMars
conditions.
Stratigraphy.
PANCAM,Mini-TES
Composition(m
ajorandminorminerals
andelem
ents).
RAT,MB,APXS,Mini-TES
aCompiled
byG.McG
ill.Scientificpros:(1)Water
andhabitabilityinvolved
withhypotheses
1and2;(2)water,habitability,andpreservationin
Noachiantested
byhypothesis1;(3)abundantrocks,whichmay
be
rounded
andthusless
dangerousto
landingforhypotheses
1;(4)obtain
compositionsofhighlandrocksforhypothesis1;(5)Goodview!Scientificcons:(1)Forhypothesis3thesitedoes
notaddress
missiongoals;
(2)habitabilityandpreservationdifficultin
analluvialfanenvironment(butwater
alterationin
veinsgoodforhabitabilityandpreservation).
GOLOMBEK ET AL.: SELECTION OF MER LANDING SITES ROV 13 - 25
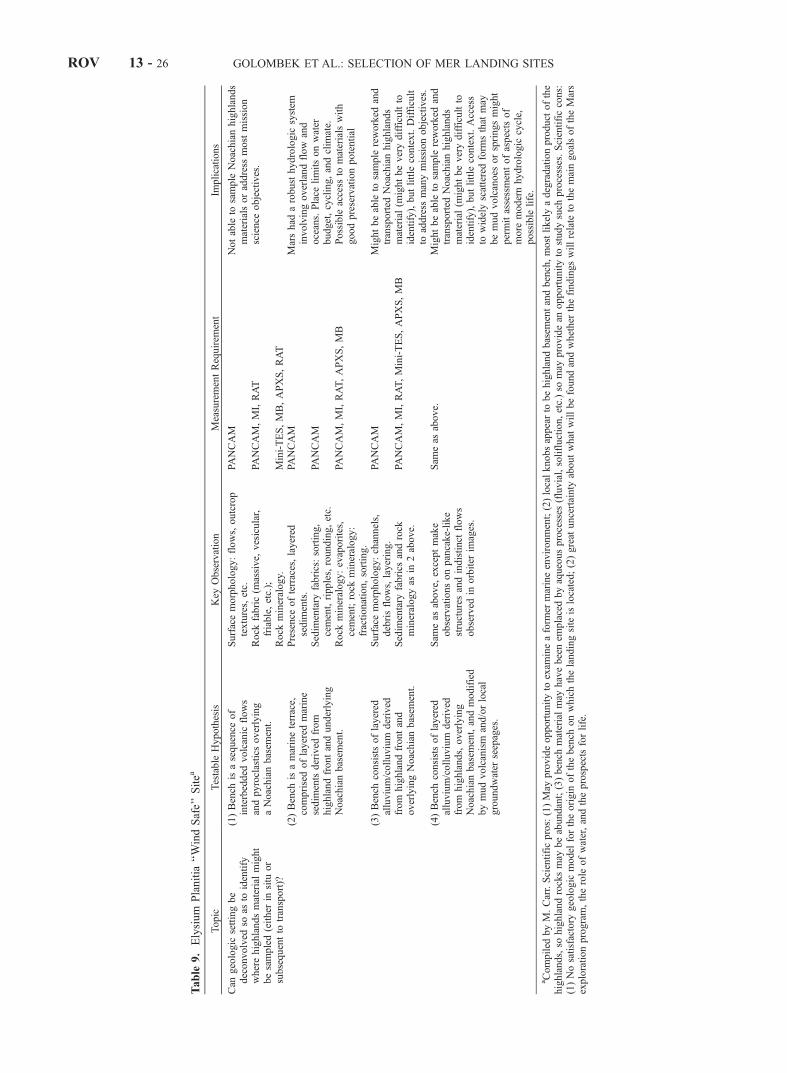
Table
9.Elysium
Planitia
‘‘WindSafe’’Sitea
Topic
Testable
Hypothesis
Key
Observation
MeasurementRequirem
ent
Implications
Can
geologic
settingbe
deconvolved
soas
toidentify
wherehighlandsmaterialmight
besampled(either
insitu
or
subsequentto
transport)?
(1)Bench
isasequence
of
interbedded
volcanic
flows
andpyroclastics
overlying
aNoachianbasem
ent.
Surfacemorphology:flows,outcrop
textures,etc.
PANCAM
Notable
tosample
Noachianhighlands
materialsoraddress
mostmission
science
objectives.
Rock
fabric(m
assive,
vesicular,
friable,etc.);
PANCAM,MI,RAT
Rock
mineralogy.
Mini-TES,MB,APXS,RAT
(2)Bench
isamarineterrace,
comprisedoflayered
marine
sedim
entsderived
from
highlandfrontandunderlying
Noachianbasem
ent.
Presence
ofterraces,layered
sedim
ents.
PANCAM
Marshad
arobusthydrologic
system
involvingoverlandflow
and
oceans.Place
limitsonwater
budget,cycling,andclim
ate.
Possible
access
tomaterialswith
goodpreservationpotential
Sedim
entary
fabrics:sorting,
cement,ripples,rounding,etc.
PANCAM
Rock
mineralogy:evaporites,
cement;rock
mineralogy:
fractionation,sorting.
PANCAM,MI,RAT,APXS,MB
(3)Bench
consistsoflayered
alluvium/colluvium
derived
from
highlandfrontand
overlyingNoachianbasem
ent.
Surfacemorphology:channels,
debrisflows,layering.
PANCAM
Mightbeable
tosample
reworked
and
transported
Noachianhighlands
material(m
ightbeverydifficultto
identify),butlittle
context.Difficult
toaddress
manymissionobjectives.
Sedim
entary
fabrics
androck
mineralogyas
in2above.
PANCAM,MI,RAT,Mini-TES,APXS,MB
(4)Bench
consistsoflayered
alluvium/colluvium
derived
from
highlands,overlying
Noachianbasem
ent,andmodified
bymudvolcanism
and/orlocal
groundwater
seepages.
Sam
eas
above,
exceptmake
observationsonpancake-like
structuresandindistinct
flows
observed
inorbiter
images.
Sam
eas
above.
Mightbeable
tosample
reworked
and
transported
Noachianhighlands
material(m
ightbeverydifficultto
identify),butlittle
context.Access
towidelyscatteredform
sthat
may
bemudvolcanoes
orspringsmight
permitassessmentofaspectsof
more
modernhydrologic
cycle,
possible
life.
aCompiled
byM.Carr.Scientificpros:(1)May
provideopportunityto
exam
ineaform
ermarineenvironment;(2)localknobsappearto
behighlandbasem
entandbench,mostlikelyadegradationproduct
ofthe
highlands,so
highlandrocksmay
beabundant;(3)bench
materialmay
havebeenem
placedbyaqueousprocesses
(fluvial,solifluction,etc.)so
may
providean
opportunityto
studysuch
processes.Scientificcons:
(1)Nosatisfactory
geologic
model
fortheorigin
ofthebench
onwhichthelandingsite
islocated;(2)great
uncertainty
aboutwhat
willbefoundandwhether
thefindingswillrelate
tothemaingoalsoftheMars
explorationprogram,therole
ofwater,andtheprospectsforlife.
ROV 13 - 26 GOLOMBEK ET AL.: SELECTION OF MER LANDING SITES
evidence, two models have been put forward. One suggestsdeposition in an aqueous environment like a lake [Christensenet al., 2000, 2001b]. In this case the hematite would haveformed either by direct precipitation from highly oxygen-ated iron-rich lake waters, or via alteration by percolatingfluids after burial (processes 1 or 3 above). The secondmodel suggests that the units are a volcaniclastic sequencedeposited soon after tilting of the lithosphere and dissectionof the Noachian cratered terrain [Arvidson et al., 2003].In this model, the hematite is emplaced either directlyin volcanic materials (as discrete grains [Noreen etal., 2001] or within glassy coatings), or via alterationafter burial of the deposits (processes 2, 3, 4, 5, or6 above).[70] The two models continue to be debated. The lack of
clear evidence for a topographic basin argues against thelacustrine model, and the lack of obvious source vents orvolcanic landforms argues against the volcaniclastic model.With present orbital data, neither model can be shown to becorrect. All of the possible hematite formation processesmay be viable. Exploration of Meridiani Planum by one ofthe MER rovers would allow the hematite formation processto be investigated and perhaps determined conclusively(Table 6). The geologic models could be tested, and newones could be developed if necessary.[71] Pancam and the Microscopic Imager could be used to
investigate the geologic setting and key geologic relation-ships, from regional to microscopic scales. What majorstratigraphic units are present? Are primary sedimentaryor volcanic features observed? What processes can beinferred from grain sizes and shapes?[72] All of the compositional instruments could be used to
determine what minerals are found in association withhematite. This investigation might be particularly effective,because the Athena Payload is very well suited to investi-gation of iron-bearing alteration phases. Are accessoryminerals typical of those formed during volcanic activity,during hydrothermal alteration of mafic materials, or arethey typical of low-temperature aqueous precipitates? Towhat extent and by what manner has water interacted withthe rocks, and what are the products? The full suite ofinstruments, plus the Rock Abrasion Tool, could be used toinvestigate the physical distribution of hematite and associ-ated minerals. Are they distributed through massive sedi-mentary or volcanic deposits, or are they present in veins orcoatings?
9.2. Gusev Crater
9.2.1. Geologic Setting[73] The prime Gusev landing ellipse is EP55A2
(Figure 4). It is centered at 14.640�S, 175.298�E as definedin the planetocentric IAU 2000 coordinate frame. It hasmargined 3s dimensions of 96 � 19 km, with a long axisoriented at a heading of 76�. Gusev is a 160 km diameter,flat-floored crater of Noachian age, close to the highland-lowland boundary south of Elysium. Its southern rim isbreached by Ma’adim Vallis, one of the largest branchingvalley networks on the planet. Ma’adim is over 800 kmlong, and in places over 25 km wide and over 2 km deep. Ithas only a few tributaries comparable in width to the mainvalley, but the valley walls and adjacent uplands aredissected by numerous small valleys. In the likely event
that it was cut by running water, Gusev would have acted asa settling pool for sediment carried by the water that cutMa’adim before it exited through a gap in the northern rimof the crater. A landing in Gusev therefore would provide anopportunity to study fluvial sediments derived from thesouthern highlands, and deposited in a lacustrine environ-ment. Such sediments may provide important clues aboutenvironmental conditions on early Mars, which are, ofcourse, of particular interest for the planet’s potentialhabitability.[74] Cabrol et al. [1996, 1998a, 1998b] and Kuzmin et al.
[2000] concluded on the basis of crater counts that thecutting of Ma’adim took place over an extended period oftime from the late Noachian into the Hesperian, a period ofpossibly as long as 2 � 109 years. Irwin et al. [2002], on theother hand, have suggested that Ma’adim was cut morerapidly near the end of the Noachian as large lakes at thevalley’s upstream end drained into it. These two scenariosdiffer in their timing and duration, but in both instancessustained fluvial erosion, rather than a catastrophic event, isimplied.[75] Like many large upland craters, Gusev has a shallow,
flat floor with a surface that is significantly younger than thecrater itself, estimated by Cabrol et al. [1998a, 1998b] to beLate Hesperian to Early Amazonian. Three main units formthe floor of Gusev: cratered plains, etched plains, andpossible delta deposits at the mouth of Ma’adim. Additionalunits have been identified in THEMIS thermal and visibleimages [Milam et al., 2003]. The landing ellipse is locatednear the central, lowest part of the crater. It is almost entirelywithin the cratered plains, although it includes some smalletched areas near the center of the ellipse. Also included aresome low hills with etched surfaces that could be outliers ofthe higher-standing etched plains to the east or of the deltadeposits to the south.[76] The cratered plains themselves are featureless
except for superimposed craters, wrinkle ridges thatresemble Mare ridges on the Moon, and wind streaksand splotches. Their morphology reveals little about theirorigin. Lacustrine sediments may be at the surface, butthese plains also resemble Hesperian ridged plains else-where on the planet, which are generally interpreted to bevolcanic. Lacustrine sediments may therefore be coveredwith a veneer of younger volcanics and/or aeolian mate-rial and making them accessible only via impact ejecta.The eastern end of the ellipse straddles the western rim ofthe �20 km diameter crater Thira, which stands tens ofmeters above the plains. North of the western end of theellipse is a 6 km diameter crater, whose ejecta can betraced into the ellipse.9.2.2. Science Objectives and Testable Hypotheses[77] The primary scientific objectives at the Gusev site
would be to determine the processes that filled the crater,and to study their implications for a possibly habitable pastenvironment (Table 7). Given the length and depth ofMa’adim Valles and the shallow relatively flat floor ofGusev crater, the quantity of lacustrine sediments withinGusev is likely to be substantial. However, because thepresent surface might be volcanic or aeolian, access tosubsurface materials is of concern. Craters that couldexcavate to 10–20 m depth are common throughout theellipse, so ejecta from this range of depths are likely to be
GOLOMBEK ET AL.: SELECTION OF MER LANDING SITES ROV 13 - 27
accessible. Sampling to deeper levels becomes less likely:there are only five craters within the ellipse that would haveexcavated to �200 m. Erosion around a crater near thecenter of the ellipse and hints of layering within the craterwall suggest that portions of the near surface are layered atthe scale of tens of meters or less, so small crater ejectacould likely contain this material.[78] Several processes could have contributed to the
filling of Gusev, including lacustrine sedimentation andpossible lava eruptions. Air fall deposits from AppolinarisPatera, which is located north of Gusev, could be present.Several large nearby craters could have contributed impactejecta. If lakes were formerly present, they may have onoccasion evaporated and left behind evaporite deposits.Much of the cratered uplands has undergone repeated burialand exhumation [Malin and Edgett, 2001], possibly as aresult of aeolian processes, and Gusev has likely beensimilarly affected. Stratigraphic relations within the cratertherefore may be complex, with water-lain sediments inter-calated and intermixed with other materials. This may proveadvantageous in that a wide variety of materials may beaccessible using the rover’s mobility, but it is also likely tocomplicate geologic interpretation.[79] Assuming that water-lain sediments can be located,
analysis using the Athena instruments has the potential toreveal much about the fluvial and lacustrine processes thatwere involved in their deposition and about the climaticconditions that prevailed at the time (Table 7). The scale ofany layering and the degree of intercalation with other rocktypes as observed by Pancam would provide clues aboutduration and continuity of deposition. Lithological charac-teristics such as grain size, sorting, rounding, varves, anddiagenetic structures observed by the Microscopic Imager,perhaps with help from the RAT, would reveal importantclues about the fluvial regimes such as whether depositionwas the result of a succession of short energetic episodes orcontinuous, quiet, lower-energy activity. The chemical andmineralogical composition of the sediments as revealed bythe APXS, Mini-TES and Mossbauer would provide strongindications about the environments under which erosion anddeposition occurred, whether there were weatheringepisodes between depositional episodes, whether thepostulated lake ever evaporated, and whether there waschemical alteration after deposition, such as might haveoccurred as a result of hydrothermal activity.[80] A landing at Gusev could also allow study of the
nature of the cratered uplands. Any sediment present willhave been derived from the uplands, and some fraction ofthe impact ejecta at the surface must be from the surround-ing uplands as well. Questions that can be addressedinclude: What is the chemical composition of the cratereduplands? Are the cratered uplands simply brecciated igne-ous rocks or is there a significant sedimentary component?What weathering processes have the cratered uplands mate-rials experienced, and what do the weathering productsimply about climatic conditions in the Noachian?
9.3. Isidis Planitia
9.3.1. Geologic Setting[81] The prime Isidis Planitia landing ellipses are IP84A2
and IP96B2 (Figure 6). Both are centered at 4.220�N,88.148�E as defined in the planetocentric IAU 2000 coor-
dinate frame. The first ellipse has margined 3s dimensionsof 132 � 16 km, with a long axis oriented at a heading of88�. The second ellipse is 140 � 16 km, with a long axisorientation of 91�.[82] The landing site is immediately north of Libya
Montes, in the plains that fill the Isidis basin. The ellipselies mostly in intermontane plains thought to consist ofcoalescing alluvial fans formed as sediment debouchedfrom the highlands onto the plains [Crumpler, 1999]. Thesematerials transition northward to knobby plains that com-prise the bulk of materials within Isidis Planitia, in whichthe Beagle 2 landing ellipse resides [Bridges et al., 2003].Small cones, commonly arranged in chains, cut acrossportions of these central Isidis plains.[83] The region in which the ellipse is located is high in
both thermal inertia and albedo relative to average Martianvalues. It is also spectrally reddish relative to average Mars[Golombek et al., 1997a]. A plausible interpretation is thatcemented soils (forming duricrust) are common in thisregion, although the reddish color is also indicative of dust[Ruff and Christensen, 2002].9.3.2. Science Objectives and Testable Hypotheses[84] The main scientific objective at the Isidis Planitia site
would be to investigate the possibility that the plains consistof the distal ends of a bajada or coalescing alluvial fancomplex (Table 8). If this interpretation is correct, thenstudy of this region would be important for two reasons.First, the materials comprising the fans would have washeddown from ancient cratered terrain to the south, and wouldallow study of the oldest mapped Noachian crustal materials[Greeley and Guest, 1987]. Second, transport and possiblealteration of these materials by liquid water could lead topreserved evidence of the environmental conditions at thetime the transport and/or alteration took place.[85] An important test of the plains materials’ origin
would be to use Pancam images to search for evidence ofrelict landforms typically associated with alluvial fans,including washboard structures and abandoned sections thathave become terraces. It would also be important to use theMicroscopic Imager to search for evidence for the poorlysorted sedimentary deposits typical of fan depositionalenvironments, with a mix of local and highlands rocks.Alternative hypotheses, particularly toward the northernpart of the ellipse, is that the deposits were emplaced bylocal volcanic activity or an ancient lake or ocean. Again,both Pancam and MI images would be important in search-ing for the morphologic clues that would support thishypothesis. Mixtures of fluvial, lacustrine and volcanicprocesses are also possible.[86] A second objective would be to evaluate the extent to
which the deposits have been altered by interactions withaqueous fluids. This could occur by shallow groundwateremanating from fan surfaces, or via hydrothermal activity.Either process could be expected to produce distinctiveassemblages of alteration minerals that could be detectedusing the Athena Payload. In particular, the rover andpayload could be used to investigate why the site has highthermal inertia and yet is also bright and red. The presenceof duricrust is one possibility. Another is that high-velocityslope winds have removed dust and left behind intrinsicallyred rocks. What types of rocks are present, and to whatextent does the color indicate the extent of oxidation,
ROV 13 - 28 GOLOMBEK ET AL.: SELECTION OF MER LANDING SITES
particularly in a hydrous environment? All of the payload’scompositional capabilities (Pancam multispectral imaging,Mini-TES, Mossbauer, APXS) would be useful in thisregard. In addition, the rover wheels could be used toexcavate shallow trenches within and through duricrust,allowing study of soil composition as a function of depth.
9.4. Elysium
9.4.1. Geologic Setting[87] The prime Elysium landing ellipse is EP78B2
(Figure 13). It is centered at 11.73�N, 123.958�E as definedin the IAU 2000 coordinate frame. It has margined 3sdimensions of 155 � 16 km, with a long axis oriented at aheading of 94�.[88] In contrast to the other three sites just described, the
Elysium site was chosen primarily because of its inferredlow winds in mesoscale atmospheric circulation models,rather than for its geologic properties. As a result, thescientific rationale for the site is less compelling than forthe other sites.[89] The site is located on a low, wide bench south of
Elysium Planitia, between heavily cratered terrain to thesouth and the gently sloping plains of Elysium Planitia tothe north. Most of the bench has a gently rolling topographycaused by low rounded hills, muted ridges, and gentle,quasi-circular depressions. To the north, the bench mergeswith the plains of Elysium Planitia, along a complicatedtransitional boundary. Farther north, the bench complexlyinterfingers with the lower-lying plains, and islands ofbench-like materials, surrounded by plains are isolated fromthe main part of the bench. Occasional sharply defined hills,a few kilometers across, occur within the bench and thesebecome more common to the south as the gradationalboundary with the heavily cratered upland is approached.The site itself is roughly in the middle of the bench. Greeleyand Guest [1987] mapped the bench as Hesperian ridgedplains, interpreted as volcanic. Parker et al. [1989, 1993]and Clifford and Parker [2001] mapped the inner and outerboundaries of the bench as shorelines. Jons [1985, 1986]ascribed many of the features of the highland-lowlandboundary in general to large-scale mass wasting.9.4.2. Science Objectives and Testable Hypotheses[90] The main science issues at the Elysium site concern
the origin of the bench material, and what other materialsare likely to be available for sampling (Table 9). Severalformation mechanisms for the bench are possible.[91] 1. The bench is composed of Hesperian volcanic
flows and pyroclastic deposits. The gently rolling topogra-phy, vague circular structures, subdued ridges, and lack offlow features all argue against a primary surface of volcanicflows for most of the bench. However, the bench might beformed of easily erodible, layered ash deposits that could bedeflated by the wind. A counterargument is that it lacksobvious wind erosion features, and there is little supportingevidence for a volcanic source.[92] 2. The bench was formerly part of the floor of a
northern ocean. Head et al. [1999] have argued that thesouthern boundary of the bench is unlikely to be a shorelinebecause of the large range in elevations along it. Theragged, etched-appearing nature of the northern boundaryof the bench also argues against a marine origin for thatescarpment. Regardless of the origin of the bench, marine
processes could still have played a role at the site if thenorthern plains were filled with water to the appropriatelevel.[93] 3. The near-surface materials of the bench were shed
by mass wasting from local highs and from the mainhighland front to the south [Jons, 1985, 1986; Tanaka etal., 2002, 2003]. The rolling topography of the benchsurface and the vague circular structures suggest that anear-surface deposit is draped over a cratered surface atshallow depth. The main argument against such an origin isthe low regional slope (typically about 0.002�). It is doubt-ful whether material could move several hundred km acrosssuch low slopes by any mechanism other than watertransport.[94] 4. The near-surface materials were eroded by fluvial
activity from the highland front and deposited north of thefront to form the bench [Tanaka et al., 2002, 2003]. Insupport of this hypothesis are the numerous valleys in thehighlands just to the south of the highland front. Arguingagainst the hypothesis is the complete lack of evidence forfluvial activity on the bench itself.[95] 5. The near-surface materials were deposited over a
preexisting surface by aeolian activity or volcanic air fall ofvolcanic ash. This is certainly possible, but there is little orno evidence of wind deposition other than dunes scatteredover the surface of the deposit.[96] All of these hypotheses are in principle testable using
elements of the Athena payload. The most important toolswill be Pancam for establishing regional and local geologicrelationships, and the Microscopic Imager for studying fine-scale textural details that may yield clues to the formationmechanisms of the materials encountered.[97] At least two materials may be present within the
landing ellipse. One is the bench-forming material itself. Inaddition, craters are common in and around the ellipse, andthey are likely to have penetrated the bench-forming depos-its and brought to the surface materials from the olderterrain at depth. This site may therefore offer an opportunityto study unaltered highland rocks and ancient crustalformation processes. All of the elements of the Athenapayload, including particularly the compositional spectrom-eters (Mini-TES, APXS, Mossbauer) would be useful forthis purpose.
10. Atmospheric Properties of the Final Sites
[98] As described in section 7, the atmospheric profilemodel is generalized to cover all the possible landing sitesfor the MER mission. Thus the only variation in atmospherebetween the landing sites is the landing elevation and theobvious (but important) associated surface pressure and thuscolumn density changes. The winds from the mesoscalemodels vary significantly from site to site. This results in thepotential of winds playing a significant role in discriminat-ing between the various possible landing sites. The detailsof the differences are listed in Kass et al. [2003], Rafkin andMichaels [2003] and Toigo and Richardson [2003].[99] The Meridiani Planum site is a broad flat region with
little regional or global circulation. This leads to a vigorousconvective system developing to a depth of �5 km. Thesustained horizontal winds are modest with overall moder-ate, but vertically extensive wind shears. The deep convec-
GOLOMBEK ET AL.: SELECTION OF MER LANDING SITES ROV 13 - 29
tive system does develop strong vertical winds. Gusevcrater’s walls have a large impact on the circulation at thelanding site. This is further enhanced by the preferentiallocation of a low-level global jet over the crater. The netresult is moderate horizontal winds and fairly significantshear (Table 10), although much of the high-frequency shearis confined to the shallow boundary layer. The Isidis landingsite is dominated by a strong, persistent upslope flow drivenby the basin wall. This also compresses the boundary layer,creating a very turbulent, but shallow region. The complextopographic structure does introduce a significant longer(vertical) wavelength shear component at the site. Finally,the Elysium site has the same modest winds as seen atMeridiani, although they appear to be organized by theupslope flow along the nearby north-south dichotomyboundary. The boundary layer is not as deep (perhaps dueto the more organized regional wind field), leading toweaker vertical winds but somewhat more turbulence.[100] It is interesting to compare the winds at the four
selected landing sites to those at a potential site in MelasChasma. There, the average sustained (or mean) winds werequite high (over three times as fast as what was modeled atthe Meridiani landing site with peak values significantlyhigher still). While the average shear on the canyon floorwas comparable to the inside of Gusev crater, locations andtimes of significantly higher shear occurred regularly.Overall, the mesoscale models predict that the Meridianisite and Elysium site (as intended) have modest windconditions. Gusev crater and the Isidis basin have moredynamic winds and other candidates sites are potentiallyeven worse (Table 10).[101] Minimum nighttime temperatures at the landing
sites set limits on power available for science activities,and mission lifetime. Martin et al. [2003] derive thesetemperatures at the end of the nominal 90 Sol primarymission from TES thermal inertia and albedo, estimatedopacity, and predictions of 1-m air temperatures from a one-dimensional atmospheric model. Mapping these results ontothe probability density distribution of the landing ellipsesshows that of the primary sites, Meridiani is the coldest,with an 8% chance of encountering minimum nighttimetemperatures below the �97�C value (defined by a line withthermal inertia of 243 at 0.30 and 177 at 0.10) considered apractical limit for operations. Elysium and Gusev are at 7%and 3%, respectively, whereas Isidis has no computed 1 mair temperatures below �97�C (defined at Gusev by a linewith thermal inertia of 251 at 0.30 and 187 at 0.10).
Preliminary high-resolution THEMIS observations of night-time surface temperatures show similar results.
11. Surface Characteristics of the Final Sites
11.1. Thermal Inertia, Rock Abundance, and Albedo
[102] Bulk thermal inertias of all of the prospectivelanding sites fall within the extremes or are similar tothose sampled at the Viking and Mars Pathfinder landingsites (Table 10). IRTM and TES thermal inertia for thelanding sites are also consistent with each other and rangefrom 230 at Meridiani to 450 J m�2 s�0.5 K�1 or SI unitsat Isidis. Preliminary THEMIS derived thermal inertias arealso generally consistent with TES results [Fergason andChristensen, 2003] and none of the final four sites showmarked variability in thermal inertia within the ellipses.The TES thermal inertia of the VL1 site is �320, the VL2site �240, and the Pathfinder site �400 (Figure 14). Finecomponent thermal inertias at all of the prospective landingsites also fall within the extremes or are similar to thosesampled at the Viking and Mars Pathfinder landing sites.The IRTM fine component thermal inertia of the prospec-tive sites range from �250 at Gusev to 385 at Isidis,compared to �250 at the VL1 site, �175 at the VL2 site(by inference from the bulk TES inertia and the rockabundance), and �344 at the Pathfinder site. The Isidissite has slightly higher bulk and fine component thermalinertia than the Mars Pathfinder site, but this is likely dueto a more cemented duricrust [Jakosky and Mellon, 2001;Golombek et al., 2003b]. In all of these cases, the thermalinertias suggest the surfaces are dominated by duricrust (atthe high end of the fine component range), to cementedsoil-like materials or cohesionless sand or granules[Jakosky and Christensen, 1986; Golombek et al.,1997a]. In any case, the surfaces should be competent,load bearing and pose no special risk to landing or roving.None of the surfaces are likely to have thick deposits offine-grained, non-load-bearing dust.[103] IRTM thermal differencing indicates rock abundan-
ces at the sites that are generally lower than VL1, VL2 orPathfinder (16%, 17% and 18% respectively). Averagerock abundance at Meridiani and Elysium are �5% andbelow the global mode of �8% [Christensen, 1986b].Rock abundance at Gusev, on average, is higher at 7.5%.Rock abundance at the other sites ranges from 12 to 17%(Table 10). Model rock size-frequency estimates of theareas covered by potentially hazardous rocks >1 m diameter
Note to Table 10aLatitude and longitude +W is planetographic MDIM 2.0 coordinates [USGS, 2001], positive west. Longitude +E is planetocentric MOLA IAU91
coordinates, positive east. MOLA elevations with respect to the MOLA geoid (see text) are measured from the center of mass (COM). 1.2 km bidirectional(bi-dir) and adirectional (a-dir) slopes are calculated as described in the text, respectively. Pulse width [G] is slope corrected data (slopecor) from Garvin etal. (1998) and Smith et al. [2001a]. Pulse width [N] is both not slope corrected and slope corrected (slopecor); data from Neumann et al. [2003]. Self affine100 m Allan deviation and RMS slope are from Anderson et al. [2003] as described in the text; n is the number of data, which for these are the same as the1.2 km bi-dir slopes. The MOC derived bidirectional RMS slope from Kirk et al. [2003] is derived from stereogrammetry (stereo) at 10 m DEM resolutionand PC, at 3–6 m DEM resolution and corrected via Hurst exponent for 5 m baseline. Radar data are 3.5 cm X-band measures of RMS slope andreflectivity for Meridiani, Isidis, Athabasca, and MPF and estimates from nearby surfaces of the same geologic unit for the others as described inHaldemann et al. [2003] and Anderson et al. [2003]. The IRTM data set is from P. Christensen as described in the text. The TES data are fromMellon et al.[2000], Jakosky and Mellon [2001], and Pelkey et al. (2003). All thermal inertia values are in SI units or J m�2 s�0.5 K�1. The number of TES albedo pointsis the same as the number of TES thermal inertia (I). Percent (%) area covered by rocks >1 m diameter (0.5 m high) from model size-frequency distributioncurves are pinned to total rock abundance as described by Golombek and Rapp [1997] and Golombek et al. [2003b]. Horizontal winds are as calculatedfrom the MRAMS [Rafkin et al., 2003] and the Mars MM5 mesoscale models [Toigo and Richardson, 2003], wind shear is as estimated by the models, andthe wind turbulence is as estimated by the MRAMS model, all as summarized in Kass et al. [2003]. The latter two are scaled relative to the model of windshear used by the MPF project.
ROV 13 - 30 GOLOMBEK ET AL.: SELECTION OF MER LANDING SITES
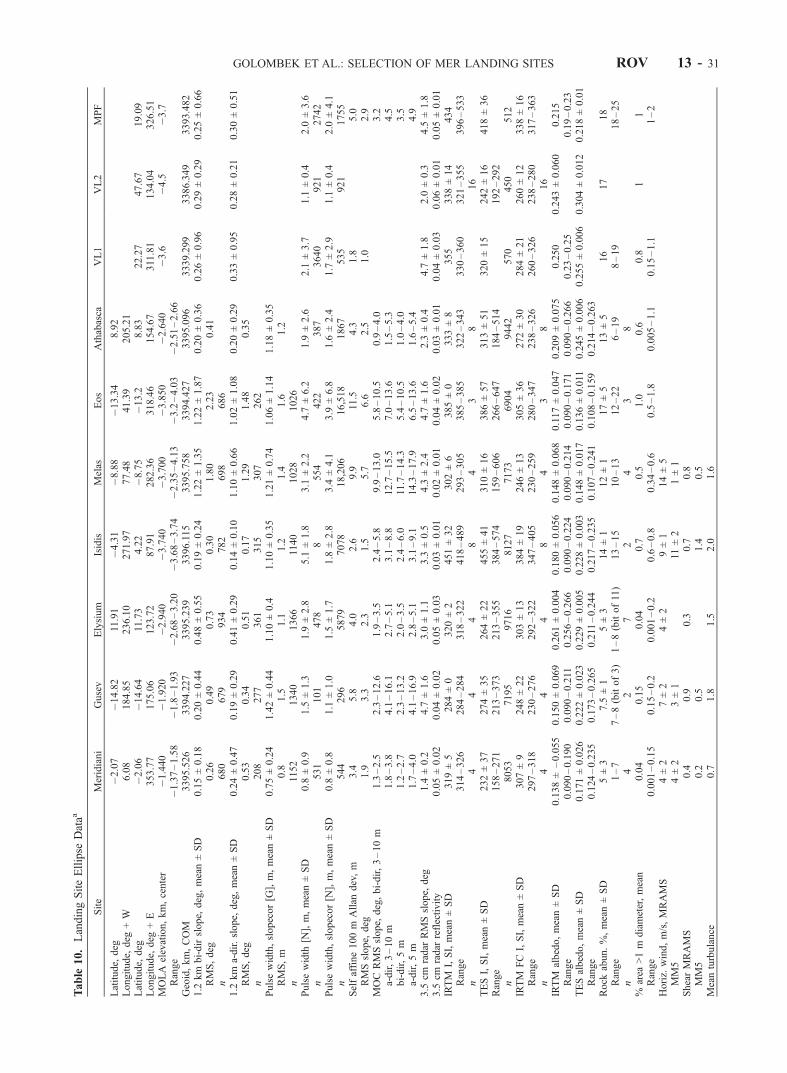
Table
10.LandingSiteEllipse
Dataa
Site
Meridiani
Gusev
Elysium
Isidis
Melas
Eos
Athabasca
VL1
VL2
MPF
Latitude,
deg
�2.07
�14.82
11.91
�4.31
�8.88
�13.34
8.92
Longitude,
deg
+W
6.08
184.85
236.10
271.97
77.48
41.39
205.21
Latitude,
deg
�2.06
�14.64
11.73
4.22
�8.75
�13.2
8.83
22.27
47.67
19.09
Longitude,
deg
+E
353.77
175.06
123.72
87.91
282.36
318.46
154.67
311.81
134.04
326.51
MOLA
elevation,km,center
�1.440
�1.920
�2.940
�3.740
�3.700
�3.850
�2.640
�3.6
�4.5
�3.7
Range
�1.37–1.58
�1.8–1.93
�2.68–3.20
�3.68–3.74
�2.35–4.13
�3.2–4.03
�2.51–2.66
Geoid,km,COM
3395.526
3394.227
3395.239
3396.115
3395.758
3394.427
3395.096
3339.299
3386.349
3393.482
1.2
km
bi-dirslope,
deg,mean±SD
0.15±0.18
0.20±0.44
0.48±0.55
0.19±0.24
1.22±1.35
1.22±1.87
0.20±0.36
0.26±0.96
0.29±0.29
0.25±0.66
RMS,deg
0.26
0.49
0.73
0.30
1.80
2.23
0.41
n680
679
934
782
698
686
1.2
km
a-dir.slope,
deg,mean±SD
0.24±0.47
0.19±0.29
0.41±0.29
0.14±0.10
1.10±0.66
1.02±1.08
0.20±0.29
0.33±0.95
0.28±0.21
0.30±0.51
RMS,deg
0.53
0.34
0.51
0.17
1.29
1.48
0.35
n208
277
361
315
307
262
Pulsewidth,slopecor[G
],m,mean±SD
0.75±0.24
1.42±0.44
1.10±0.4
1.10±0.35
1.21±0.74
1.06±1.14
1.18±0.35
RMS,m
0.8
1.5
1.1
1.2
1.4
1.6
1.2
n1152
1340
1366
1140
1028
1026
Pulsewidth
[N],m,mean±SD
0.8
±0.9
1.5
±1.3
1.9
±2.8
5.1
±1.8
3.1
±2.2
4.7
±6.2
1.9
±2.6
2.1
±3.7
1.1
±0.4
2.0
±3.6
n531
101
478
8554
422
387
3640
921
2742
Pulsewidth,slopecor[N
],m,mean±SD
0.8
±0.8
1.1
±1.0
1.5
±1.7
1.8
±2.8
3.4
±4.1
3.9
±6.8
1.6
±2.4
1.7
±2.9
1.1
±0.4
2.0
±4.1
n544
296
5879
7078
18,206
16,518
1867
535
921
1755
Selfaffine100m
Allan
dev,m
3.4
5.8
4.0
2.6
9.9
11.5
4.3
1.8
5.0
RMSslope,
deg
1.9
3.3
2.3
1.5
5.7
6.6
2.5
1.0
2.9
MOCRMSslope,
deg,bi-dir,3–10m
1.3–2.5
2.3–12.6
1.9–3.5
2.4–5.8
9.9–13.0
5.8–10.5
0.9–4.0
3.2
a-dir,3–10m
1.8–3.8
4.1–16.1
2.7–5.1
3.1–8.8
12.7–15.5
7.0–13.6
1.5–5.3
4.5
bi-dir,5m
1.2–2.7
2.3–13.2
2.0–3.5
2.4–6.0
11.7–14.3
5.4–10.5
1.0–4.0
3.5
a-dir,5m
1.7–4.0
4.1–16.9
2.8–5.1
3.1–9.1
14.3–17.9
6.5–13.6
1.6–5.4
4.9
3.5
cmradar
RMSslope,
deg
1.4
±0.2
4.7
±1.6
3.0
±1.1
3.3
±0.5
4.3
±2.4
4.7
±1.6
2.3
±0.4
4.7
±1.8
2.0
±0.3
4.5
±1.8
3.5
cmradar
reflectivity
0.05±0.02
0.04±0.02
0.05±0.03
0.03±0.01
0.02±0.01
0.04±0.02
0.03±0.01
0.04±0.03
0.06±0.01
0.05±0.01
IRTM
I,SI,mean±SD
319±5
284±0
320±2
451±32
302±6
385±0
333±8
355
338±14
434
Range
314–326
284–284
318–322
418–489
293–305
385–385
322–343
330–360
321–355
396–533
n4
44
84
38
16
TESI,SI,mean±SD
232±37
274±35
264±22
455±41
310±16
386±57
313±51
320±15
242±16
418±36
Range
158–271
213–373
213–355
384–574
159–606
266–647
184–514
192–292
n8053
7195
9716
8127
7173
6904
9442
570
450
512
IRTM
FCI,SI,mean±SD
307±9
248±22
303±13
384±19
246±13
305±36
272±30
284±21
260±12
338±16
Range
297–318
230–276
292–322
347–405
230–259
280–347
238–326
260–326
238–280
317–363
n4
44
84
38
16
IRTM
albedo,mean±SD
0.138±–0.055
0.150±0.069
0.261±0.004
0.180±0.056
0.148±0.068
0.117±0.047
0.209±0.075
0.250
0.243±0.060
0.215
Range
0.090–0.190
0.090–0.211
0.256–0.266
0.090–0.224
0.090–0.214
0.090–0.171
0.090–0.266
0.23–0.25
0.19–0.23
TESalbedo,mean±SD
0.171±0.026
0.222±0.023
0.229±0.005
0.228±0.003
0.148±0.017
0.136±0.011
0.245±0.006
0.255±0.006
0.304±0.012
0.218±0.01
Range
0.124–0.235
0.173–0.265
0.211
–0.244
0.217–0.235
0.107–0.241
0.108–0.159
0.214–0.263
Rock
abun.%,mean±SD
5±3
7.5
±1
5±3
14±1
12±1
17±5
13±5
16
17
18
Range
1–7
7–8(bitof3)
1–8(bitof11)
13–15
10–13
12–22
6–19
8–19
18–25
n4
27
24
38
%area
>1m
diameter,mean
0.04
0.15
0.04
0.7
0.5
1.0
0.6
0.8
11
Range
0.001–0.15
0.15–0.2
0.001–0.2
0.6–0.8
0.34–0.6
0.5–1.8
0.005–1.1
0.15–1.1
1–2
Horiz.
wind,m/s,MRAMS
4±2
7±2
4±2
9±1
14±5
MM5
4±2
3±1
11±2
1±1
ShearMRAMS
0.4
0.9
0.3
0.7
0.8
MM5
0.2
0.5
1.4
0.5
Meanturbulance
0.7
1.8
1.5
2.0
1.6
GOLOMBEK ET AL.: SELECTION OF MER LANDING SITES ROV 13 - 31

(0.5 m high) [Golombek and Rapp, 1997; Golombek et al.,2003b] suggest �0.04% at Meridiani and Elysium, �0.2%at Gusev, and 0.8% at Isidis. Golombek et al. [2003b]calculate the probability of impacting such a potentiallyhazardous rock in the first two bounces for the average rockabundance at the sites as �1% at Meridiani and Elysium,�5% at Gusev and �12% at Isidis. All of the sites meet theengineering requirement of <20% rock abundance, althoughthe probability of impacting >1 m diameter rocks during thefirst two bounces is �30% at such rocky sites. A total of 14,10, 3, and 0 boulder fields composed of blocks 1.5–20 mdiameter are visible in MOC images around impact craters inthe Gusev, Isidis, Elysium, and Meridiani sites [Golombek etal., 2003b]. Although these boulder fields have higher rock
size-frequency distributions than the model, they do not addsignificantly to the hazardousness of the site because allrelatively fresh craters are already assumed to be fatal in thesimulations (section 12.2). Rocks large enough to placecontact sensor instruments against and abrade should beplentiful within an easy Sol’s drive at any of the sites[Golombek et al., 2003b]. None of the rock abundanceestimates are too high for the rovers to drive through,although progress would be slower at Isidis than atMeridiani, Elysium or Gusev.[104] Comparison of the thermophysical properties of the
sites with the Viking and Pathfinder landing sites (Figure 14and Table 10) allows an interpretation of their surfacecharacteristics. The Meridiani site has moderate thermalinertia and fine component thermal inertia and very lowalbedo. This site will likely look very different from thethree previous landing sites in having a darker surface, fewrocks and little dust. Melas Chasma has moderate thermalinertia and fine component thermal inertia and low albedo.This site will likely be moderately rocky (except where thesurface is covered by sand dunes) but with less dust than theMPF and VL landing sites. Gusev crater and Elysium havecomparable thermal inertia, fine component thermal inertiaand albedo to the VL sites and so will likely be similar tothese locations (just as dusty), but with fewer rocks. TheAthabasca Valles site has high albedo and moderate thermalinertia, suggesting a moderately rocky and dusty site. TheIsidis and Eos sites have high to very high thermal inertiassuggesting a crusty surface. The Isidis site has moderatealbedo and a high red/blue ratio, suggesting a rockyweathered crusty surface with some dust. Eos has lowalbedo with moderate to high thermal inertia, suggesting arocky and crusty surface with some dust. These assessmentsare consistent with the formal TES derived measure ofdustiness [Ruff and Christensen, 2002], which suggestsMeridiani, Melas [Pelkey and Jakosky, 2002] and Eosshould be relatively dust-free, and Athabasca, Isidis andGusev should be relatively dusty compared with the VL1 orMars Pathfinder landing sites.
11.2. Slopes
[105] Different analyses of hectometer and kilometerscale slope were carried out in support of landing sitesafety analysis, including the measurement and mapping of1.2 km slopes at the landing sites and the mapping of100 m slopes in and near the ellipses to directly comparewith the engineering requirements [Anderson et al., 2003].To generate 1.2-km scale slope statistics for the landingsites, Haldemann and Anderson [2002] and Anderson et al.[2003] calculate bidirectional slopes (component of slopemeasured in a fixed direction) along individual laseraltimeter tracks and then average the results in bins:300 m to calculate statistics and 1.2 km to display theresults in map view. Adirectional slopes (slope in downhilldirection, or gradient) are calculated by averaging allMOLA elevation samples in a 1.2 km grid, and thenevaluating the maximum slope between adjacent grid points,being careful to omit grids that have no MOLA measure-ments. These statistics are reported as averages (with stan-dard deviations) and RMS over the landing ellipses. Thekm-scale slopes throughout the final four landing sites meetthe engineering requirement of <2� (Table 10). Meridiani,
Figure 14. Thermal inertia versus albedo for the sevenlanding sites investigated in detail and the VL1, VL2, andMPF landing sites. Although the thermal inertia of thesesites falls within the extremes or are similar to the VL1,VL2, and MPF landing sites, the sites fall into two groupsbased on albedo. One group of sites (Isidis, IP84A andIP96B; Athabasca, EP49B; Gusev, EP55A; and Elysium,EP78B) have generally high albedo (>0.21) and are similarto the VL1, VL2, and MPF landing sites, suggestingmoderately dusty surfaces; another group of sites (Eos,VM41A; Melas, VM53A; and Meridiani, TM20B andTM10A) have low albedo (<0.18), suggesting relativelydust-free surfaces. Data are high-resolution TES data Pelkeyand Jakosky [2002] and Jakosky and Mellon [2001] fromwithin the ellipses shown in Figures 3–8 and 13; the squareis the mean of the data within the ellipses, and boxes are thestandard deviation. Three lines of constant 1 m airtemperature are from Martin et al. [2003].
ROV 13 - 32 GOLOMBEK ET AL.: SELECTION OF MER LANDING SITES

Gusev, Isidis and Athabasca appear smoothest at 1 kmwith average slopes �0.2�, comparable with the VL1, 2and MPF sites. Elysium appears slightly rougher at thesewavelengths with an average slope of �0.5�. The Melasand Eos landing sites are rougher at this scale with averageslopes of �1.2�, consistent with parts of their ellipses onthe lower sloping parts of the canyon walls; these sitesclearly have areas that exceed the engineering requirementof 2�.[106] Slopes over 100 m length scales (required to be <5�)
are addressed in two ways [Anderson et al., 2003]. Thefirst approach is to use MOLA pulse-width measurementsas a measure of footprint-scale roughness [Garvin et al.,1999; Smith et al., 2001a; Neumann et al., 2003], at theMOLA footprint size of 75–150 m, which can be used toinfer upper limits for footprint-scale slopes. Early resultsfrom Garvin et al. [1999] and Smith et al. [2001a] thatsubtract out regional slopes, indicate pulse widths of <2 mhad relief of <10 m, which corresponds to the sloperequirement of <5� over 100 m baselines. These data showGusev has the highest pulse spread (1.5 m), Meridiani thelowest (0.8 m), with the other sites in between (�1 m).Newer analysis that includes improvements in the estimatedlaser spot size (�75 m) and estimates of the RMS reliefwith and without longer slopes removed by Neumann et al.[2003], show Meridiani as having the lowest pulse spread(0.8 m) and Melas and Eos the highest (>3 m). The othersites cannot be readily distinguished from the VL1, 2 andMPF landing sites (�1–2 m). By these data, all of the fourfinal landing sites should be acceptable and should be noworse than the three locations on Mars (VL1, 2 and MPF)where radar altimeters have worked satisfactorily in suc-cessfully landing spacecraft. The second approach toestimate relief and slopes over 100 m length scales is toassume that the Martian surface in the regions of thelanding sites obeys self-affine statistics and to extrapolatethe Allan deviation (relief) at 0.3, 0.6, 0.9, and 1.2 kmMOLA shot intervals down to 100 m length scale via theHurst exponent and determine the Allan variation andRMS slope [Haldemann and Anderson, 2002; Andersonet al., 2003]. This method can be used to map the resulting100 m slopes in and around the ellipses at about 0.2�resolution. These results are generally consistent with thepulse spread results (Table 10) showing Meridiani, Elysiumand Isidis to be smooth, Melas and Eos as particularlyrough and Gusev being the roughest of the final four sitesat this scale.[107] Stereogrammetry and PC results by Kirk et al.
[2003] show slope probability distributions that are longtailed, with greater slopes at the extremes, compared withGaussian distributions with the same RMS slopes. Bidirec-tional and adirectional RMS slopes at 3–6 m PC and 10 mstereo length scales are reported from Kirk et al. [2003] inTable 10. Bidirectional and adirectional slopes at a common5 m length scale, corrected via the Hurst exponent [Kirk etal., 2003], are discussed in this section and also reported inTable 10. These data indicate Meridiani is the smoothest sitewith adirectional RMS slopes of 2�–4�. The Elysium site isslightly rougher (3�–5� RMS slope) and comparable to theMars Pathfinder site (�5� RMS). Isidis is slightly rougher(3�–9� RMS), followed by Gusev (4�–17�), Eos (7�–14�),and Melas (15�–18�). RMS bidirectional slope versus
baseline derived from stereogrammetry and PC results [Kirket al., 2003] agree with 1.2 km baseline MOLA RMSbidirectional slopes, 100 m baseline MOLA Hurst exponentextrapolated slopes, and roughly 2 m baseline radar derivedRMS slopes, suggesting all of these different techniques areproducing consistent results for the final four landing sites.We now summarize the DEMs for the final four MERlanding sites.11.2.1. Gusev Crater[108] Gusev has the greatest variety of morphologic/
hazard units, from smooth cratered plains to much rougher,etched units [Kirk et al., 2002, 2003]. Most units haverelatively little albedo variation, and slopes from PC agreewith those from stereo. RMS slopes derived from theseunits show a range from 9� to 17� for the etched terrain tolower values for the cratered plains (�5�).11.2.2. Isidis Planitia[109] The single stereo DEM inside the Isidis ellipse is
dominated by a dense cluster of secondary impact craters(9�). The dark floors of the craters preclude use of PC. Spotstereo measurements were used to calibrate PC for two areasof cratered plains with more uniform albedo. Stereo-derivedslopes were not estimated for these areas but the PC-derivedslopes were 2�–3� [Kirk et al., 2002, 2003].11.2.3. Meridiani Planum[110] This site is so smooth that stereo matching failed to
produce usable results for several image pairs initially. Inthe absence of stereo data, a haze estimate for PC wasobtained by comparing the heights and slopes of local duneforms to similar ones elsewhere for which better data wereavailable [Kirk et al., 2002]. Slopes obtained in a typicalbland area of the site by this approach were small (1�–2�);apparent slopes in areas with prominent albedo variationswere higher but could be discarded as artifacts. Subsequentsuccessful stereo mapping of two image pairs with largerconvergence angles, yielded low slopes (1�–2� RMS) inexcellent agreement with those previously obtained fromPC. Subdued craters had slightly higher slopes (2.5�).11.2.4. Elysium Planitia[111] Two stereo pairs in this ellipse have been analyzed,
yielding slopes comparable to the smooth cratered plains inGusev. A large wrinkle ridge crosses the stereo pair, so themodel appears rougher (�3�–5� RMS) than typical for theellipse. A PC solution in the cratered plains shows RMSslopes of 2�–4�.
11.3. Radar Reflectivity and Roughness
[112] The specular scattering regime radar cross sectionsat 3.5 cm meet the MER radar altimeter (5 cm wavelength)design requirement for six of the seven proposed sites(Table 10). The requirement is for the radar altimeter toacquire and maintain track over surfaces with an equivalentHagfors Fresnel reflectivity greater than 0.03 and a Hag-fors model RMS surface roughness less than 8�. Radarreflectivities have been measured at Meridiani (0.05) and atIsidis (0.03), with acceptable values, and estimated to beacceptable at Gusev (�0.04) and at Elysium (�0.05). Theproposed Melas Chasma site falls just below the reflectiv-ity requirement (0.02), although this assessment is basedon sparse data from regions near, but not in the landingellipse. Reflectivity values such as these indicate a surfacewith loosely constrained, but reasonable bulk densities
GOLOMBEK ET AL.: SELECTION OF MER LANDING SITES ROV 13 - 33

[Golombek et al., 1997a] of �1500 kg/m3 at Meridiani andElysium, �1200 kg/m3 at Gusev and �1000 kg/m3 atIsidis, that should pose no special problem to landing orroving and are similar to the range of bulk densities ofsoils that were successfully landed on and roved over byMars Pathfinder [Moore et al., 1999].[113] Quasi-specular scattering can be analyzed to provide
RMS slope values for length scales in the range of 10–100times the wavelength. The RMS slope values at X-band(Table 10) are lower at the Meridiani (1.4�) and Isidis (3.3�)sites than at the Pathfinder landing site (4.5�). The Gusevsite observed at S-band has a quasi-specular RMS slope of1.7� and is smoother than the Viking 1 landing site (6�).Meter-scale RMS slopes are similar to those estimated fromMOC stereo and PC analysis, with Meridiani the smoothest,Elysium and Isidis also smooth, and Gusev rougher. Thediffuse scattering data provide information on the decimet-ric roughness of the sites that are of particular importance torover trafficability. In general the sites appear benign forrover driving; as for the specular data, most of the sites areas rough, or less rough than the Viking and Pathfinder sitesin the diffuse scattering channel. The notable exceptionis the proposed Athabasca site where at both 3.5 cm and12.6 cm wavelengths the diffuse component of backscatteris very enhanced, suggesting decimeter roughness akin tothat of a’a lava surfaces [Harmon et al., 1999]. Gusev is thenext roughest at decimeter scales. The X-band diffuse crosssection there is not a concern, but the near equality of thediffuse scattering measured in both senses of circularpolarization suggests that volume scattering in the nearsubsurface at Gusev is more important than at previouslanding sites. Finally, Haldemann et al. [2003; submittedmanuscript, 2003] make predictions regarding the appear-ance of the final four landing sites by comparisons toprevious Mars landing sites. They suggest that (1) the Isidisand Elysium Planitiae sites will resemble the Viking 1 orPathfinder site with gently rolling terrains, (2) the MeridianiPlanum site will be much less rocky and smoother than theViking 2 site, and (3) the Gusev crater site will have acombination of roughness at decimeter scales similar to orgreater than the Viking 1 and Pathfinder sites, but will besmoother at meter scales.
11.4. Relative Landing Site Safety and Site Pairing
[114] Evaluation of the dominant three safety criteria(slopes, rocks and winds) indicates that Meridiani is prob-ably the safest of the sites, followed by Elysium, Gusev andIsidis. Specifically, horizontal winds and wind shear arelowest at Meridiani and Elysium and higher at Gusev andIsidis. Rock abundance is lowest at Meridiani and Elysium,slightly higher at Gusev and higher still at Isidis. Slopes atthe scale of the airbags are, in order of increasing slopes,Meridiani, Elysium, Isidis and Gusev.[115] Because of their respective latitudes, to maximize
surface lifetime only MER-A would go to Gusev and onlyMER-B would go to Elysium (either lander can go toMeridiani and Isidis). As a result, for the highest sciencepriority sites, MER-A would go to Gusev and MER-Bwould go to Meridiani. For the two safest sites, MER-Awould go to Meridiani and MER-B would go to Elysium.For Meridiani and Isidis, either lander could go to eithersite, although mission lifetime would be maximized if
MER-A went to Meridiani (farther south) and MER-B wentto Isidis (farther north).
12. Landing Success Assessment
12.1. Landing Simulation
[116] EDL analysis with respect to differentiating systemperformance between the four candidate landing sites wasconducted using a three-stage Monte Carlo simulationemploying 2000 individual trials per scenario run. Eachscenario examined the effects of different assumptionsregarding the specific terrain, winds, ground hazards, andvehicle performance. The output of this process is a landingsite-dependent probability that the vehicle will encounter asituation with respect to its velocity, or the terrain, that isconsidered to be within the validated performance capabilityof the system.[117] An important aspect of the simulation analysis is
that the goal is to provide a means to gauge relative riskbetween sites rather than provide an absolute metric quan-tifying the probability of success or failure. Consequently,results were binned as either ‘‘within specification’’ or ‘‘outof specification.’’ There are two prime reasons for thissubtle distinction. First, no provisions were made to modelthe probability that electronic components or mechanicalsubassemblies will fail due to causes such as stochasticvariations in the quality of manufacturing. Cases judged tobe ‘‘out of specification’’ only resulted from interaction ofthe system with environmental factors such as winds, rocks,and slopes, or from performance variations of properlyoperating systems. Second, the landing system containsvery few sharp thresholds where crossing a validatedsubsystem performance boundary will result in certainfailure. As a simplifying assumption, no provisions weremade to model degraded, but possibly survivable perfor-mance beyond validated limits. Consequently, the simula-tion results may underestimate the actual reliability of thesystem with respect to the landing site environments.[118] In the evaluation process, key system parameters
such as velocities, forces, temperatures, and time constraintswere checked against a set of performance ‘‘redline’’ limitsduring each of the three simulation stages. Within a stage,individual Monte Carlo trials that satisfied all of the con-straints of that particular phase of the descent were judgedto be within specification. Subsequently, those trials wereallowed to continue to the next successive simulation stagewith the output state vector of the current stage serving asthe input conditions for the following stage.[119] The first of these three stages involved a 6-degree-
of-freedom simulation of the vehicle’s trajectory from theatmospheric entry point at 125 km altitude to the point ofparachute deployment. The primary statistical factors thatwere considered in this phase included the capability toaccurately target the vehicle to its atmospheric entry aimpoint, aerodynamic properties of the entry capsule underhypersonic flight conditions, and atmospheric density var-iations. Results from this stage of the simulation are notdiscussed in this paper because over 99.5% of all scenariosrun were judged to be within specification against theperformance metrics. In addition, postsimulation analysisrevealed that the results of this stage did not vary signifi-cantly between the landing sites.
ROV 13 - 34 GOLOMBEK ET AL.: SELECTION OF MER LANDING SITES
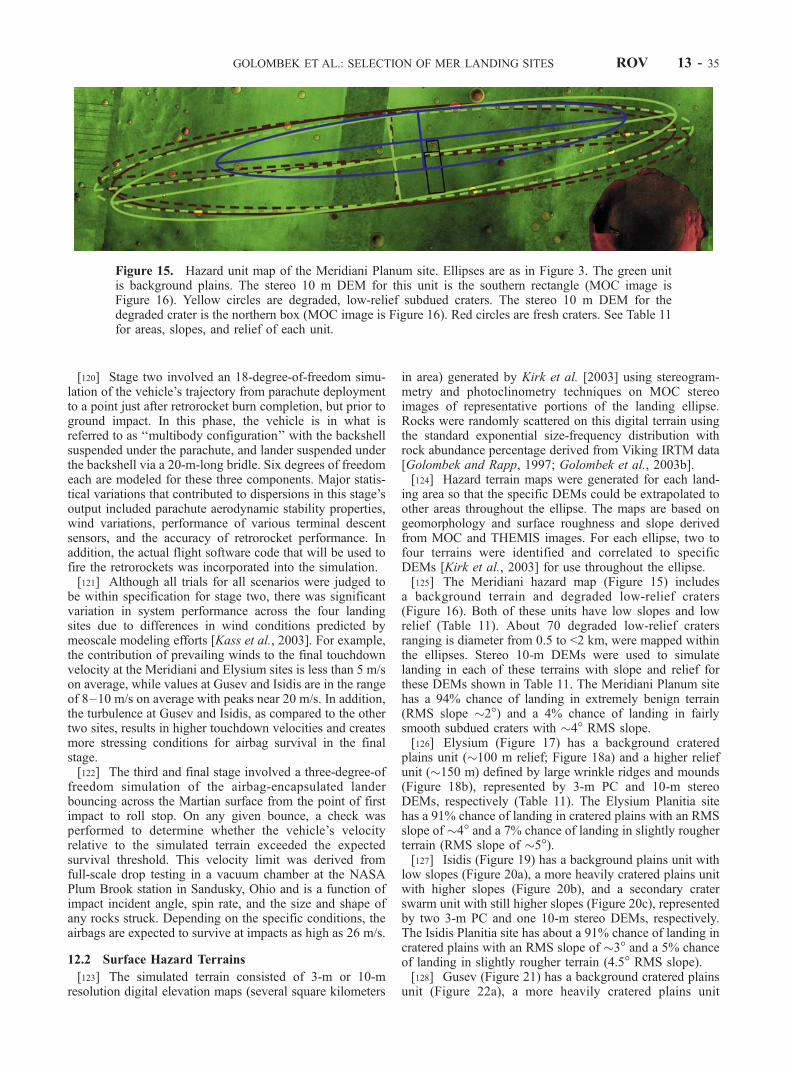
[120] Stage two involved an 18-degree-of-freedom simu-lation of the vehicle’s trajectory from parachute deploymentto a point just after retrorocket burn completion, but prior toground impact. In this phase, the vehicle is in what isreferred to as ‘‘multibody configuration’’ with the backshellsuspended under the parachute, and lander suspended underthe backshell via a 20-m-long bridle. Six degrees of freedomeach are modeled for these three components. Major statis-tical variations that contributed to dispersions in this stage’soutput included parachute aerodynamic stability properties,wind variations, performance of various terminal descentsensors, and the accuracy of retrorocket performance. Inaddition, the actual flight software code that will be used tofire the retrorockets was incorporated into the simulation.[121] Although all trials for all scenarios were judged to
be within specification for stage two, there was significantvariation in system performance across the four landingsites due to differences in wind conditions predicted bymeoscale modeling efforts [Kass et al., 2003]. For example,the contribution of prevailing winds to the final touchdownvelocity at the Meridiani and Elysium sites is less than 5 m/son average, while values at Gusev and Isidis are in the rangeof 8–10 m/s on average with peaks near 20 m/s. In addition,the turbulence at Gusev and Isidis, as compared to the othertwo sites, results in higher touchdown velocities and createsmore stressing conditions for airbag survival in the finalstage.[122] The third and final stage involved a three-degree-of
freedom simulation of the airbag-encapsulated landerbouncing across the Martian surface from the point of firstimpact to roll stop. On any given bounce, a check wasperformed to determine whether the vehicle’s velocityrelative to the simulated terrain exceeded the expectedsurvival threshold. This velocity limit was derived fromfull-scale drop testing in a vacuum chamber at the NASAPlum Brook station in Sandusky, Ohio and is a function ofimpact incident angle, spin rate, and the size and shape ofany rocks struck. Depending on the specific conditions, theairbags are expected to survive at impacts as high as 26 m/s.
12.2 Surface Hazard Terrains
[123] The simulated terrain consisted of 3-m or 10-mresolution digital elevation maps (several square kilometers
in area) generated by Kirk et al. [2003] using stereogram-metry and photoclinometry techniques on MOC stereoimages of representative portions of the landing ellipse.Rocks were randomly scattered on this digital terrain usingthe standard exponential size-frequency distribution withrock abundance percentage derived from Viking IRTM data[Golombek and Rapp, 1997; Golombek et al., 2003b].[124] Hazard terrain maps were generated for each land-
ing area so that the specific DEMs could be extrapolated toother areas throughout the ellipse. The maps are based ongeomorphology and surface roughness and slope derivedfrom MOC and THEMIS images. For each ellipse, two tofour terrains were identified and correlated to specificDEMs [Kirk et al., 2003] for use throughout the ellipse.[125] The Meridiani hazard map (Figure 15) includes
a background terrain and degraded low-relief craters(Figure 16). Both of these units have low slopes and lowrelief (Table 11). About 70 degraded low-relief cratersranging is diameter from 0.5 to <2 km, were mapped withinthe ellipses. Stereo 10-m DEMs were used to simulatelanding in each of these terrains with slope and relief forthese DEMs shown in Table 11. The Meridiani Planum sitehas a 94% chance of landing in extremely benign terrain(RMS slope �2�) and a 4% chance of landing in fairlysmooth subdued craters with �4� RMS slope.[126] Elysium (Figure 17) has a background cratered
plains unit (�100 m relief; Figure 18a) and a higher reliefunit (�150 m) defined by large wrinkle ridges and mounds(Figure 18b), represented by 3-m PC and 10-m stereoDEMs, respectively (Table 11). The Elysium Planitia sitehas a 91% chance of landing in cratered plains with an RMSslope of �4� and a 7% chance of landing in slightly rougherterrain (RMS slope of �5�).[127] Isidis (Figure 19) has a background plains unit with
low slopes (Figure 20a), a more heavily cratered plains unitwith higher slopes (Figure 20b), and a secondary craterswarm unit with still higher slopes (Figure 20c), representedby two 3-m PC and one 10-m stereo DEMs, respectively.The Isidis Planitia site has about a 91% chance of landing incratered plains with an RMS slope of �3� and a 5% chanceof landing in slightly rougher terrain (4.5� RMS slope).[128] Gusev (Figure 21) has a background cratered plains
unit (Figure 22a), a more heavily cratered plains unit
Figure 15. Hazard unit map of the Meridiani Planum site. Ellipses are as in Figure 3. The green unitis background plains. The stereo 10 m DEM for this unit is the southern rectangle (MOC image isFigure 16). Yellow circles are degraded, low-relief subdued craters. The stereo 10 m DEM for thedegraded crater is the northern box (MOC image is Figure 16). Red circles are fresh craters. See Table 11for areas, slopes, and relief of each unit.
GOLOMBEK ET AL.: SELECTION OF MER LANDING SITES ROV 13 - 35

(Figure 22b), and an etched terrain unit (Figure 22c), whichare represented by a 6-m PC and two 3-m PC DEMs,respectively; two of these units have moderate slopes andthe etched terrain has high relief and high slopes. The Gusevcrater site has an 85% chance of landing in cratered plainswith an RMS slope of �4�, a 6% chance of landing in onlyslightly rougher terrain (4.5� RMS slope) and a 6% chanceof landing in very rough terrain (RMS slope of 9.5�).[129] All of the ellipses have a unit of fresh craters larger
than �200 m that appear to have fresh bowl shapes and aremorphologically distinct from the craters in the units justdescribed. The largest fresh crater in any of the ellipses is�2 km. The Meridiani, Elysium, Isidis and Gusev ellipseshave about 2, 22, 75 and 70 fresh craters with a 0.5%, 0.8%,1.1% and 1.5% probability of landing in these fresh craters,respectively (Table 11). Because of the steep slopes thatcould spoof the altimeter and cause mistimed firing of theretrorockets, landing in these areas was assumed to be notsurvivable in the simulation, even though landing insidemany of these craters would be survivable. Total relief ofthese craters are assumed similar to fresh bowl shapedcraters with depths of �20% and rim heights �4% of theirdiameters.[130] These hazard maps are consistent with the slopes
over the ellipses derived from photoclinometry [Beyer et al.,2003] and the geologic and morphologic maps [e.g., Milamet al., 2003; Arvidson et al., 2003]. The slopes and relief ofthe hazard units within the ellipses further demonstrate thatthe Meridiani site has the lowest slopes, followed byElysium and Isidis sites, with parts of Gusev having thehighest slopes at the 3–10 m scale.
12.3. Landing Simulation Results
[131] Overall, the simulation results indicate that theMeridiani Planum site is likely to be the safest among thefour candidates with 96% in-specification landings weightedfor the three hazard units. The high rating is due to lowexpected winds, combined with a low rock abundance of 6%and relatively gentle slopes (the dominant three concerns).Sensitivity studies of results at this site were robust tomodeling uncertainties. For example, increasing the rockabundance by the 5% to account for the 20% uncertainty inthe estimate, or doubling the wind speed, or assuming a 10%degradation in airbag performance capability reduced thepercentage of in-specification landings to no lower than90%.[132] Simulations at Elysium Planitia indicated 95% of
landing are within specification weighted for the threehazard units within the ellipse. This result is statisticallyindistinguishable from Meridiani from a risk evaluationperspective due to an estimated ±3% calculation uncertaintywithin the simulation. This figure includes statistical run to
Figure 16. (opposite) MOC image of hazard units in theMeridiani Planum site for which DEMs were used in thelanding simulations. The subdued, shallow, degraded crateris a box around the northernmost crater in the image. Therest of the image is the background plains. MOC imageE18-01595 is about 4.1 km wide, with north up. The imageis outlined in the hazard map of Figure 15. See Table 11 forareas, slopes, and relief of units.
ROV 13 - 36 GOLOMBEK ET AL.: SELECTION OF MER LANDING SITES
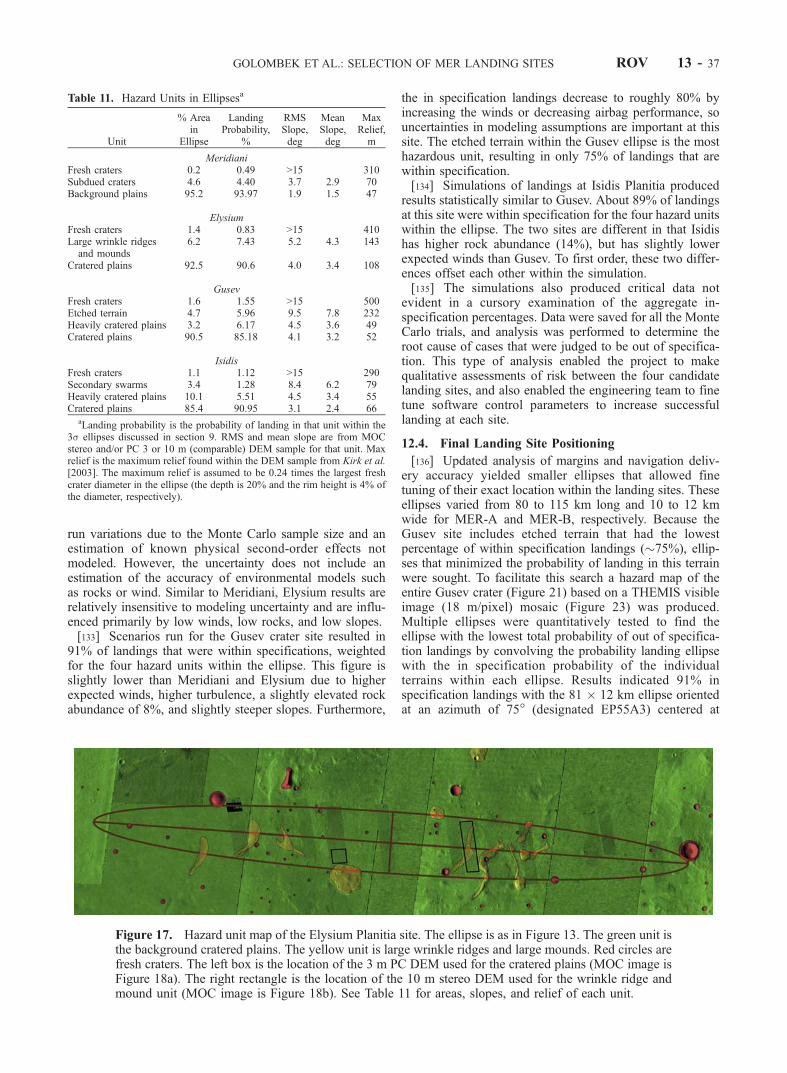
run variations due to the Monte Carlo sample size and anestimation of known physical second-order effects notmodeled. However, the uncertainty does not include anestimation of the accuracy of environmental models suchas rocks or wind. Similar to Meridiani, Elysium results arerelatively insensitive to modeling uncertainty and are influ-enced primarily by low winds, low rocks, and low slopes.[133] Scenarios run for the Gusev crater site resulted in
91% of landings that were within specifications, weightedfor the four hazard units within the ellipse. This figure isslightly lower than Meridiani and Elysium due to higherexpected winds, higher turbulence, a slightly elevated rockabundance of 8%, and slightly steeper slopes. Furthermore,
the in specification landings decrease to roughly 80% byincreasing the winds or decreasing airbag performance, souncertainties in modeling assumptions are important at thissite. The etched terrain within the Gusev ellipse is the mosthazardous unit, resulting in only 75% of landings that arewithin specification.[134] Simulations of landings at Isidis Planitia produced
results statistically similar to Gusev. About 89% of landingsat this site were within specification for the four hazard unitswithin the ellipse. The two sites are different in that Isidishas higher rock abundance (14%), but has slightly lowerexpected winds than Gusev. To first order, these two differ-ences offset each other within the simulation.[135] The simulations also produced critical data not
evident in a cursory examination of the aggregate in-specification percentages. Data were saved for all the MonteCarlo trials, and analysis was performed to determine theroot cause of cases that were judged to be out of specifica-tion. This type of analysis enabled the project to makequalitative assessments of risk between the four candidatelanding sites, and also enabled the engineering team to finetune software control parameters to increase successfullanding at each site.
12.4. Final Landing Site Positioning
[136] Updated analysis of margins and navigation deliv-ery accuracy yielded smaller ellipses that allowed finetuning of their exact location within the landing sites. Theseellipses varied from 80 to 115 km long and 10 to 12 kmwide for MER-A and MER-B, respectively. Because theGusev site includes etched terrain that had the lowestpercentage of within specification landings (�75%), ellip-ses that minimized the probability of landing in this terrainwere sought. To facilitate this search a hazard map of theentire Gusev crater (Figure 21) based on a THEMIS visibleimage (18 m/pixel) mosaic (Figure 23) was produced.Multiple ellipses were quantitatively tested to find theellipse with the lowest total probability of out of specifica-tion landings by convolving the probability landing ellipsewith the in specification probability of the individualterrains within each ellipse. Results indicated 91% inspecification landings with the 81 � 12 km ellipse orientedat an azimuth of 75� (designated EP55A3) centered at
Table 11. Hazard Units in Ellipsesa
Unit
% Areain
Ellipse
LandingProbability,
%
RMSSlope,deg
MeanSlope,deg
MaxRelief,m
MeridianiFresh craters 0.2 0.49 >15 310Subdued craters 4.6 4.40 3.7 2.9 70Background plains 95.2 93.97 1.9 1.5 47
ElysiumFresh craters 1.4 0.83 >15 410Large wrinkle ridgesand mounds
6.2 7.43 5.2 4.3 143
Cratered plains 92.5 90.6 4.0 3.4 108
GusevFresh craters 1.6 1.55 >15 500Etched terrain 4.7 5.96 9.5 7.8 232Heavily cratered plains 3.2 6.17 4.5 3.6 49Cratered plains 90.5 85.18 4.1 3.2 52
IsidisFresh craters 1.1 1.12 >15 290Secondary swarms 3.4 1.28 8.4 6.2 79Heavily cratered plains 10.1 5.51 4.5 3.4 55Cratered plains 85.4 90.95 3.1 2.4 66
aLanding probability is the probability of landing in that unit within the3s ellipses discussed in section 9. RMS and mean slope are from MOCstereo and/or PC 3 or 10 m (comparable) DEM sample for that unit. Maxrelief is the maximum relief found within the DEM sample from Kirk et al.[2003]. The maximum relief is assumed to be 0.24 times the largest freshcrater diameter in the ellipse (the depth is 20% and the rim height is 4% ofthe diameter, respectively).
Figure 17. Hazard unit map of the Elysium Planitia site. The ellipse is as in Figure 13. The green unit isthe background cratered plains. The yellow unit is large wrinkle ridges and large mounds. Red circles arefresh craters. The left box is the location of the 3 m PC DEM used for the cratered plains (MOC image isFigure 18a). The right rectangle is the location of the 10 m stereo DEM used for the wrinkle ridge andmound unit (MOC image is Figure 18b). See Table 11 for areas, slopes, and relief of each unit.
GOLOMBEK ET AL.: SELECTION OF MER LANDING SITES ROV 13 - 37
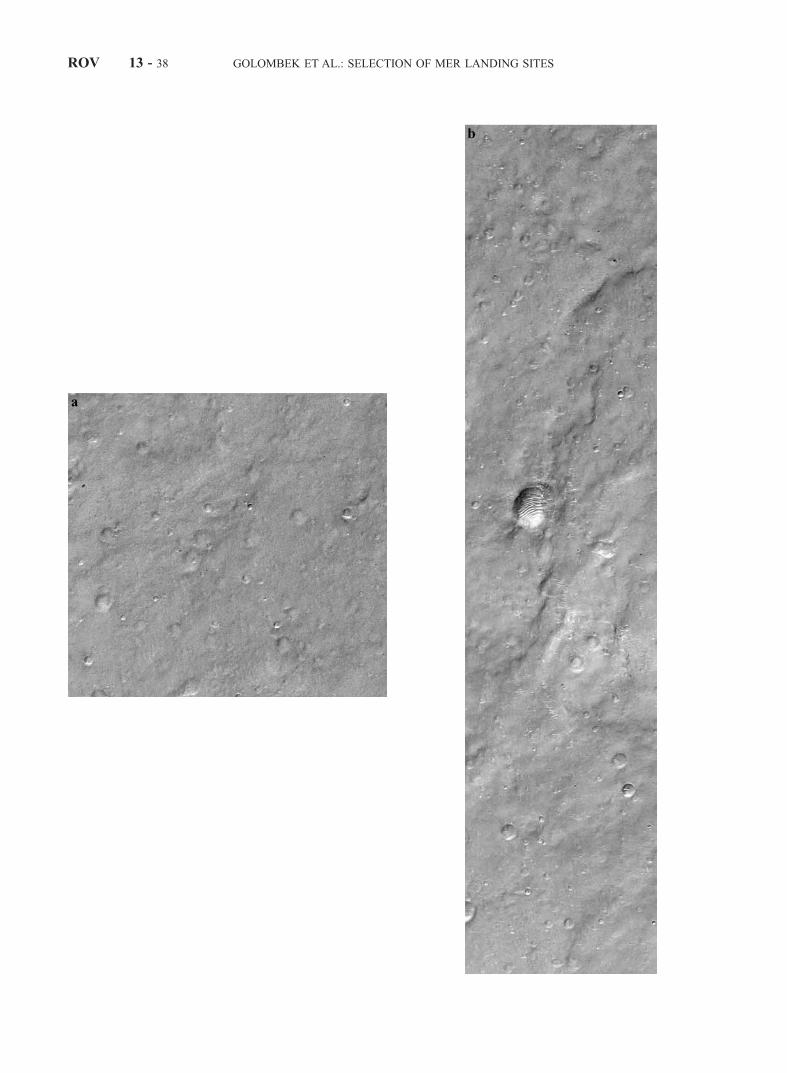
ROV 13 - 38 GOLOMBEK ET AL.: SELECTION OF MER LANDING SITES
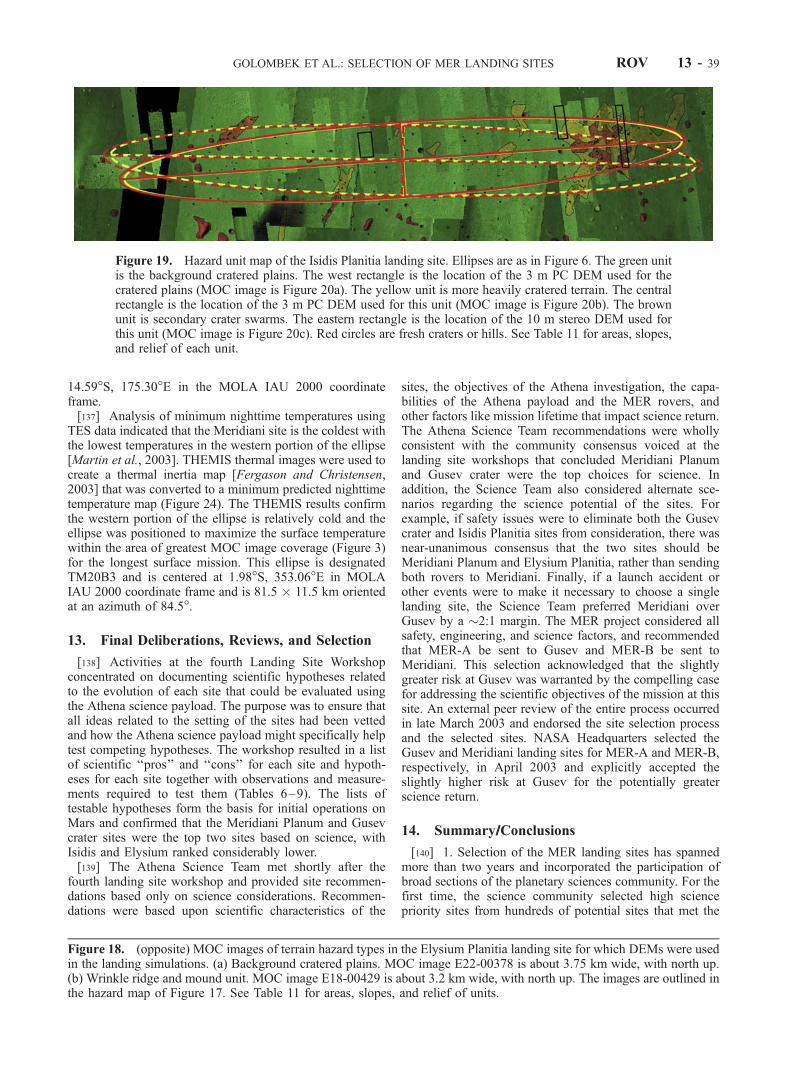
14.59�S, 175.30�E in the MOLA IAU 2000 coordinateframe.[137] Analysis of minimum nighttime temperatures using
TES data indicated that the Meridiani site is the coldest withthe lowest temperatures in the western portion of the ellipse[Martin et al., 2003]. THEMIS thermal images were used tocreate a thermal inertia map [Fergason and Christensen,2003] that was converted to a minimum predicted nighttimetemperature map (Figure 24). The THEMIS results confirmthe western portion of the ellipse is relatively cold and theellipse was positioned to maximize the surface temperaturewithin the area of greatest MOC image coverage (Figure 3)for the longest surface mission. This ellipse is designatedTM20B3 and is centered at 1.98�S, 353.06�E in MOLAIAU 2000 coordinate frame and is 81.5 � 11.5 km orientedat an azimuth of 84.5�.
13. Final Deliberations, Reviews, and Selection
[138] Activities at the fourth Landing Site Workshopconcentrated on documenting scientific hypotheses relatedto the evolution of each site that could be evaluated usingthe Athena science payload. The purpose was to ensure thatall ideas related to the setting of the sites had been vettedand how the Athena science payload might specifically helptest competing hypotheses. The workshop resulted in a listof scientific ‘‘pros’’ and ‘‘cons’’ for each site and hypoth-eses for each site together with observations and measure-ments required to test them (Tables 6–9). The lists oftestable hypotheses form the basis for initial operations onMars and confirmed that the Meridiani Planum and Gusevcrater sites were the top two sites based on science, withIsidis and Elysium ranked considerably lower.[139] The Athena Science Team met shortly after the
fourth landing site workshop and provided site recommen-dations based only on science considerations. Recommen-dations were based upon scientific characteristics of the
sites, the objectives of the Athena investigation, the capa-bilities of the Athena payload and the MER rovers, andother factors like mission lifetime that impact science return.The Athena Science Team recommendations were whollyconsistent with the community consensus voiced at thelanding site workshops that concluded Meridiani Planumand Gusev crater were the top choices for science. Inaddition, the Science Team also considered alternate sce-narios regarding the science potential of the sites. Forexample, if safety issues were to eliminate both the Gusevcrater and Isidis Planitia sites from consideration, there wasnear-unanimous consensus that the two sites should beMeridiani Planum and Elysium Planitia, rather than sendingboth rovers to Meridiani. Finally, if a launch accident orother events were to make it necessary to choose a singlelanding site, the Science Team preferred Meridiani overGusev by a �2:1 margin. The MER project considered allsafety, engineering, and science factors, and recommendedthat MER-A be sent to Gusev and MER-B be sent toMeridiani. This selection acknowledged that the slightlygreater risk at Gusev was warranted by the compelling casefor addressing the scientific objectives of the mission at thissite. An external peer review of the entire process occurredin late March 2003 and endorsed the site selection processand the selected sites. NASA Headquarters selected theGusev and Meridiani landing sites for MER-A and MER-B,respectively, in April 2003 and explicitly accepted theslightly higher risk at Gusev for the potentially greaterscience return.
14. Summary///Conclusions
[140] 1. Selection of the MER landing sites has spannedmore than two years and incorporated the participation ofbroad sections of the planetary sciences community. For thefirst time, the science community selected high sciencepriority sites from hundreds of potential sites that met the
Figure 18. (opposite) MOC images of terrain hazard types in the Elysium Planitia landing site for which DEMs were usedin the landing simulations. (a) Background cratered plains. MOC image E22-00378 is about 3.75 km wide, with north up.(b) Wrinkle ridge and mound unit. MOC image E18-00429 is about 3.2 km wide, with north up. The images are outlined inthe hazard map of Figure 17. See Table 11 for areas, slopes, and relief of units.
Figure 19. Hazard unit map of the Isidis Planitia landing site. Ellipses are as in Figure 6. The green unitis the background cratered plains. The west rectangle is the location of the 3 m PC DEM used for thecratered plains (MOC image is Figure 20a). The yellow unit is more heavily cratered terrain. The centralrectangle is the location of the 3 m PC DEM used for this unit (MOC image is Figure 20b). The brownunit is secondary crater swarms. The eastern rectangle is the location of the 10 m stereo DEM used forthis unit (MOC image is Figure 20c). Red circles are fresh craters or hills. See Table 11 for areas, slopes,and relief of each unit.
GOLOMBEK ET AL.: SELECTION OF MER LANDING SITES ROV 13 - 39
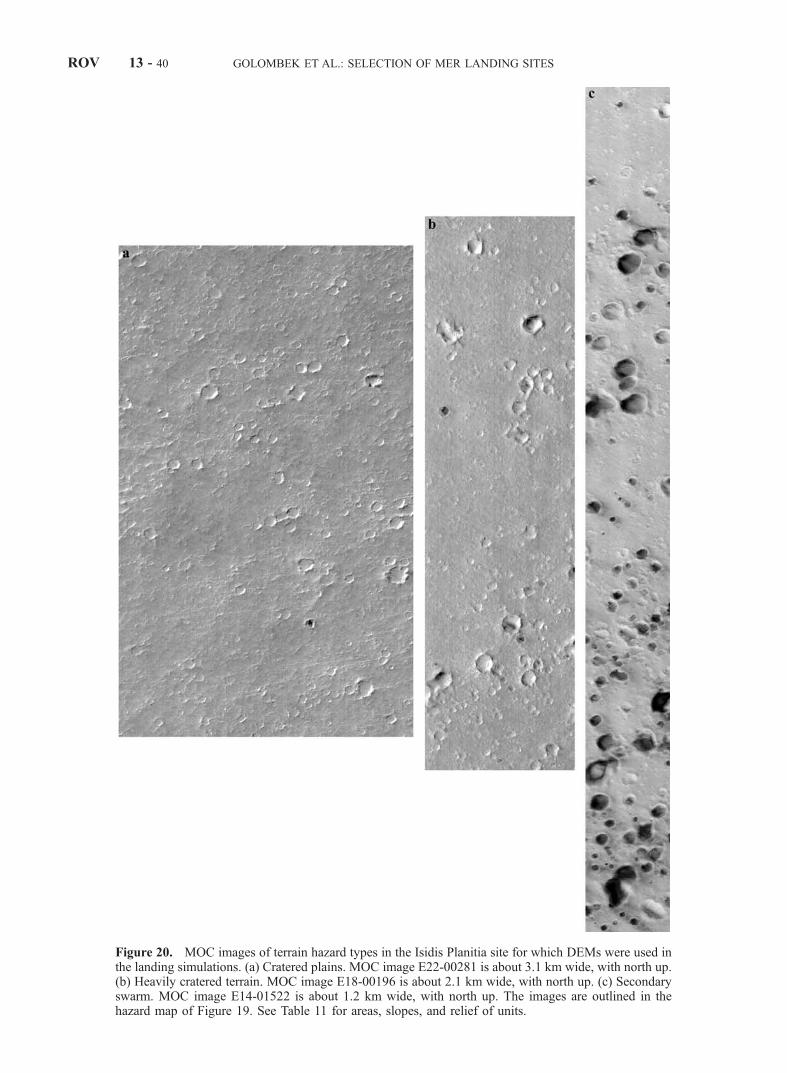
Figure 20. MOC images of terrain hazard types in the Isidis Planitia site for which DEMs were used inthe landing simulations. (a) Cratered plains. MOC image E22-00281 is about 3.1 km wide, with north up.(b) Heavily cratered terrain. MOC image E18-00196 is about 2.1 km wide, with north up. (c) Secondaryswarm. MOC image E14-01522 is about 1.2 km wide, with north up. The images are outlined in thehazard map of Figure 19. See Table 11 for areas, slopes, and relief of units.
ROV 13 - 40 GOLOMBEK ET AL.: SELECTION OF MER LANDING SITES
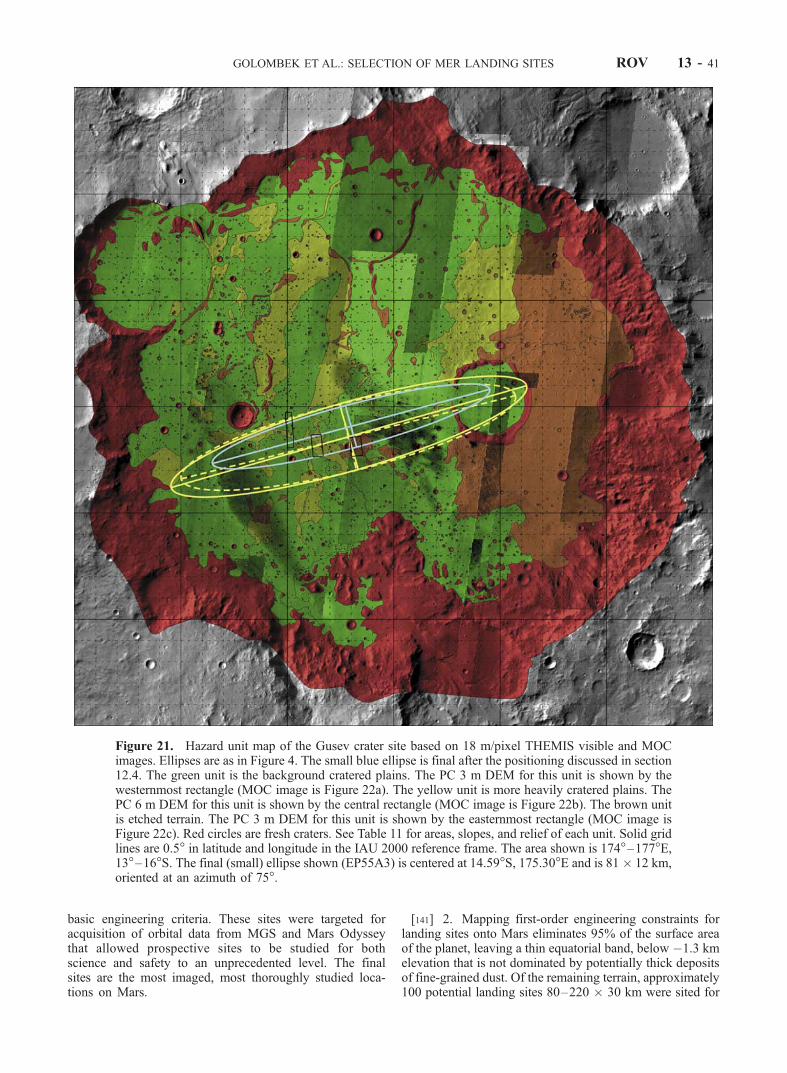
basic engineering criteria. These sites were targeted foracquisition of orbital data from MGS and Mars Odysseythat allowed prospective sites to be studied for bothscience and safety to an unprecedented level. The finalsites are the most imaged, most thoroughly studied loca-tions on Mars.
[141] 2. Mapping first-order engineering constraints forlanding sites onto Mars eliminates 95% of the surface areaof the planet, leaving a thin equatorial band, below �1.3 kmelevation that is not dominated by potentially thick depositsof fine-grained dust. Of the remaining terrain, approximately100 potential landing sites 80–220 � 30 km were sited for
Figure 21. Hazard unit map of the Gusev crater site based on 18 m/pixel THEMIS visible and MOCimages. Ellipses are as in Figure 4. The small blue ellipse is final after the positioning discussed in section12.4. The green unit is the background cratered plains. The PC 3 m DEM for this unit is shown by thewesternmost rectangle (MOC image is Figure 22a). The yellow unit is more heavily cratered plains. ThePC 6 m DEM for this unit is shown by the central rectangle (MOC image is Figure 22b). The brown unitis etched terrain. The PC 3 m DEM for this unit is shown by the easternmost rectangle (MOC image isFigure 22c). Red circles are fresh craters. See Table 11 for areas, slopes, and relief of each unit. Solid gridlines are 0.5� in latitude and longitude in the IAU 2000 reference frame. The area shown is 174�–177�E,13�–16�S. The final (small) ellipse shown (EP55A3) is centered at 14.59�S, 175.30�E and is 81 � 12 km,oriented at an azimuth of 75�.
GOLOMBEK ET AL.: SELECTION OF MER LANDING SITES ROV 13 - 41
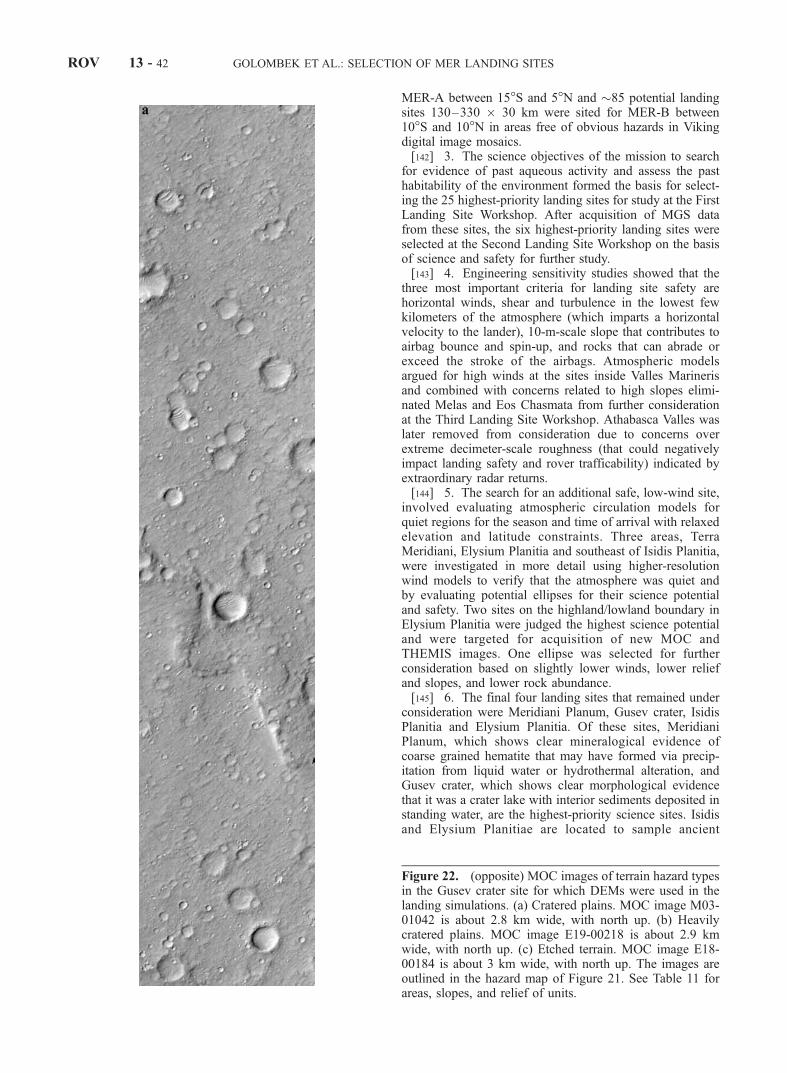
MER-A between 15�S and 5�N and �85 potential landingsites 130–330 � 30 km were sited for MER-B between10�S and 10�N in areas free of obvious hazards in Vikingdigital image mosaics.[142] 3. The science objectives of the mission to search
for evidence of past aqueous activity and assess the pasthabitability of the environment formed the basis for select-ing the 25 highest-priority landing sites for study at the FirstLanding Site Workshop. After acquisition of MGS datafrom these sites, the six highest-priority landing sites wereselected at the Second Landing Site Workshop on the basisof science and safety for further study.[143] 4. Engineering sensitivity studies showed that the
three most important criteria for landing site safety arehorizontal winds, shear and turbulence in the lowest fewkilometers of the atmosphere (which imparts a horizontalvelocity to the lander), 10-m-scale slope that contributes toairbag bounce and spin-up, and rocks that can abrade orexceed the stroke of the airbags. Atmospheric modelsargued for high winds at the sites inside Valles Marinerisand combined with concerns related to high slopes elimi-nated Melas and Eos Chasmata from further considerationat the Third Landing Site Workshop. Athabasca Valles waslater removed from consideration due to concerns overextreme decimeter-scale roughness (that could negativelyimpact landing safety and rover trafficability) indicated byextraordinary radar returns.[144] 5. The search for an additional safe, low-wind site,
involved evaluating atmospheric circulation models forquiet regions for the season and time of arrival with relaxedelevation and latitude constraints. Three areas, TerraMeridiani, Elysium Planitia and southeast of Isidis Planitia,were investigated in more detail using higher-resolutionwind models to verify that the atmosphere was quiet andby evaluating potential ellipses for their science potentialand safety. Two sites on the highland/lowland boundary inElysium Planitia were judged the highest science potentialand were targeted for acquisition of new MOC andTHEMIS images. One ellipse was selected for furtherconsideration based on slightly lower winds, lower reliefand slopes, and lower rock abundance.[145] 6. The final four landing sites that remained under
consideration were Meridiani Planum, Gusev crater, IsidisPlanitia and Elysium Planitia. Of these sites, MeridianiPlanum, which shows clear mineralogical evidence ofcoarse grained hematite that may have formed via precip-itation from liquid water or hydrothermal alteration, andGusev crater, which shows clear morphological evidencethat it was a crater lake with interior sediments deposited instanding water, are the highest-priority science sites. Isidisand Elysium Planitiae are located to sample ancient
Figure 22. (opposite) MOC images of terrain hazard typesin the Gusev crater site for which DEMs were used in thelanding simulations. (a) Cratered plains. MOC image M03-01042 is about 2.8 km wide, with north up. (b) Heavilycratered plains. MOC image E19-00218 is about 2.9 kmwide, with north up. (c) Etched terrain. MOC image E18-00184 is about 3 km wide, with north up. The images areoutlined in the hazard map of Figure 21. See Table 11 forareas, slopes, and relief of units.
ROV 13 - 42 GOLOMBEK ET AL.: SELECTION OF MER LANDING SITES
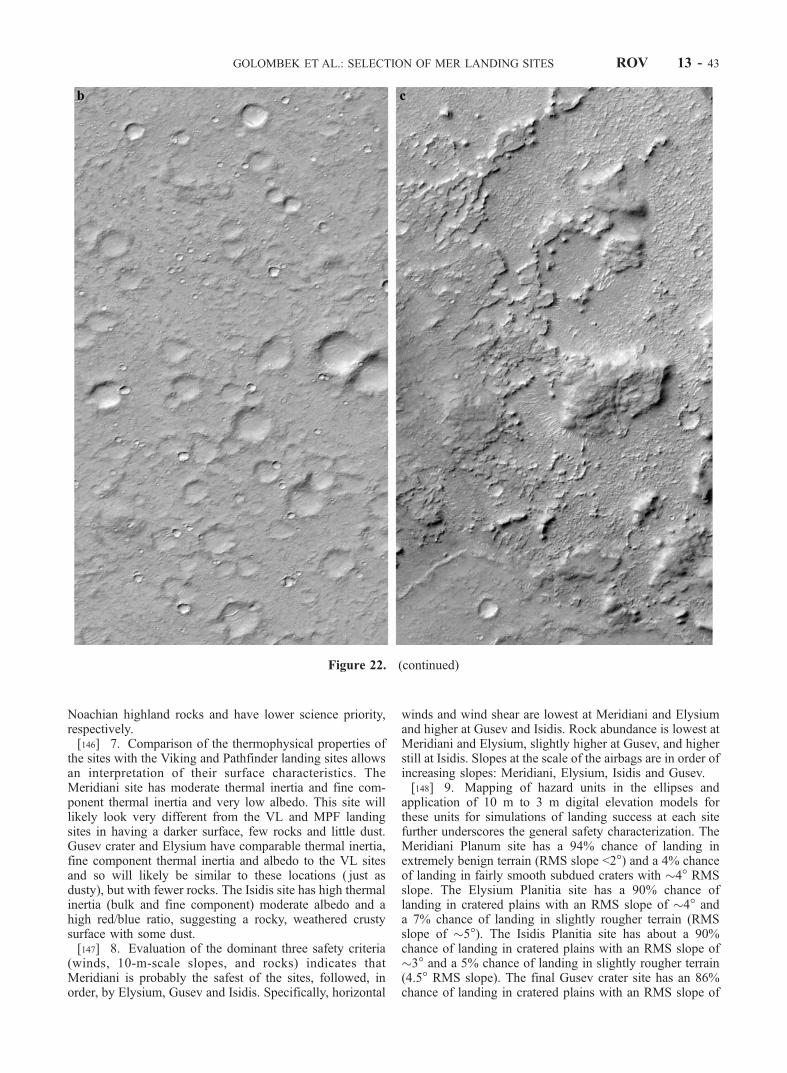
Noachian highland rocks and have lower science priority,respectively.[146] 7. Comparison of the thermophysical properties of
the sites with the Viking and Pathfinder landing sites allowsan interpretation of their surface characteristics. TheMeridiani site has moderate thermal inertia and fine com-ponent thermal inertia and very low albedo. This site willlikely look very different from the VL and MPF landingsites in having a darker surface, few rocks and little dust.Gusev crater and Elysium have comparable thermal inertia,fine component thermal inertia and albedo to the VL sitesand so will likely be similar to these locations ( just asdusty), but with fewer rocks. The Isidis site has high thermalinertia (bulk and fine component) moderate albedo and ahigh red/blue ratio, suggesting a rocky, weathered crustysurface with some dust.[147] 8. Evaluation of the dominant three safety criteria
(winds, 10-m-scale slopes, and rocks) indicates thatMeridiani is probably the safest of the sites, followed, inorder, by Elysium, Gusev and Isidis. Specifically, horizontal
winds and wind shear are lowest at Meridiani and Elysiumand higher at Gusev and Isidis. Rock abundance is lowest atMeridiani and Elysium, slightly higher at Gusev, and higherstill at Isidis. Slopes at the scale of the airbags are in order ofincreasing slopes: Meridiani, Elysium, Isidis and Gusev.[148] 9. Mapping of hazard units in the ellipses and
application of 10 m to 3 m digital elevation models forthese units for simulations of landing success at each sitefurther underscores the general safety characterization. TheMeridiani Planum site has a 94% chance of landing inextremely benign terrain (RMS slope <2�) and a 4% chanceof landing in fairly smooth subdued craters with �4� RMSslope. The Elysium Planitia site has a 90% chance oflanding in cratered plains with an RMS slope of �4� anda 7% chance of landing in slightly rougher terrain (RMSslope of �5�). The Isidis Planitia site has about a 90%chance of landing in cratered plains with an RMS slope of�3� and a 5% chance of landing in slightly rougher terrain(4.5� RMS slope). The final Gusev crater site has an 86%chance of landing in cratered plains with an RMS slope of
Figure 22. (continued)
GOLOMBEK ET AL.: SELECTION OF MER LANDING SITES ROV 13 - 43
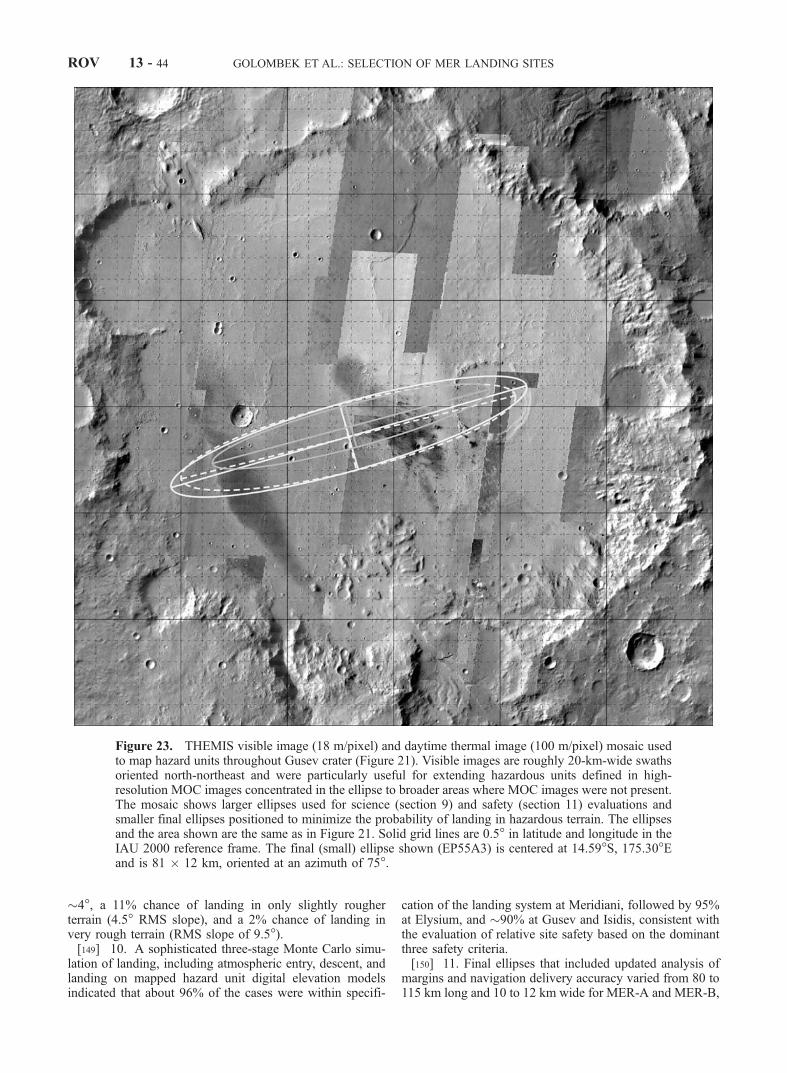
�4�, a 11% chance of landing in only slightly rougherterrain (4.5� RMS slope), and a 2% chance of landing invery rough terrain (RMS slope of 9.5�).[149] 10. A sophisticated three-stage Monte Carlo simu-
lation of landing, including atmospheric entry, descent, andlanding on mapped hazard unit digital elevation modelsindicated that about 96% of the cases were within specifi-
cation of the landing system at Meridiani, followed by 95%at Elysium, and �90% at Gusev and Isidis, consistent withthe evaluation of relative site safety based on the dominantthree safety criteria.[150] 11. Final ellipses that included updated analysis of
margins and navigation delivery accuracy varied from 80 to115 km long and 10 to 12 km wide for MER-A and MER-B,
Figure 23. THEMIS visible image (18 m/pixel) and daytime thermal image (100 m/pixel) mosaic usedto map hazard units throughout Gusev crater (Figure 21). Visible images are roughly 20-km-wide swathsoriented north-northeast and were particularly useful for extending hazardous units defined in high-resolution MOC images concentrated in the ellipse to broader areas where MOC images were not present.The mosaic shows larger ellipses used for science (section 9) and safety (section 11) evaluations andsmaller final ellipses positioned to minimize the probability of landing in hazardous terrain. The ellipsesand the area shown are the same as in Figure 21. Solid grid lines are 0.5� in latitude and longitude in theIAU 2000 reference frame. The final (small) ellipse shown (EP55A3) is centered at 14.59�S, 175.30�Eand is 81 � 12 km, oriented at an azimuth of 75�.
ROV 13 - 44 GOLOMBEK ET AL.: SELECTION OF MER LANDING SITES
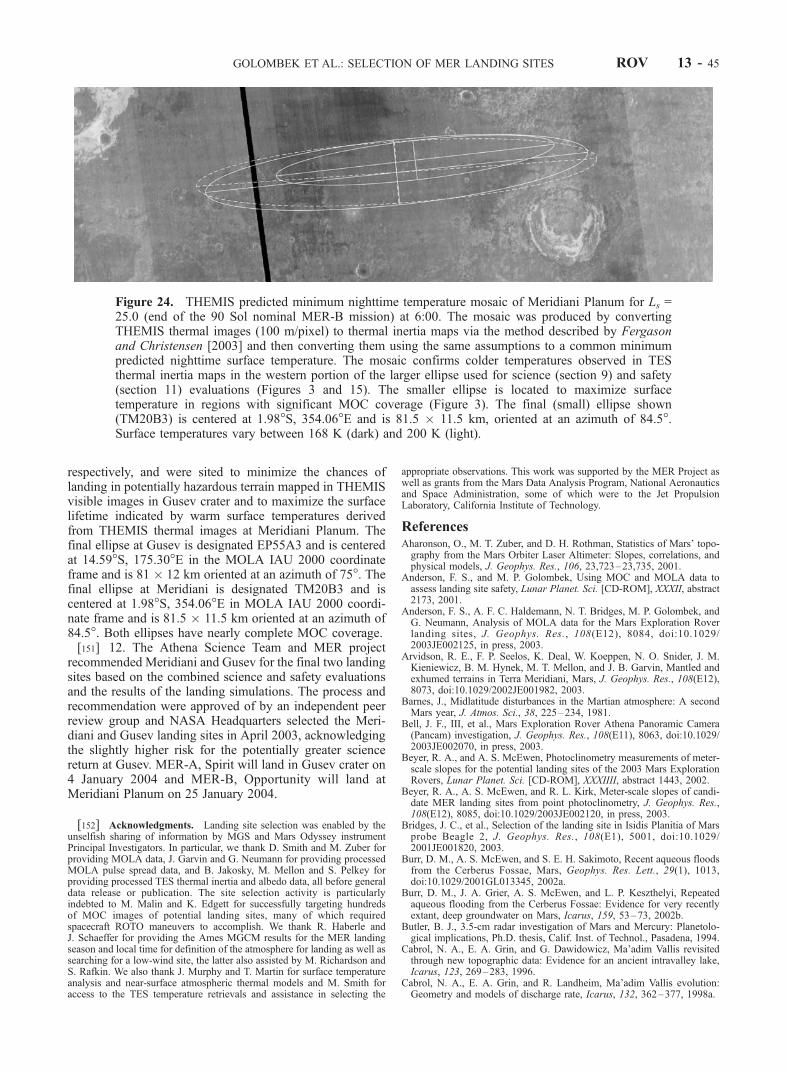
respectively, and were sited to minimize the chances oflanding in potentially hazardous terrain mapped in THEMISvisible images in Gusev crater and to maximize the surfacelifetime indicated by warm surface temperatures derivedfrom THEMIS thermal images at Meridiani Planum. Thefinal ellipse at Gusev is designated EP55A3 and is centeredat 14.59�S, 175.30�E in the MOLA IAU 2000 coordinateframe and is 81 � 12 km oriented at an azimuth of 75�. Thefinal ellipse at Meridiani is designated TM20B3 and iscentered at 1.98�S, 354.06�E in MOLA IAU 2000 coordi-nate frame and is 81.5 � 11.5 km oriented at an azimuth of84.5�. Both ellipses have nearly complete MOC coverage.[151] 12. The Athena Science Team and MER project
recommended Meridiani and Gusev for the final two landingsites based on the combined science and safety evaluationsand the results of the landing simulations. The process andrecommendation were approved of by an independent peerreview group and NASA Headquarters selected the Meri-diani and Gusev landing sites in April 2003, acknowledgingthe slightly higher risk for the potentially greater sciencereturn at Gusev. MER-A, Spirit will land in Gusev crater on4 January 2004 and MER-B, Opportunity will land atMeridiani Planum on 25 January 2004.
[152] Acknowledgments. Landing site selection was enabled by theunselfish sharing of information by MGS and Mars Odyssey instrumentPrincipal Investigators. In particular, we thank D. Smith and M. Zuber forproviding MOLA data, J. Garvin and G. Neumann for providing processedMOLA pulse spread data, and B. Jakosky, M. Mellon and S. Pelkey forproviding processed TES thermal inertia and albedo data, all before generaldata release or publication. The site selection activity is particularlyindebted to M. Malin and K. Edgett for successfully targeting hundredsof MOC images of potential landing sites, many of which requiredspacecraft ROTO maneuvers to accomplish. We thank R. Haberle andJ. Schaeffer for providing the Ames MGCM results for the MER landingseason and local time for definition of the atmosphere for landing as well assearching for a low-wind site, the latter also assisted by M. Richardson andS. Rafkin. We also thank J. Murphy and T. Martin for surface temperatureanalysis and near-surface atmospheric thermal models and M. Smith foraccess to the TES temperature retrievals and assistance in selecting the
appropriate observations. This work was supported by the MER Project aswell as grants from the Mars Data Analysis Program, National Aeronauticsand Space Administration, some of which were to the Jet PropulsionLaboratory, California Institute of Technology.
ReferencesAharonson, O., M. T. Zuber, and D. H. Rothman, Statistics of Mars’ topo-graphy from the Mars Orbiter Laser Altimeter: Slopes, correlations, andphysical models, J. Geophys. Res., 106, 23,723–23,735, 2001.
Anderson, F. S., and M. P. Golombek, Using MOC and MOLA data toassess landing site safety, Lunar Planet. Sci. [CD-ROM], XXXII, abstract2173, 2001.
Anderson, F. S., A. F. C. Haldemann, N. T. Bridges, M. P. Golombek, andG. Neumann, Analysis of MOLA data for the Mars Exploration Roverlanding sites, J. Geophys. Res., 108(E12), 8084, doi:10.1029/2003JE002125, in press, 2003.
Arvidson, R. E., F. P. Seelos, K. Deal, W. Koeppen, N. O. Snider, J. M.Kieniewicz, B. M. Hynek, M. T. Mellon, and J. B. Garvin, Mantled andexhumed terrains in Terra Meridiani, Mars, J. Geophys. Res., 108(E12),8073, doi:10.1029/2002JE001982, 2003.
Barnes, J., Midlatitude disturbances in the Martian atmosphere: A secondMars year, J. Atmos. Sci., 38, 225–234, 1981.
Bell, J. F., III, et al., Mars Exploration Rover Athena Panoramic Camera(Pancam) investigation, J. Geophys. Res., 108(E11), 8063, doi:10.1029/2003JE002070, in press, 2003.
Beyer, R. A., and A. S. McEwen, Photoclinometry measurements of meter-scale slopes for the potential landing sites of the 2003 Mars ExplorationRovers, Lunar Planet. Sci. [CD-ROM], XXXIIII, abstract 1443, 2002.
Beyer, R. A., A. S. McEwen, and R. L. Kirk, Meter-scale slopes of candi-date MER landing sites from point photoclinometry, J. Geophys. Res.,108(E12), 8085, doi:10.1029/2003JE002120, in press, 2003.
Bridges, J. C., et al., Selection of the landing site in Isidis Planitia of Marsprobe Beagle 2, J. Geophys. Res., 108(E1), 5001, doi:10.1029/2001JE001820, 2003.
Burr, D. M., A. S. McEwen, and S. E. H. Sakimoto, Recent aqueous floodsfrom the Cerberus Fossae, Mars, Geophys. Res. Lett., 29(1), 1013,doi:10.1029/2001GL013345, 2002a.
Burr, D. M., J. A. Grier, A. S. McEwen, and L. P. Keszthelyi, Repeatedaqueous flooding from the Cerberus Fossae: Evidence for very recentlyextant, deep groundwater on Mars, Icarus, 159, 53–73, 2002b.
Butler, B. J., 3.5-cm radar investigation of Mars and Mercury: Planetolo-gical implications, Ph.D. thesis, Calif. Inst. of Technol., Pasadena, 1994.
Cabrol, N. A., E. A. Grin, and G. Dawidowicz, Ma’adim Vallis revisitedthrough new topographic data: Evidence for an ancient intravalley lake,Icarus, 123, 269–283, 1996.
Cabrol, N. A., E. A. Grin, and R. Landheim, Ma’adim Vallis evolution:Geometry and models of discharge rate, Icarus, 132, 362–377, 1998a.
Figure 24. THEMIS predicted minimum nighttime temperature mosaic of Meridiani Planum for Ls =25.0 (end of the 90 Sol nominal MER-B mission) at 6:00. The mosaic was produced by convertingTHEMIS thermal images (100 m/pixel) to thermal inertia maps via the method described by Fergasonand Christensen [2003] and then converting them using the same assumptions to a common minimumpredicted nighttime surface temperature. The mosaic confirms colder temperatures observed in TESthermal inertia maps in the western portion of the larger ellipse used for science (section 9) and safety(section 11) evaluations (Figures 3 and 15). The smaller ellipse is located to maximize surfacetemperature in regions with significant MOC coverage (Figure 3). The final (small) ellipse shown(TM20B3) is centered at 1.98�S, 354.06�E and is 81.5 � 11.5 km, oriented at an azimuth of 84.5�.Surface temperatures vary between 168 K (dark) and 200 K (light).
GOLOMBEK ET AL.: SELECTION OF MER LANDING SITES ROV 13 - 45
Cabrol, N. A., E. A. Grin, R. Landheim, R. O Kuzmin, and R. Greeley,Duration of the Ma’adim Vallis/Gusev crater hydrologic system, Icarus,133, 98–108, 1998b.
Cabrol, N. A., et al., Exploring Gusev Crater with Spirit: Review of scienceobjectives and testable hypotheses, J. Geophys. Res., 108(E12), 8076,doi:10.1029/2002JE002026, in press, 2003.
Campbell, B. A., R. R. Ghent, and M. K. Shepard, Limits on inference ofMars small-scale topography from MOLA data, Geophys. Res. Lett.,30(3), 1116, doi:10.1029/2002GL016550, 2003.
Christensen, P. R., Martian dust mantling and surface composition: Inter-pretation of thermophysical properties, J. Geophys. Res., 87, 9985–9998,1982.
Christensen, P. R., Regional dust deposits on Mars: Physical properties,age, and history, J. Geophys. Res., 91, 3533–3545, 1986a.
Christensen, P. R., The spatial distribution of rocks on Mars, Icarus, 68,217–238, 1986b.
Christensen, P. R., and M. C. Malin, High resolution thermal imaging ofMars, Lunar Planet. Sci., XIX, 180–181, 1988.
Christensen, P. R., and H. J. Moore, The Martian surface layer, in Mars,edited by H. H. Kieffer et al., pp. 686–727, Univ. of Ariz. Press, Tucson,1992.
Christensen, P. R., et al., Detection of crystalline hematite mineralization onMars by the Thermal Emission Spectrometer: Evidence for near-surfacewater, J. Geophys. Res., 105, 9632–9642, 2000.
Christensen, P. R., et al., Mars Global Surveyor Thermal Emission Spectro-meter experiment: Investigation description and surface science results,J. Geophys. Res., 106, 23,823–23,871, 2001a.
Christensen, P. R., R. V. Morris, M. D. Lane, J. L. Bandfield, and M. C.Malin, Global mapping of Martian hematite mineral deposits: Remnantsof water-driven processes on early Mars, J. Geophys. Res., 106, 23,873–23,886, 2001b.
Christensen, P. R., et al., Morphology and composition of the surface ofMars: Mars Odyssey THEMIS results, Science, 300, 2056–2061, 2003a.
Christensen, P. R., et al., Miniature Thermal Emission Spectrometer for theMars Exploration Rovers, J. Geophys. Res., 108(E12), 8064,doi:10.1029/2003JE002117, in press, 2003b.
Clifford, S. M., and T. J. Parker, The evolution of the Martian hydrosphere:Implications for the fate of a primordial ocean and the current state of thenorthern plains, Icarus, 154, 40–79, 2001.
Collins, M., S. R. Lewis, P. L. Read, and F. Hourdin, Baroclinic wavetransitions in the Martian atmosphere, Icarus, 120, 344–357, 1996.
Crisp, J. A., M. Adler, J. R. Matijevic, S. W. Squyres, R. E. Arvidson, andD. M. Kass, Mars Exploration Rover mission, J. Geophys. Res.,108(E12), 8061, doi:10.1029/2002JE002038, 2003.
Crumpler, L. S., Southwestern Isidis Planitia, Mars: A Mars Surveyor land-ing site at the geologic contact between three units, Lunar Planet. Sci.[CD-ROM], XXIX, abstract 1946, 1999.
Crumpler, L., and K. Tanaka, Geology and MER target site characteristicsalong the southern rim of Isidis Planitia, Mars, J. Geophys. Res.,108(E12), 8080, doi:10.1029/2002JE002040, in press, 2003.
Fergason, R. L., and P. R. Christensen, Thermal inertia using THEMISinfrared data, Lunar Planet. Sci. [CD-ROM], XXIV, abstract 1785, 2003.
Garvin, J. B., J. J. Frawley, and J. B. Abshire, Vertical roughness of Marsfrom Mars Orbiter Laser Altimeter, Geophys. Res. Lett., 26, 381–384,1999.
Golombek, M., and D. Rapp, Size-frequency distributions of rocks on Marsand Earth analog sites: Implications for future landed missions, J. Geo-phys. Res., 102, 4117–4129, 1997.
Golombek, M. P., R. A. Cook, H. J. Moore, and T. J. Parker, Selection ofthe Mars Pathfinder landing site, J. Geophys. Res., 102, 3967–3988,1997a.
Golombek, M. P., et al., Overview of the Mars Pathfinder Mission andassessment of landing site predictions, Science, 278, 1743–1748, 1997b.
Golombek, M. P., H. J. Moore, A. F. C. Haldemann, T. J. Parker, and J. T.Schofield, Assessment of Mars Pathfinder landing site predictions,J. Geophys. Res., 104, 8585–8594, 1999.
Golombek, M., et al., Preliminary engineering constraints and potentiallanding sites for the Mars Exploration Rovers, Lunar Planet. Sci. [CD-ROM], XXXII, abstract 1234, 2001.
Golombek, M., et al., Downselection of landing sites for the Mars Explora-tion Rovers, Lunar Planet. Sci. [CD-ROM], XXXIII, abstract 1245, 2002.
Golombek, M., et al., Selection of the final four landing sites for the MarsExploration Rovers, Lunar Planet. Sci. [CD-ROM], XXXIIII, abstract1754, 2003a.
Golombek, M. P., A. F. C. Haldemann, N. K. Forsberg-Taylor, E. N.DiMaggio, R. D. Schroeder, B. M. Jakosky, M. T. Mellon, and J. R.Matijevic, Rock size-frequency distributions on Mars and implicationsfor Mars Exploration Rover landing safety and operations, J. Geophys.Res., 108(E12), 8086, doi:10.1029/2002JE002035, 2003b.
Gorevan, S., et al., Rock Abrasion Tool Mars Exploration Rover Mission,J. Geophys. Res., 108(E12), 8068, doi:10.1029/2003JE002061, in press,2003.
Greeley, R., and J. E. Guest, Geologic map of the eastern equatorial regionof Mars, U.S. Geol. Surv. Misc. Geol. Invest. Map, I-1802B, 1987.
Greeley, R., R. O. Kuzmin, S. C. R. Rafkin, T. I. Michaels, and R. Haberle,Wind-related features in Gusev crater, Mars, J. Geophys. Res., 108(E12),8087, doi:10.1029/2002JE002006, 2003.
Haberle, R. M., M. M. Joshi, J. R. Murphy, J. R. Barnes, J. T. Schofield,G. Wilson, M. Lopez-Valverde, J. L. Hollingsworth, A. F. C. Bridger, andJ. Schaeffer, General circulation model simulations of the Mars Pathfin-der atmospheric structure investigation/meteorology data, J. Geophys.Res., 104, 8957–8974, 1999.
Haldemann, A. F., and F. S. Anderson, Mars Exploration Rover landing sitehectometer slopes, Eos Trans. AGU, 83(47), Fall Meet. Suppl., AbstractP22A-0390, 2002.
Haldemann, A. F. C., D. L. Mitchell, R. F. Jurgens, M. A. Slade, and D. O.Muhleman, Mars Pathfinder landing site assessment with Goldstonedelay-Doppler and CW radar experiments, J. Geophys Res., 102,4097–4106, 1997.
Haldemann, A. F. C., K. W. Larsen, R. F. Jurgens, M. A. Slade, B. J.Butler, R. E. Arvidson, and J. K. Harmon, Gusev and Meridiani willlook different: Radar scattering properties of the Mars ExplorationRover landing sites, paper presented at the Sixth International Confer-ence on Mars, abstract 3272, Lunar and Planet. Inst., Pasadena, Calif.,July 2003.
Harmon, J. K., R. E. Arvidson, E. A. Guinness, B. A. Campbell, and M. A.Slade, Mars mapping with delay-Doppler radar, J. Geophys. Res., 104,14,065–14,089, 1999.
Head, J. W., H. Hiesinger, M. A. Ivanov, M. A. Kreslavsky, S. Pratt, andB. J. Thomson, Possible ancient oceans on Mars: Evidence from MarsOrbiter Laser Altimeter data, Science, 286, 2134–2137, 1999.
Herkenhoff, K., et al., Athena Microscopic Imager investigation, J. Geo-phys. Res., 108(E12), 8065, doi:10.1029/2003JE002076, 2003.
Hollingsworth, J. L., R. M. Haberle, J. R. Barnes, A. F. C. Brider, J. B.Pollack, H. Lee, and J. Schaeffer, Orographic control of storm zones onMars, Nature, 380, 413–416, 1996.
Hynek, B. M., and R. J. Phillips, Evidence for extensive denudation of theMartian highlands, Geology, 29, 407–410, 2001.
Hynek, B. M., R. E. Arvidson, and R. J. Phillips, Geologic setting andorigin of Terra Meridiani hematite deposits on Mars, J. Geophys. Res.,107(E10), 5088, doi:10.1029/2002JE001891, 2002.
Irwin, R. P., I. T. A. Maxwell, A. D. Howard, R. A. Craddock, and D. W.Leverington, A large paleolake basin at the head of Ma’adim Vallis,Mars, Science, 296, 2209–2212, 2002.
Ivanov, A. B., and J. J. Lorre, Analysis of Mars Orbiter Camera stereo pairs,Lunar Planet. Sci. [CD-ROM], XXXIII, abstract 1845, 2002.
Jakosky, B. M., On the thermal properties of Martian fines, Icarus, 66,117–124, 1986.
Jakosky, B. M., and P. R. Christensen, Global duricrust on Mars: Analysisof remote-sensing data, J. Geophys. Res., 91, 3547–3559, 1986.
Jakosky, B. M., and M. T. Mellon, High-resolution thermal inertia mappingof Mars: Sites of exobiological interest, J. Geophys. Res., 106, 23,887–23,907, 2001.
Jakosky, B. M., M. T. Mellon, H. H. Kieffer, P. R. Christensen, E. S.Varnes, and S. W. Lee, The thermal inertia of Mars from the Mars GlobalSurveyor Thermal Emission Spectrometer, J. Geophys. Res., 105, 9643–9652, 2000.
Jons, H.-P., Late sedimentation and late sediments in the northern lowlandson Mars, Lunar Planet. Sci., XVI, 414–415, 1985.
Jons, H.-P., Arcuate ground undulations, gelifluxion-like features and‘‘front tori’’ in the northern lowlands of Mars—What do they indicate?,Lunar Planet. Sci., XVII, 404–405, 1986.
Joshi, M., R. Haberle, J. Hollingsworth, and D. Hinson, A comparison ofMGS Phase 1 aerobraking radio occultation data and the NASA AmesMars GCM, J. Geophys. Res., 105, 17,601–17,615, 2000.
Kass, D., J. T. Schofield, T. Michaels, S. Rafkin, M. Richardson, andA. Toigo, Analysis of atmospheric mesoscale models for entry, descent,and landing, J. Geophys. Res., 108(E12), 8090, doi:10.1029/2003JE002065, in press, 2003.
Kieffer, H. H., T. Z. Martin, A. R. Peterfreund, B. M. Jakosky, E. D. Miner,and F. D. Palluconi, Thermal and albedo mapping of Mars during theViking Primary Mission, J. Geophys. Res., 82, 4249–4291, 1977.
Kirk, R. L., and B. Archinal, Topographic analysis of candidate MarsExploration Rover landing sites from MOC Narrow-Angle stereoimages,Lunar Planet. Sci. [CD-ROM], XXXIII, abstract 1988, 2002.
Kirk, R. L., K. T. Thompson, T. L. Becker, and E. M. Lee, Photometricmodelling for planetary cartography, Lunar Planet. Sci. [CD-ROM],XXXI, abstract 2025, 2000.
ROV 13 - 46 GOLOMBEK ET AL.: SELECTION OF MER LANDING SITES
Kirk, R. L., K. T. Thompson, and E. M. Lee, Photometry of the Martianatmosphere: An improved practical model for cartography and photocli-nometry, Lunar Planet. Sci. [CD-ROM], XXXII, abstract 1874, 2001.
Kirk, R., E. Howington-Kraus, B. Redding, D. Galuszka, T. M. Hare,B. Archinal, L. A. Soderblom, and J. Barrett, High-resolution topomap-ping of candidate MER landing sites with Mars Orbiter Camera narrow-angle images, J. Geophys. Res., 108(E12), 8088, doi:10.1029/2003JE002131, in press, 2003.
Klingelhofer, G., et al., Athena MIMOS II Mossbauer spectrometer inves-tigation, J. Geophys. Res., 108(E12), 8067, doi:10.1029/2003JE002138,in press, 2003.
Kreslavsky, M. A., and J. W. Head III, Kilometer-scale slopes on Mars andtheir correlation with geologic units: Initial results fromMars Orbiter LaserAltimeter (MOLA) data, J. Geophys. Res., 104, 21,911–21,924, 1999.
Kreslavsky, M. A., and J. W. Head III, Kilometer-scale roughness of Mars:Results from MOLA data analysis, J. Geophys. Res., 105, 26,695–26,711, 2000.
Kuzmin, R. O., R. Greeley, R. Landheim, N. A. Cabrol, and J. Farmer,Geologic map of the MTM-15182 and MTM 15187 Quadrangles, Gusevcrater-Ma’adim Valles Region, Mars, U.S. Geol. Sur. Misc. Geol. Invest.Map, I-2666, 2000.
Lane, M. D., R. V. Morris, S. A. Mertzman, and P. R. Christensen, Evidencefor platy hematite grains in Sinus Meridiani, Mars, J. Geophys. Res.,107(E12), 5126, doi:10.1029/2001JE001832, 2002.
Malin, M. C., and K. S. Edgett, Mars Global Surveyor Mars Orbiter Cam-era: Interplanetary cruise through primary mission, J. Geophys. Res., 106,23,429–23,570, 2001.
Martin, T. Z., N. T. Bridges, and J. R. Murphy, Near-surface temperatures atproposed Mars Exploration Rover landing sites, J. Geophys. Res.,108(E12), 8089, doi:10.1029/2003JE002063, 2003.
Masursky, H. H., and N. L. Crabill, The Viking landing sites: Selection andcertification, Science, 193, 809–812, 1976a.
Masursky, H. H., and N. L. Crabill, Search for the Viking 2 landing site,Science, 194, 62–68, 1976b.
Masursky, H. H., and N. L. Crabill, Viking site selection and certification,Rep. SP-429, 34 pp., NASA, Washington, D. C., 1981.
McEwen, A., P. Lanagan, R. Beyer, L. Keszthelyi, and D. Burr, Potential2003 landing sites in the Cerberus plains, SE Elysium Planitia (abstract),in First Landing Site Workshop for the 2003 Mars Exploration Rovers,Contrib. 1079, pp. 51–52, Lunar and Planet. Inst., Houston, Tex., 2001.
Mellon, M. T., B. M. Jakosky, H. H. Kieffer, and P. R. Christensen, High-resolution thermal inertia mapping from the Mars Global Surveyor Ther-mal Emission Spectrometer, Icarus, 148, 437–455, 2000.
Milam, K. A., K. R. Stockstill, J. E. Moersch, H. Y. McSween Jr., L. L.Tornabene, A. Ghosh, M. B. Wyatt, and P. R. Christensen, THEMIScharacterization of the MER Gusev crater landing site, J. Geophys.Res., 108(E12), 8078, doi:10.1029/2002JE002023, in press, 2003.
Minitti, M. E., J. F. Mustard, and M. J. Rutherford, Effects of glass contentand oxidation on the spectra of SNC-like basalts: Applications to Marsremote sensing, J. Geophys. Res., 107(E5), 5030, doi:10.1029/2001JE001518, 2002.
Moore, H. J., and B. M. Jakosky, Viking landing sites, remote sensingobservations, and physical properties of Martian surface materials,Icarus, 81, 164–184, 1989.
Moore, H. J., and J. M. Keller, Surface material maps of the Viking landingsites on Mars (abstract), in Reports of Planetary Geology and GeophysicsProgram—1989, Tech. Mem. 4210, pp. 533–535, NASA, Washington,D. C., 1990.
Moore, H. J., and J. M. Keller, Surface material maps of the Viking landingsites on Mars (abstract), in Reports of Planetary Geology and GeophysicsProgram—1990, Tech. Mem. 4300, pp. 160–162, NASA, Washington,D. C., 1991.
Moore, H. J., and T. W. Thompson, A radar-echo model for Mars, Proc.Lunar Planet. Sci. Conf., 21st, 457–472, 1991.
Moore, H. J., D. B. Bickler, J. A. Crisp, H. J. Eisen, J. A. Gensler, A. F. C.Haldemann, J. R. Matijevic, L. K. Reid, and F. Pavlics, Soil-like depositsobserved by Sojourner, the Pathfinder rover, J. Geophys. Res., 104,8729–8746, 1999.
Neumann, G. A., J. B. Abshire, O. Aharonson, J. B. Garvin, X. Sun, andM. T. Zuber, Mars Orbiter Laser Altimeter pulse width measurements andfootprint-scale roughness, Geophys. Res. Lett., 30(11), 1561,doi:10.1029/2003GL017048, 2003.
Noreen, E., K. L. Tanaka, and M. G. Chapman, TES hematite landing sitesin Sinus Meridiani for 2003 Mars Exploration Rover, paper presented atthe 2003 MER Landing Site Workshop, abstract 9014, Lunar and Planet.Inst., Houston, Tex., 2001.
Nowicki, S. A., and P. R. Christensen, Mars surface rock abundance fromThermal Emission Spectrometer (TES) mapping data, paper presented atthe Fifth International Conference on Mars, abstract 6191, Lunar andPlanet. Inst., Pasadena, Calif., 18 –23 July 1999.
Palluconi, F. D., and H. H. Kieffer, Thermal inertia mapping from 60�S to60�N, Icarus, 45, 415–426, 1981.
Parker, T. J., R. S. Saunders, and D. M. Schneeberger, Transitional mor-phology in the west Deuteronilus Mensae region of Mars: Implicationsfor modification of the lowland/upland boundary, Icarus, 82, 111–145,1989.
Parker, T. J., D. S. Gorsline, R. S. Saunders, D. C. Pieri, and D. M.Schneeberger, Coastal geomorphology of the Martian northern plains,J. Geophys. Res., 98, 11,061–11,078, 1993.
Pelkey, S. M., and B. M. Jakosky, Surficial geologic surveys of Gale Craterand Melas Chasma, Mars: Integration of remote sensing data, Icarus,160, 228–257, 2002.
Phillips, R. J., et al., Ancient geodynamics and global-scale hydrology onMars, Science, 291, 2587–2591, 2001.
Pleskot, L. K., and E. D. Miner, Time variability of Martian bolometricalbedo, Icarus, 45, 179–201, 1981.
Pollack, J. B., C. B. Leovy, Y. H. Mintz, and W. Van Camp, Winds on Marsduring the Viking season: Predictions based on a general circulationmodel with topography, Geophys. Res. Lett., 3, 479–483, 1976.
Pollack, J. B., R. M. Haberle, J. Schaeffer, and H. Lee, Simulations of thegeneral circulation of the Martian atmosphere: 1. Polar processes,J. Geophys. Res., 95, 1447–1473, 1990.
Rafkin, S. C. R., and T. I. Michaels, Meteorological predictions for 2003Mars Exploration Rover high-priority landing sites, J. Geophys. Res.,108(E12), 8091, doi:10.1029/2002JE002027, 2003.
Richardson, M. I., and R. J. Wilson, Investigation of the nature and stabilityof the Martian seasonal water cycle with a general circulation model,J. Geophys. Res., 107(E5), 5031, doi:10.1029/2001JE001536, 2002.
Rieder, R., R. Gellert, J. Bruckner, G. Klingelhofer, G. Dreibus, A. Yen, andS. W. Squyres, The new Athena alpha particle X-ray spectrometer for theMars Exploration Rovers, J. Geophys. Res., 108(E12), 8066,doi:10.1029/2003JE002150, 2003.
Ruff, S. W., and P. R. Christensen, Bright and dark regions on Mars:Particle size and mineralogical characteristics based on Thermal EmissionSpectrometer data, J. Geophys. Res., 107(E12), 5127, doi:10.1029/2001JE001580, 2002.
Schofield, J. T., et al., The Mars Pathfinder atmospheric structure investiga-tion meteorology (ASI/MET) experiment, Science, 278, 1752–1758,1997.
Scott, D. H., and K. L. Tanaka, Geologic map of the western equatorialregion of Mars, U.S. Geol. Surv. Misc. Geol. Invest. Map, I-1802A, 1986.
Shepard, M. K., B. A. Campbell, M. H. Bulmer, T. G. Farr, L. R. Gaddis,and J. J. Plaut, The roughness of natural terrain: A planetary and remotesensing perspective, J. Geophys. Res., 106, 32,777–32,795, 2001.
Simpson, R. A., J. K. Harmon, S. H. Zisk, T. W. Thompson, and D. O.Muhleman, Radar determination of Mars surface properties, in Mars,edited by H. H. Kieffer et al., pp. 652–685, Univ. Ariz. Press, Tucson,1992.
Smith, D. E., and M. T. Zuber, The relationship between MOLA northernhemisphere topography and the 6.1-mbar atmospheric pressure surface ofMars, Geophys. Res. Lett., 25, 4397–4400, 1998.
Smith, D. E., et al., Mars Orbiter Laser Altimeter: Experiment summaryafter the first year of global mapping of Mars, J. Geophys. Res., 106,23,689–23,722, 2001a.
Smith, M. D., J. C. Pearl, B. J. Conrath, and P. R. Christensen, ThermalEmission Spectrometer results: Mars atmospheric thermal structure andaerosol distribution, J. Geophys. Res., 106, 23,929–23,945, 2001b.
Soderblom, L. A., and R. L. Kirk, Meter-scale 3D models of the Martiansurface from combining MOC and MOLA data, Lunar Planet. Sci. [CD-ROM], XXXIV, abstract 1730, 2003.
Squyres, S. W., et al., Athena Mars Rover science investigation, J. Geo-phys. Res., 108(E12), 8062, doi:10.1029/2003JE002121, in press, 2003.
Tanaka, K., J. Skinner, and T. Hare, Geology of the ‘‘Elysium’’ MarsExploration Rover candidate landing site in southeastern Utopia Planitia,Eos Trans. AGU, 83(47), Fall Meet. Suppl., Abstract P22A-0388, 2002.
Tanaka, K. L., M. H. Carr, J. A. Skinner, M. S. Gilmore, and T. M. Hare,Geology of the MER 2003 ‘‘Elysium’’ candidate landing site in south-eastern Utopia Planitia, Mars, J. Geophys. Res., 108(E12), 8079,doi:10.1029/2003JE002054, in press, 2003.
Toigo, A. D., and M. I. Richardson, Meteorology of proposed MarsExploration Rover landing sites, J. Geophys. Res., 108(E12), 8092,doi:10.1029/2003JE002064, in press, 2003.
Tyler, G. L., G. Balmino, D. P. Hinson, W. L. Sjogren, D. E. Smith, R. A.Simpson, S. W. Asmar, P. Priest, and J. D. Twicken, Radio scienceobservations with Mars Global Surveyor: Orbit insertion through oneMars year in mapping orbit, J. Geophys. Res., 106, 23,327–23,348, 2001.
U.S. Geological Survey, Mission to Mars: Digital image maps, vers. 2.0,PDS vol. VO_2001 V2-VO_2006 V2, 2001.
Weitz, C. M., T. J. Parker, M. H. Bulmer, F. S. Anderson, and J. A. Grant,Geology of the Melas Chasma landing site for the Mars Exploration
GOLOMBEK ET AL.: SELECTION OF MER LANDING SITES ROV 13 - 47
Rover, J. Geophys. Res., 108(E12), 8082, doi:10.1029/2002JE002022, inpress, 2003.
Zurek, R. W., et al., Dynamics of the atmosphere of Mars, in Mars, editedby H. H. Kieffer et al., chap. 26, pp. 835–933, Univ. Ariz. Press, Tucson,1992.
�����������������������M. Adler, N. T. Bridges, J. A. Crisp, M. P. Golombek, A. F. C.
Haldemann, D. M. Kass, P. C. Knocke, W. J. Lee, T. J. Parker, R. B.Roncoli, J. T. Schofield, and R. W. Zurek, Jet Propulsion Laboratory,California Institute of Technology, 4800 Oak Grove Drive, Pasadena, CA91109 USA. ( [email protected]; [email protected]; [email protected]; [email protected]; [email protected]; [email protected]; [email protected]; [email protected]; [email protected]; [email protected]; [email protected]; [email protected])F. S. Anderson, Hawaii Institute of Geophysics and Planetology, School
of Ocean and Earth Science and Technology, University of Hawaii, 1680East-West Road, POST 602B, Honolulu, HI 96822, USA. ([email protected])
R. E. Arvidson, Department of Earth and Space Sciences, WashingtonUniversity, Campus Box 1169, One Brookings Drive, St. Louis, MO63130, USA. ([email protected])M. H. Carr, U.S. Geological Survey, Mail Stop 975, 345 Middlefield
Road, Menlo Park, CA 94025, USA. ([email protected])P. R. Christensen, R. L. Fergason, and J. W. Rice Jr., Department of
Geological Sciences, Arizona State University, Campus Box 871404,Tempe, AZ 85287-6305, USA. ([email protected]; [email protected]; [email protected])J. A. Grant, Center for Earth and Planetary Studies, National Air and
Space Museum, Smithsonian Institution, 4th and Independence SW,Washington, DC 20560-0315, USA. ([email protected])R. L. Kirk, Geologic Division/Branch of Astrogeology, U.S. Geological
Survey, 2255 North Gemini Drive, Flagstaff, AZ 86001, USA. ([email protected])S. W. Squyres, Department of Astronomy, Cornell University, 428 Space
Sciences Building, Ithaca, NY 14853-6801, USA. ([email protected])C. M. Weitz, NASA Headquarters, Mail Code SE,300 E Street SW,
Washington, DC 20546, USA. ([email protected])
ROV 13 - 48 GOLOMBEK ET AL.: SELECTION OF MER LANDING SITES