selected socio-economic data hinds county,...
TRANSCRIPT
www.fairvote2020.org
www.fairdata2000.com
17-Nov-13
Selected Socio-Economic Data
Hinds County, Mississippi
African American and White, Not Hispanic
Data Set: 2010-2012 American Community Survey 3-Year Estimates
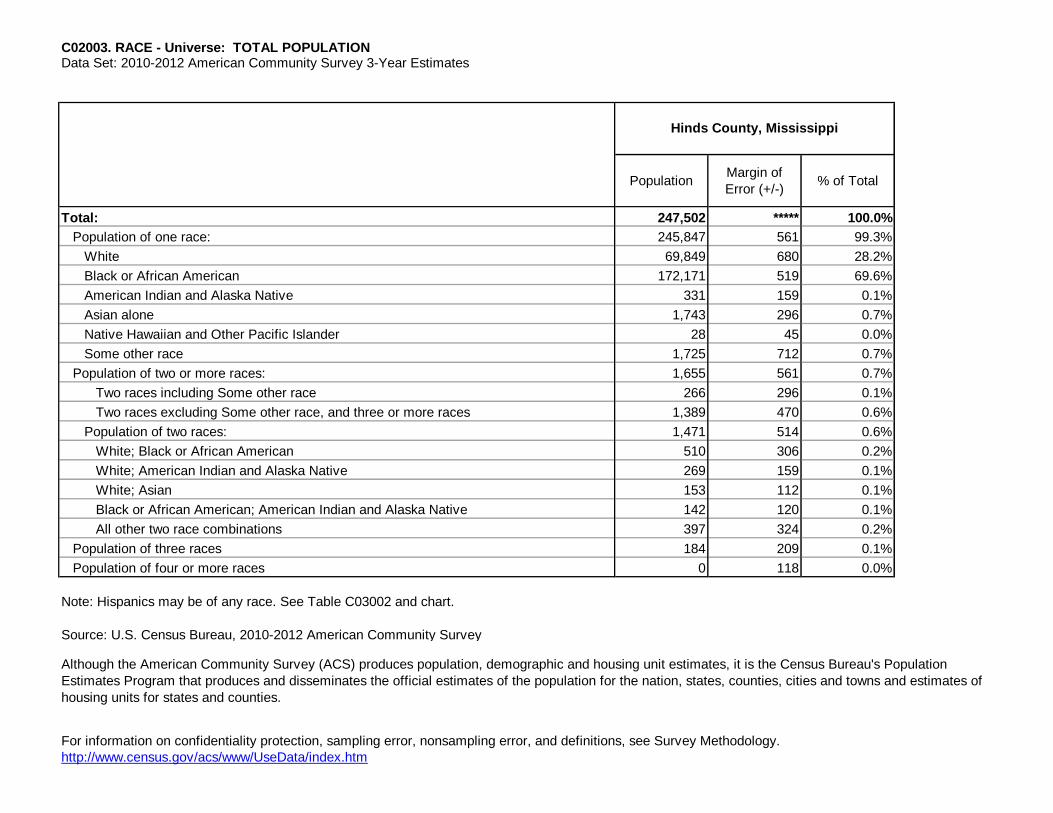
C02003. RACE - Universe: TOTAL POPULATION Data Set: 2010-2012 American Community Survey 3-Year Estimates
PopulationMargin of
Error (+/-)% of Total
Total: 247,502 ***** 100.0%
Population of one race: 245,847 561 99.3%
White 69,849 680 28.2%
Black or African American 172,171 519 69.6%
American Indian and Alaska Native 331 159 0.1%
Asian alone 1,743 296 0.7%
Native Hawaiian and Other Pacific Islander 28 45 0.0%
Some other race 1,725 712 0.7%
Population of two or more races: 1,655 561 0.7%
Two races including Some other race 266 296 0.1%
Two races excluding Some other race, and three or more races 1,389 470 0.6%
Population of two races: 1,471 514 0.6%
White; Black or African American 510 306 0.2%
White; American Indian and Alaska Native 269 159 0.1%
White; Asian 153 112 0.1%
Black or African American; American Indian and Alaska Native 142 120 0.1%
All other two race combinations 397 324 0.2%
Population of three races 184 209 0.1%
Population of four or more races 0 118 0.0%
Note: Hispanics may be of any race. See Table C03002 and chart.
Source: U.S. Census Bureau, 2010-2012 American Community Survey
http://www.census.gov/acs/www/UseData/index.htm
Hinds County, Mississippi
For information on confidentiality protection, sampling error, nonsampling error, and definitions, see Survey Methodology.
Although the American Community Survey (ACS) produces population, demographic and housing unit estimates, it is the Census Bureau's Population
Estimates Program that produces and disseminates the official estimates of the population for the nation, states, counties, cities and towns and estimates of
housing units for states and counties.
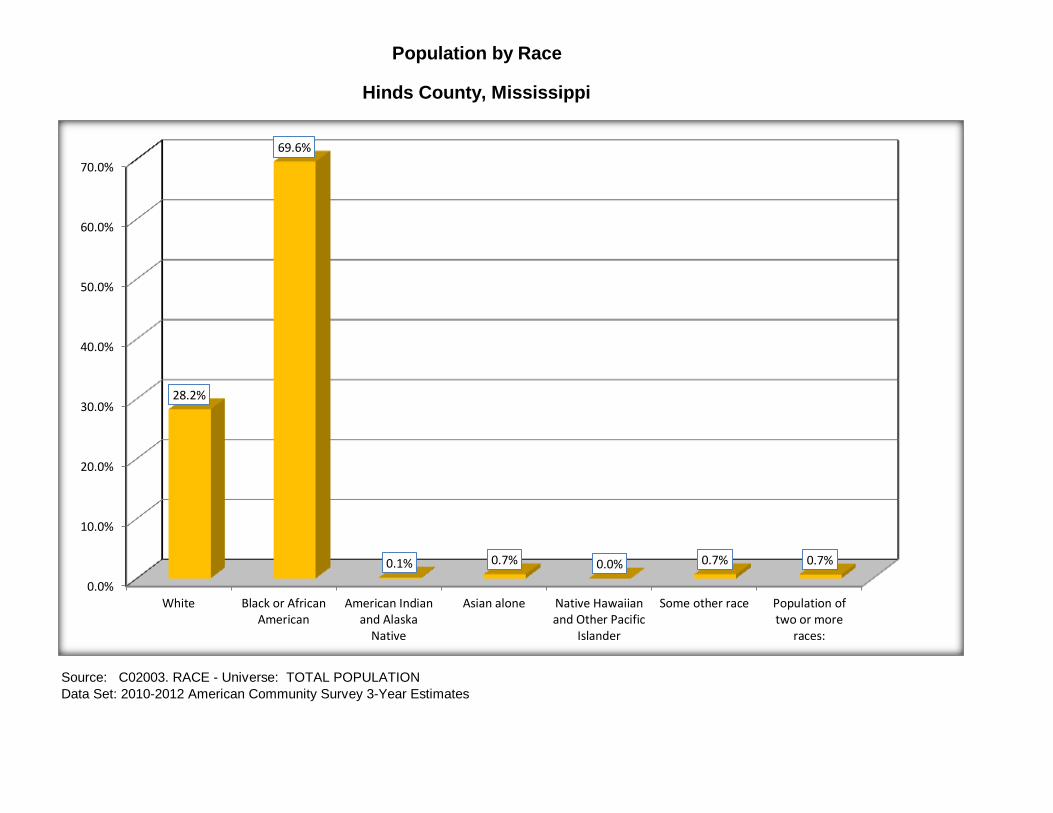
Source: C02003. RACE - Universe: TOTAL POPULATION
Data Set: 2010-2012 American Community Survey 3-Year Estimates
Hinds County, Mississippi
Population by Race
0.0%
10.0%
20.0%
30.0%
40.0%
50.0%
60.0%
70.0%
White Black or AfricanAmerican
American Indianand Alaska
Native
Asian alone Native Hawaiianand Other Pacific
Islander
Some other race Population oftwo or more
races:
28.2%
69.6%
0.1% 0.7% 0.0% 0.7% 0.7%
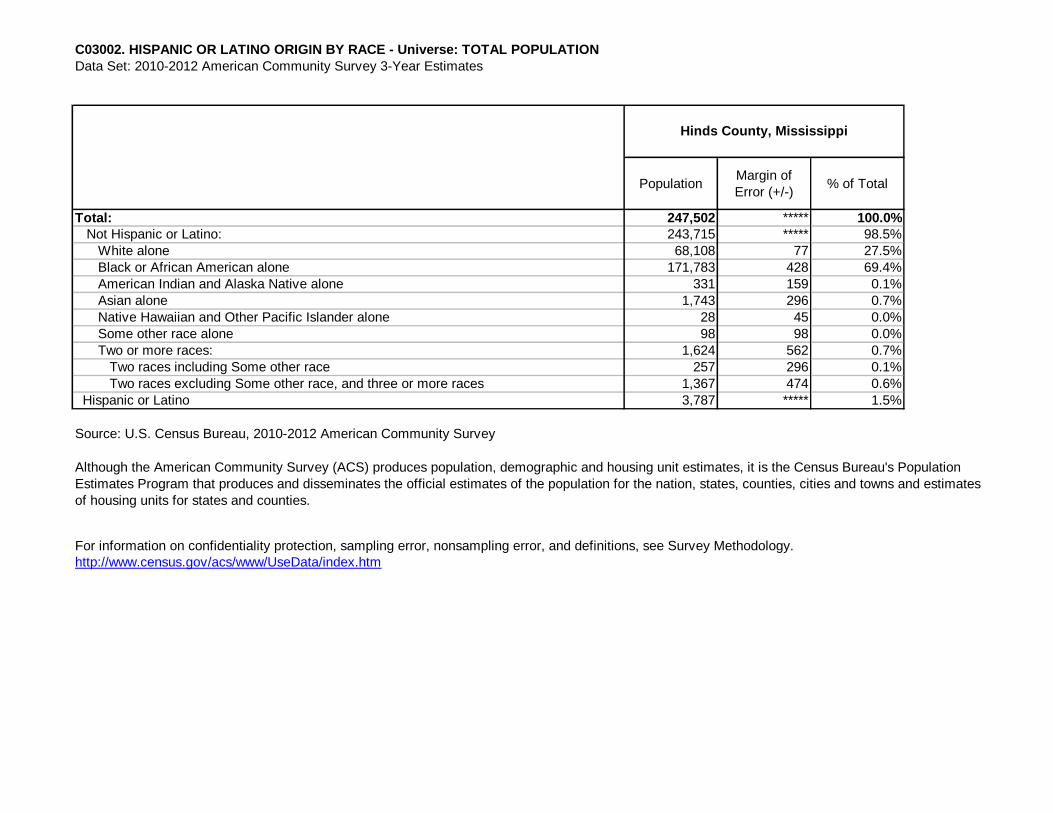
C03002. HISPANIC OR LATINO ORIGIN BY RACE - Universe: TOTAL POPULATION
Data Set: 2010-2012 American Community Survey 3-Year Estimates
PopulationMargin of
Error (+/-)% of Total
Total: 247,502 ***** 100.0%
Not Hispanic or Latino: 243,715 ***** 98.5%
White alone 68,108 77 27.5%
Black or African American alone 171,783 428 69.4%
American Indian and Alaska Native alone 331 159 0.1%
Asian alone 1,743 296 0.7%
Native Hawaiian and Other Pacific Islander alone 28 45 0.0%
Some other race alone 98 98 0.0%
Two or more races: 1,624 562 0.7%
Two races including Some other race 257 296 0.1%
Two races excluding Some other race, and three or more races 1,367 474 0.6%
Hispanic or Latino 3,787 ***** 1.5%
Source: U.S. Census Bureau, 2010-2012 American Community Survey
http://www.census.gov/acs/www/UseData/index.htm
For information on confidentiality protection, sampling error, nonsampling error, and definitions, see Survey Methodology.
Hinds County, Mississippi
Although the American Community Survey (ACS) produces population, demographic and housing unit estimates, it is the Census Bureau's Population
Estimates Program that produces and disseminates the official estimates of the population for the nation, states, counties, cities and towns and estimates
of housing units for states and counties.
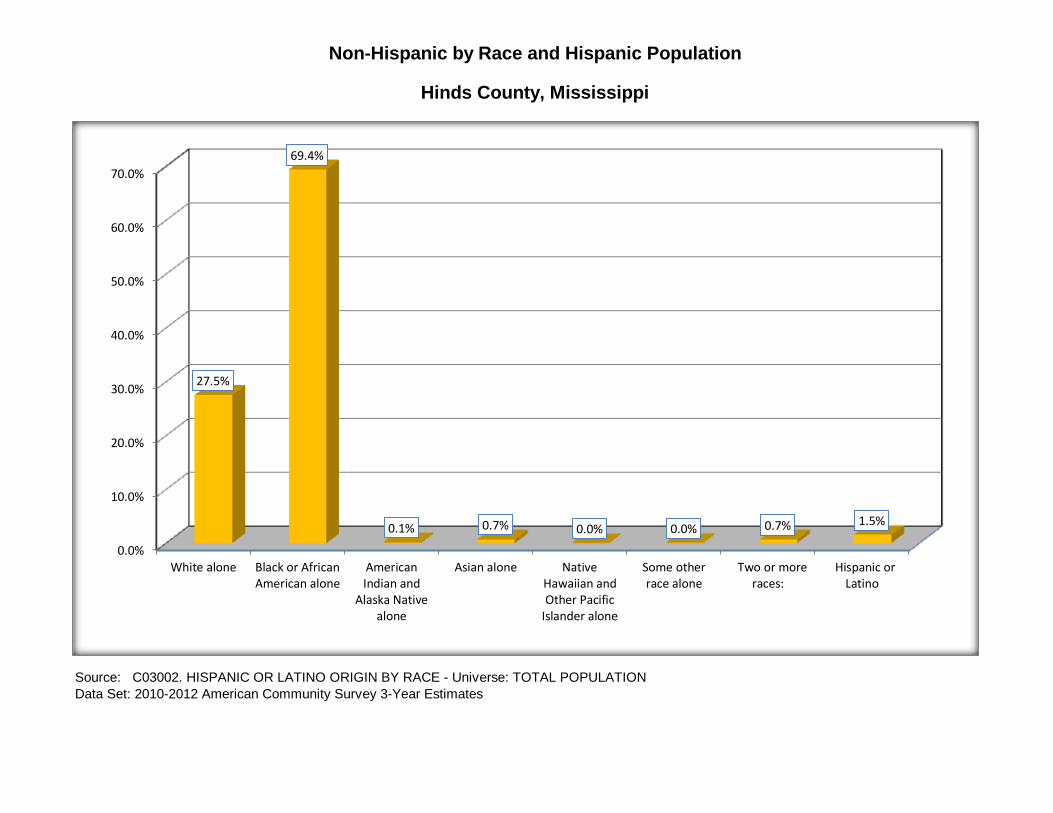
Source: C03002. HISPANIC OR LATINO ORIGIN BY RACE - Universe: TOTAL POPULATION
Data Set: 2010-2012 American Community Survey 3-Year Estimates
Hinds County, Mississippi
Non-Hispanic by Race and Hispanic Population
0.0%
10.0%
20.0%
30.0%
40.0%
50.0%
60.0%
70.0%
White alone Black or AfricanAmerican alone
AmericanIndian and
Alaska Nativealone
Asian alone NativeHawaiian andOther Pacific
Islander alone
Some otherrace alone
Two or moreraces:
Hispanic orLatino
27.5%
69.4%
0.1% 0.7% 0.0% 0.0% 0.7% 1.5%
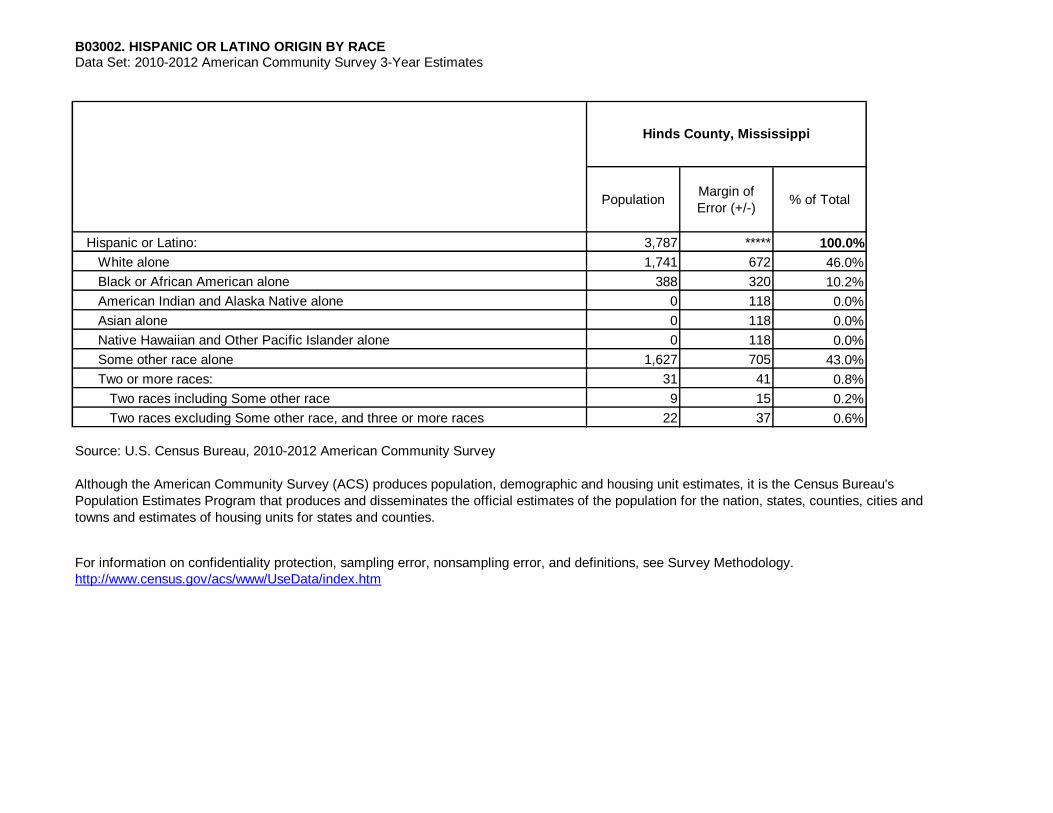
B03002. HISPANIC OR LATINO ORIGIN BY RACE Data Set: 2010-2012 American Community Survey 3-Year Estimates
PopulationMargin of
Error (+/-)% of Total
Hispanic or Latino: 3,787 ***** 100.0%
White alone 1,741 672 46.0%
Black or African American alone 388 320 10.2%
American Indian and Alaska Native alone 0 118 0.0%
Asian alone 0 118 0.0%
Native Hawaiian and Other Pacific Islander alone 0 118 0.0%
Some other race alone 1,627 705 43.0%
Two or more races: 31 41 0.8%
Two races including Some other race 9 15 0.2%
Two races excluding Some other race, and three or more races 22 37 0.6%
http://www.census.gov/acs/www/UseData/index.htm
Source: U.S. Census Bureau, 2010-2012 American Community Survey
Hinds County, Mississippi
Although the American Community Survey (ACS) produces population, demographic and housing unit estimates, it is the Census Bureau's
Population Estimates Program that produces and disseminates the official estimates of the population for the nation, states, counties, cities and
towns and estimates of housing units for states and counties.
For information on confidentiality protection, sampling error, nonsampling error, and definitions, see Survey Methodology.
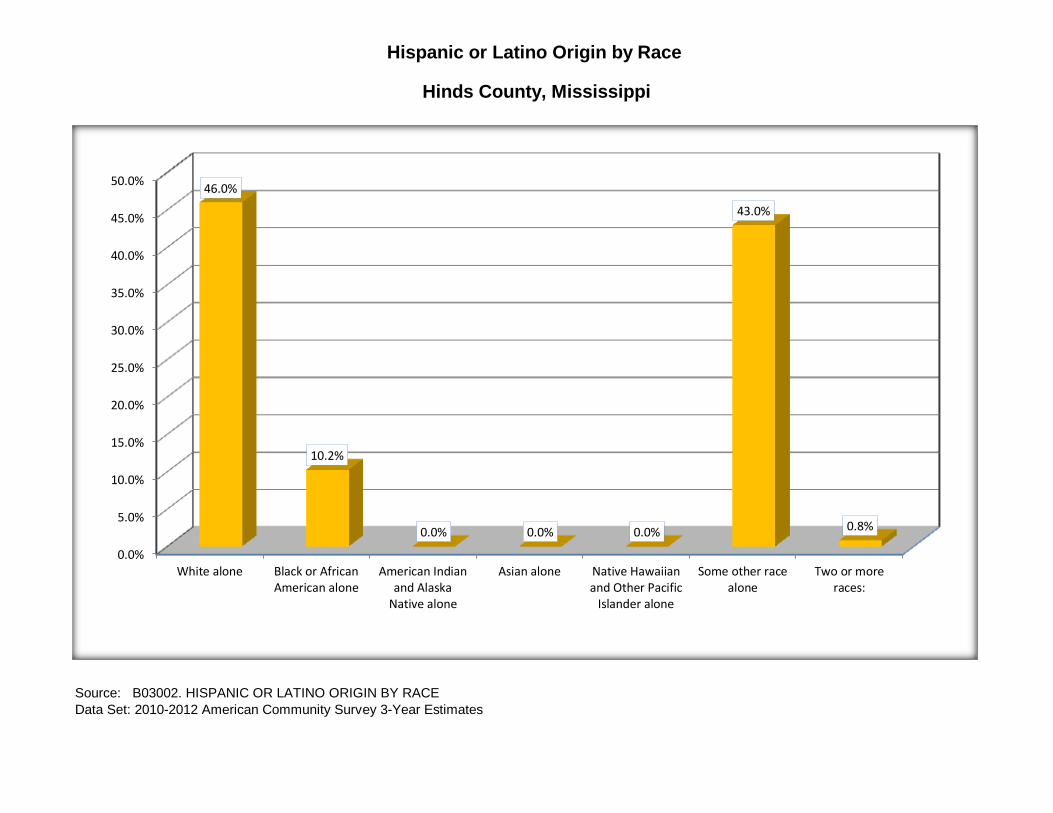
Source: B03002. HISPANIC OR LATINO ORIGIN BY RACE
Data Set: 2010-2012 American Community Survey 3-Year Estimates
Hinds County, Mississippi
Hispanic or Latino Origin by Race
0.0%
5.0%
10.0%
15.0%
20.0%
25.0%
30.0%
35.0%
40.0%
45.0%
50.0%
White alone Black or AfricanAmerican alone
American Indianand Alaska
Native alone
Asian alone Native Hawaiianand Other Pacific
Islander alone
Some other racealone
Two or moreraces:
46.0%
10.2%
0.0% 0.0% 0.0%
43.0%
0.8%
Data Set: 2010-2012 American Community Survey 3-Year Estimates
African-
American
Margin of
Error (+/-)% of AA Total
White, Not
Hispanic
Margin of
Error (+/-)
% of NHW
Total
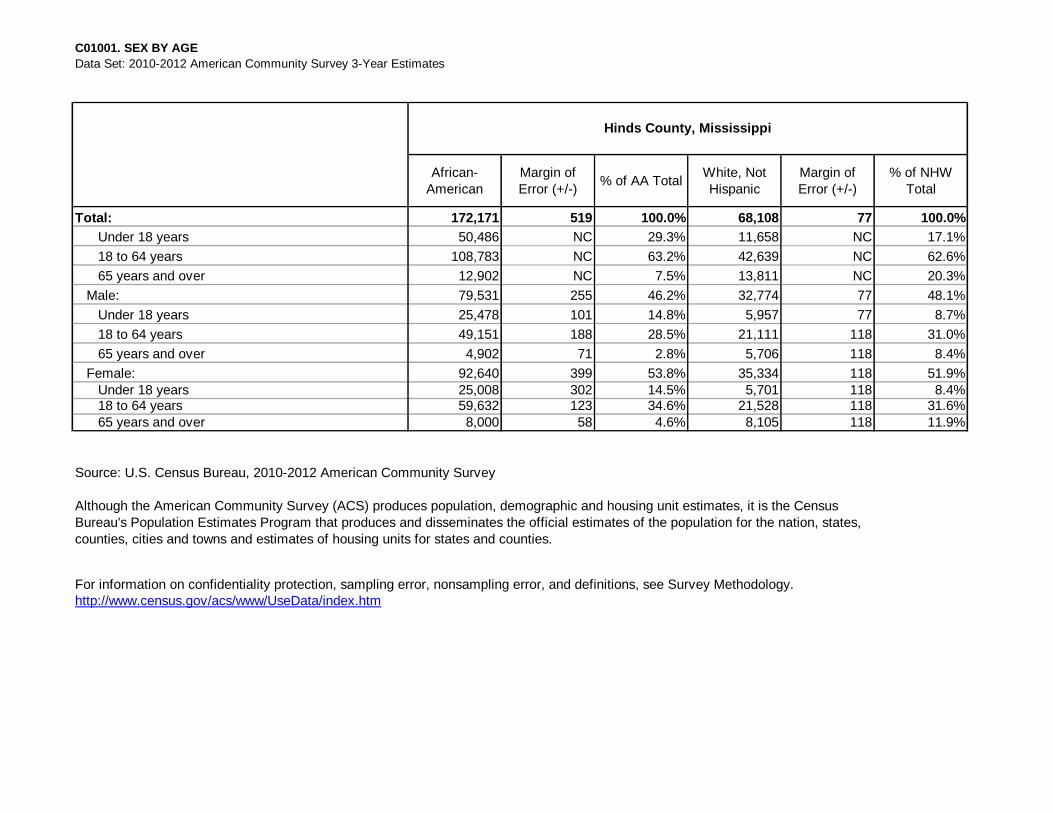
Total: 172,171 519 100.0% 68,108 77 100.0%
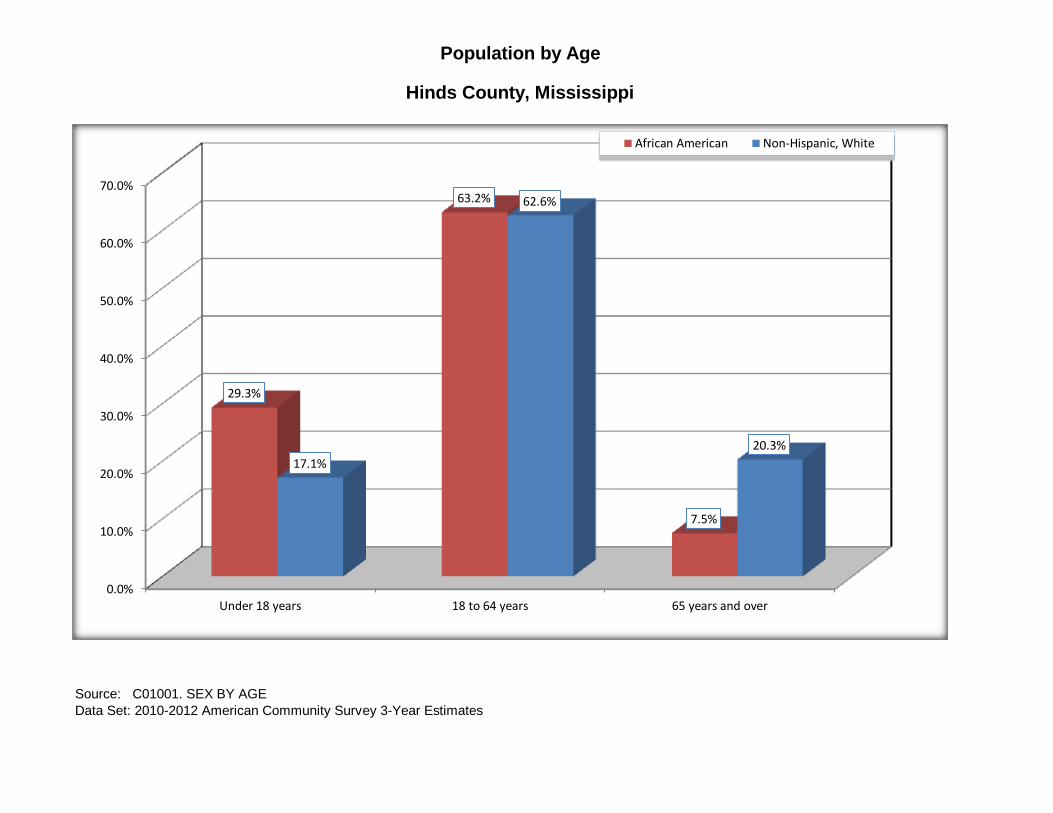
Under 18 years 50,486 NC 29.3% 11,658 NC 17.1%
18 to 64 years 108,783 NC 63.2% 42,639 NC 62.6%
65 years and over 12,902 NC 7.5% 13,811 NC 20.3%
Male: 79,531 255 46.2% 32,774 77 48.1%
Under 18 years 25,478 101 14.8% 5,957 77 8.7%
18 to 64 years 49,151 188 28.5% 21,111 118 31.0%
65 years and over 4,902 71 2.8% 5,706 118 8.4%
Female: 92,640 399 53.8% 35,334 118 51.9%
Under 18 years 25,008 302 14.5% 5,701 118 8.4%18 to 64 years 59,632 123 34.6% 21,528 118 31.6%
65 years and over 8,000 58 4.6% 8,105 118 11.9%
Source: U.S. Census Bureau, 2010-2012 American Community Survey
http://www.census.gov/acs/www/UseData/index.htm
Hinds County, Mississippi
C01001. SEX BY AGE
For information on confidentiality protection, sampling error, nonsampling error, and definitions, see Survey Methodology.
Although the American Community Survey (ACS) produces population, demographic and housing unit estimates, it is the Census
Bureau's Population Estimates Program that produces and disseminates the official estimates of the population for the nation, states,
counties, cities and towns and estimates of housing units for states and counties.
Source: C01001. SEX BY AGE
Data Set: 2010-2012 American Community Survey 3-Year Estimates
Population by Age
Hinds County, Mississippi
0.0%
10.0%
20.0%
30.0%
40.0%
50.0%
60.0%
70.0%
Under 18 years 18 to 64 years 65 years and over
29.3%
63.2%
7.5%
17.1%
62.6%
20.3%
African American Non-Hispanic, White
African-
American
Margin of
Error (+/-)
% of AA Total
by Age
White, Not
Hispanic
Margin of
Error (+/-)
% of NHW
Total by Age
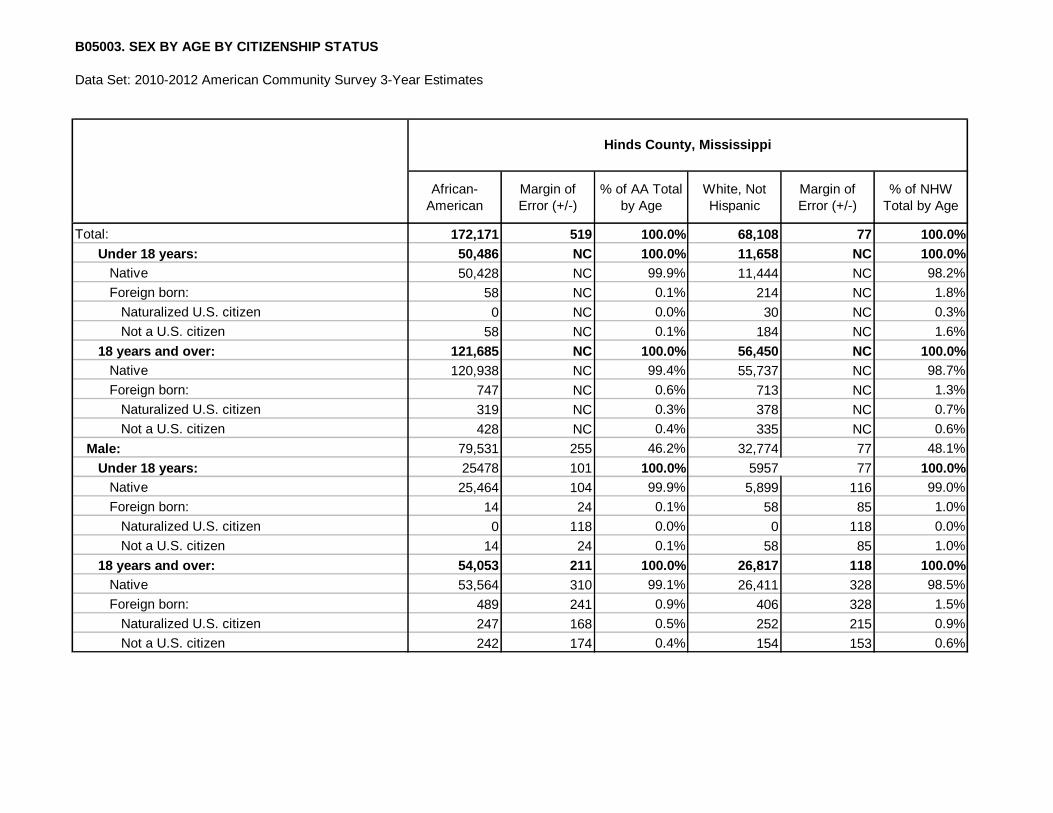
Total: 172,171 519 100.0% 68,108 77 100.0%
Under 18 years: 50,486 NC 100.0% 11,658 NC 100.0%
Native 50,428 NC 99.9% 11,444 NC 98.2%
Foreign born: 58 NC 0.1% 214 NC 1.8%
Naturalized U.S. citizen 0 NC 0.0% 30 NC 0.3%
Not a U.S. citizen 58 NC 0.1% 184 NC 1.6%
18 years and over: 121,685 NC 100.0% 56,450 NC 100.0%
Native 120,938 NC 99.4% 55,737 NC 98.7%
Foreign born: 747 NC 0.6% 713 NC 1.3%
Naturalized U.S. citizen 319 NC 0.3% 378 NC 0.7%
Not a U.S. citizen 428 NC 0.4% 335 NC 0.6%
Male: 79,531 255 46.2% 32,774 77 48.1%
Under 18 years: 25478 101 100.0% 5957 77 100.0%
Native 25,464 104 99.9% 5,899 116 99.0%
Foreign born: 14 24 0.1% 58 85 1.0%
Naturalized U.S. citizen 0 118 0.0% 0 118 0.0%
Not a U.S. citizen 14 24 0.1% 58 85 1.0%
18 years and over: 54,053 211 100.0% 26,817 118 100.0%
Native 53,564 310 99.1% 26,411 328 98.5%
Foreign born: 489 241 0.9% 406 328 1.5%
Naturalized U.S. citizen 247 168 0.5% 252 215 0.9%
Not a U.S. citizen 242 174 0.4% 154 153 0.6%
B05003. SEX BY AGE BY CITIZENSHIP STATUS
Data Set: 2010-2012 American Community Survey 3-Year Estimates
Hinds County, Mississippi
African-
American
Margin of
Error (+/-)
% of AA by
Age
White, Not
Hispanic
Margin of
Error (+/-)
% of NHW by
Age
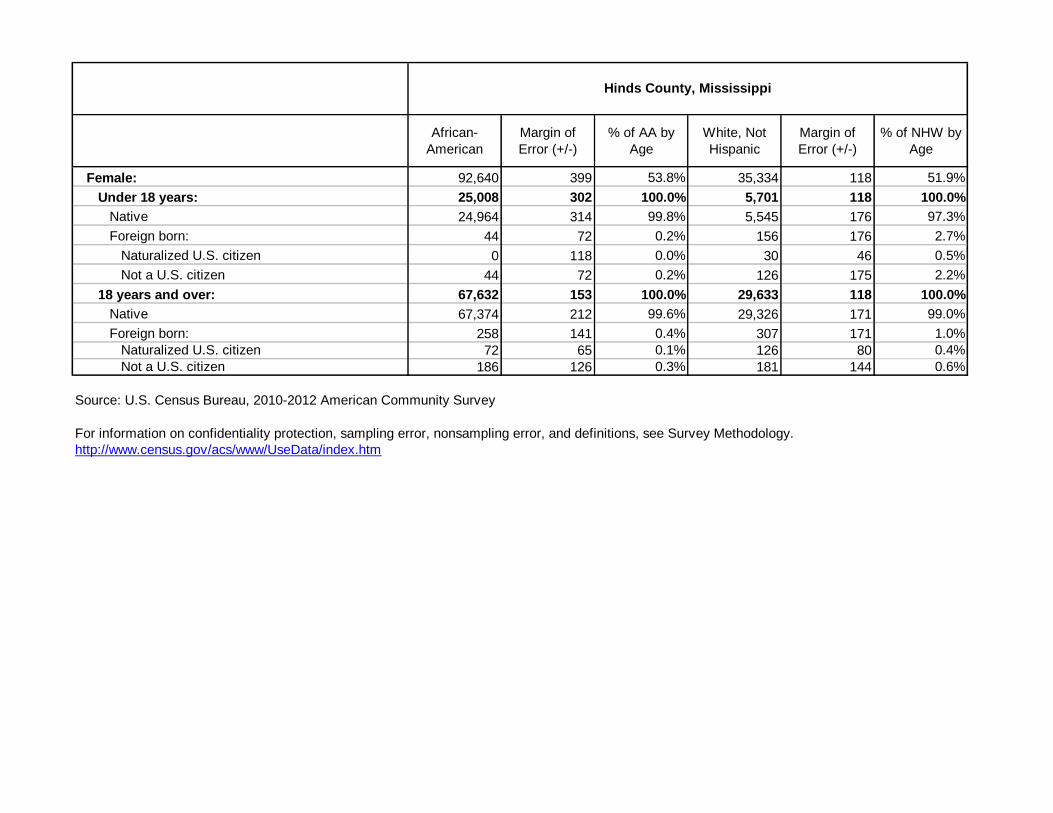
Female: 92,640 399 53.8% 35,334 118 51.9%
Under 18 years: 25,008 302 100.0% 5,701 118 100.0%
Native 24,964 314 99.8% 5,545 176 97.3%
Foreign born: 44 72 0.2% 156 176 2.7%
Naturalized U.S. citizen 0 118 0.0% 30 46 0.5%
Not a U.S. citizen 44 72 0.2% 126 175 2.2%
18 years and over: 67,632 153 100.0% 29,633 118 100.0%
Native 67,374 212 99.6% 29,326 171 99.0%
Foreign born: 258 141 0.4% 307 171 1.0%
Naturalized U.S. citizen 72 65 0.1% 126 80 0.4%
Not a U.S. citizen 186 126 0.3% 181 144 0.6%
Source: U.S. Census Bureau, 2010-2012 American Community Survey
http://www.census.gov/acs/www/UseData/index.htm
Hinds County, Mississippi
For information on confidentiality protection, sampling error, nonsampling error, and definitions, see Survey Methodology.
Source: B05003. SEX BY AGE BY CITIZENSHIP STATUS
Data Set: 2010-2012 American Community Survey 3-Year Estimates
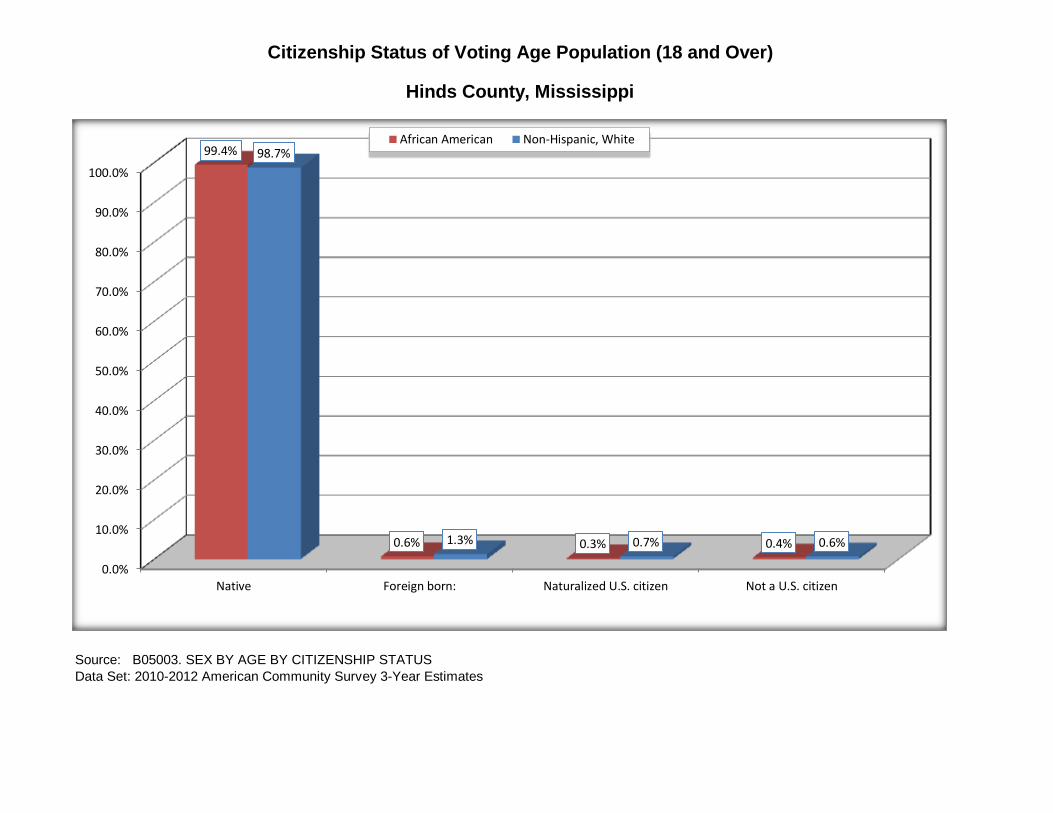
Citizenship Status of Voting Age Population (18 and Over)
Hinds County, Mississippi
0.0%
10.0%
20.0%
30.0%
40.0%
50.0%
60.0%
70.0%
80.0%
90.0%
100.0%
Native Foreign born: Naturalized U.S. citizen Not a U.S. citizen
99.4%
0.6% 0.3% 0.4%
98.7%
1.3% 0.7% 0.6%
African American Non-Hispanic, White
Data Set: 2010-2012 American Community Survey 3-Year Estimates
African-
American
Margin of
Error (+/-)% of AA Total
White, Not
Hispanic
Margin of
Error (+/-)
% of NHW
Total
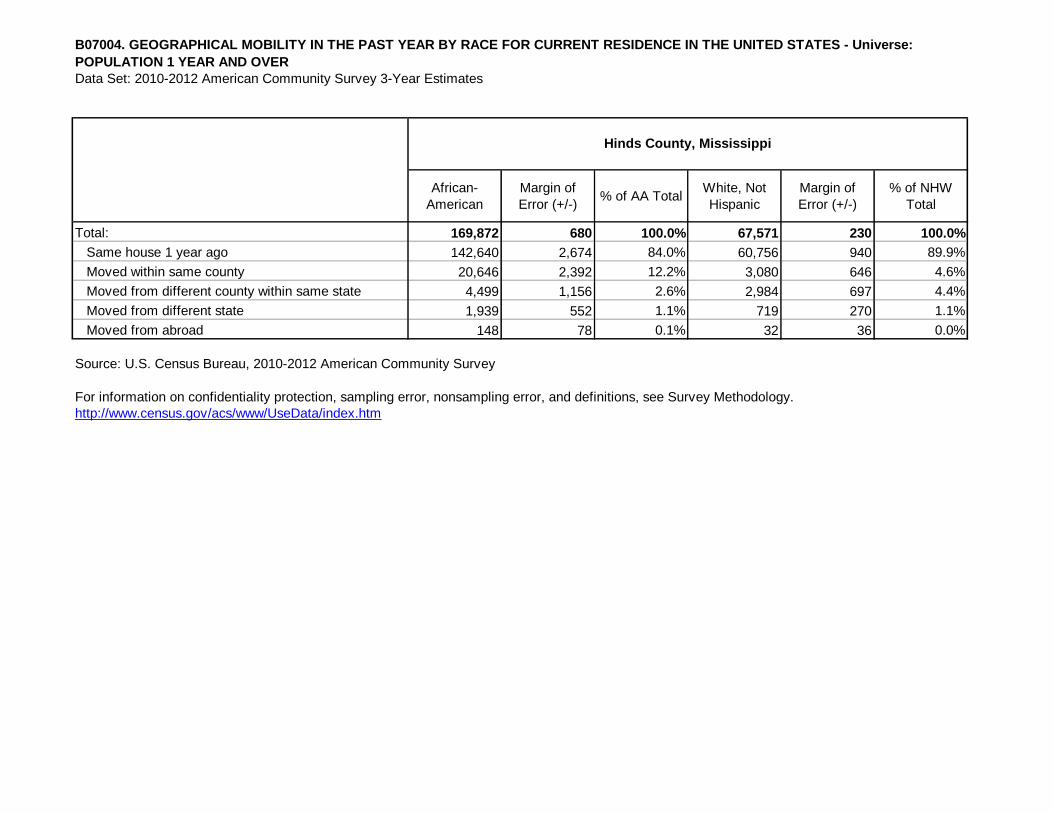
Total: 169,872 680 100.0% 67,571 230 100.0%
Same house 1 year ago 142,640 2,674 84.0% 60,756 940 89.9%
Moved within same county 20,646 2,392 12.2% 3,080 646 4.6%
Moved from different county within same state 4,499 1,156 2.6% 2,984 697 4.4%
Moved from different state 1,939 552 1.1% 719 270 1.1%
Moved from abroad 148 78 0.1% 32 36 0.0%
Source: U.S. Census Bureau, 2010-2012 American Community Survey
http://www.census.gov/acs/www/UseData/index.htm
B07004. GEOGRAPHICAL MOBILITY IN THE PAST YEAR BY RACE FOR CURRENT RESIDENCE IN THE UNITED STATES - Universe:
POPULATION 1 YEAR AND OVER
Hinds County, Mississippi
For information on confidentiality protection, sampling error, nonsampling error, and definitions, see Survey Methodology.
Data Set: 2010-2012 American Community Survey 3-Year Estimates
Source: B07004. GEOGRAPHICAL MOBILITY IN THE PAST YEAR BY RACE FOR CURRENT RESIDENCE IN THE UNITED STATES - Universe:
POPULATION 1 YEAR AND OVER
Hinds County, Mississippi
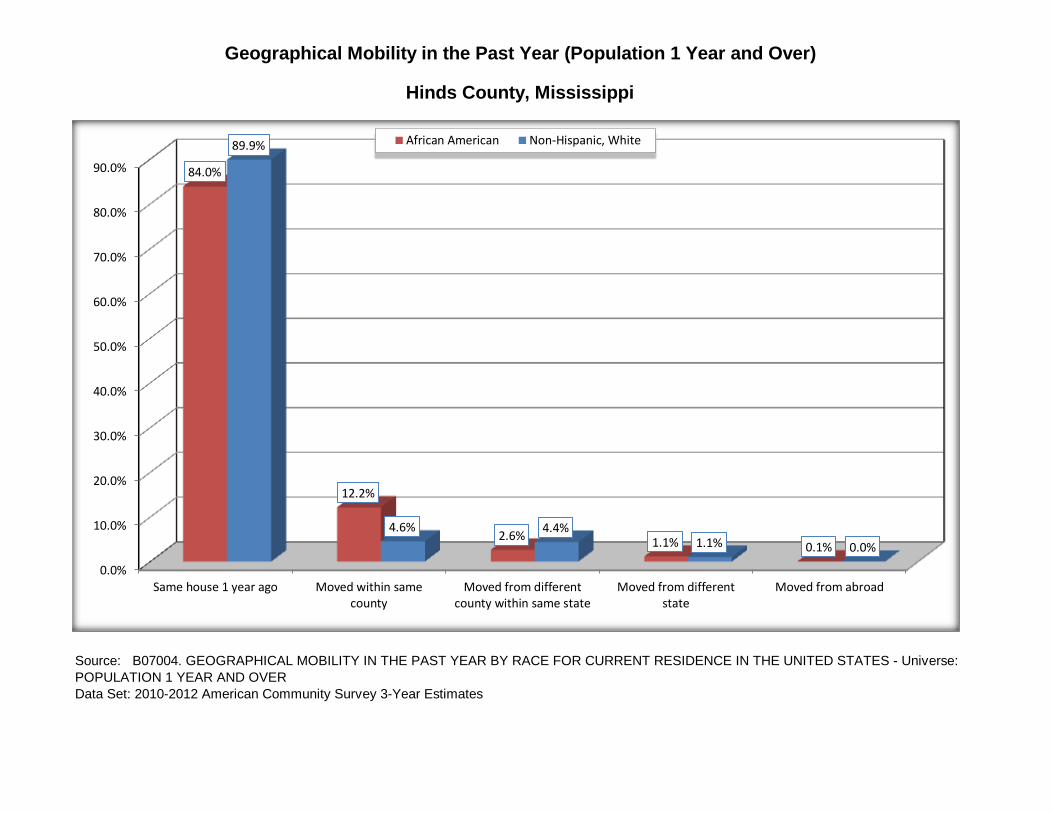
Geographical Mobility in the Past Year (Population 1 Year and Over)
0.0%
10.0%
20.0%
30.0%
40.0%
50.0%
60.0%
70.0%
80.0%
90.0%
Same house 1 year ago Moved within samecounty
Moved from differentcounty within same state
Moved from differentstate
Moved from abroad
84.0%
12.2%
2.6% 1.1% 0.1%
89.9%
4.6% 4.4% 1.1% 0.0%
African American Non-Hispanic, White
African-
American
Margin of
Error (+/-)% of AA Total
White, Not
Hispanic
Margin of
Error (+/-)
% of NHW
Total
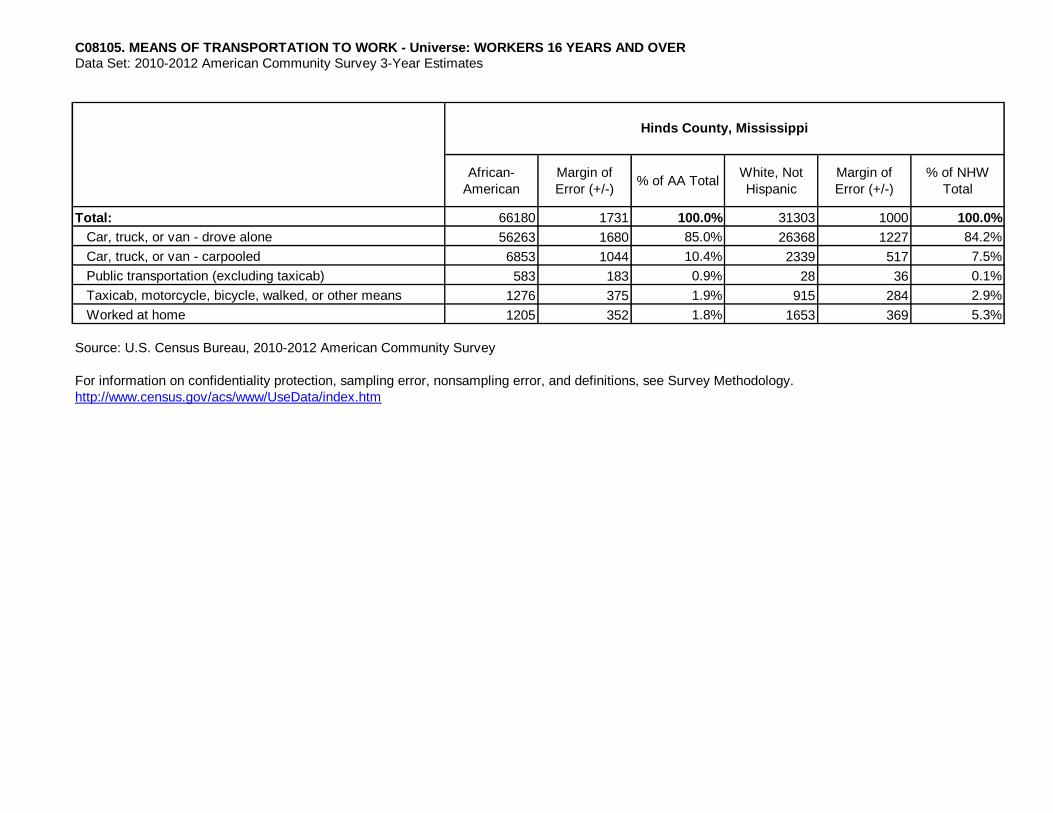
Total: 66180 1731 100.0% 31303 1000 100.0%
Car, truck, or van - drove alone 56263 1680 85.0% 26368 1227 84.2%
Car, truck, or van - carpooled 6853 1044 10.4% 2339 517 7.5%
Public transportation (excluding taxicab) 583 183 0.9% 28 36 0.1%
Taxicab, motorcycle, bicycle, walked, or other means 1276 375 1.9% 915 284 2.9%
Worked at home 1205 352 1.8% 1653 369 5.3%
http://www.census.gov/acs/www/UseData/index.htm
Hinds County, Mississippi
Source: U.S. Census Bureau, 2010-2012 American Community Survey
C08105. MEANS OF TRANSPORTATION TO WORK - Universe: WORKERS 16 YEARS AND OVERData Set: 2010-2012 American Community Survey 3-Year Estimates
For information on confidentiality protection, sampling error, nonsampling error, and definitions, see Survey Methodology.
Source: C08105. MEANS OF TRANSPORTATION TO WORK - Universe: WORKERS 16 YEARS AND OVER
Data Set: 2010-2012 American Community Survey 3-Year Estimates
Hinds County, Mississippi
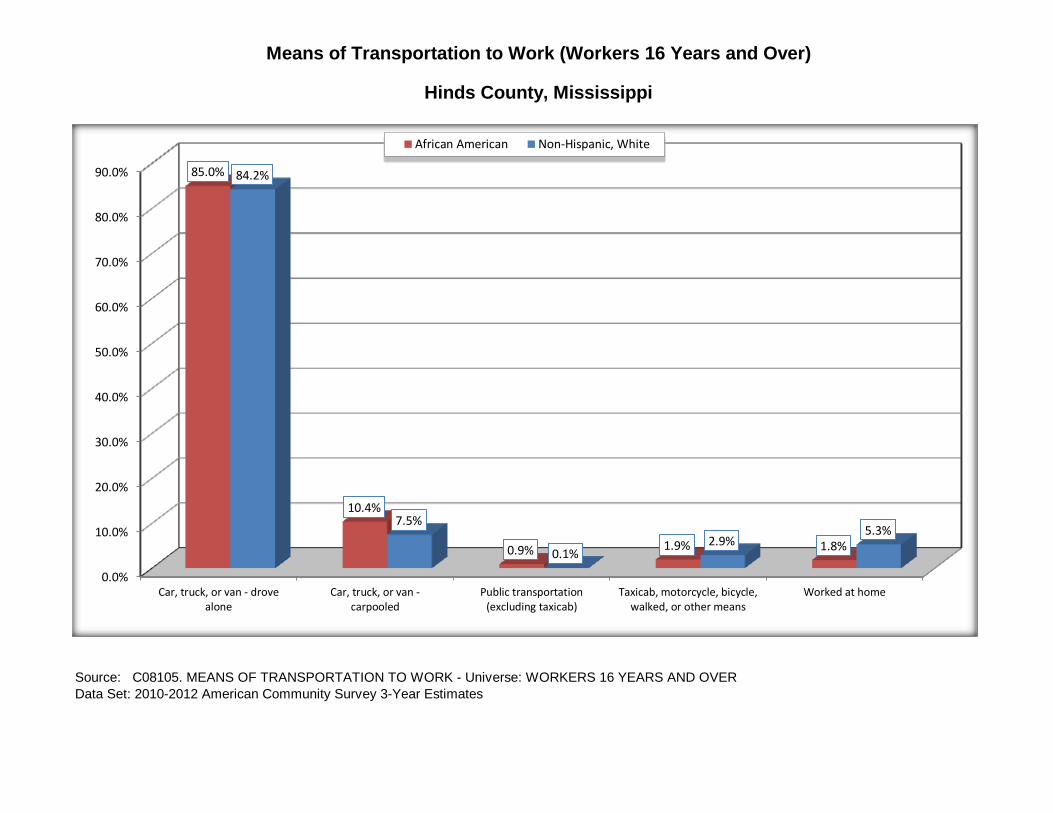
Means of Transportation to Work (Workers 16 Years and Over)
0.0%
10.0%
20.0%
30.0%
40.0%
50.0%
60.0%
70.0%
80.0%
90.0%
Car, truck, or van - drovealone
Car, truck, or van -carpooled
Public transportation(excluding taxicab)
Taxicab, motorcycle, bicycle,walked, or other means
Worked at home
85.0%
10.4%
0.9% 1.9% 1.8%
84.2%
7.5%
0.1% 2.9%
5.3%
African American Non-Hispanic, White
African-
American
Margin of
Error (+/-)% of AA Total
White, Not
Hispanic
Margin of
Error (+/-)
% of NHW
Total
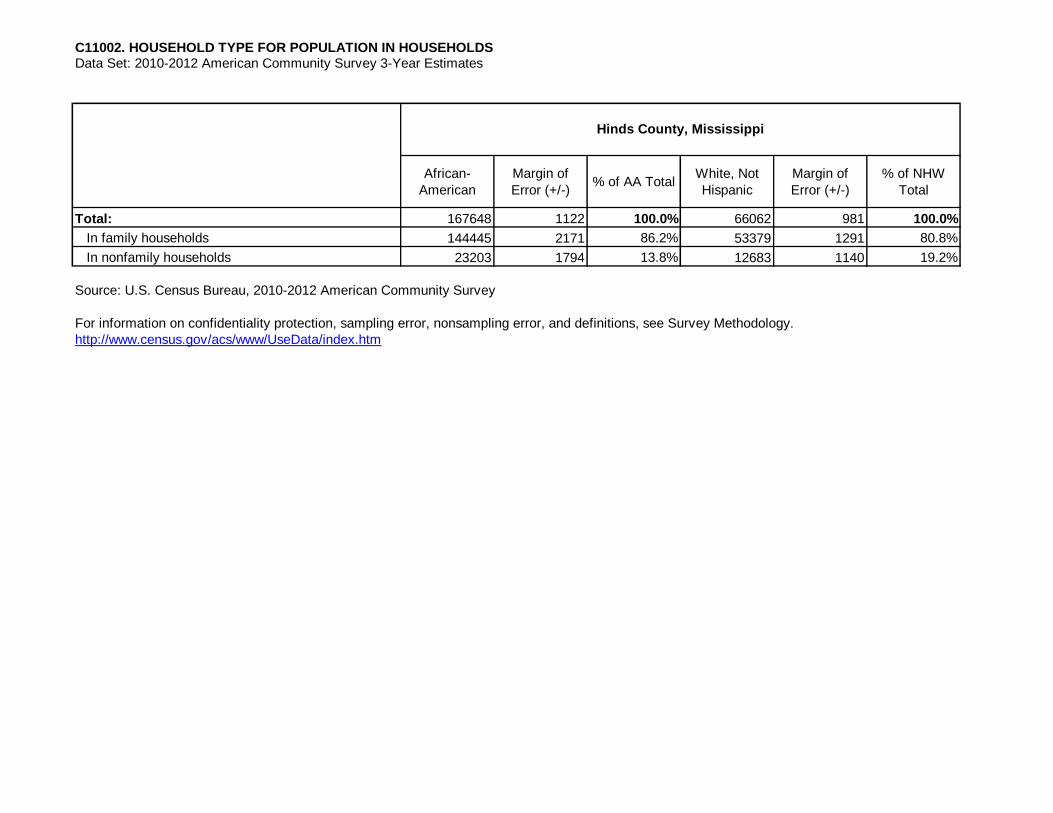
Total: 167648 1122 100.0% 66062 981 100.0%
In family households 144445 2171 86.2% 53379 1291 80.8%
In nonfamily households 23203 1794 13.8% 12683 1140 19.2%
http://www.census.gov/acs/www/UseData/index.htm
Hinds County, Mississippi
Source: U.S. Census Bureau, 2010-2012 American Community Survey
C11002. HOUSEHOLD TYPE FOR POPULATION IN HOUSEHOLDS Data Set: 2010-2012 American Community Survey 3-Year Estimates
For information on confidentiality protection, sampling error, nonsampling error, and definitions, see Survey Methodology.
Source: C11002. HOUSEHOLD TYPE FOR POPULATION IN HOUSEHOLDS
Data Set: 2010-2012 American Community Survey 3-Year Estimates
Hinds County, Mississippi
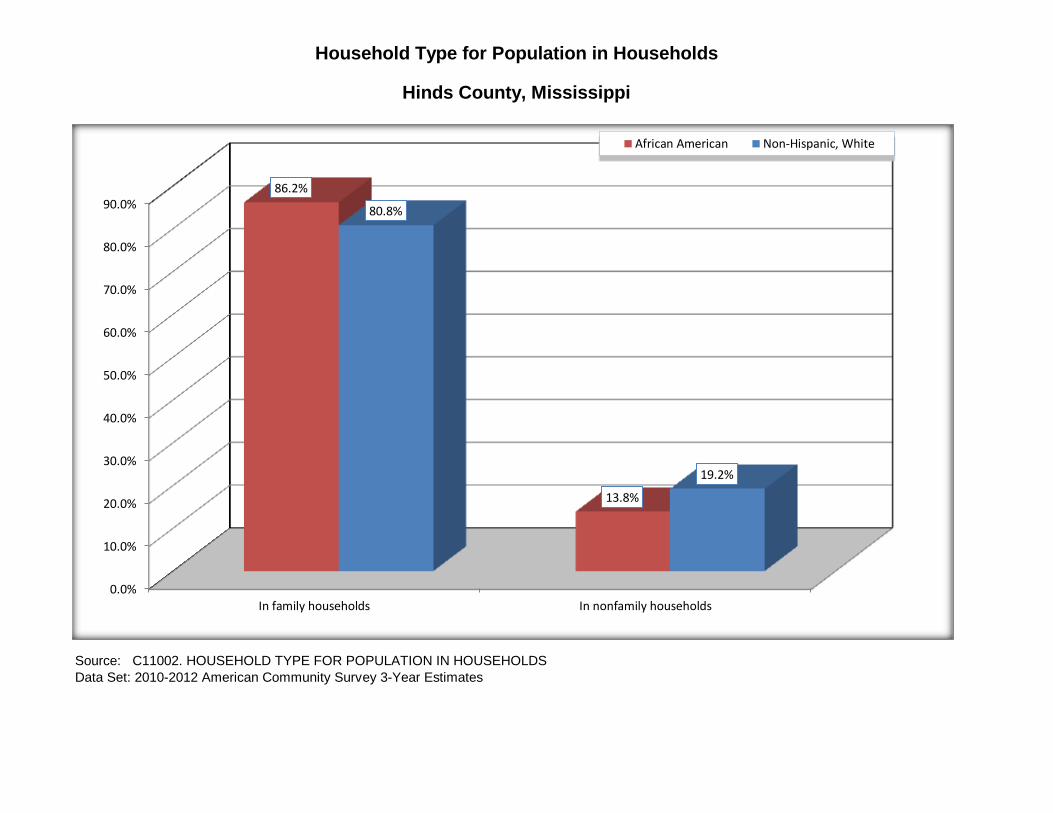
Household Type for Population in Households
0.0%
10.0%
20.0%
30.0%
40.0%
50.0%
60.0%
70.0%
80.0%
90.0%
In family households In nonfamily households
86.2%
13.8%
80.8%
19.2%
African American Non-Hispanic, White
African-
American
Margin of
Error (+/-)% of AA Total
White, Not
Hispanic
Margin of
Error (+/-)
% of NHW
Total
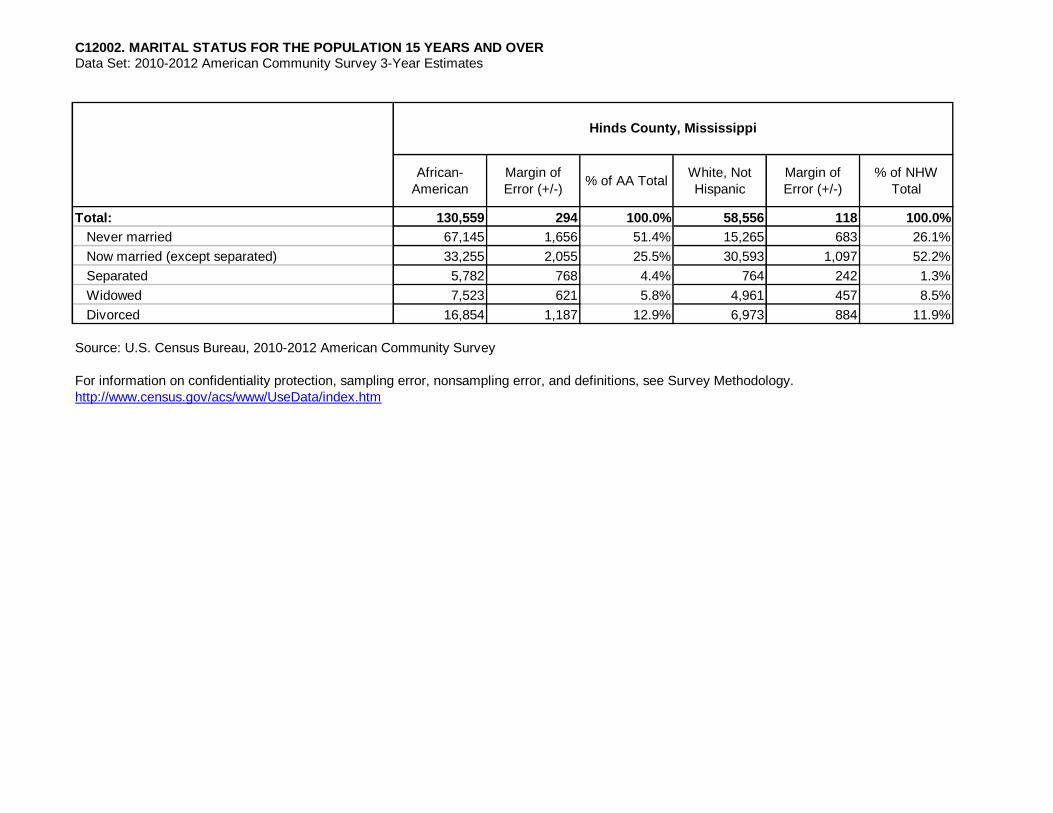
Total: 130,559 294 100.0% 58,556 118 100.0%
Never married 67,145 1,656 51.4% 15,265 683 26.1%
Now married (except separated) 33,255 2,055 25.5% 30,593 1,097 52.2%
Separated 5,782 768 4.4% 764 242 1.3%
Widowed 7,523 621 5.8% 4,961 457 8.5%
Divorced 16,854 1,187 12.9% 6,973 884 11.9%
http://www.census.gov/acs/www/UseData/index.htm
C12002. MARITAL STATUS FOR THE POPULATION 15 YEARS AND OVER
Source: U.S. Census Bureau, 2010-2012 American Community Survey
Hinds County, Mississippi
Data Set: 2010-2012 American Community Survey 3-Year Estimates
For information on confidentiality protection, sampling error, nonsampling error, and definitions, see Survey Methodology.
Source: C12002. MARITAL STATUS FOR THE POPULATION 15 YEARS AND OVER
Data Set: 2010-2012 American Community Survey 3-Year Estimates
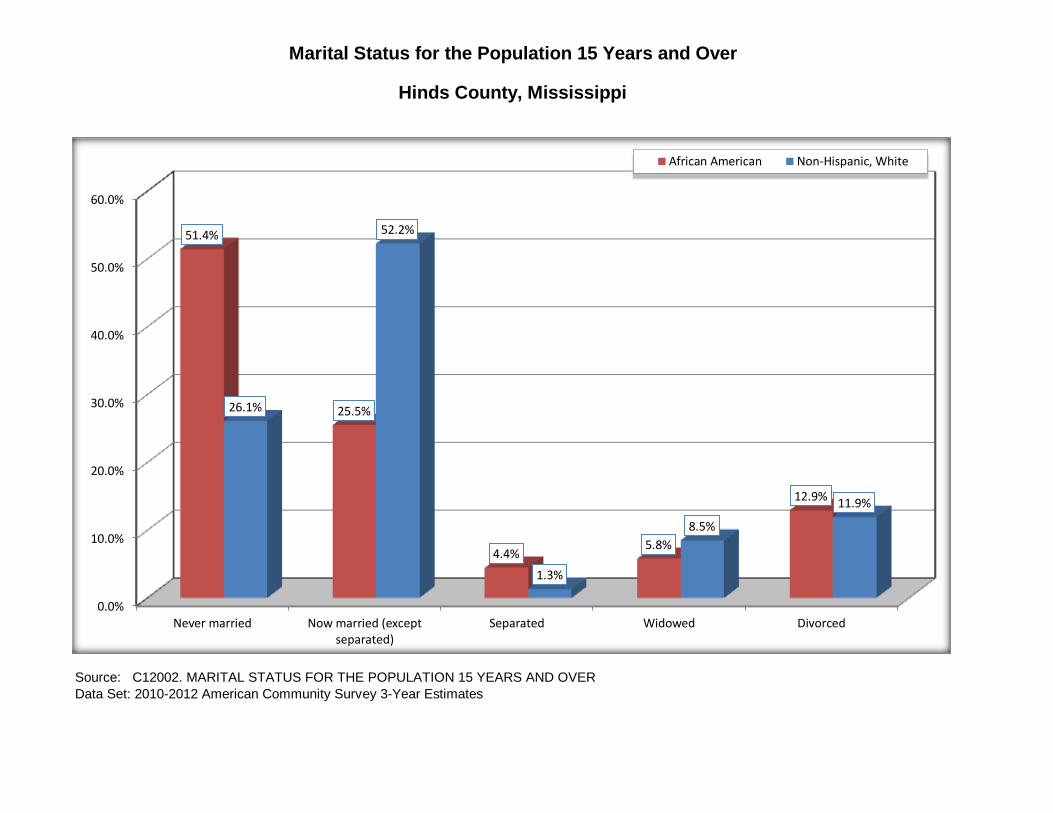
Marital Status for the Population 15 Years and Over
Hinds County, Mississippi
0.0%
10.0%
20.0%
30.0%
40.0%
50.0%
60.0%
Never married Now married (exceptseparated)
Separated Widowed Divorced
51.4%
25.5%
4.4% 5.8%
12.9%
26.1%
52.2%
1.3%
8.5%
11.9%
African American Non-Hispanic, White
African-
American
Margin of
Error (+/-)% of AA Total
White, Not
Hispanic
Margin of
Error (+/-)
% of NHW
Total
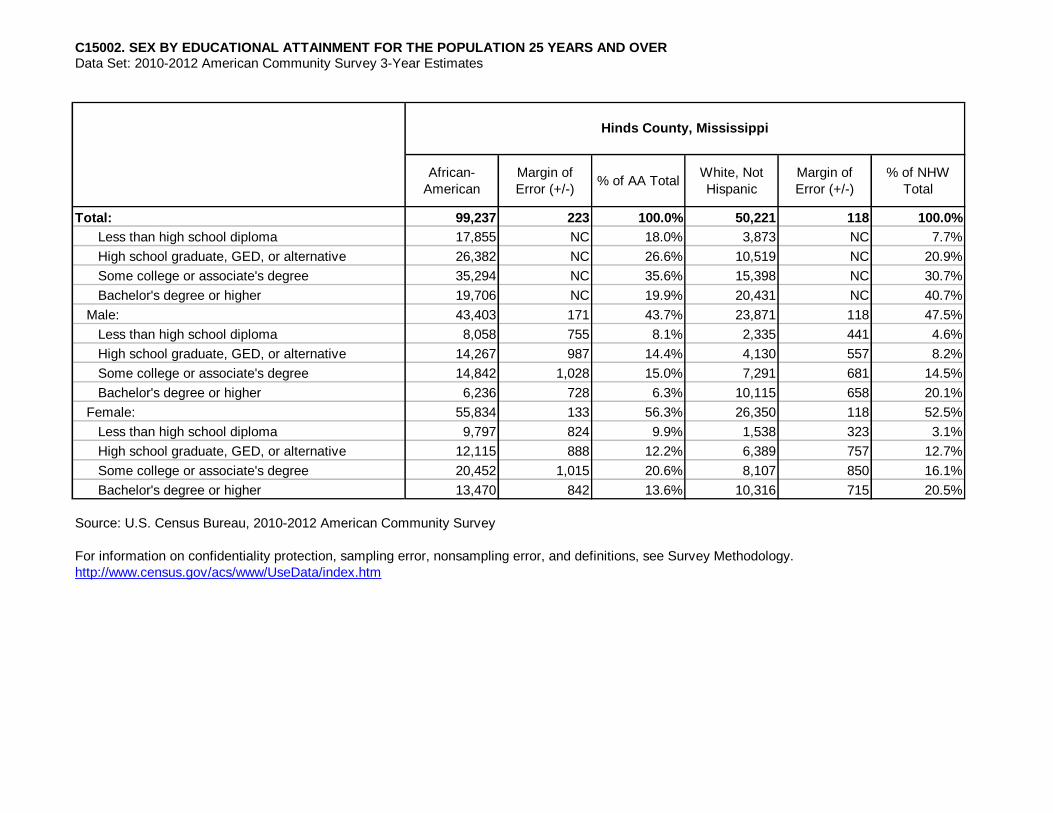
Total: 99,237 223 100.0% 50,221 118 100.0%
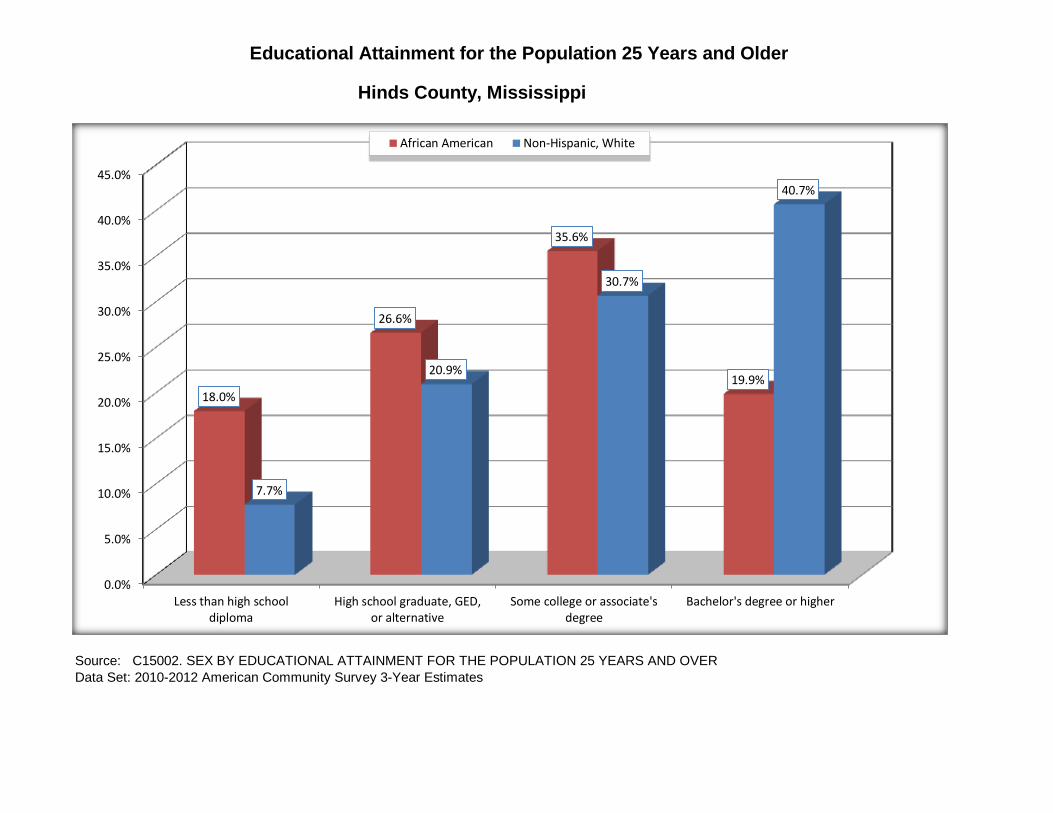
Less than high school diploma 17,855 NC 18.0% 3,873 NC 7.7%
High school graduate, GED, or alternative 26,382 NC 26.6% 10,519 NC 20.9%
Some college or associate's degree 35,294 NC 35.6% 15,398 NC 30.7%
Bachelor's degree or higher 19,706 NC 19.9% 20,431 NC 40.7%
Male: 43,403 171 43.7% 23,871 118 47.5%
Less than high school diploma 8,058 755 8.1% 2,335 441 4.6%
High school graduate, GED, or alternative 14,267 987 14.4% 4,130 557 8.2%
Some college or associate's degree 14,842 1,028 15.0% 7,291 681 14.5%
Bachelor's degree or higher 6,236 728 6.3% 10,115 658 20.1%
Female: 55,834 133 56.3% 26,350 118 52.5%
Less than high school diploma 9,797 824 9.9% 1,538 323 3.1%
High school graduate, GED, or alternative 12,115 888 12.2% 6,389 757 12.7%
Some college or associate's degree 20,452 1,015 20.6% 8,107 850 16.1%
Bachelor's degree or higher 13,470 842 13.6% 10,316 715 20.5%
http://www.census.gov/acs/www/UseData/index.htm
Source: U.S. Census Bureau, 2010-2012 American Community Survey
C15002. SEX BY EDUCATIONAL ATTAINMENT FOR THE POPULATION 25 YEARS AND OVERData Set: 2010-2012 American Community Survey 3-Year Estimates
Hinds County, Mississippi
For information on confidentiality protection, sampling error, nonsampling error, and definitions, see Survey Methodology.
Source: C15002. SEX BY EDUCATIONAL ATTAINMENT FOR THE POPULATION 25 YEARS AND OVER
Data Set: 2010-2012 American Community Survey 3-Year Estimates
Educational Attainment for the Population 25 Years and Older
Hinds County, Mississippi
0.0%
5.0%
10.0%
15.0%
20.0%
25.0%
30.0%
35.0%
40.0%
45.0%
Less than high schooldiploma
High school graduate, GED,or alternative
Some college or associate'sdegree
Bachelor's degree or higher
18.0%
26.6%
35.6%
19.9%
7.7%
20.9%
30.7%
40.7%
African American Non-Hispanic, White
African-
American
Margin of
Error (+/-)% of AA Total
White, Not
Hispanic
Margin of
Error (+/-)
% of NHW
Total
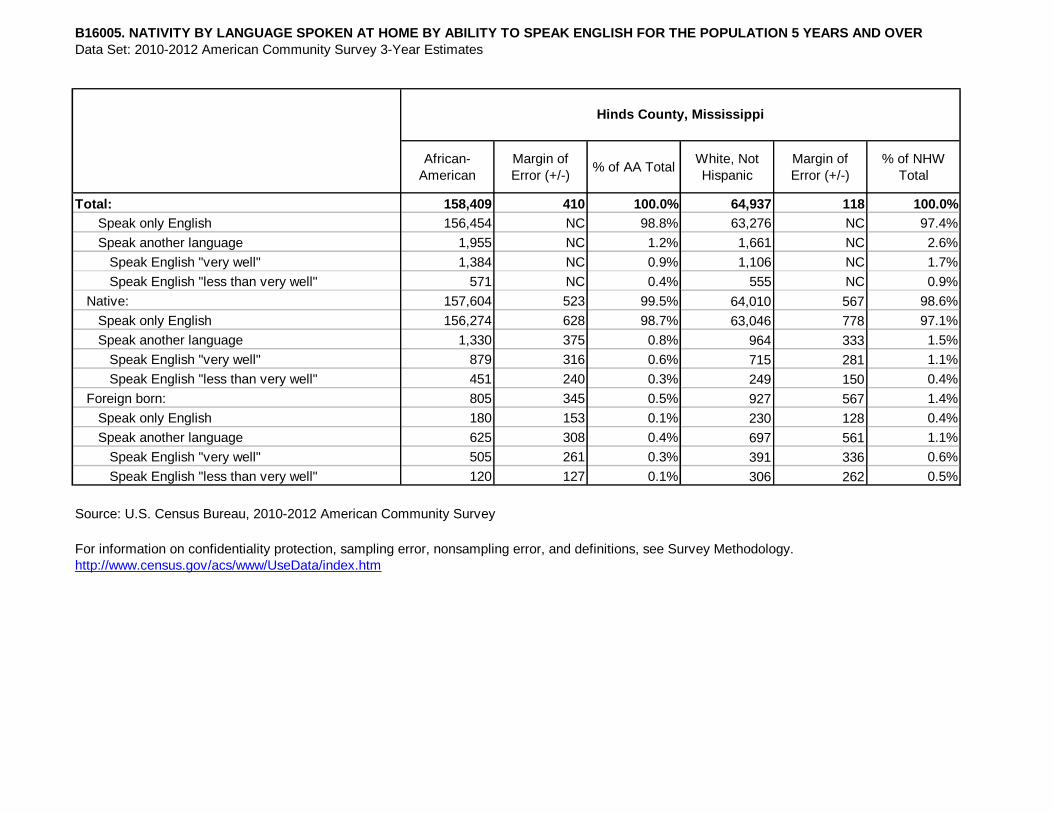
Total: 158,409 410 100.0% 64,937 118 100.0%
Speak only English 156,454 NC 98.8% 63,276 NC 97.4%
Speak another language 1,955 NC 1.2% 1,661 NC 2.6%
Speak English "very well" 1,384 NC 0.9% 1,106 NC 1.7%
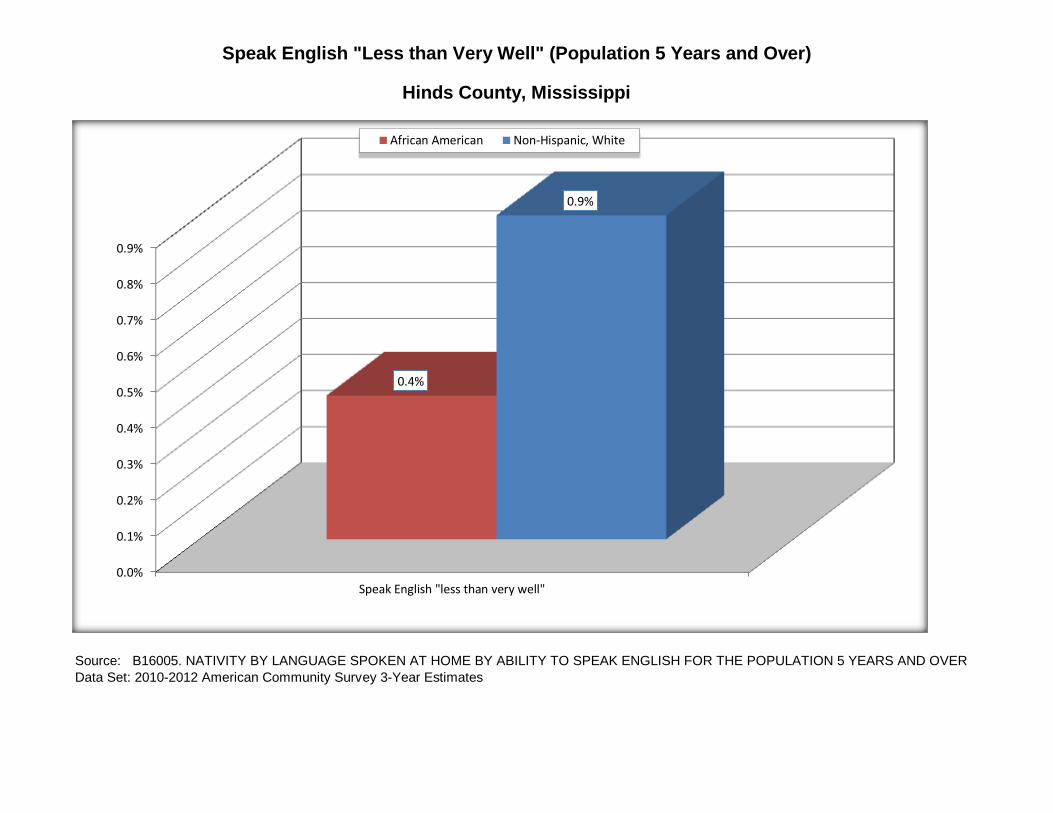
Speak English "less than very well" 571 NC 0.4% 555 NC 0.9%
Native: 157,604 523 99.5% 64,010 567 98.6%
Speak only English 156,274 628 98.7% 63,046 778 97.1%
Speak another language 1,330 375 0.8% 964 333 1.5%
Speak English "very well" 879 316 0.6% 715 281 1.1%
Speak English "less than very well" 451 240 0.3% 249 150 0.4%
Foreign born: 805 345 0.5% 927 567 1.4%
Speak only English 180 153 0.1% 230 128 0.4%
Speak another language 625 308 0.4% 697 561 1.1%
Speak English "very well" 505 261 0.3% 391 336 0.6%
Speak English "less than very well" 120 127 0.1% 306 262 0.5%
http://www.census.gov/acs/www/UseData/index.htm
B16005. NATIVITY BY LANGUAGE SPOKEN AT HOME BY ABILITY TO SPEAK ENGLISH FOR THE POPULATION 5 YEARS AND OVER
Hinds County, Mississippi
Source: U.S. Census Bureau, 2010-2012 American Community Survey
Data Set: 2010-2012 American Community Survey 3-Year Estimates
For information on confidentiality protection, sampling error, nonsampling error, and definitions, see Survey Methodology.
Source: B16005. NATIVITY BY LANGUAGE SPOKEN AT HOME BY ABILITY TO SPEAK ENGLISH FOR THE POPULATION 5 YEARS AND OVER
Data Set: 2010-2012 American Community Survey 3-Year Estimates
Speak English "Less than Very Well" (Population 5 Years and Over)
Hinds County, Mississippi
0.0%
0.1%
0.2%
0.3%
0.4%
0.5%
0.6%
0.7%
0.8%
0.9%
Speak English "less than very well"
0.4%
0.9%
African American Non-Hispanic, White
African-
American
Margin of
Error (+/-)% of AA Total
White, Not
Hispanic
Margin of
Error (+/-)
% of NHW
Total
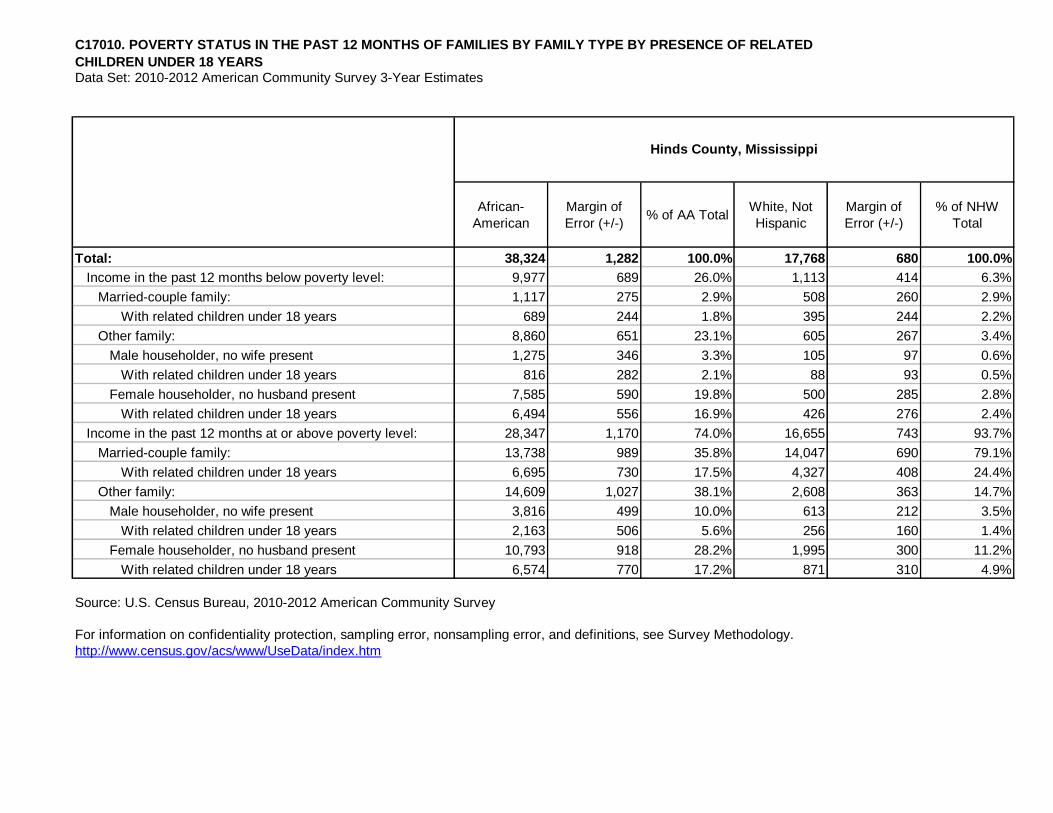
Total: 38,324 1,282 100.0% 17,768 680 100.0%
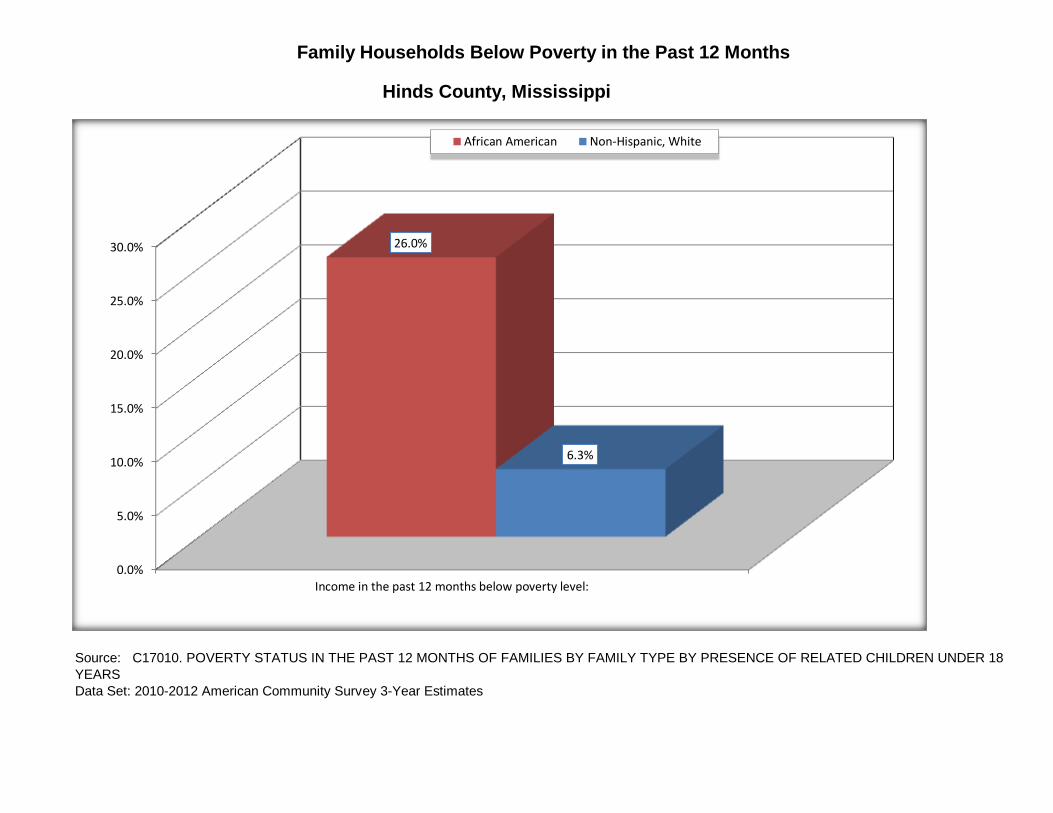
Income in the past 12 months below poverty level: 9,977 689 26.0% 1,113 414 6.3%
Married-couple family: 1,117 275 2.9% 508 260 2.9%
With related children under 18 years 689 244 1.8% 395 244 2.2%
Other family: 8,860 651 23.1% 605 267 3.4%
Male householder, no wife present 1,275 346 3.3% 105 97 0.6%
With related children under 18 years 816 282 2.1% 88 93 0.5%
Female householder, no husband present 7,585 590 19.8% 500 285 2.8%
With related children under 18 years 6,494 556 16.9% 426 276 2.4%
Income in the past 12 months at or above poverty level: 28,347 1,170 74.0% 16,655 743 93.7%
Married-couple family: 13,738 989 35.8% 14,047 690 79.1%
With related children under 18 years 6,695 730 17.5% 4,327 408 24.4%
Other family: 14,609 1,027 38.1% 2,608 363 14.7%
Male householder, no wife present 3,816 499 10.0% 613 212 3.5%
With related children under 18 years 2,163 506 5.6% 256 160 1.4%
Female householder, no husband present 10,793 918 28.2% 1,995 300 11.2%
With related children under 18 years 6,574 770 17.2% 871 310 4.9%
http://www.census.gov/acs/www/UseData/index.htm
For information on confidentiality protection, sampling error, nonsampling error, and definitions, see Survey Methodology.
Source: U.S. Census Bureau, 2010-2012 American Community Survey
Hinds County, Mississippi
C17010. POVERTY STATUS IN THE PAST 12 MONTHS OF FAMILIES BY FAMILY TYPE BY PRESENCE OF RELATED
CHILDREN UNDER 18 YEARS Data Set: 2010-2012 American Community Survey 3-Year Estimates
Data Set: 2010-2012 American Community Survey 3-Year Estimates
Source: C17010. POVERTY STATUS IN THE PAST 12 MONTHS OF FAMILIES BY FAMILY TYPE BY PRESENCE OF RELATED CHILDREN UNDER 18
YEARS
Family Households Below Poverty in the Past 12 Months
Hinds County, Mississippi
0.0%
5.0%
10.0%
15.0%
20.0%
25.0%
30.0%
Income in the past 12 months below poverty level:
26.0%
6.3%
African American Non-Hispanic, White
Data Set: 2010-2012 American Community Survey 3-Year Estimates
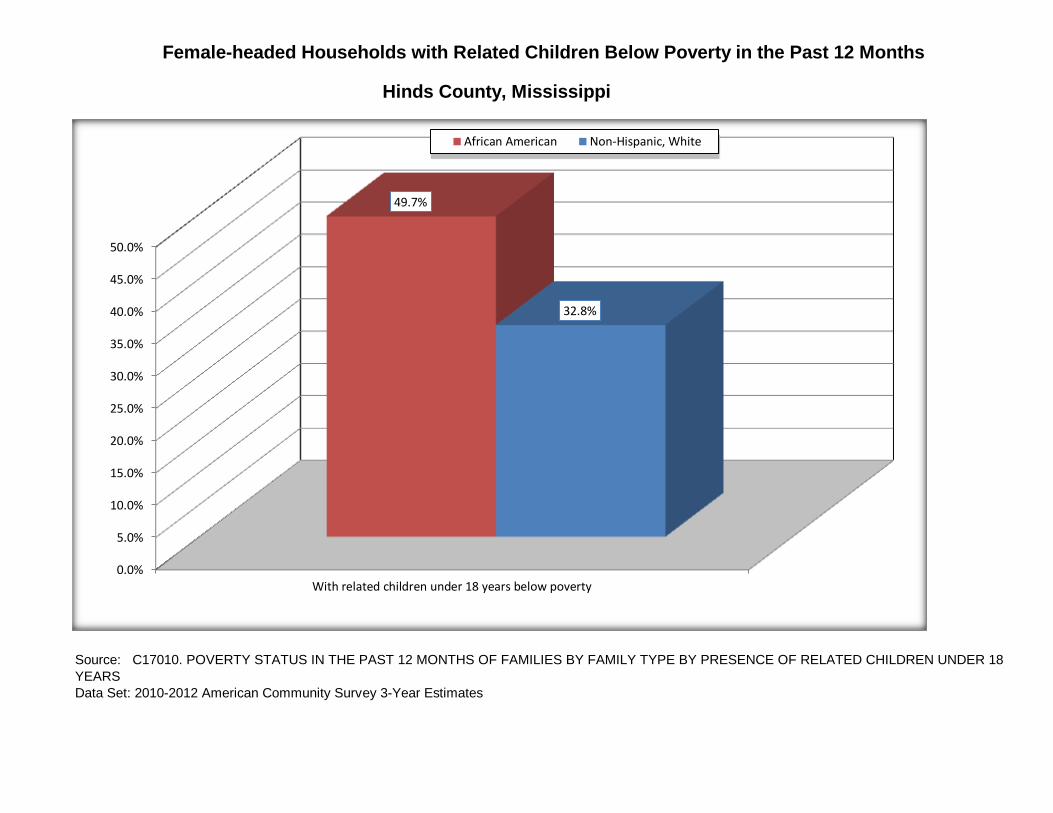
Source: C17010. POVERTY STATUS IN THE PAST 12 MONTHS OF FAMILIES BY FAMILY TYPE BY PRESENCE OF RELATED CHILDREN UNDER 18
YEARS
Female-headed Households with Related Children Below Poverty in the Past 12 Months
Hinds County, Mississippi
0.0%
5.0%
10.0%
15.0%
20.0%
25.0%
30.0%
35.0%
40.0%
45.0%
50.0%
With related children under 18 years below poverty
49.7%
32.8%
African American Non-Hispanic, White
African-
American
Margin of
Error (+/-)
% of AA By
Age
White, Not
Hispanic
Margin of
Error (+/-)
% of NHW By
Age
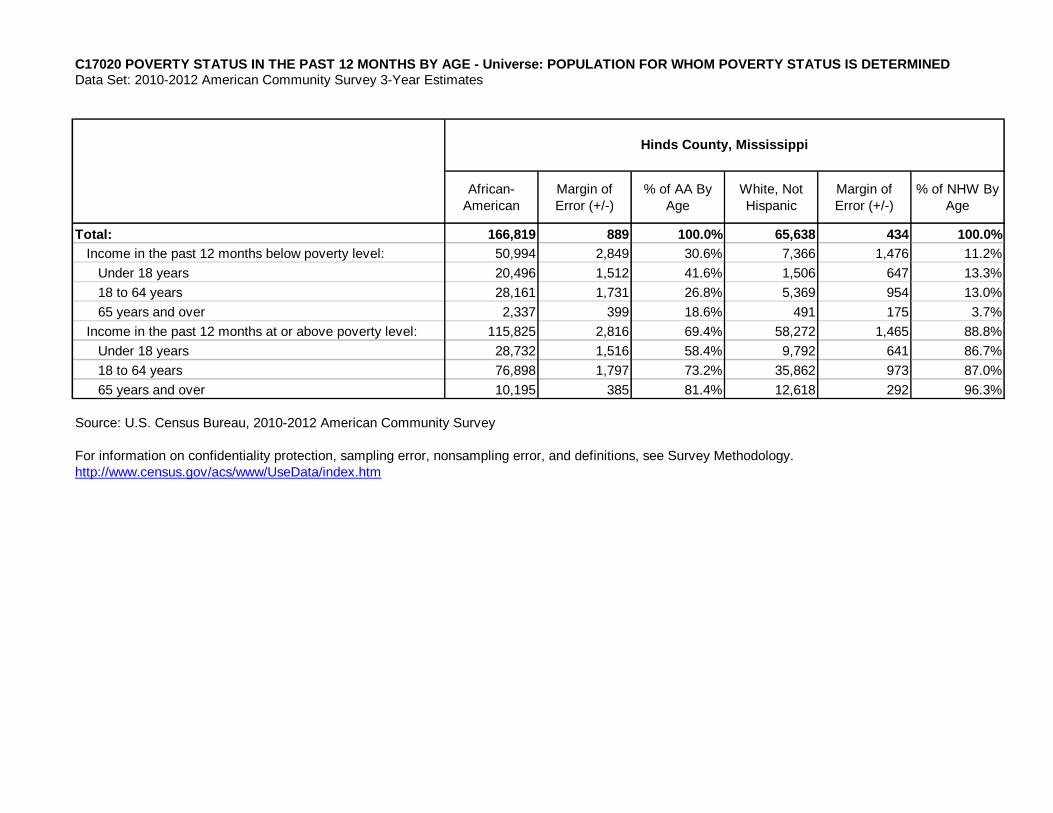
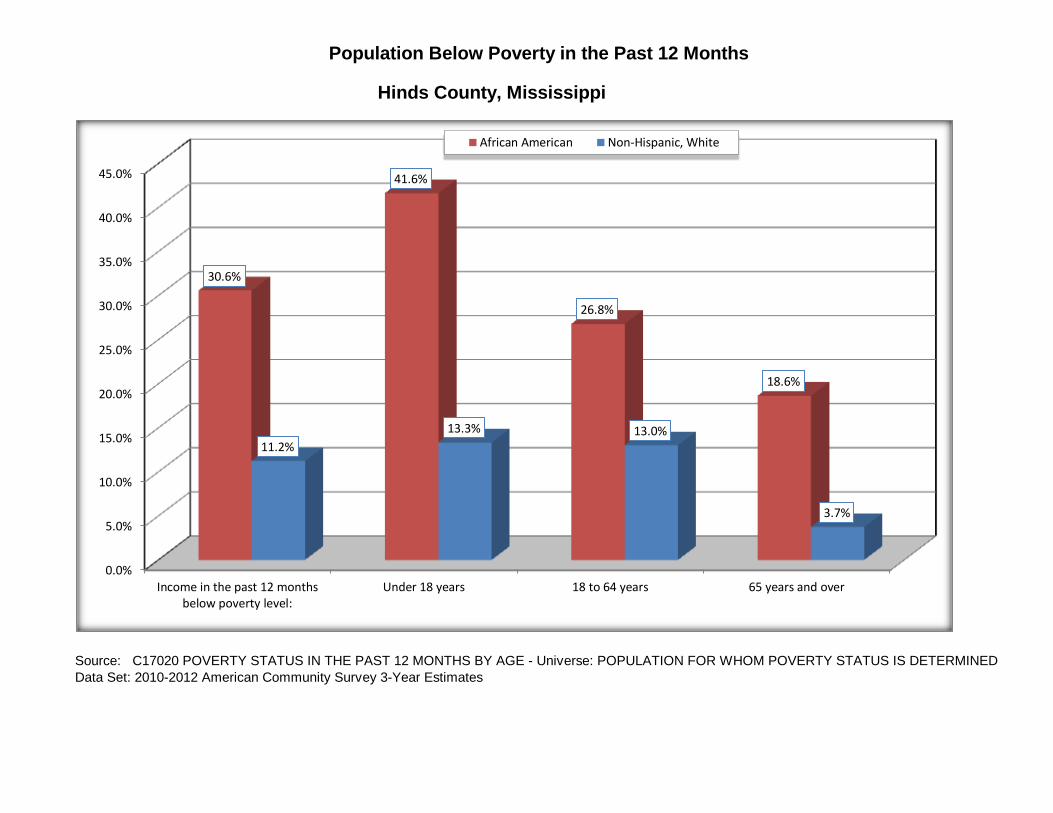
Total: 166,819 889 100.0% 65,638 434 100.0%
Income in the past 12 months below poverty level: 50,994 2,849 30.6% 7,366 1,476 11.2%
Under 18 years 20,496 1,512 41.6% 1,506 647 13.3%
18 to 64 years 28,161 1,731 26.8% 5,369 954 13.0%
65 years and over 2,337 399 18.6% 491 175 3.7%
Income in the past 12 months at or above poverty level: 115,825 2,816 69.4% 58,272 1,465 88.8%
Under 18 years 28,732 1,516 58.4% 9,792 641 86.7%
18 to 64 years 76,898 1,797 73.2% 35,862 973 87.0%
65 years and over 10,195 385 81.4% 12,618 292 96.3%
http://www.census.gov/acs/www/UseData/index.htm
Hinds County, Mississippi
C17020 POVERTY STATUS IN THE PAST 12 MONTHS BY AGE - Universe: POPULATION FOR WHOM POVERTY STATUS IS DETERMINED
Source: U.S. Census Bureau, 2010-2012 American Community Survey
Data Set: 2010-2012 American Community Survey 3-Year Estimates
For information on confidentiality protection, sampling error, nonsampling error, and definitions, see Survey Methodology.
Source: C17020 POVERTY STATUS IN THE PAST 12 MONTHS BY AGE - Universe: POPULATION FOR WHOM POVERTY STATUS IS DETERMINED
Data Set: 2010-2012 American Community Survey 3-Year Estimates
Population Below Poverty in the Past 12 Months
Hinds County, Mississippi
0.0%
5.0%
10.0%
15.0%
20.0%
25.0%
30.0%
35.0%
40.0%
45.0%
Income in the past 12 monthsbelow poverty level:
Under 18 years 18 to 64 years 65 years and over
30.6%
41.6%
26.8%
18.6%
11.2%
13.3% 13.0%
3.7%
African American Non-Hispanic, White
African-
American
Margin of
Error (+/-)% of AA Total
White, Not
Hispanic
Margin of
Error (+/-)
% of NHW
Total
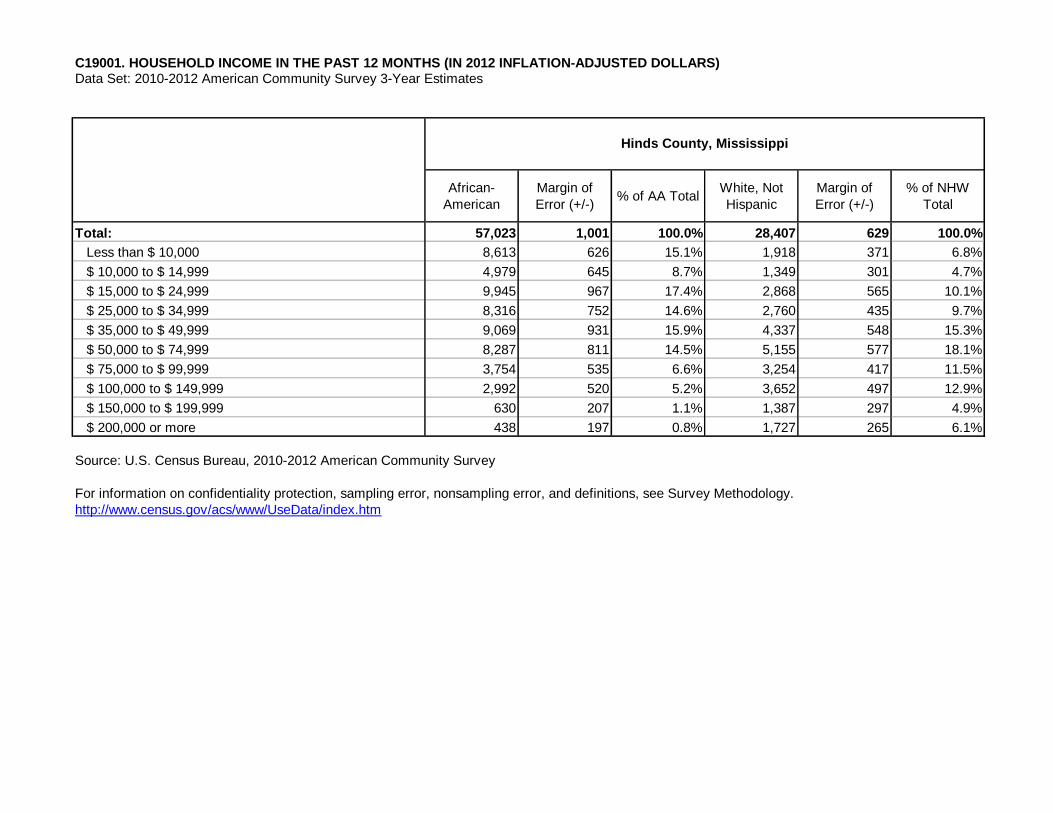
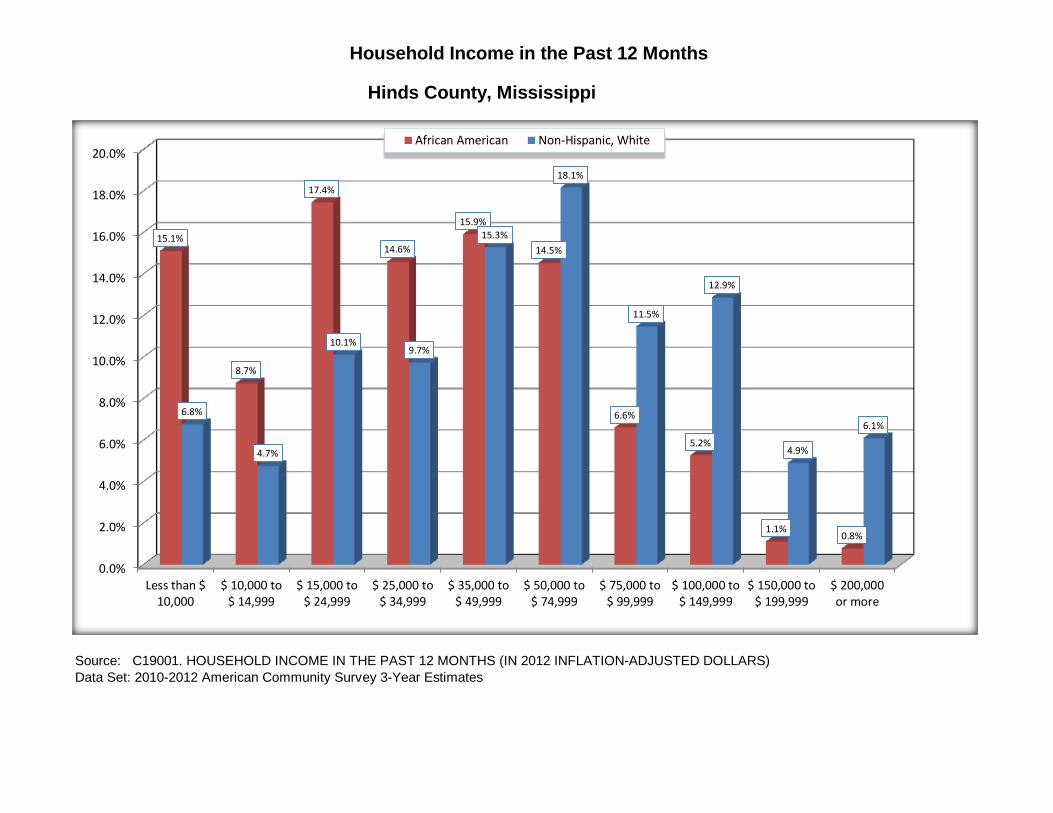
Total: 57,023 1,001 100.0% 28,407 629 100.0%
Less than $ 10,000 8,613 626 15.1% 1,918 371 6.8%
$ 10,000 to $ 14,999 4,979 645 8.7% 1,349 301 4.7%
$ 15,000 to $ 24,999 9,945 967 17.4% 2,868 565 10.1%
$ 25,000 to $ 34,999 8,316 752 14.6% 2,760 435 9.7%
$ 35,000 to $ 49,999 9,069 931 15.9% 4,337 548 15.3%
$ 50,000 to $ 74,999 8,287 811 14.5% 5,155 577 18.1%
$ 75,000 to $ 99,999 3,754 535 6.6% 3,254 417 11.5%
$ 100,000 to $ 149,999 2,992 520 5.2% 3,652 497 12.9%
$ 150,000 to $ 199,999 630 207 1.1% 1,387 297 4.9%
$ 200,000 or more 438 197 0.8% 1,727 265 6.1%
http://www.census.gov/acs/www/UseData/index.htm
Hinds County, Mississippi
Source: U.S. Census Bureau, 2010-2012 American Community Survey
C19001. HOUSEHOLD INCOME IN THE PAST 12 MONTHS (IN 2012 INFLATION-ADJUSTED DOLLARS) Data Set: 2010-2012 American Community Survey 3-Year Estimates
For information on confidentiality protection, sampling error, nonsampling error, and definitions, see Survey Methodology.
Source: C19001. HOUSEHOLD INCOME IN THE PAST 12 MONTHS (IN 2012 INFLATION-ADJUSTED DOLLARS)
Data Set: 2010-2012 American Community Survey 3-Year Estimates
Hinds County, Mississippi
Household Income in the Past 12 Months
0.0%
2.0%
4.0%
6.0%
8.0%
10.0%
12.0%
14.0%
16.0%
18.0%
20.0%
Less than $10,000
$ 10,000 to$ 14,999
$ 15,000 to$ 24,999
$ 25,000 to$ 34,999
$ 35,000 to$ 49,999
$ 50,000 to$ 74,999
$ 75,000 to$ 99,999
$ 100,000 to$ 149,999
$ 150,000 to$ 199,999
$ 200,000or more
15.1%
8.7%
17.4%
14.6%
15.9%
14.5%
6.6%
5.2%
1.1% 0.8%
6.8%
4.7%
10.1% 9.7%
15.3%
18.1%
11.5%
12.9%
4.9%
6.1%
African American Non-Hispanic, White
African-
American
Margin of
Error (+/-)
White, Not
Hispanic
Margin of
Error (+/-)
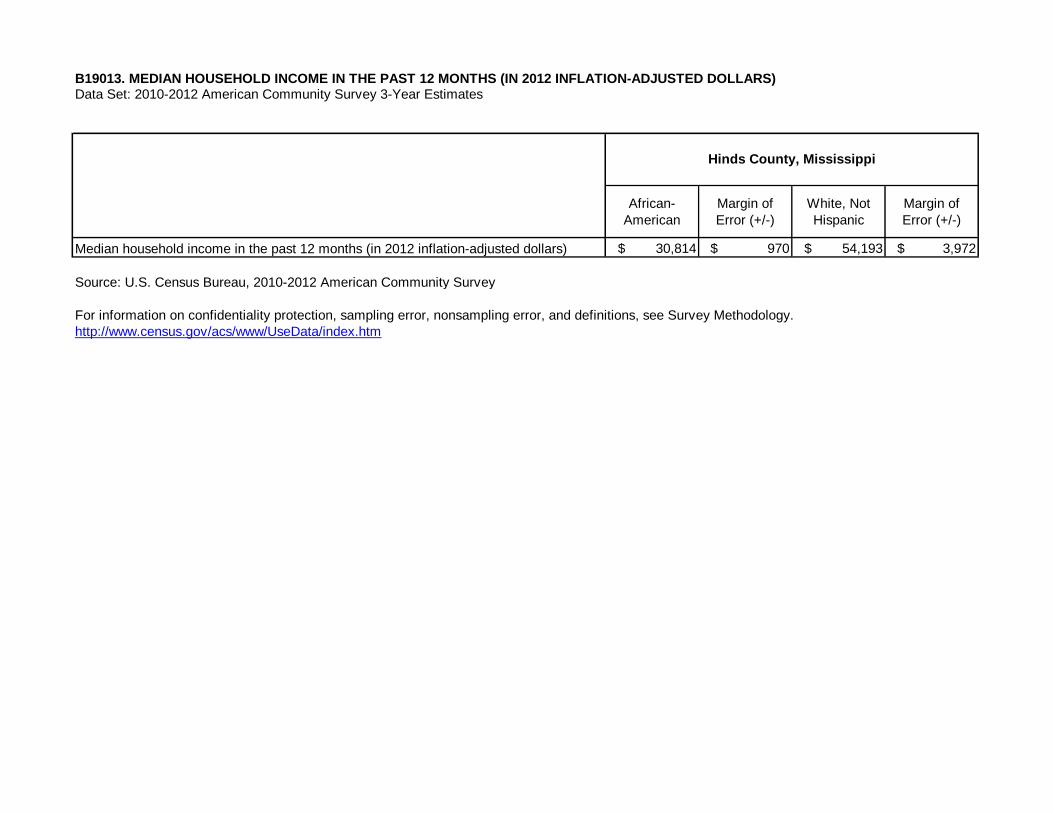
Median household income in the past 12 months (in 2012 inflation-adjusted dollars) $ 30,814 $ 970 $ 54,193 $ 3,972
Source: U.S. Census Bureau, 2010-2012 American Community Survey
http://www.census.gov/acs/www/UseData/index.htm
Hinds County, Mississippi
B19013. MEDIAN HOUSEHOLD INCOME IN THE PAST 12 MONTHS (IN 2012 INFLATION-ADJUSTED DOLLARS)Data Set: 2010-2012 American Community Survey 3-Year Estimates
For information on confidentiality protection, sampling error, nonsampling error, and definitions, see Survey Methodology.

Source: B19013. MEDIAN HOUSEHOLD INCOME IN THE PAST 12 MONTHS (IN 2012 INFLATION-ADJUSTED DOLLARS)
Data Set: 2010-2012 American Community Survey 3-Year Estimates
Median Household Income in the Past 12 Months
Hinds County, Mississippi
$-
$10,000
$20,000
$30,000
$40,000
$50,000
$60,000
Median household income in the past 12 months (in 2012 inflation-adjusted dollars)
$30,814
$54,193
African American Non-Hispanic, White
African-
American
Margin of
Error (+/-)% of AA Total
White, Not
Hispanic
Margin of
Error (+/-)
% of NHW
Total
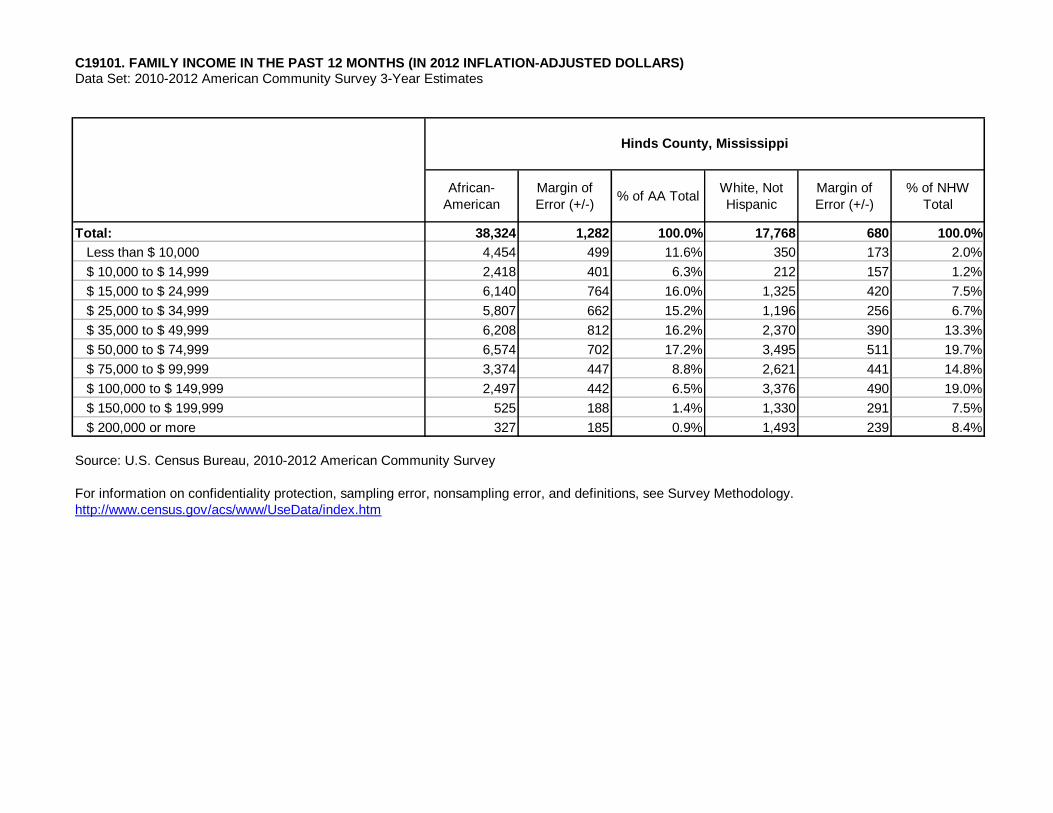
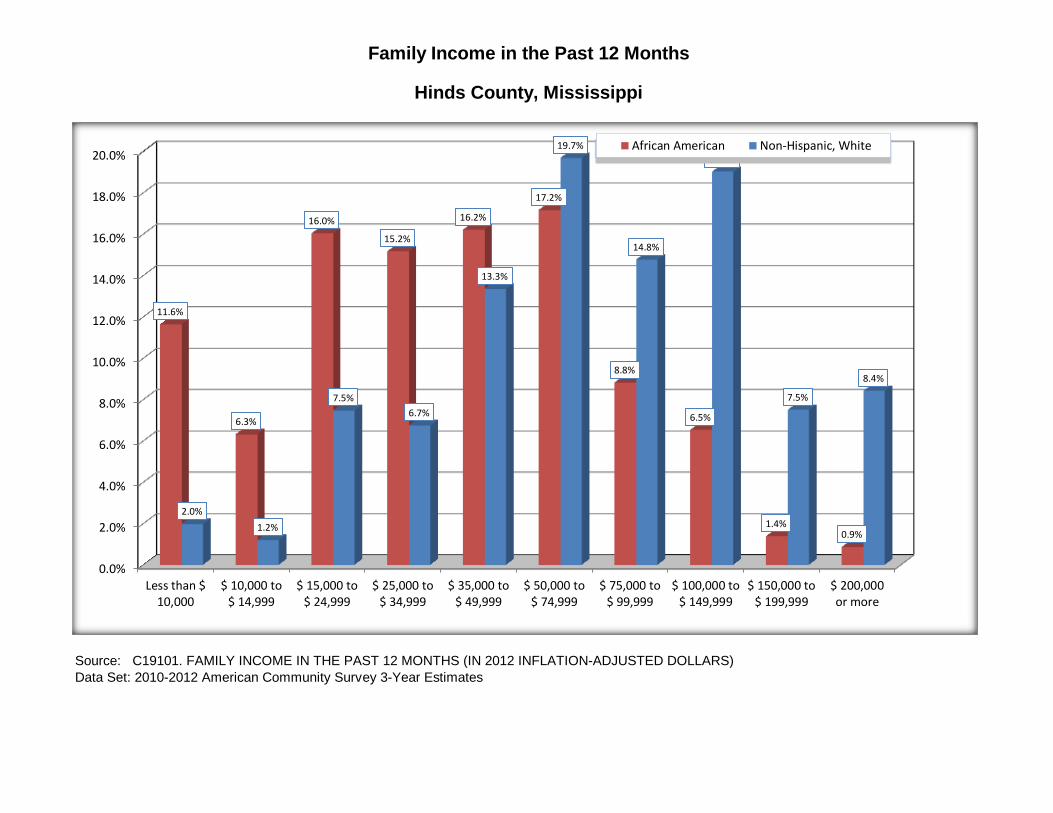
Total: 38,324 1,282 100.0% 17,768 680 100.0%
Less than $ 10,000 4,454 499 11.6% 350 173 2.0%
$ 10,000 to $ 14,999 2,418 401 6.3% 212 157 1.2%
$ 15,000 to $ 24,999 6,140 764 16.0% 1,325 420 7.5%
$ 25,000 to $ 34,999 5,807 662 15.2% 1,196 256 6.7%
$ 35,000 to $ 49,999 6,208 812 16.2% 2,370 390 13.3%
$ 50,000 to $ 74,999 6,574 702 17.2% 3,495 511 19.7%
$ 75,000 to $ 99,999 3,374 447 8.8% 2,621 441 14.8%
$ 100,000 to $ 149,999 2,497 442 6.5% 3,376 490 19.0%
$ 150,000 to $ 199,999 525 188 1.4% 1,330 291 7.5%
$ 200,000 or more 327 185 0.9% 1,493 239 8.4%
http://www.census.gov/acs/www/UseData/index.htm
C19101. FAMILY INCOME IN THE PAST 12 MONTHS (IN 2012 INFLATION-ADJUSTED DOLLARS)
Source: U.S. Census Bureau, 2010-2012 American Community Survey
Data Set: 2010-2012 American Community Survey 3-Year Estimates
Hinds County, Mississippi
For information on confidentiality protection, sampling error, nonsampling error, and definitions, see Survey Methodology.
Source: C19101. FAMILY INCOME IN THE PAST 12 MONTHS (IN 2012 INFLATION-ADJUSTED DOLLARS)
Data Set: 2010-2012 American Community Survey 3-Year Estimates
Family Income in the Past 12 Months
Hinds County, Mississippi
0.0%
2.0%
4.0%
6.0%
8.0%
10.0%
12.0%
14.0%
16.0%
18.0%
20.0%
Less than $10,000
$ 10,000 to$ 14,999
$ 15,000 to$ 24,999
$ 25,000 to$ 34,999
$ 35,000 to$ 49,999
$ 50,000 to$ 74,999
$ 75,000 to$ 99,999
$ 100,000 to$ 149,999
$ 150,000 to$ 199,999
$ 200,000or more
11.6%
6.3%
16.0%
15.2%
16.2%
17.2%
8.8%
6.5%
1.4% 0.9%
2.0%
1.2%
7.5%
6.7%
13.3%
19.7%
14.8%
19.0%
7.5%
8.4%
African American Non-Hispanic, White
African-
American
Margin of
Error (+/-)
White, Not
Hispanic
Margin of
Error (+/-)
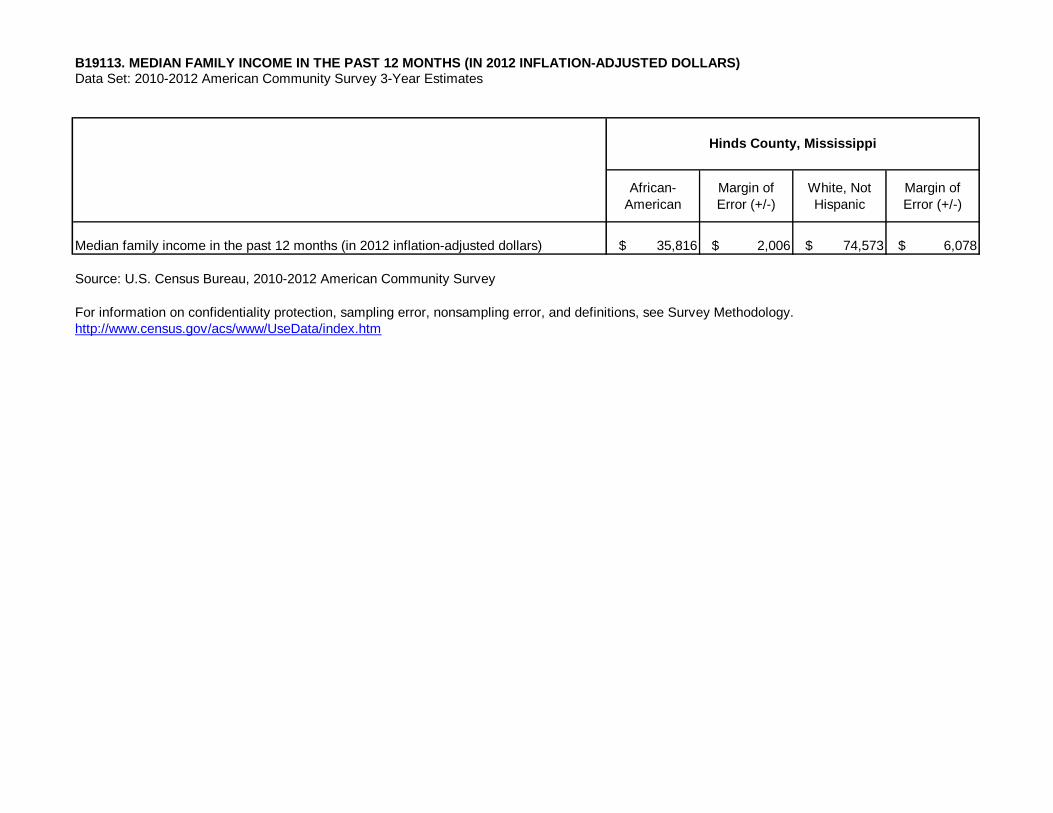
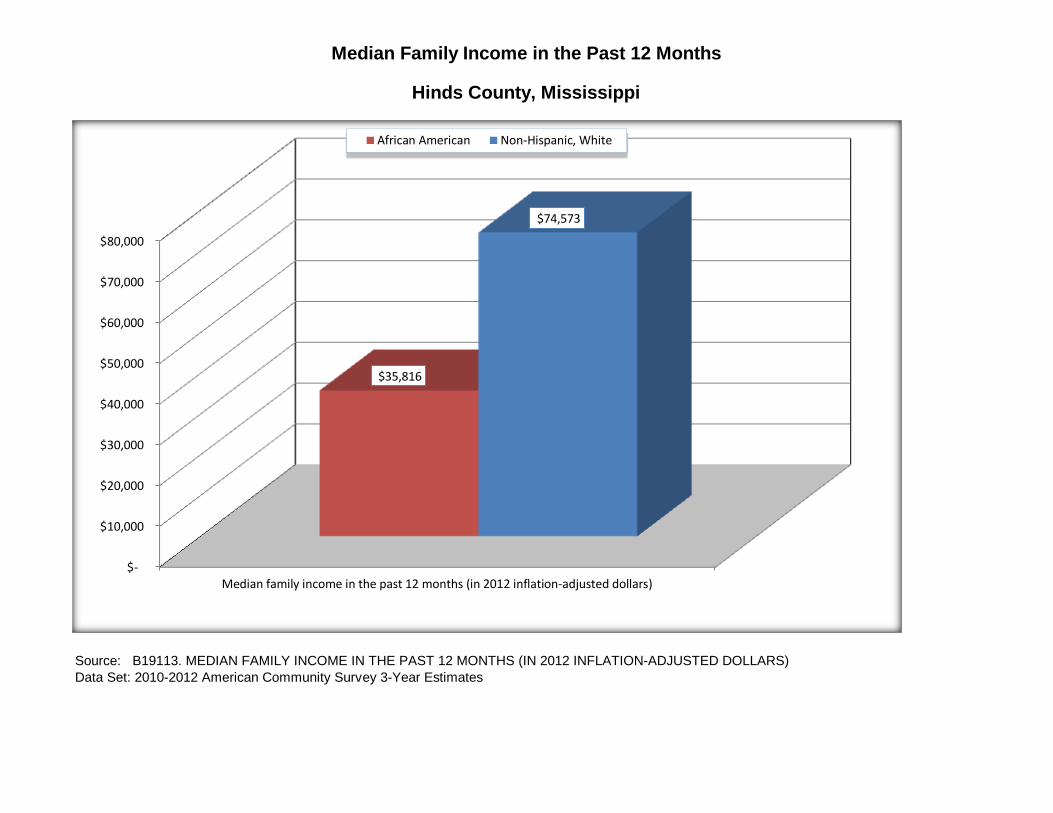
Median family income in the past 12 months (in 2012 inflation-adjusted dollars) $ 35,816 $ 2,006 $ 74,573 $ 6,078
http://www.census.gov/acs/www/UseData/index.htm
Hinds County, Mississippi
Source: U.S. Census Bureau, 2010-2012 American Community Survey
B19113. MEDIAN FAMILY INCOME IN THE PAST 12 MONTHS (IN 2012 INFLATION-ADJUSTED DOLLARS) Data Set: 2010-2012 American Community Survey 3-Year Estimates
For information on confidentiality protection, sampling error, nonsampling error, and definitions, see Survey Methodology.
Source: B19113. MEDIAN FAMILY INCOME IN THE PAST 12 MONTHS (IN 2012 INFLATION-ADJUSTED DOLLARS)
Data Set: 2010-2012 American Community Survey 3-Year Estimates
Hinds County, Mississippi
Median Family Income in the Past 12 Months
$-
$10,000
$20,000
$30,000
$40,000
$50,000
$60,000
$70,000
$80,000
Median family income in the past 12 months (in 2012 inflation-adjusted dollars)
$35,816
$74,573
African American Non-Hispanic, White
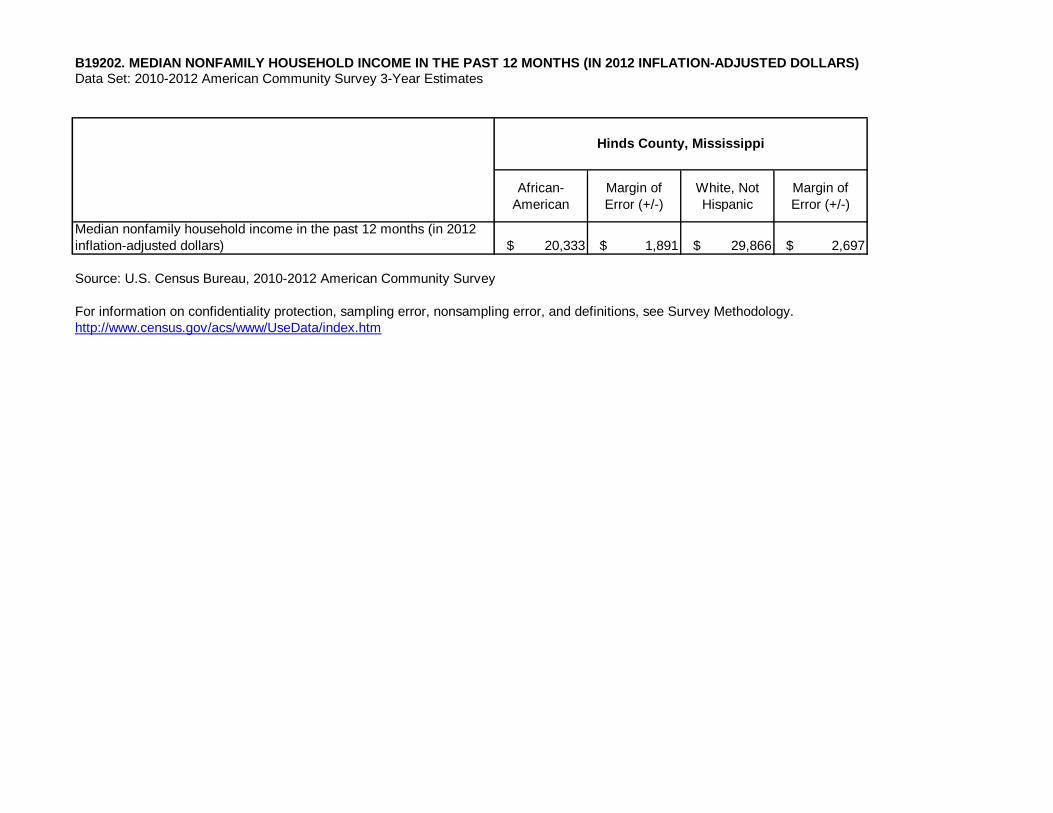
B19202. MEDIAN NONFAMILY HOUSEHOLD INCOME IN THE PAST 12 MONTHS (IN 2012 INFLATION-ADJUSTED DOLLARS)
African-
American
Margin of
Error (+/-)
White, Not
Hispanic
Margin of
Error (+/-)
Median nonfamily household income in the past 12 months (in 2012
inflation-adjusted dollars) $ 20,333 $ 1,891 $ 29,866 $ 2,697
http://www.census.gov/acs/www/UseData/index.htm
Hinds County, Mississippi
Source: U.S. Census Bureau, 2010-2012 American Community Survey
Data Set: 2010-2012 American Community Survey 3-Year Estimates
For information on confidentiality protection, sampling error, nonsampling error, and definitions, see Survey Methodology.
Source: B19202. MEDIAN NONFAMILY HOUSEHOLD INCOME IN THE PAST 12 MONTHS (IN 2012 INFLATION-ADJUSTED DOLLARS)
Data Set: 2010-2012 American Community Survey 3-Year Estimates
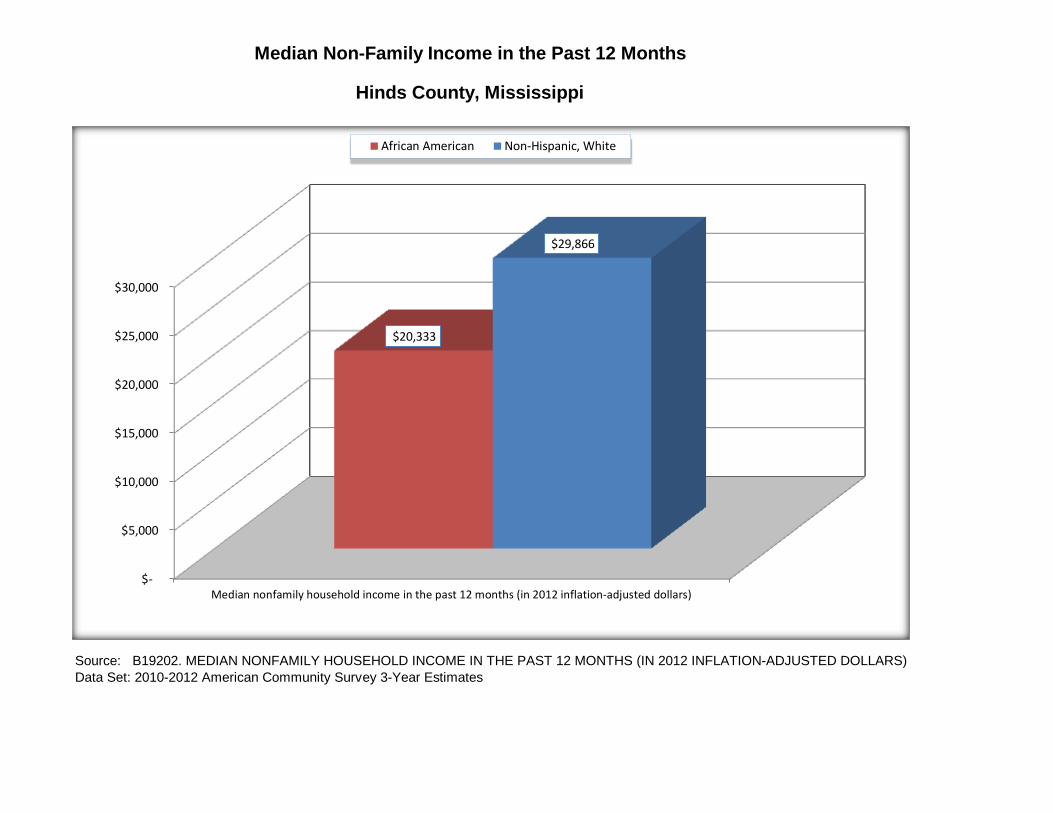
Median Non-Family Income in the Past 12 Months
Hinds County, Mississippi
$-
$5,000
$10,000
$15,000
$20,000
$25,000
$30,000
Median nonfamily household income in the past 12 months (in 2012 inflation-adjusted dollars)
$20,333
$29,866
African American Non-Hispanic, White
African-
American
Margin of
Error (+/-)
White, Not
Hispanic
Margin of
Error (+/-)
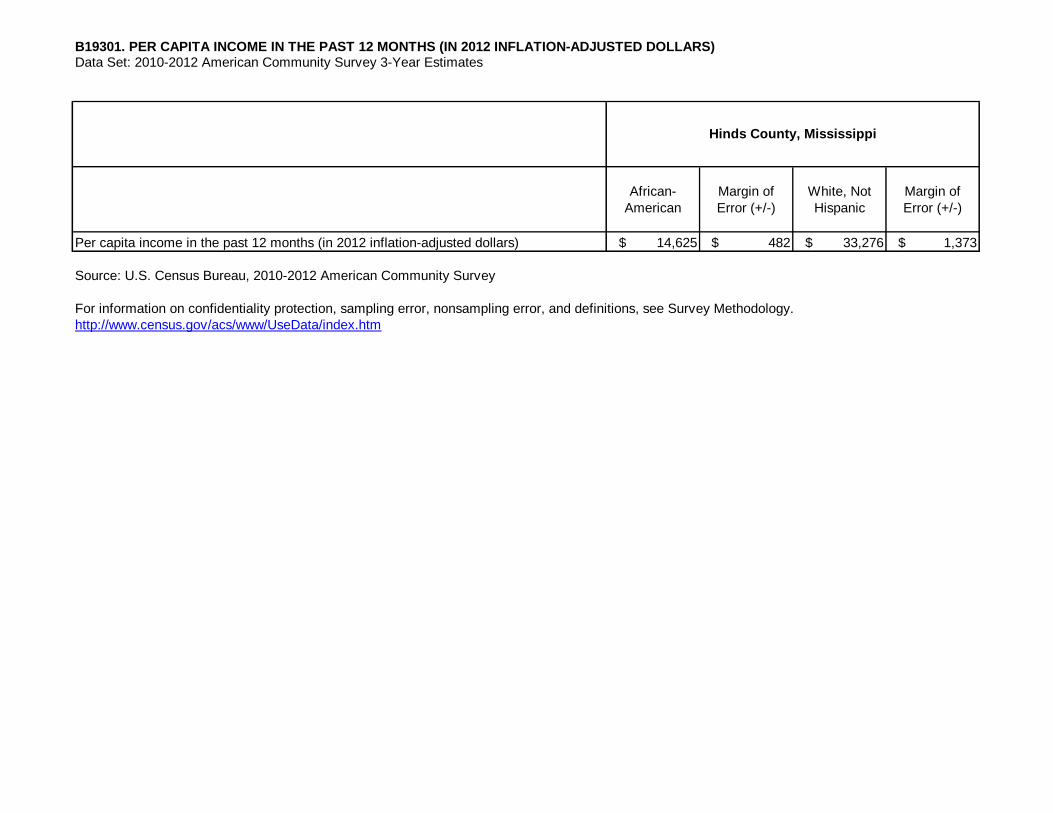
Per capita income in the past 12 months (in 2012 inflation-adjusted dollars) $ 14,625 $ 482 $ 33,276 $ 1,373
http://www.census.gov/acs/www/UseData/index.htm
B19301. PER CAPITA INCOME IN THE PAST 12 MONTHS (IN 2012 INFLATION-ADJUSTED DOLLARS)Data Set: 2010-2012 American Community Survey 3-Year Estimates
Source: U.S. Census Bureau, 2010-2012 American Community Survey
Hinds County, Mississippi
For information on confidentiality protection, sampling error, nonsampling error, and definitions, see Survey Methodology.
Source: B19301. PER CAPITA INCOME IN THE PAST 12 MONTHS (IN 2012 INFLATION-ADJUSTED DOLLARS)
Data Set: 2010-2012 American Community Survey 3-Year Estimates
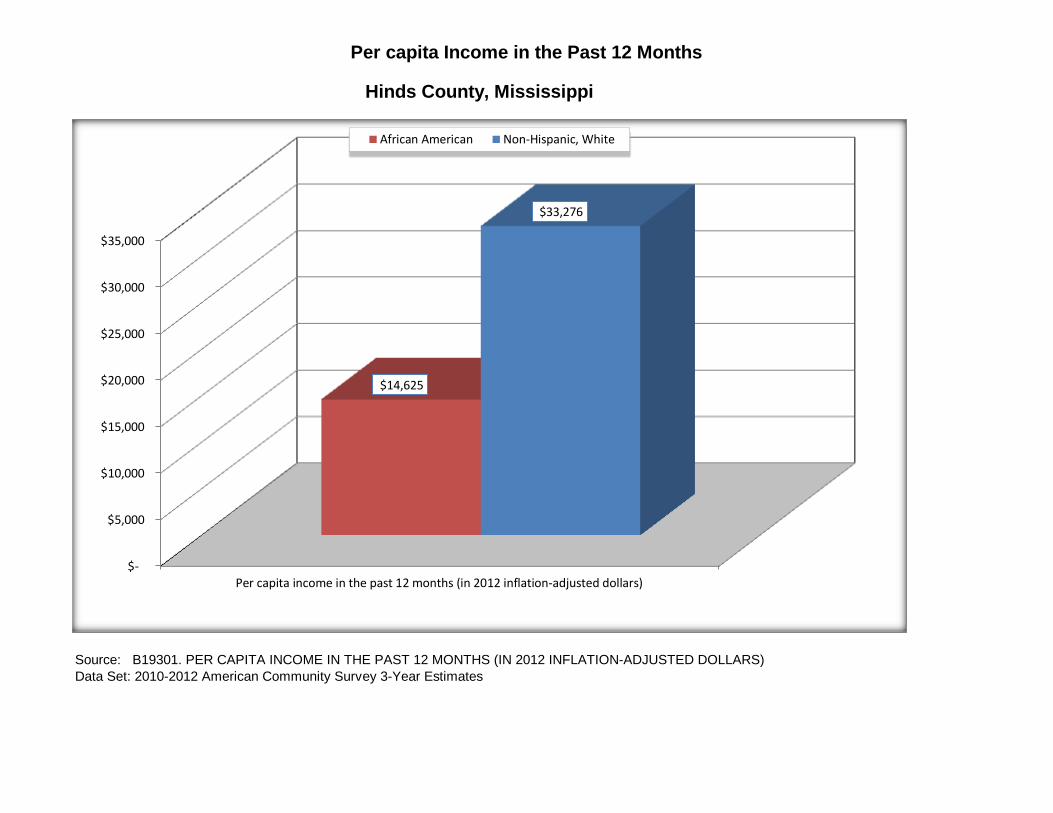
Per capita Income in the Past 12 Months
Hinds County, Mississippi
$-
$5,000
$10,000
$15,000
$20,000
$25,000
$30,000
$35,000
Per capita income in the past 12 months (in 2012 inflation-adjusted dollars)
$14,625
$33,276
African American Non-Hispanic, White
African-
American
Margin of
Error (+/-)
White, Not
Hispanic
Margin of
Error (+/-)
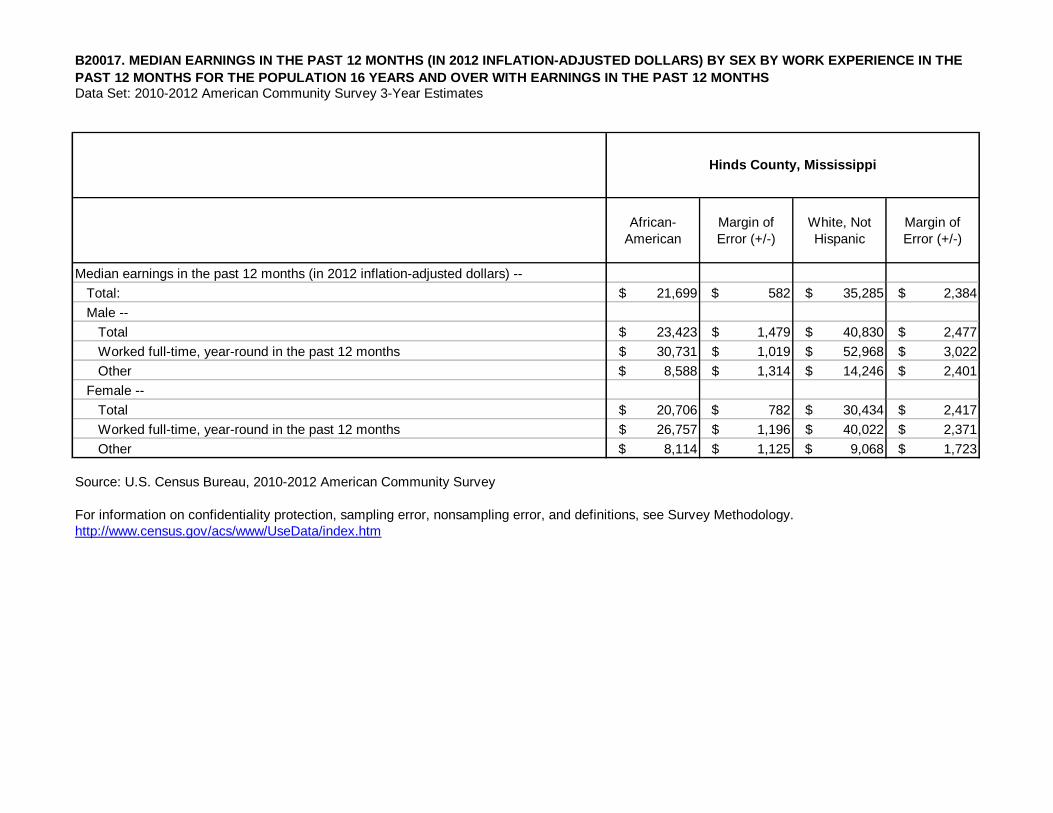
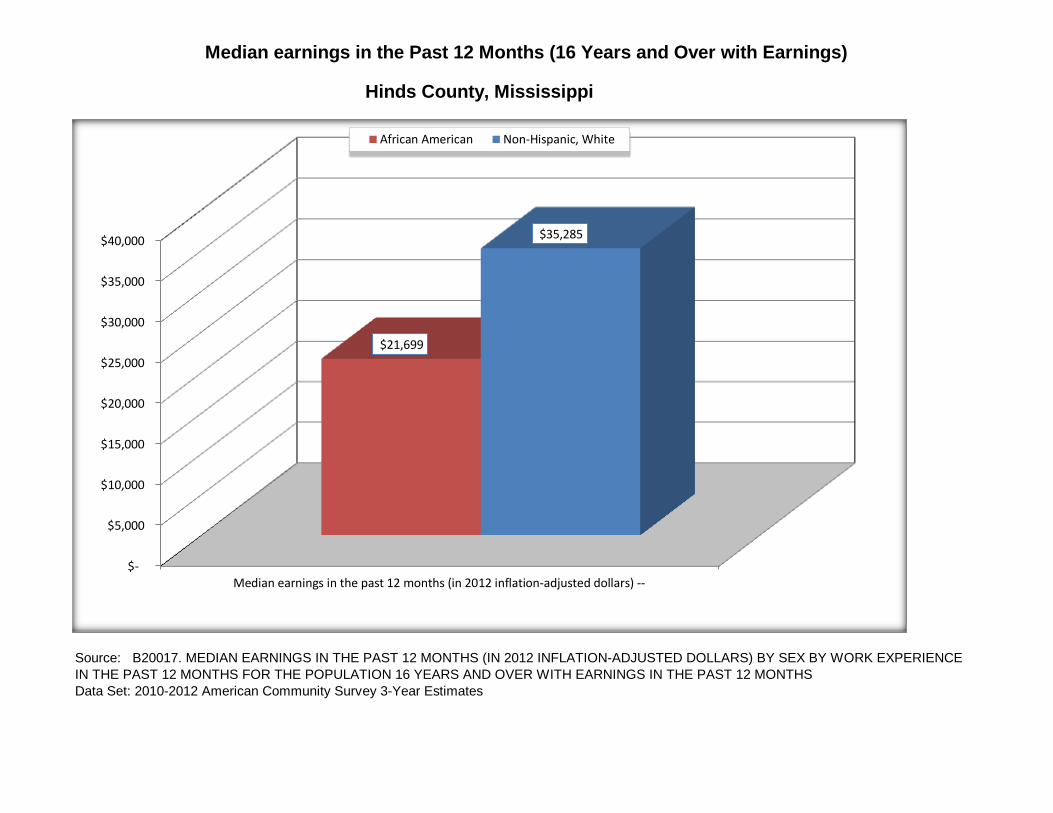
Median earnings in the past 12 months (in 2012 inflation-adjusted dollars) --
Total: $ 21,699 $ 582 $ 35,285 $ 2,384
Male --
Total $ 23,423 $ 1,479 $ 40,830 $ 2,477
Worked full-time, year-round in the past 12 months $ 30,731 $ 1,019 $ 52,968 $ 3,022
Other $ 8,588 $ 1,314 $ 14,246 $ 2,401
Female --
Total $ 20,706 $ 782 $ 30,434 $ 2,417
Worked full-time, year-round in the past 12 months $ 26,757 $ 1,196 $ 40,022 $ 2,371
Other $ 8,114 $ 1,125 $ 9,068 $ 1,723
http://www.census.gov/acs/www/UseData/index.htm
Hinds County, Mississippi
B20017. MEDIAN EARNINGS IN THE PAST 12 MONTHS (IN 2012 INFLATION-ADJUSTED DOLLARS) BY SEX BY WORK EXPERIENCE IN THE
PAST 12 MONTHS FOR THE POPULATION 16 YEARS AND OVER WITH EARNINGS IN THE PAST 12 MONTHS Data Set: 2010-2012 American Community Survey 3-Year Estimates
Source: U.S. Census Bureau, 2010-2012 American Community Survey
For information on confidentiality protection, sampling error, nonsampling error, and definitions, see Survey Methodology.
Data Set: 2010-2012 American Community Survey 3-Year Estimates
Median earnings in the Past 12 Months (16 Years and Over with Earnings)
Hinds County, Mississippi
Source: B20017. MEDIAN EARNINGS IN THE PAST 12 MONTHS (IN 2012 INFLATION-ADJUSTED DOLLARS) BY SEX BY WORK EXPERIENCE
IN THE PAST 12 MONTHS FOR THE POPULATION 16 YEARS AND OVER WITH EARNINGS IN THE PAST 12 MONTHS
$-
$5,000
$10,000
$15,000
$20,000
$25,000
$30,000
$35,000
$40,000
Median earnings in the past 12 months (in 2012 inflation-adjusted dollars) --
$21,699
$35,285
African American Non-Hispanic, White
African-
American
Margin of
Error (+/-)% of AA Total
White, Not
Hispanic
Margin of
Error (+/-)
% of NHW
Total
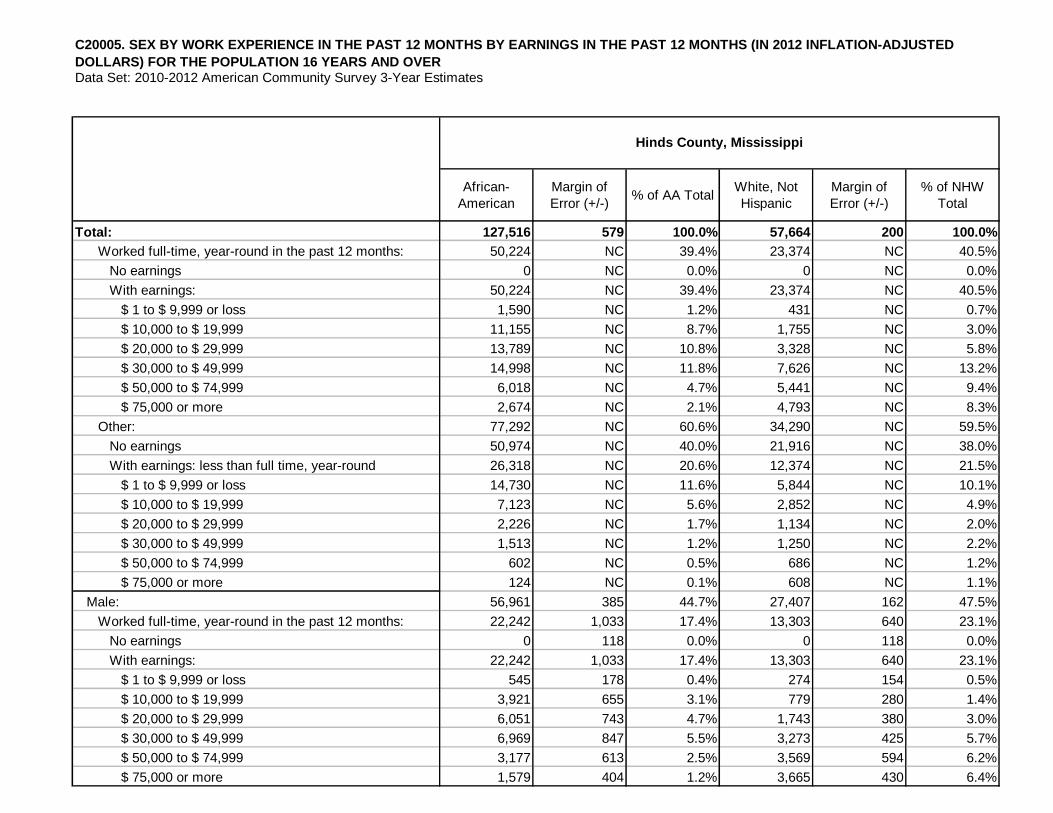
Total: 127,516 579 100.0% 57,664 200 100.0%
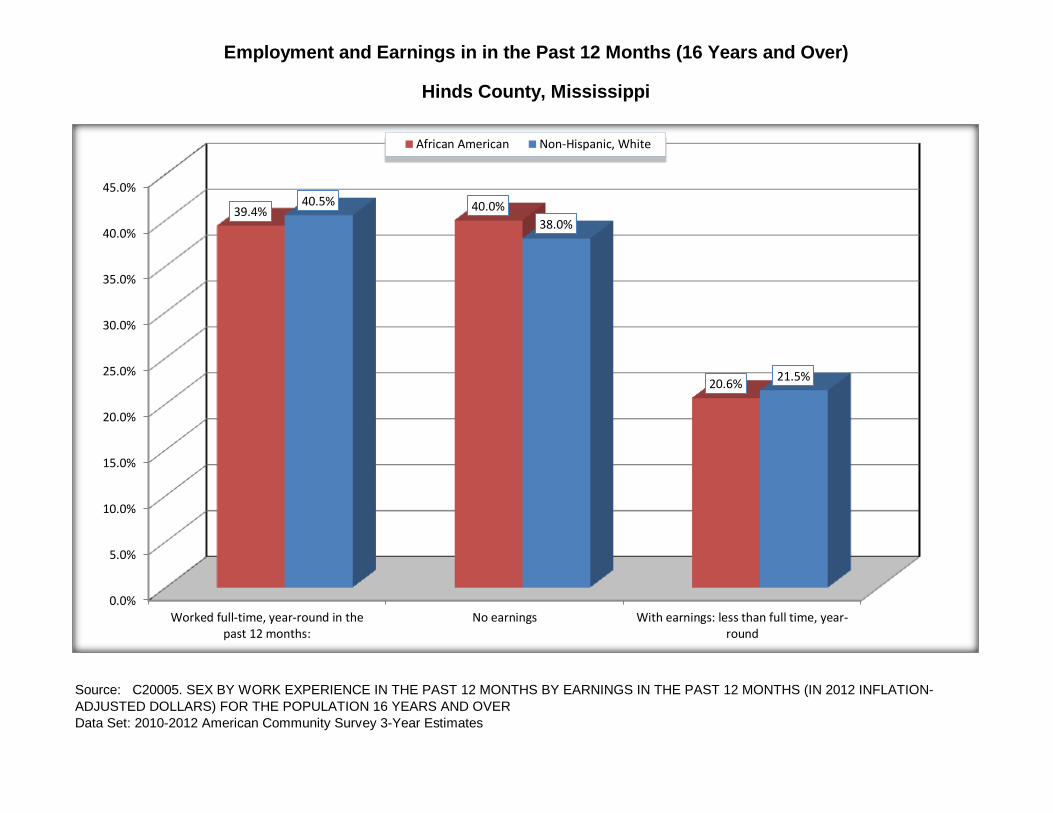
Worked full-time, year-round in the past 12 months: 50,224 NC 39.4% 23,374 NC 40.5%
No earnings 0 NC 0.0% 0 NC 0.0%
With earnings: 50,224 NC 39.4% 23,374 NC 40.5%
$ 1 to $ 9,999 or loss 1,590 NC 1.2% 431 NC 0.7%
$ 10,000 to $ 19,999 11,155 NC 8.7% 1,755 NC 3.0%
$ 20,000 to $ 29,999 13,789 NC 10.8% 3,328 NC 5.8%
$ 30,000 to $ 49,999 14,998 NC 11.8% 7,626 NC 13.2%
$ 50,000 to $ 74,999 6,018 NC 4.7% 5,441 NC 9.4%
$ 75,000 or more 2,674 NC 2.1% 4,793 NC 8.3%
Other: 77,292 NC 60.6% 34,290 NC 59.5%
No earnings 50,974 NC 40.0% 21,916 NC 38.0%
With earnings: less than full time, year-round 26,318 NC 20.6% 12,374 NC 21.5%
$ 1 to $ 9,999 or loss 14,730 NC 11.6% 5,844 NC 10.1%
$ 10,000 to $ 19,999 7,123 NC 5.6% 2,852 NC 4.9%
$ 20,000 to $ 29,999 2,226 NC 1.7% 1,134 NC 2.0%
$ 30,000 to $ 49,999 1,513 NC 1.2% 1,250 NC 2.2%
$ 50,000 to $ 74,999 602 NC 0.5% 686 NC 1.2%
$ 75,000 or more 124 NC 0.1% 608 NC 1.1%
Male: 56,961 385 44.7% 27,407 162 47.5%
Worked full-time, year-round in the past 12 months: 22,242 1,033 17.4% 13,303 640 23.1%
No earnings 0 118 0.0% 0 118 0.0%
With earnings: 22,242 1,033 17.4% 13,303 640 23.1%
$ 1 to $ 9,999 or loss 545 178 0.4% 274 154 0.5%
$ 10,000 to $ 19,999 3,921 655 3.1% 779 280 1.4%
$ 20,000 to $ 29,999 6,051 743 4.7% 1,743 380 3.0%
$ 30,000 to $ 49,999 6,969 847 5.5% 3,273 425 5.7%
$ 50,000 to $ 74,999 3,177 613 2.5% 3,569 594 6.2%
$ 75,000 or more 1,579 404 1.2% 3,665 430 6.4%
Hinds County, Mississippi
C20005. SEX BY WORK EXPERIENCE IN THE PAST 12 MONTHS BY EARNINGS IN THE PAST 12 MONTHS (IN 2012 INFLATION-ADJUSTED
DOLLARS) FOR THE POPULATION 16 YEARS AND OVERData Set: 2010-2012 American Community Survey 3-Year Estimates
African-
American
Margin of
Error (+/-)% of AA Total
White, Not
Hispanic
Margin of
Error (+/-)
% of NHW
Total
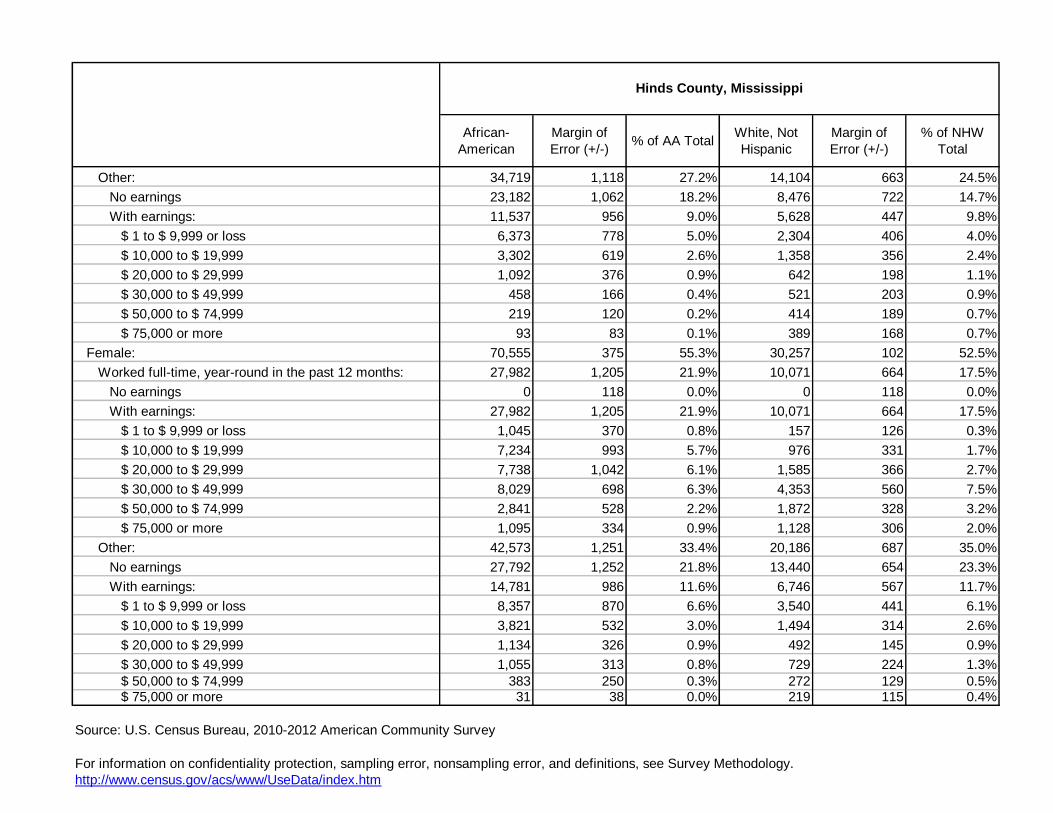
Other: 34,719 1,118 27.2% 14,104 663 24.5%
No earnings 23,182 1,062 18.2% 8,476 722 14.7%
With earnings: 11,537 956 9.0% 5,628 447 9.8%
$ 1 to $ 9,999 or loss 6,373 778 5.0% 2,304 406 4.0%
$ 10,000 to $ 19,999 3,302 619 2.6% 1,358 356 2.4%
$ 20,000 to $ 29,999 1,092 376 0.9% 642 198 1.1%
$ 30,000 to $ 49,999 458 166 0.4% 521 203 0.9%
$ 50,000 to $ 74,999 219 120 0.2% 414 189 0.7%
$ 75,000 or more 93 83 0.1% 389 168 0.7%
Female: 70,555 375 55.3% 30,257 102 52.5%
Worked full-time, year-round in the past 12 months: 27,982 1,205 21.9% 10,071 664 17.5%
No earnings 0 118 0.0% 0 118 0.0%
With earnings: 27,982 1,205 21.9% 10,071 664 17.5%
$ 1 to $ 9,999 or loss 1,045 370 0.8% 157 126 0.3%
$ 10,000 to $ 19,999 7,234 993 5.7% 976 331 1.7%
$ 20,000 to $ 29,999 7,738 1,042 6.1% 1,585 366 2.7%
$ 30,000 to $ 49,999 8,029 698 6.3% 4,353 560 7.5%
$ 50,000 to $ 74,999 2,841 528 2.2% 1,872 328 3.2%
$ 75,000 or more 1,095 334 0.9% 1,128 306 2.0%
Other: 42,573 1,251 33.4% 20,186 687 35.0%
No earnings 27,792 1,252 21.8% 13,440 654 23.3%
With earnings: 14,781 986 11.6% 6,746 567 11.7%
$ 1 to $ 9,999 or loss 8,357 870 6.6% 3,540 441 6.1%
$ 10,000 to $ 19,999 3,821 532 3.0% 1,494 314 2.6%
$ 20,000 to $ 29,999 1,134 326 0.9% 492 145 0.9%
$ 30,000 to $ 49,999 1,055 313 0.8% 729 224 1.3%
$ 50,000 to $ 74,999 383 250 0.3% 272 129 0.5%$ 75,000 or more 31 38 0.0% 219 115 0.4%
http://www.census.gov/acs/www/UseData/index.htm
Hinds County, Mississippi
For information on confidentiality protection, sampling error, nonsampling error, and definitions, see Survey Methodology.
Source: U.S. Census Bureau, 2010-2012 American Community Survey
Data Set: 2010-2012 American Community Survey 3-Year Estimates
Employment and Earnings in in the Past 12 Months (16 Years and Over)
Hinds County, Mississippi
Source: C20005. SEX BY WORK EXPERIENCE IN THE PAST 12 MONTHS BY EARNINGS IN THE PAST 12 MONTHS (IN 2012 INFLATION-
ADJUSTED DOLLARS) FOR THE POPULATION 16 YEARS AND OVER
0.0%
5.0%
10.0%
15.0%
20.0%
25.0%
30.0%
35.0%
40.0%
45.0%
Worked full-time, year-round in thepast 12 months:
No earnings With earnings: less than full time, year-round
39.4% 40.0%
20.6%
40.5%
38.0%
21.5%
African American Non-Hispanic, White
African-
American
Margin of
Error (+/-)% of AA Total
White, Not
Hispanic
Margin of
Error (+/-)
% of NHW
Total
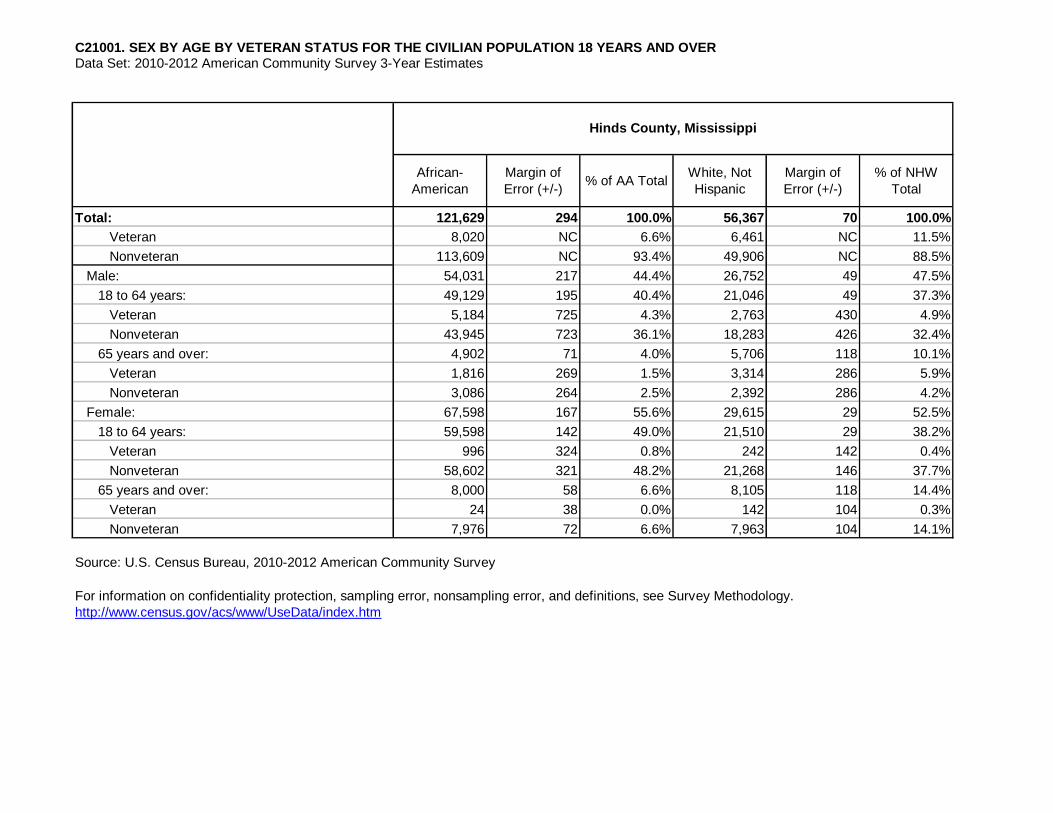
Total: 121,629 294 100.0% 56,367 70 100.0%
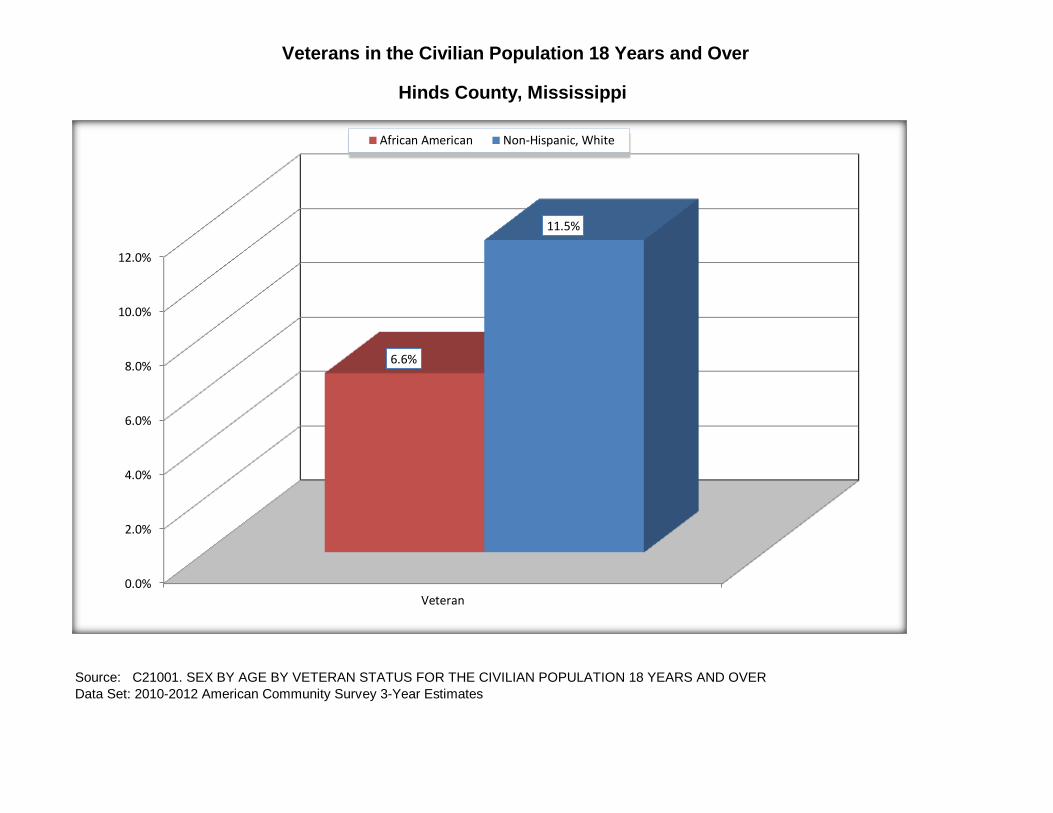
Veteran 8,020 NC 6.6% 6,461 NC 11.5%
Nonveteran 113,609 NC 93.4% 49,906 NC 88.5%
Male: 54,031 217 44.4% 26,752 49 47.5%
18 to 64 years: 49,129 195 40.4% 21,046 49 37.3%
Veteran 5,184 725 4.3% 2,763 430 4.9%
Nonveteran 43,945 723 36.1% 18,283 426 32.4%
65 years and over: 4,902 71 4.0% 5,706 118 10.1%
Veteran 1,816 269 1.5% 3,314 286 5.9%
Nonveteran 3,086 264 2.5% 2,392 286 4.2%
Female: 67,598 167 55.6% 29,615 29 52.5%
18 to 64 years: 59,598 142 49.0% 21,510 29 38.2%
Veteran 996 324 0.8% 242 142 0.4%
Nonveteran 58,602 321 48.2% 21,268 146 37.7%
65 years and over: 8,000 58 6.6% 8,105 118 14.4%
Veteran 24 38 0.0% 142 104 0.3%
Nonveteran 7,976 72 6.6% 7,963 104 14.1%
http://www.census.gov/acs/www/UseData/index.htm
C21001. SEX BY AGE BY VETERAN STATUS FOR THE CIVILIAN POPULATION 18 YEARS AND OVERData Set: 2010-2012 American Community Survey 3-Year Estimates
Hinds County, Mississippi
For information on confidentiality protection, sampling error, nonsampling error, and definitions, see Survey Methodology.
Source: U.S. Census Bureau, 2010-2012 American Community Survey
`
Source: C21001. SEX BY AGE BY VETERAN STATUS FOR THE CIVILIAN POPULATION 18 YEARS AND OVER
Data Set: 2010-2012 American Community Survey 3-Year Estimates
Hinds County, Mississippi
Veterans in the Civilian Population 18 Years and Over
0.0%
2.0%
4.0%
6.0%
8.0%
10.0%
12.0%
Veteran
6.6%
11.5%
African American Non-Hispanic, White
African-
American
Margin of
Error (+/-)% of AA Total
White, Not
Hispanic
Margin of
Error (+/-)
% of NHW
Total
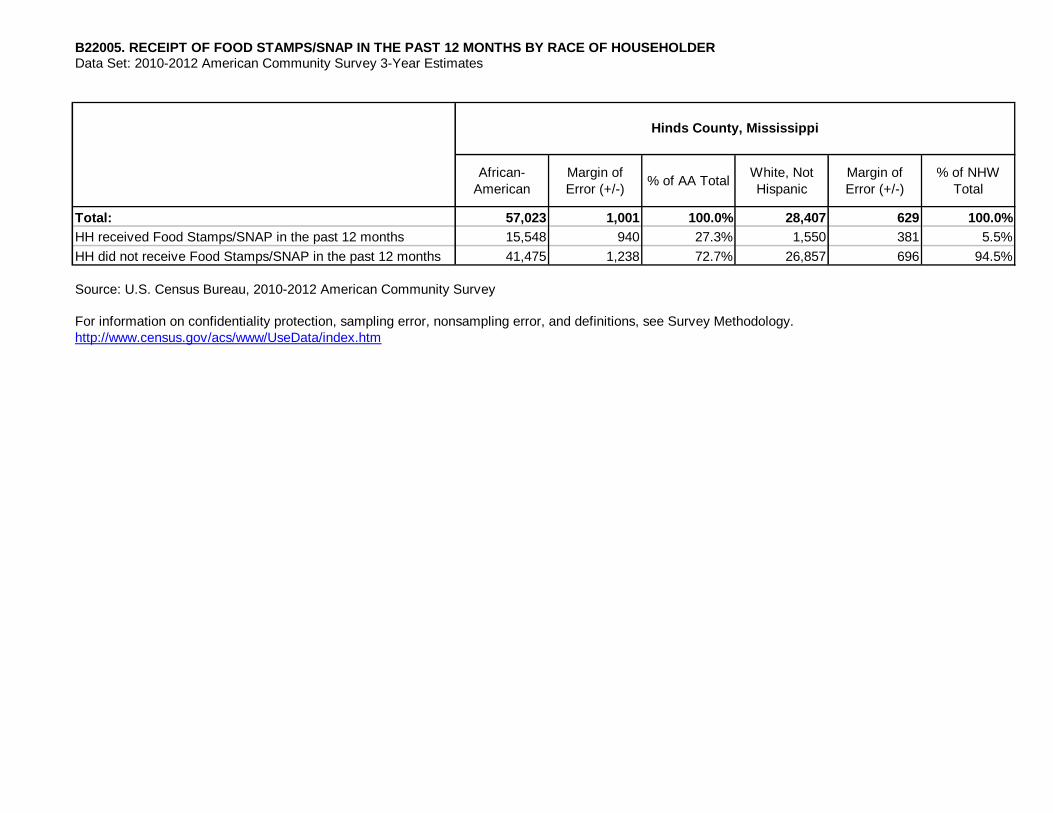
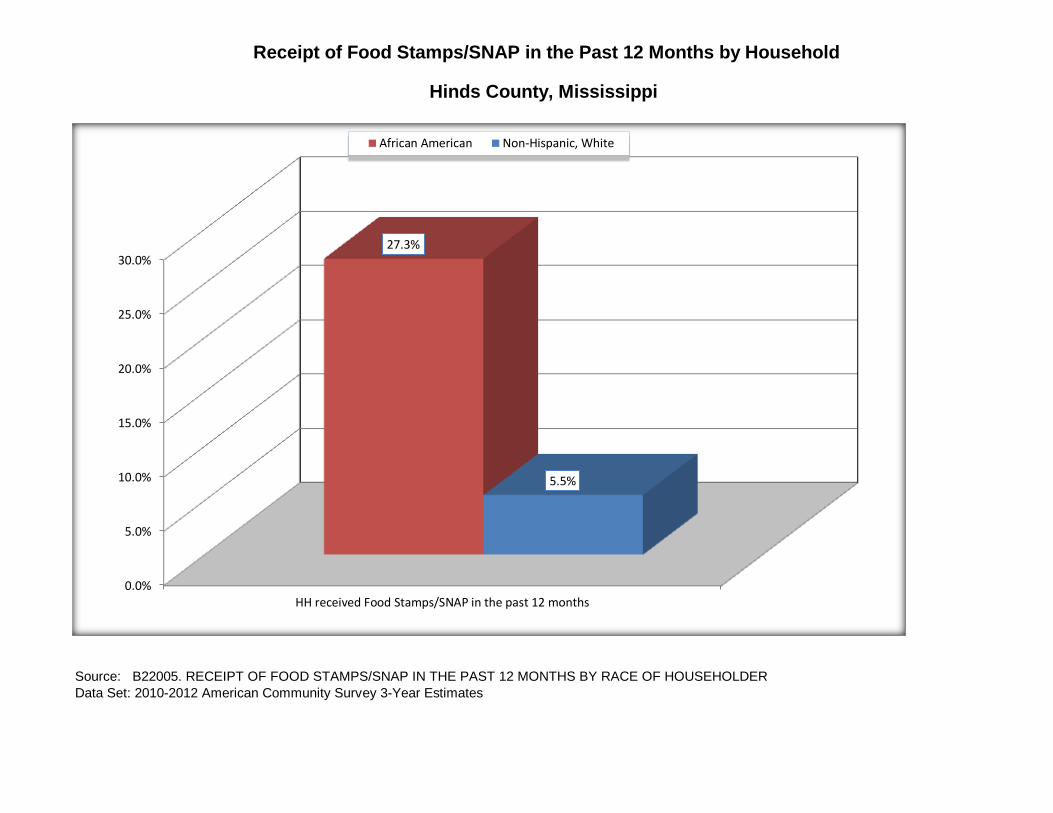
Total: 57,023 1,001 100.0% 28,407 629 100.0%
HH received Food Stamps/SNAP in the past 12 months 15,548 940 27.3% 1,550 381 5.5%
HH did not receive Food Stamps/SNAP in the past 12 months 41,475 1,238 72.7% 26,857 696 94.5%
http://www.census.gov/acs/www/UseData/index.htm
Source: U.S. Census Bureau, 2010-2012 American Community Survey
B22005. RECEIPT OF FOOD STAMPS/SNAP IN THE PAST 12 MONTHS BY RACE OF HOUSEHOLDERData Set: 2010-2012 American Community Survey 3-Year Estimates
Hinds County, Mississippi
For information on confidentiality protection, sampling error, nonsampling error, and definitions, see Survey Methodology.
Source: B22005. RECEIPT OF FOOD STAMPS/SNAP IN THE PAST 12 MONTHS BY RACE OF HOUSEHOLDER
Data Set: 2010-2012 American Community Survey 3-Year Estimates
Hinds County, Mississippi
Receipt of Food Stamps/SNAP in the Past 12 Months by Household
0.0%
5.0%
10.0%
15.0%
20.0%
25.0%
30.0%
HH received Food Stamps/SNAP in the past 12 months
27.3%
5.5%
African American Non-Hispanic, White
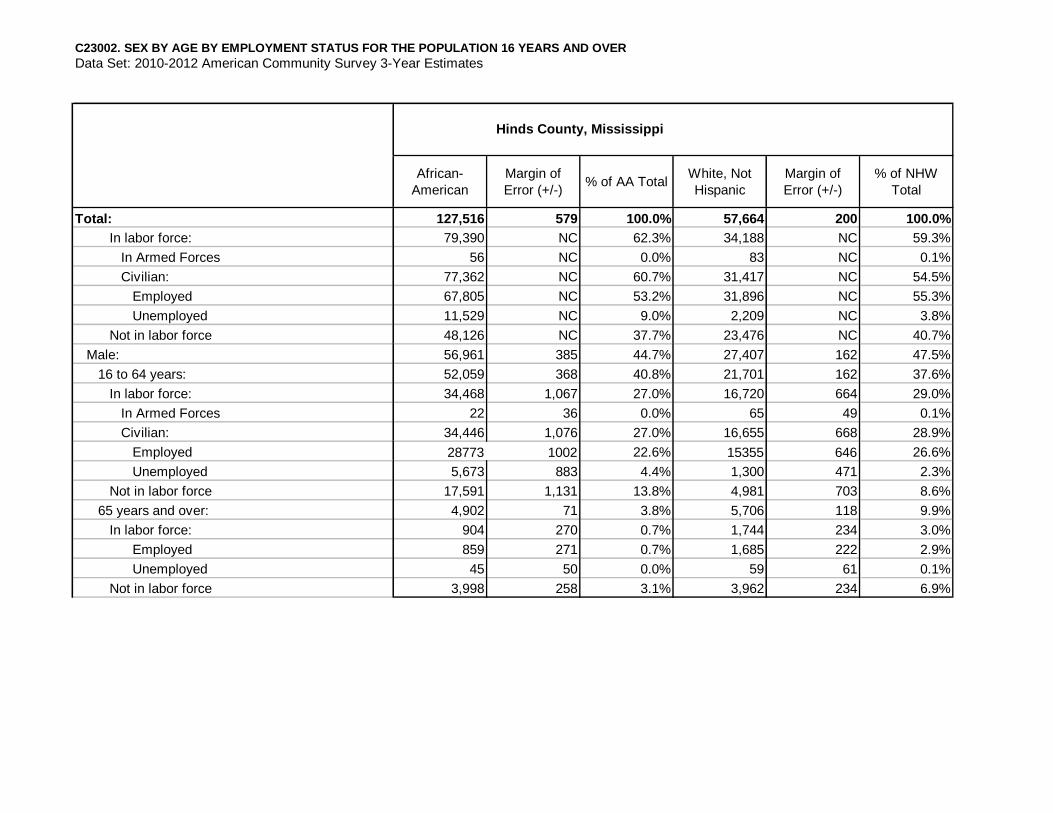
C23002. SEX BY AGE BY EMPLOYMENT STATUS FOR THE POPULATION 16 YEARS AND OVER
African-
American
Margin of
Error (+/-)% of AA Total
White, Not
Hispanic
Margin of
Error (+/-)
% of NHW
Total
Total: 127,516 579 100.0% 57,664 200 100.0%
In labor force: 79,390 NC 62.3% 34,188 NC 59.3%
In Armed Forces 56 NC 0.0% 83 NC 0.1%
Civilian: 77,362 NC 60.7% 31,417 NC 54.5%
Employed 67,805 NC 53.2% 31,896 NC 55.3%
Unemployed 11,529 NC 9.0% 2,209 NC 3.8%
Not in labor force 48,126 NC 37.7% 23,476 NC 40.7%
Male: 56,961 385 44.7% 27,407 162 47.5%
16 to 64 years: 52,059 368 40.8% 21,701 162 37.6%
In labor force: 34,468 1,067 27.0% 16,720 664 29.0%
In Armed Forces 22 36 0.0% 65 49 0.1%
Civilian: 34,446 1,076 27.0% 16,655 668 28.9%
Employed 28773 1002 22.6% 15355 646 26.6%
Unemployed 5,673 883 4.4% 1,300 471 2.3%
Not in labor force 17,591 1,131 13.8% 4,981 703 8.6%
65 years and over: 4,902 71 3.8% 5,706 118 9.9%
In labor force: 904 270 0.7% 1,744 234 3.0%
Employed 859 271 0.7% 1,685 222 2.9%
Unemployed 45 50 0.0% 59 61 0.1%
Not in labor force 3,998 258 3.1% 3,962 234 6.9%
Data Set: 2010-2012 American Community Survey 3-Year Estimates
Hinds County, Mississippi
African-
American
Margin of
Error (+/-)% of AA Total
White, Not
Hispanic
Margin of
Error (+/-)
% of NHW
Total
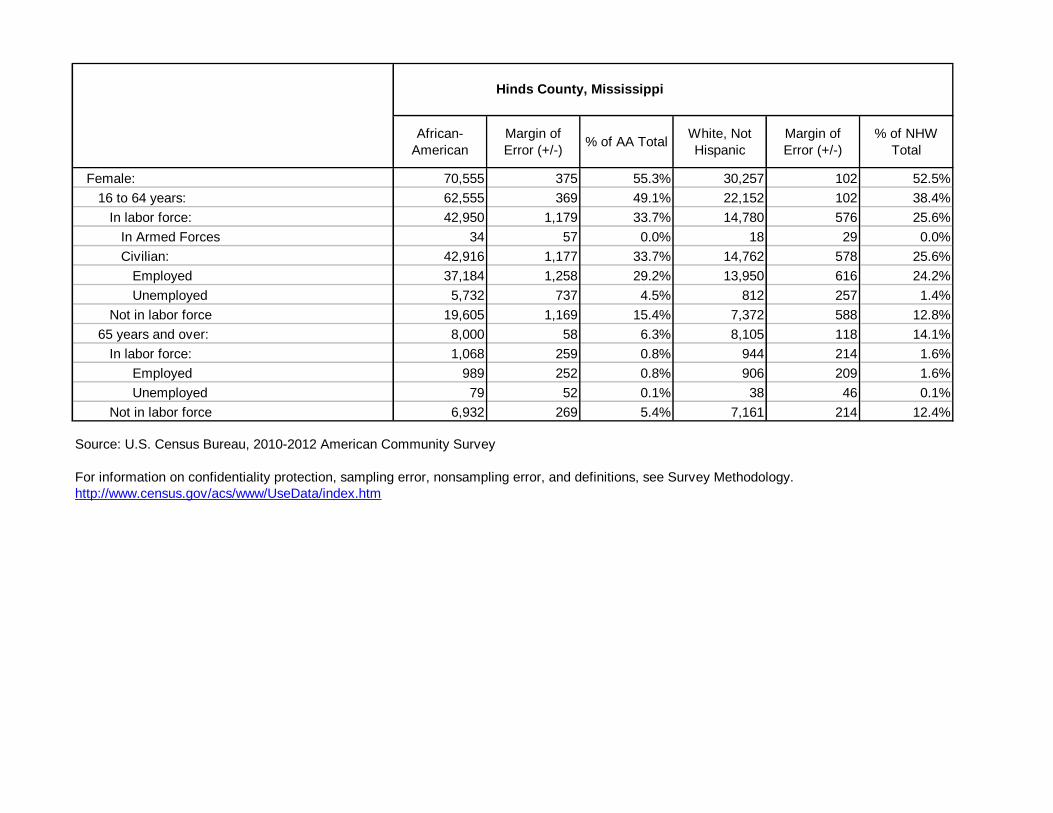
Female: 70,555 375 55.3% 30,257 102 52.5%
16 to 64 years: 62,555 369 49.1% 22,152 102 38.4%
In labor force: 42,950 1,179 33.7% 14,780 576 25.6%
In Armed Forces 34 57 0.0% 18 29 0.0%
Civilian: 42,916 1,177 33.7% 14,762 578 25.6%
Employed 37,184 1,258 29.2% 13,950 616 24.2%
Unemployed 5,732 737 4.5% 812 257 1.4%
Not in labor force 19,605 1,169 15.4% 7,372 588 12.8%
65 years and over: 8,000 58 6.3% 8,105 118 14.1%
In labor force: 1,068 259 0.8% 944 214 1.6%
Employed 989 252 0.8% 906 209 1.6%
Unemployed 79 52 0.1% 38 46 0.1%
Not in labor force 6,932 269 5.4% 7,161 214 12.4%
http://www.census.gov/acs/www/UseData/index.htm
Hinds County, Mississippi
Source: U.S. Census Bureau, 2010-2012 American Community Survey
For information on confidentiality protection, sampling error, nonsampling error, and definitions, see Survey Methodology.
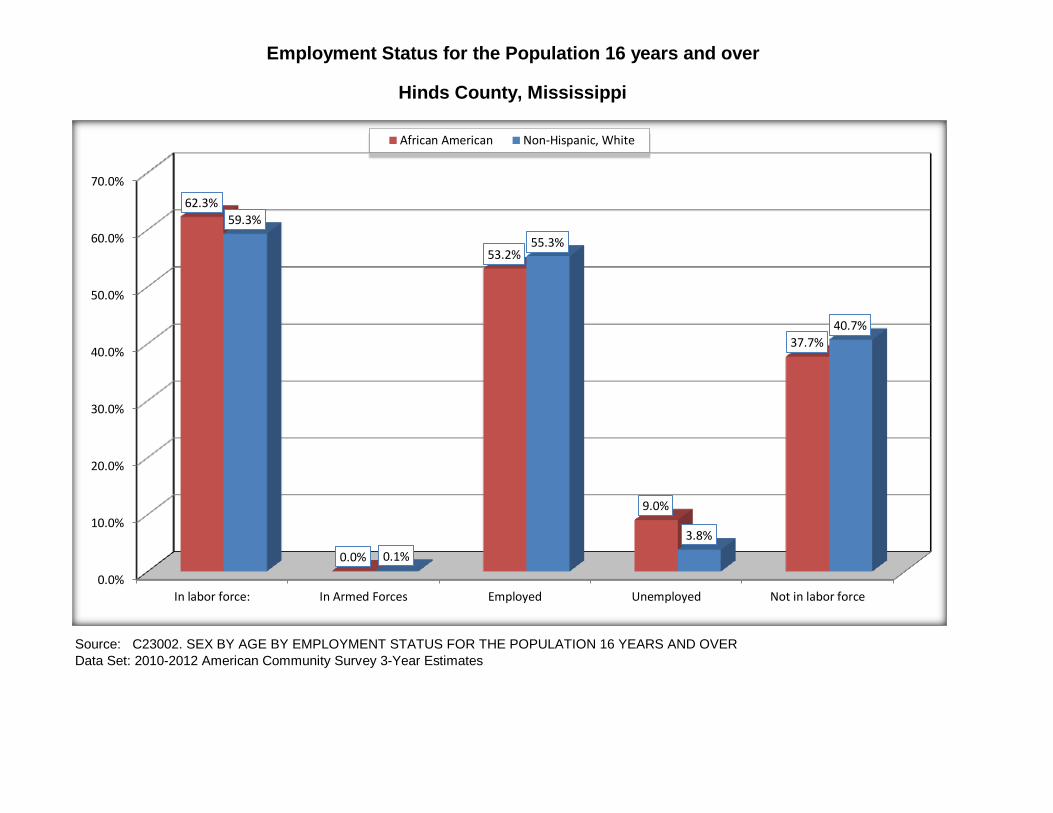
Source: C23002. SEX BY AGE BY EMPLOYMENT STATUS FOR THE POPULATION 16 YEARS AND OVER
Data Set: 2010-2012 American Community Survey 3-Year Estimates
Hinds County, Mississippi
Employment Status for the Population 16 years and over
0.0%
10.0%
20.0%
30.0%
40.0%
50.0%
60.0%
70.0%
In labor force: In Armed Forces Employed Unemployed Not in labor force
62.3%
0.0%
53.2%
9.0%
37.7%
59.3%
0.1%
55.3%
3.8%
40.7%
African American Non-Hispanic, White
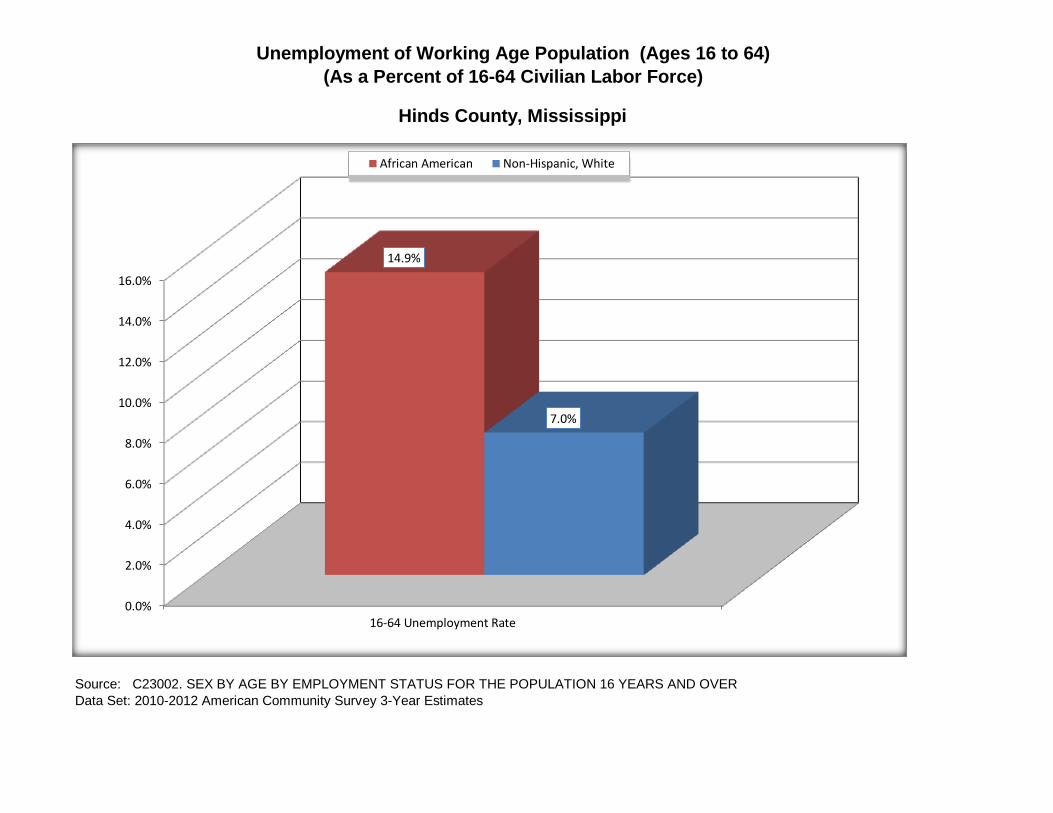
Source: C23002. SEX BY AGE BY EMPLOYMENT STATUS FOR THE POPULATION 16 YEARS AND OVER
Data Set: 2010-2012 American Community Survey 3-Year Estimates
Hinds County, Mississippi
(As a Percent of 16-64 Civilian Labor Force)
Unemployment of Working Age Population (Ages 16 to 64)
0.0%
2.0%
4.0%
6.0%
8.0%
10.0%
12.0%
14.0%
16.0%
16-64 Unemployment Rate
14.9%
7.0%
African American Non-Hispanic, White
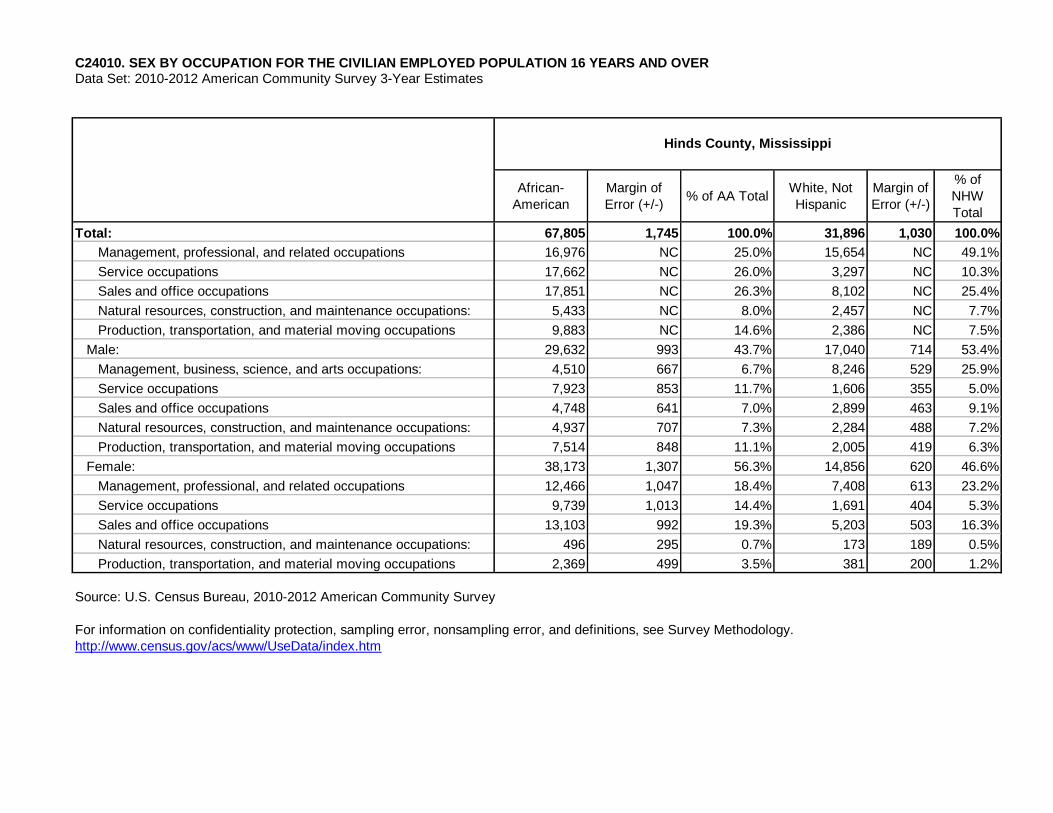
African-
American
Margin of
Error (+/-)% of AA Total
White, Not
Hispanic
Margin of
Error (+/-)
% of
NHW
Total
Total: 67,805 1,745 100.0% 31,896 1,030 100.0%
Management, professional, and related occupations 16,976 NC 25.0% 15,654 NC 49.1%
Service occupations 17,662 NC 26.0% 3,297 NC 10.3%
Sales and office occupations 17,851 NC 26.3% 8,102 NC 25.4%
Natural resources, construction, and maintenance occupations: 5,433 NC 8.0% 2,457 NC 7.7%
Production, transportation, and material moving occupations 9,883 NC 14.6% 2,386 NC 7.5%
Male: 29,632 993 43.7% 17,040 714 53.4%
Management, business, science, and arts occupations: 4,510 667 6.7% 8,246 529 25.9%
Service occupations 7,923 853 11.7% 1,606 355 5.0%
Sales and office occupations 4,748 641 7.0% 2,899 463 9.1%
Natural resources, construction, and maintenance occupations: 4,937 707 7.3% 2,284 488 7.2%
Production, transportation, and material moving occupations 7,514 848 11.1% 2,005 419 6.3%
Female: 38,173 1,307 56.3% 14,856 620 46.6%
Management, professional, and related occupations 12,466 1,047 18.4% 7,408 613 23.2%
Service occupations 9,739 1,013 14.4% 1,691 404 5.3%
Sales and office occupations 13,103 992 19.3% 5,203 503 16.3%
Natural resources, construction, and maintenance occupations: 496 295 0.7% 173 189 0.5%
Production, transportation, and material moving occupations 2,369 499 3.5% 381 200 1.2%
http://www.census.gov/acs/www/UseData/index.htm
Source: U.S. Census Bureau, 2010-2012 American Community Survey
C24010. SEX BY OCCUPATION FOR THE CIVILIAN EMPLOYED POPULATION 16 YEARS AND OVER Data Set: 2010-2012 American Community Survey 3-Year Estimates
Hinds County, Mississippi
For information on confidentiality protection, sampling error, nonsampling error, and definitions, see Survey Methodology.
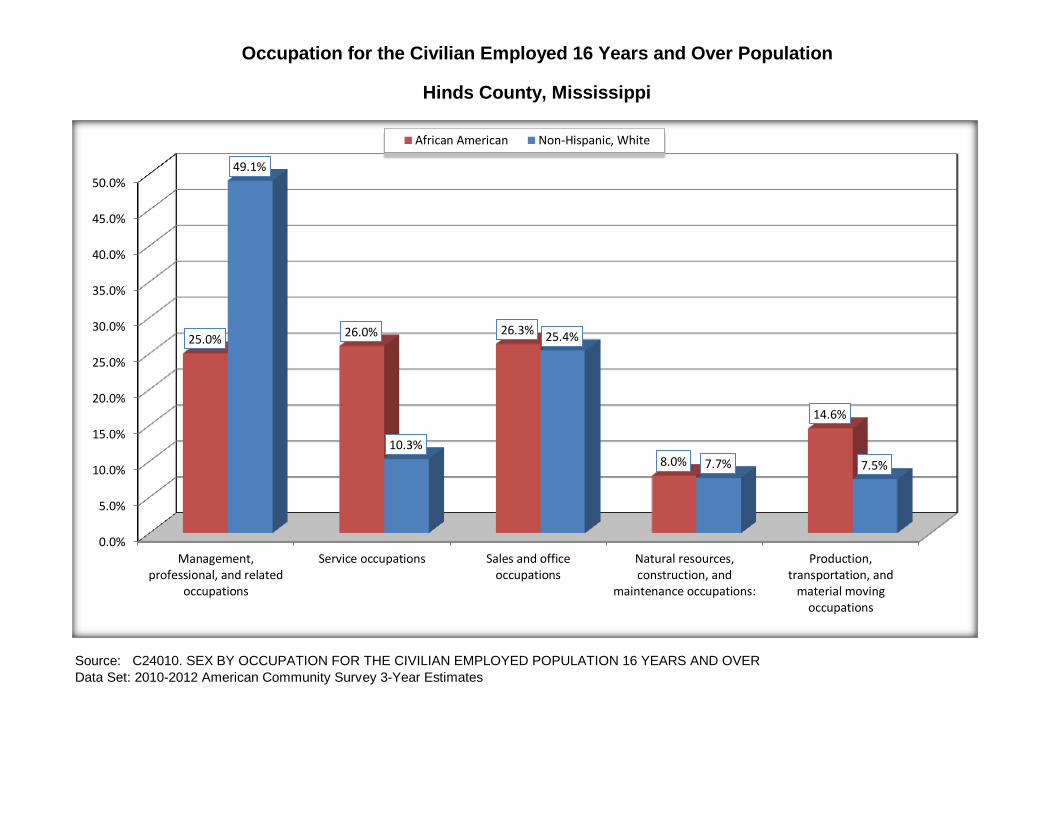
Source: C24010. SEX BY OCCUPATION FOR THE CIVILIAN EMPLOYED POPULATION 16 YEARS AND OVER
Data Set: 2010-2012 American Community Survey 3-Year Estimates
Occupation for the Civilian Employed 16 Years and Over Population
Hinds County, Mississippi
0.0%
5.0%
10.0%
15.0%
20.0%
25.0%
30.0%
35.0%
40.0%
45.0%
50.0%
Management,professional, and related
occupations
Service occupations Sales and officeoccupations
Natural resources,construction, and
maintenance occupations:
Production,transportation, and
material movingoccupations
25.0% 26.0% 26.3%
8.0%
14.6%
49.1%
10.3%
25.4%
7.7% 7.5%
African American Non-Hispanic, White
African-
American
Margin of
Error (+/-)% of AA Total
White, Not
Hispanic
Margin of
Error (+/-)
% of NHW
Total
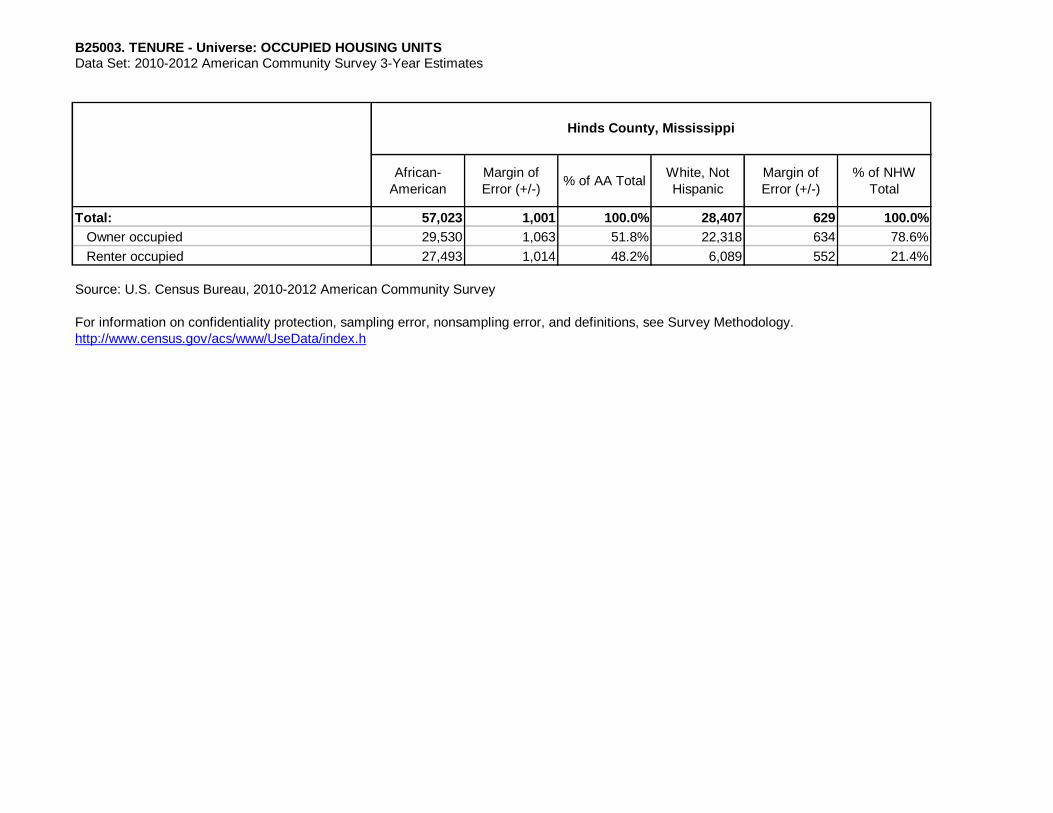
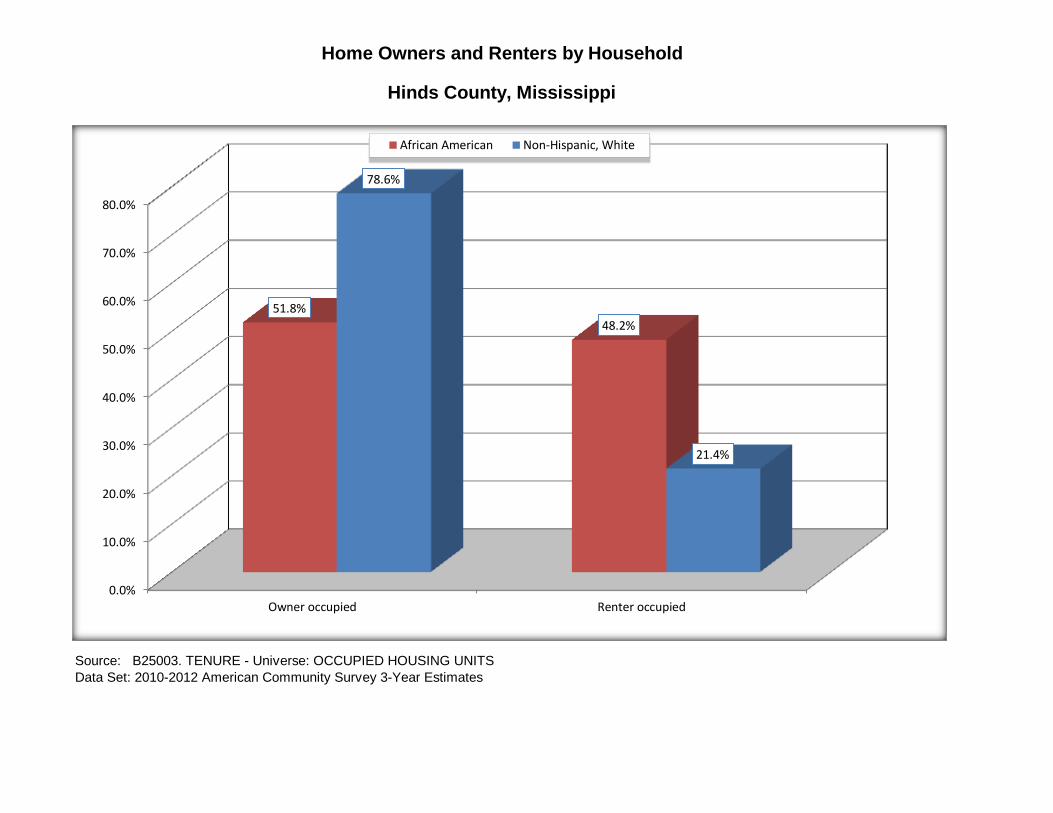
Total: 57,023 1,001 100.0% 28,407 629 100.0%
Owner occupied 29,530 1,063 51.8% 22,318 634 78.6%
Renter occupied 27,493 1,014 48.2% 6,089 552 21.4%
http://www.census.gov/acs/www/UseData/index.h
Hinds County, Mississippi
Source: U.S. Census Bureau, 2010-2012 American Community Survey
B25003. TENURE - Universe: OCCUPIED HOUSING UNITSData Set: 2010-2012 American Community Survey 3-Year Estimates
For information on confidentiality protection, sampling error, nonsampling error, and definitions, see Survey Methodology.
Source: B25003. TENURE - Universe: OCCUPIED HOUSING UNITS
Data Set: 2010-2012 American Community Survey 3-Year Estimates
Hinds County, Mississippi
Home Owners and Renters by Household
0.0%
10.0%
20.0%
30.0%
40.0%
50.0%
60.0%
70.0%
80.0%
Owner occupied Renter occupied
51.8%
48.2%
78.6%
21.4%
African American Non-Hispanic, White
African-
American
Margin of
Error (+/-)% of AA Total
White, Not
Hispanic
Margin of
Error (+/-)
% of NHW
Total
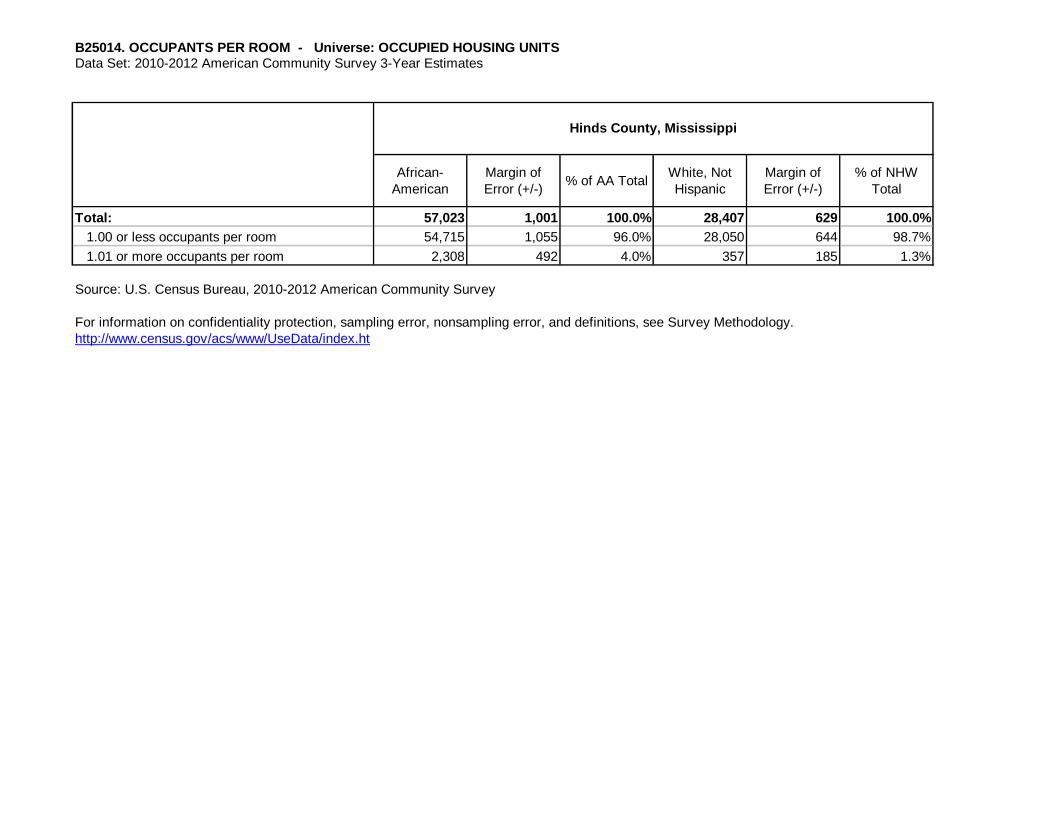
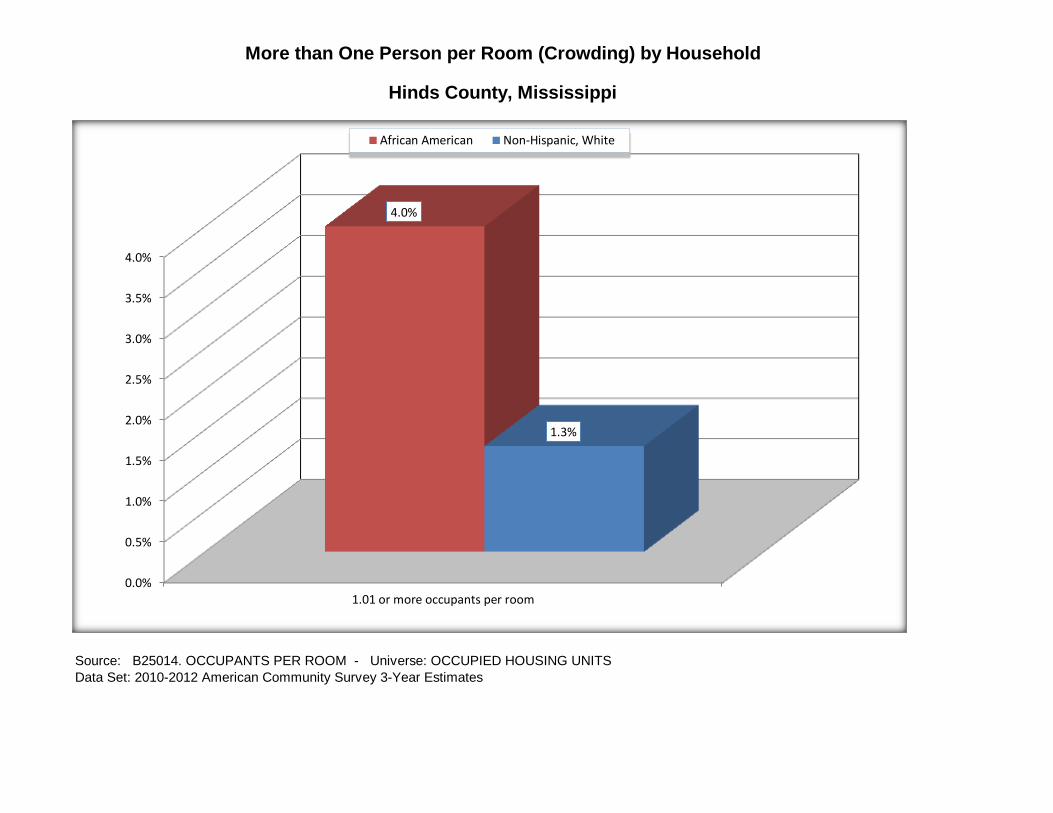
Total: 57,023 1,001 100.0% 28,407 629 100.0%
1.00 or less occupants per room 54,715 1,055 96.0% 28,050 644 98.7%
1.01 or more occupants per room 2,308 492 4.0% 357 185 1.3%
http://www.census.gov/acs/www/UseData/index.ht
Hinds County, Mississippi
Source: U.S. Census Bureau, 2010-2012 American Community Survey
B25014. OCCUPANTS PER ROOM - Universe: OCCUPIED HOUSING UNITSData Set: 2010-2012 American Community Survey 3-Year Estimates
For information on confidentiality protection, sampling error, nonsampling error, and definitions, see Survey Methodology.
Source: B25014. OCCUPANTS PER ROOM - Universe: OCCUPIED HOUSING UNITS
Data Set: 2010-2012 American Community Survey 3-Year Estimates
Hinds County, Mississippi
More than One Person per Room (Crowding) by Household
0.0%
0.5%
1.0%
1.5%
2.0%
2.5%
3.0%
3.5%
4.0%
1.01 or more occupants per room
4.0%
1.3%
African American Non-Hispanic, White
Data Set: 2010-2012 American Community Survey 3-Year Estimates
African-
American
Margin of
Error (+/-)% of AA Total
White, Not
Hispanic
Margin of
Error (+/-)
% of NHW
Total
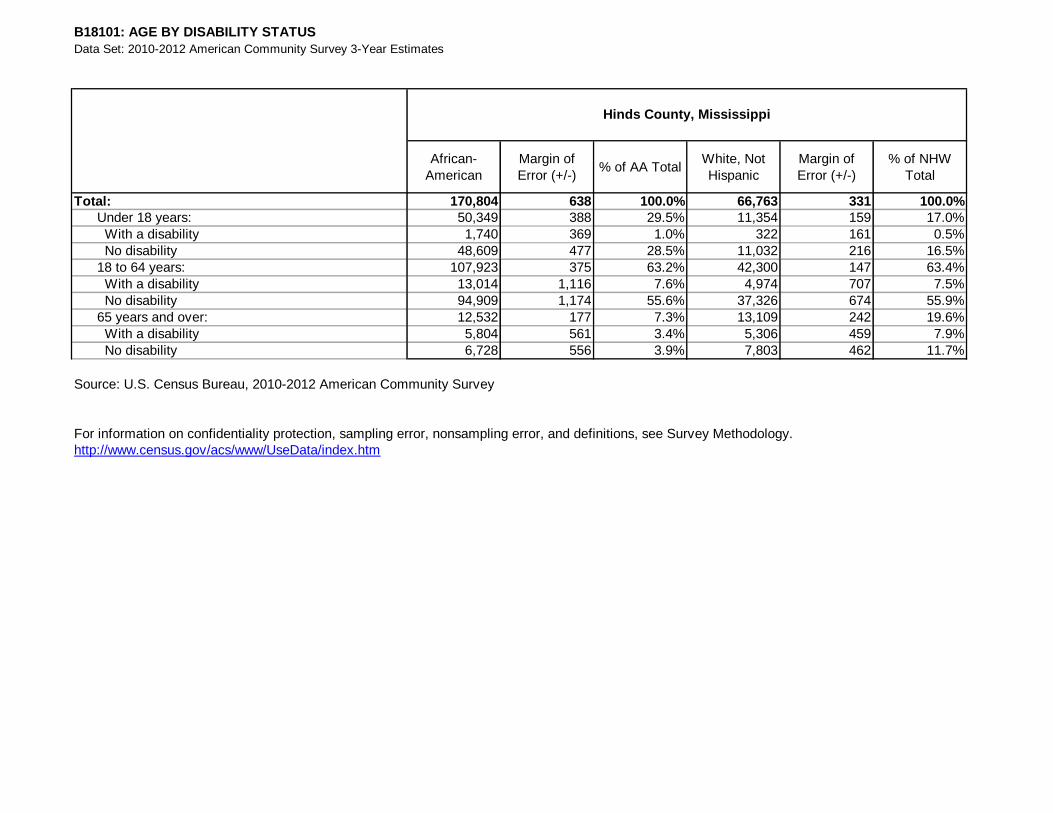
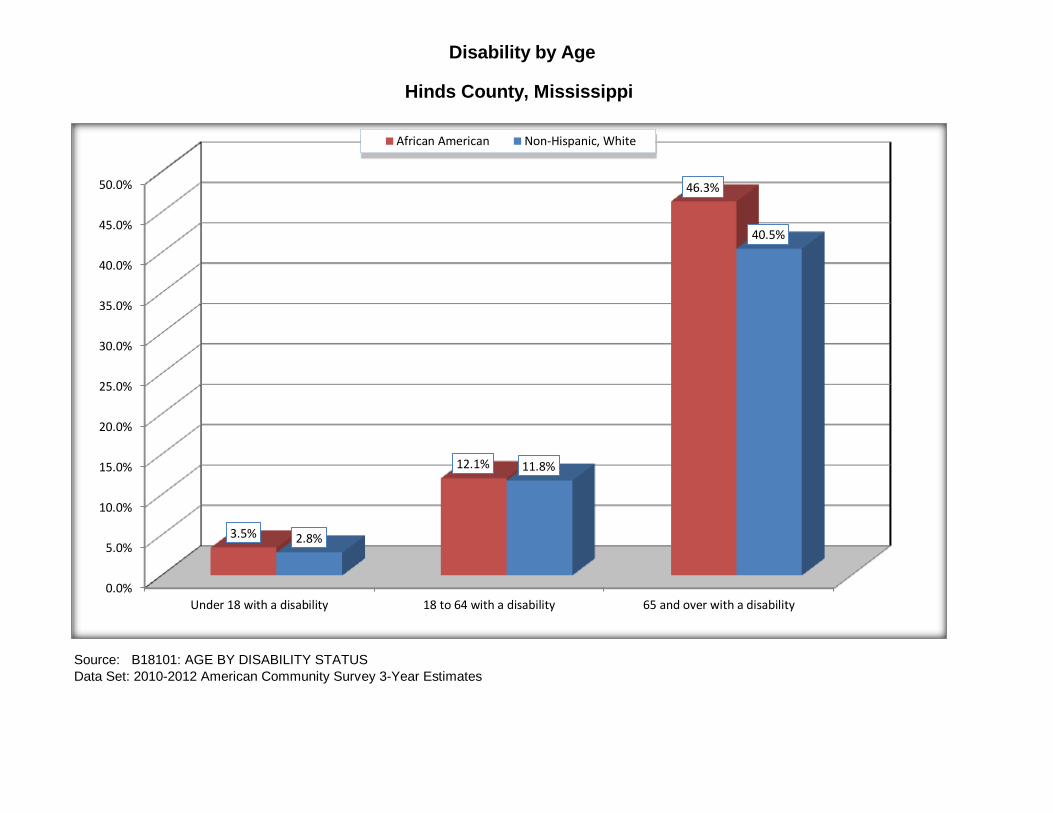
Total: 170,804 638 100.0% 66,763 331 100.0%
Under 18 years: 50,349 388 29.5% 11,354 159 17.0%
With a disability 1,740 369 1.0% 322 161 0.5%
No disability 48,609 477 28.5% 11,032 216 16.5%
18 to 64 years: 107,923 375 63.2% 42,300 147 63.4%
With a disability 13,014 1,116 7.6% 4,974 707 7.5%
No disability 94,909 1,174 55.6% 37,326 674 55.9%
65 years and over: 12,532 177 7.3% 13,109 242 19.6%
With a disability 5,804 561 3.4% 5,306 459 7.9%
No disability 6,728 556 3.9% 7,803 462 11.7%
Source: U.S. Census Bureau, 2010-2012 American Community Survey
http://www.census.gov/acs/www/UseData/index.htm
B18101: AGE BY DISABILITY STATUS
Hinds County, Mississippi
For information on confidentiality protection, sampling error, nonsampling error, and definitions, see Survey Methodology.
Source: B18101: AGE BY DISABILITY STATUS
Data Set: 2010-2012 American Community Survey 3-Year Estimates
Hinds County, Mississippi
Disability by Age
0.0%
5.0%
10.0%
15.0%
20.0%
25.0%
30.0%
35.0%
40.0%
45.0%
50.0%
Under 18 with a disability 18 to 64 with a disability 65 and over with a disability
3.5%
12.1%
46.3%
2.8%
11.8%
40.5%
African American Non-Hispanic, White
Data Set: 2010-2012 American Community Survey 3-Year Estimates
African-
American
Margin of
Error (+/-)% of AA Total
White, Not
Hispanic
Margin of
Error (+/-)
% of NHW
Total
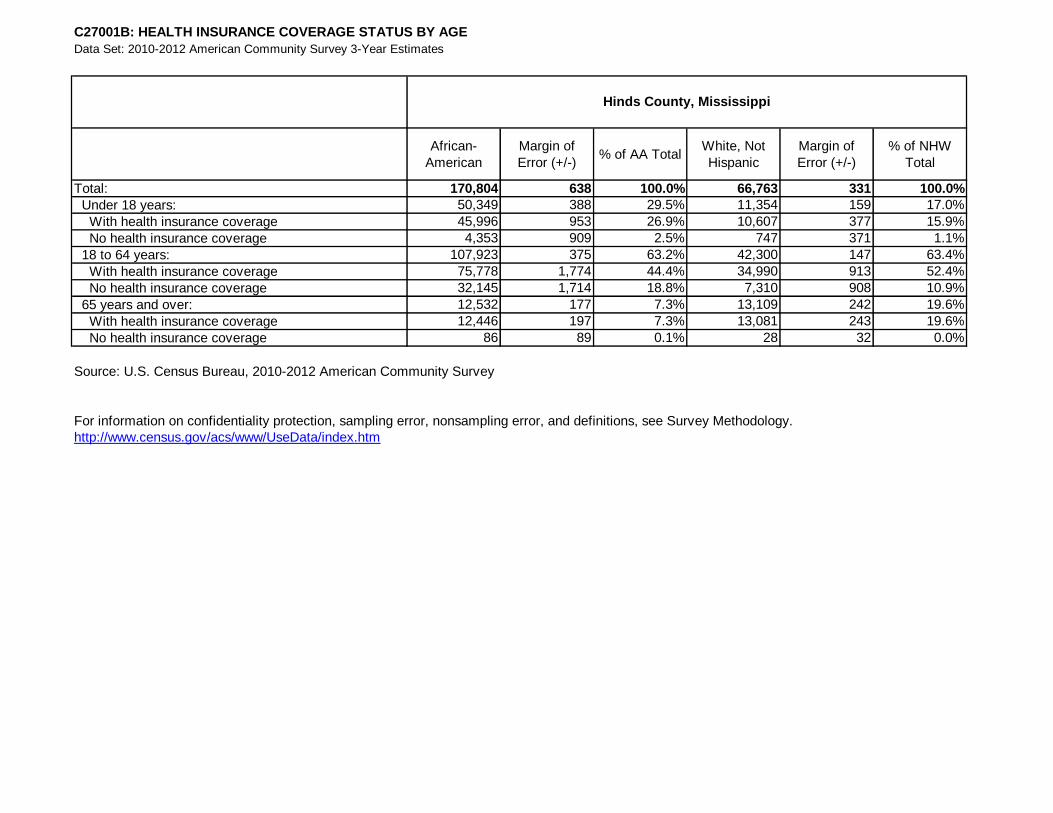
Total: 170,804 638 100.0% 66,763 331 100.0%
Under 18 years: 50,349 388 29.5% 11,354 159 17.0%
With health insurance coverage 45,996 953 26.9% 10,607 377 15.9%
No health insurance coverage 4,353 909 2.5% 747 371 1.1%
18 to 64 years: 107,923 375 63.2% 42,300 147 63.4%
With health insurance coverage 75,778 1,774 44.4% 34,990 913 52.4%
No health insurance coverage 32,145 1,714 18.8% 7,310 908 10.9%
65 years and over: 12,532 177 7.3% 13,109 242 19.6%
With health insurance coverage 12,446 197 7.3% 13,081 243 19.6%
No health insurance coverage 86 89 0.1% 28 32 0.0%
Source: U.S. Census Bureau, 2010-2012 American Community Survey
http://www.census.gov/acs/www/UseData/index.htm
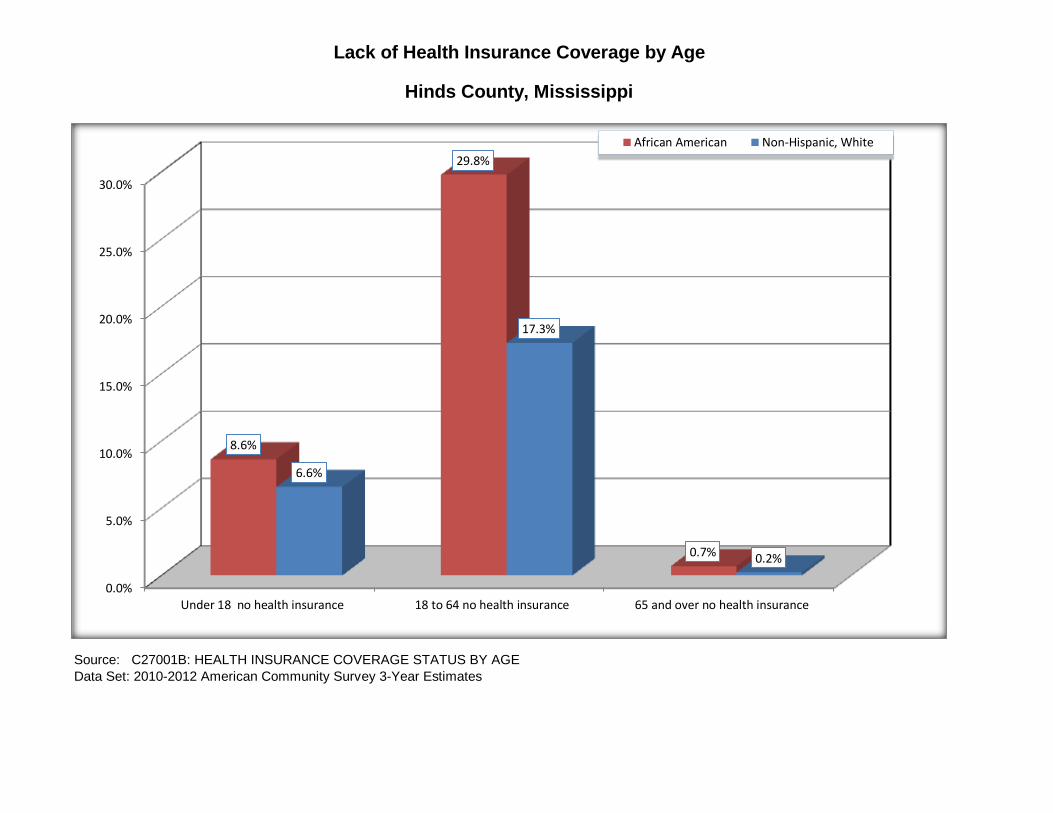
C27001B: HEALTH INSURANCE COVERAGE STATUS BY AGE
Hinds County, Mississippi
For information on confidentiality protection, sampling error, nonsampling error, and definitions, see Survey Methodology.
Source: C27001B: HEALTH INSURANCE COVERAGE STATUS BY AGE
Data Set: 2010-2012 American Community Survey 3-Year Estimates
Hinds County, Mississippi
Lack of Health Insurance Coverage by Age
0.0%
5.0%
10.0%
15.0%
20.0%
25.0%
30.0%
Under 18 no health insurance 18 to 64 no health insurance 65 and over no health insurance
8.6%
29.8%
0.7%
6.6%
17.3%
0.2%
African American Non-Hispanic, White