seismic performance of silty soil sites - sacramento...
TRANSCRIPT
Seismic Performance of Silty Soil Sites
Jonathan Bray, Ph.D., P.E., NAE, & Christine Beyzaei, Ph.D., P.E.Univ. of California, Berkeley
With Contributions From: M. Cubrinovski, M. Riemer, C. Markham, J. Zupan, M. Stringer,
S. van Ballegooy, M. Jacka, R. Wentz, etc.
Sponsors: National Science Foundation, Pacific Earthquake Engineering Research Center,Ministry of Business, Innovation & Employment, and Earthquake Commission New Zealand
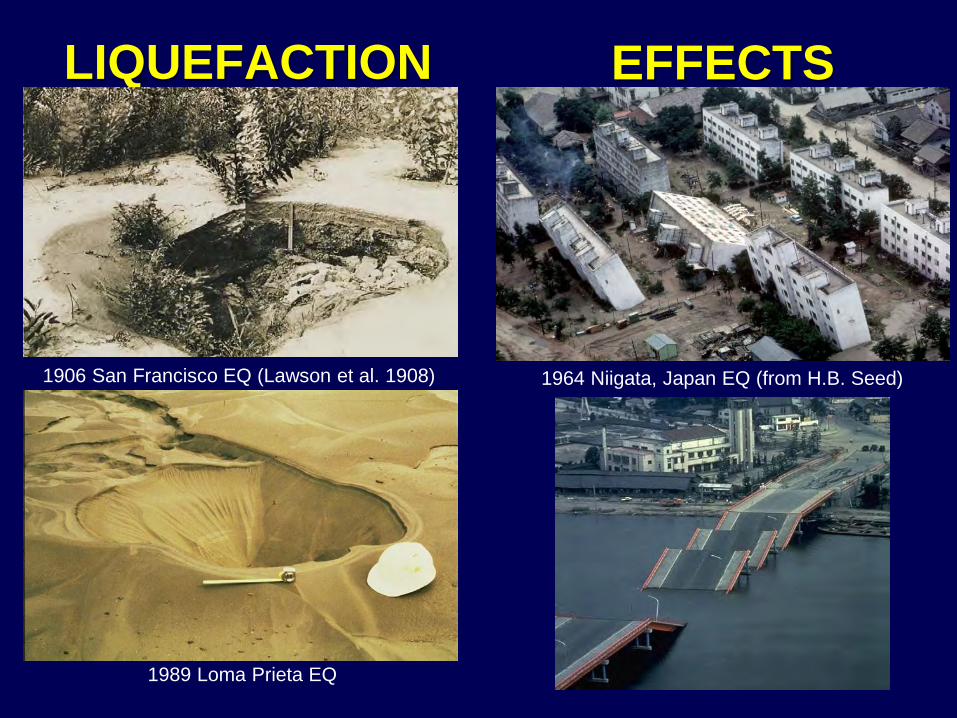
LIQUEFACTION
1964 Niigata, Japan EQ (from H.B. Seed)1906 San Francisco EQ (Lawson et al. 1908)
1989 Loma Prieta EQ
EFFECTS
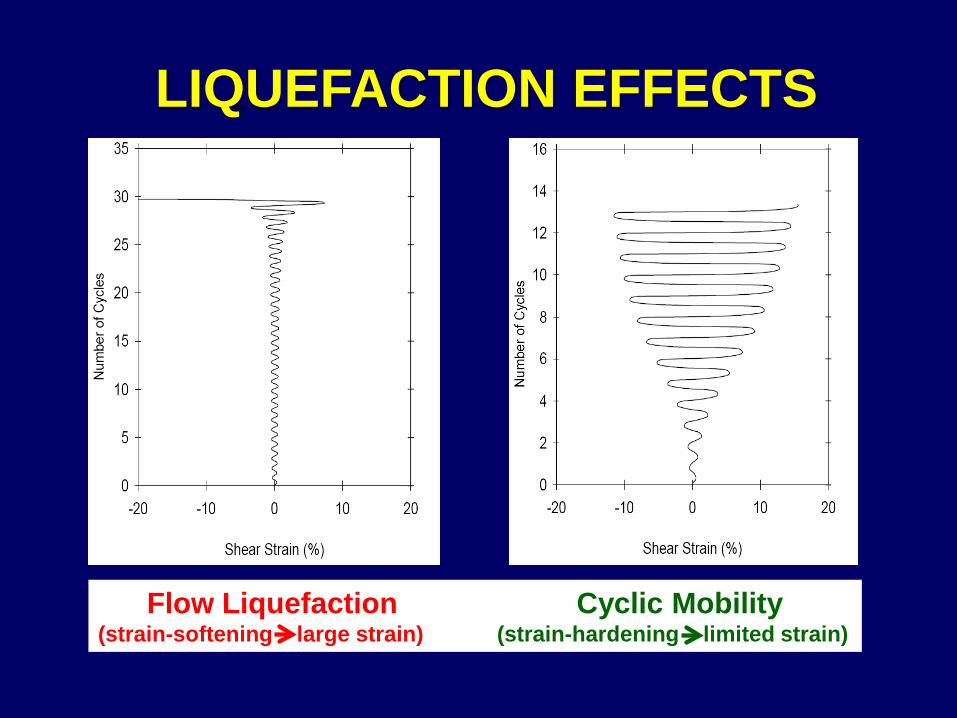
LIQUEFACTION EFFECTS
Flow Liquefaction Cyclic Mobility(strain-softening large strain) (strain-hardening limited strain)
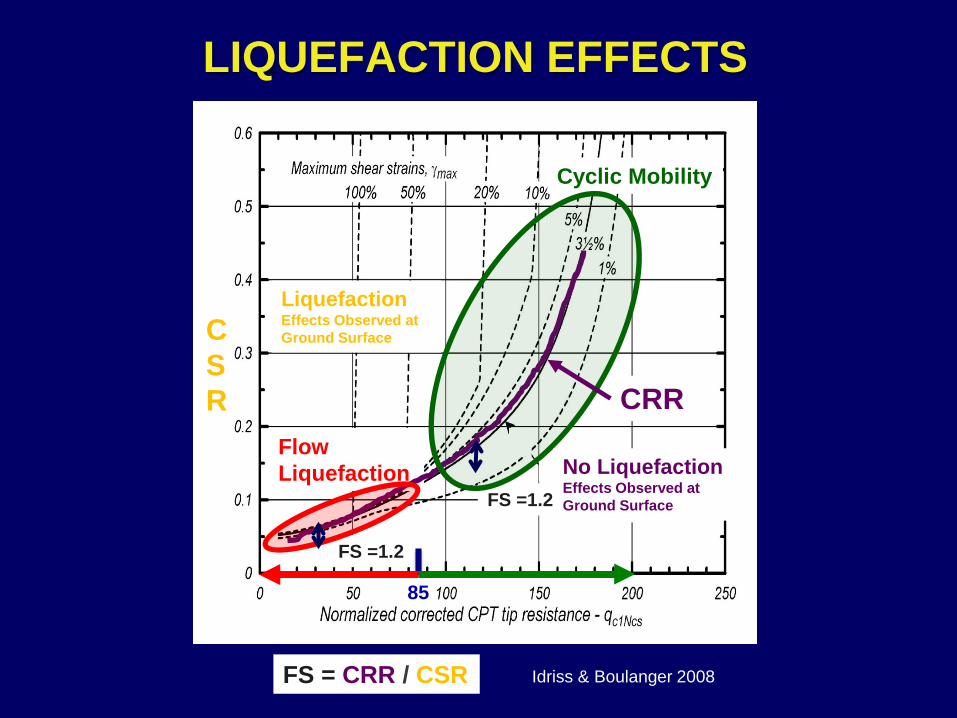
FS =1.2
FS =1.2
LIQUEFACTION EFFECTS
Idriss & Boulanger 2008
Flow Liquefaction
Cyclic Mobility
85
LiquefactionEffects Observed at Ground Surface
No LiquefactionEffects Observed at Ground Surface
FS = CRR / CSR
CRR
CSR
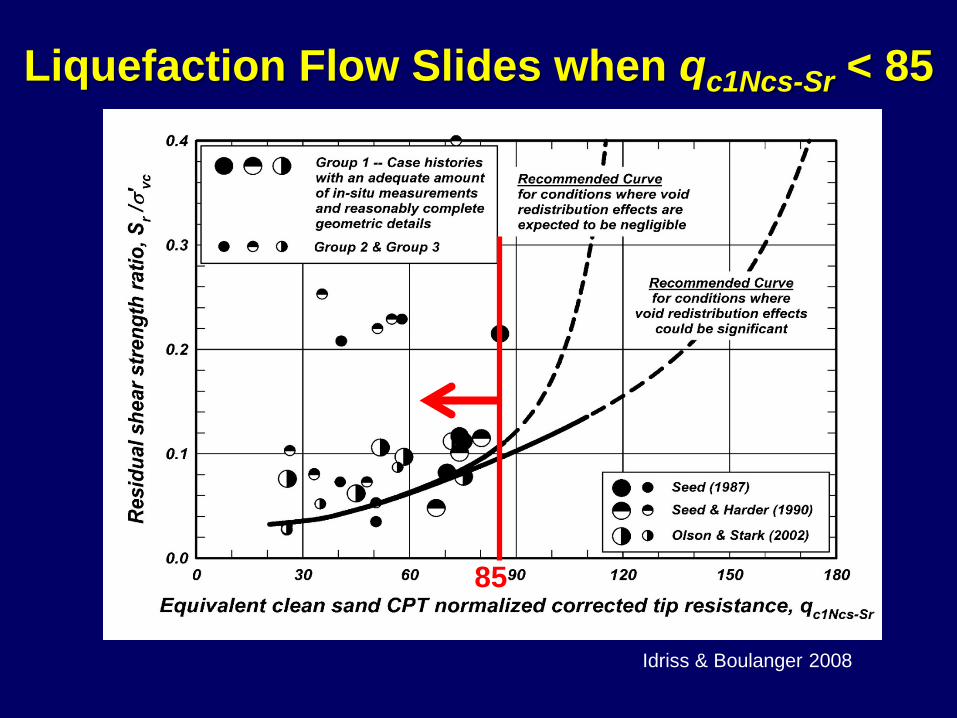
Liquefaction Flow Slides when qc1Ncs-Sr < 85
Idriss & Boulanger 2008
85
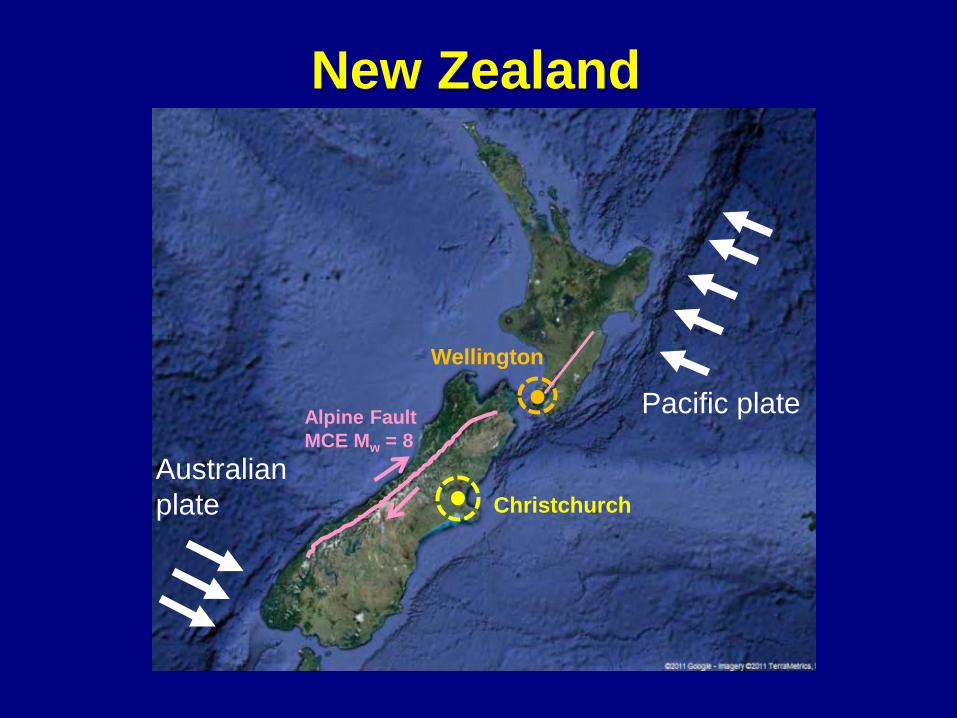
New Zealand
Pacific plate
Australianplate
Alpine FaultMCE Mw = 8
Christchurch
Wellington
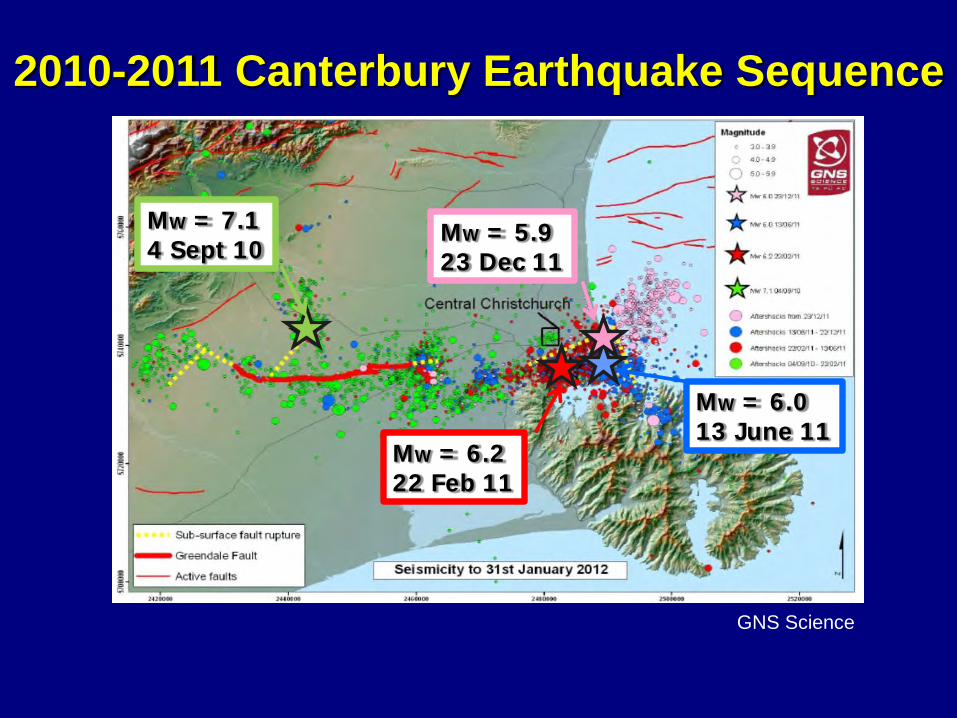
MW = 7.14 Sept 10
MW = 6.013 June 11
MW = 6.222 Feb 11
MW = 5.923 Dec 11
2010-2011 Canterbury Earthquake Sequence
GNS Science
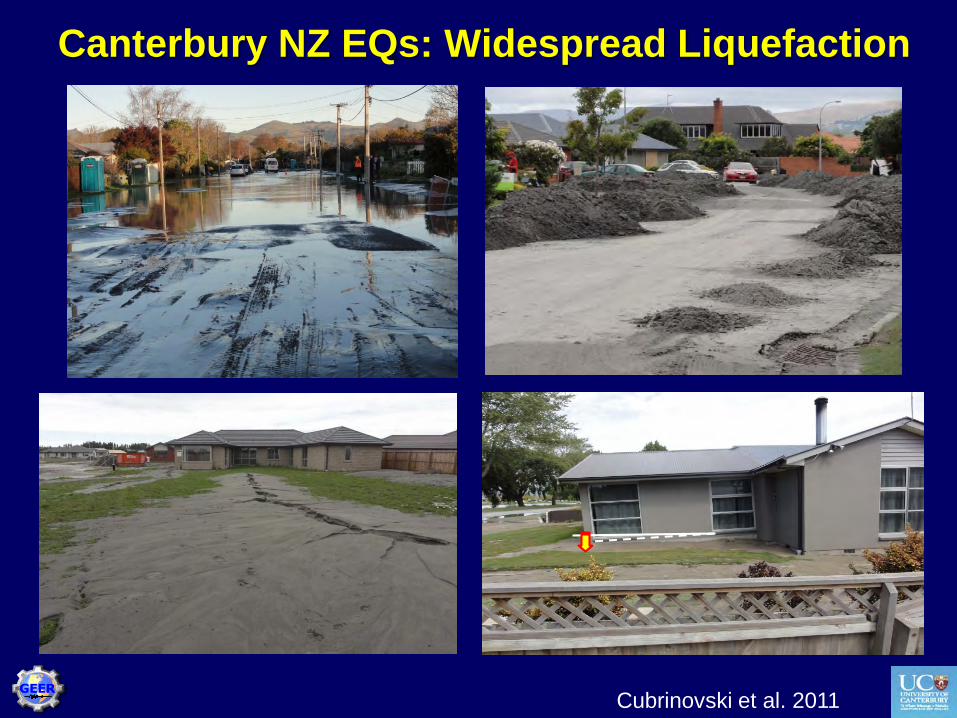
Canterbury NZ EQs: Widespread Liquefaction
Cubrinovski et al. 2011
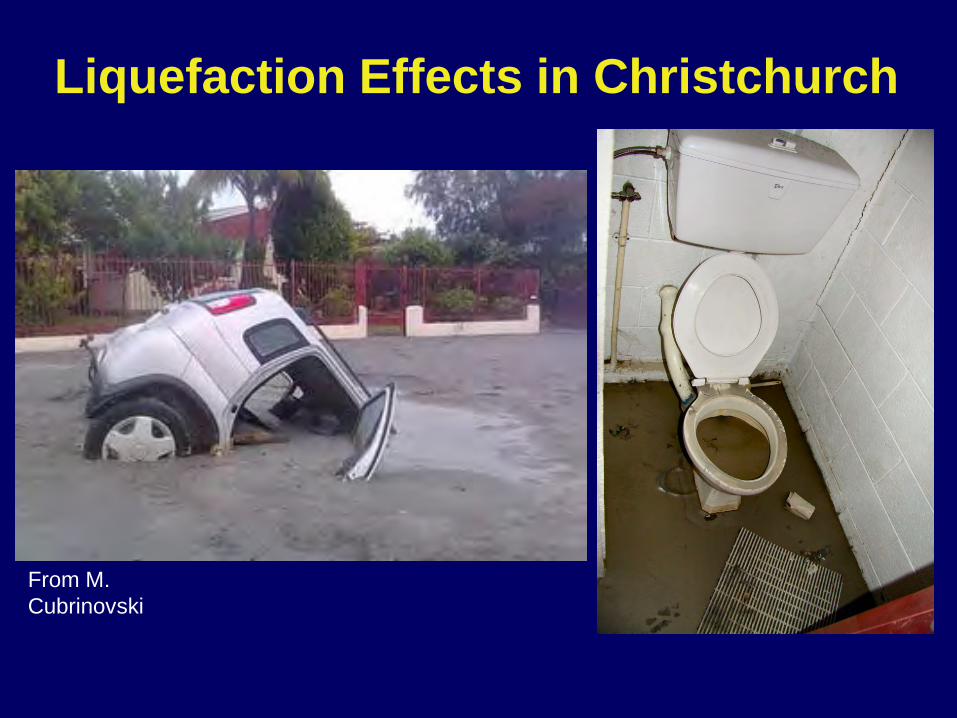
Liquefaction Effects in Christchurch
From M. Cubrinovski
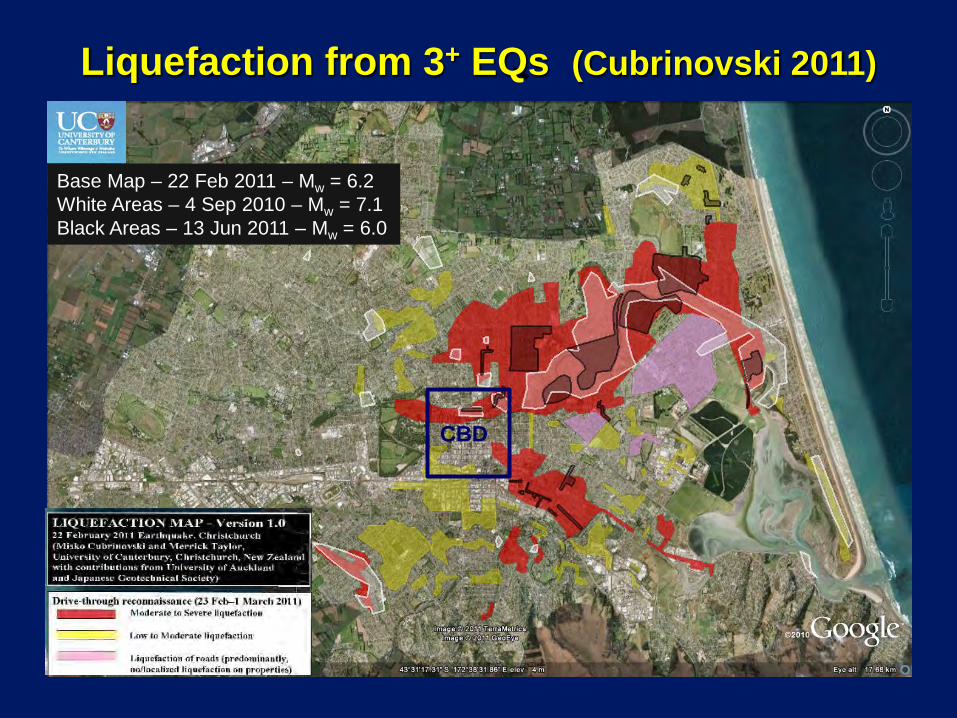
Liquefaction from 3+ EQs (Cubrinovski 2011)
Base Map – 22 Feb 2011 – Mw = 6.2White Areas – 4 Sep 2010 – Mw = 7.1Black Areas – 13 Jun 2011 – Mw = 6.0
CBD
4 Sept 2010
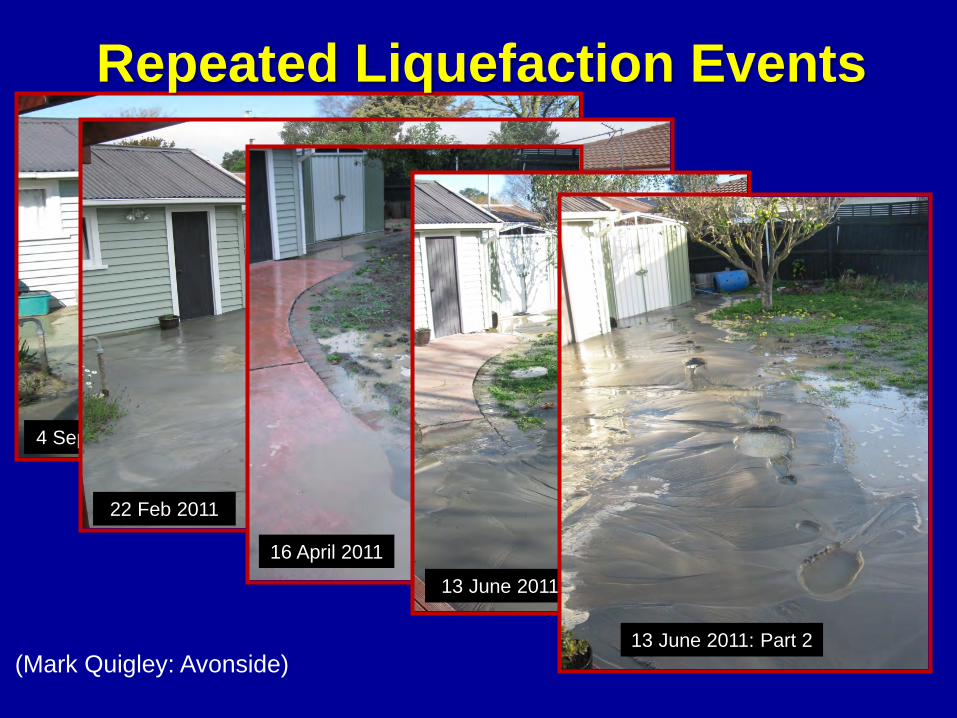
(Mark Quigley: Avonside)
22 Feb 2011
16 April 2011
13 June 2011: Part 1
13 June 2011: Part 2
Repeated Liquefaction Events
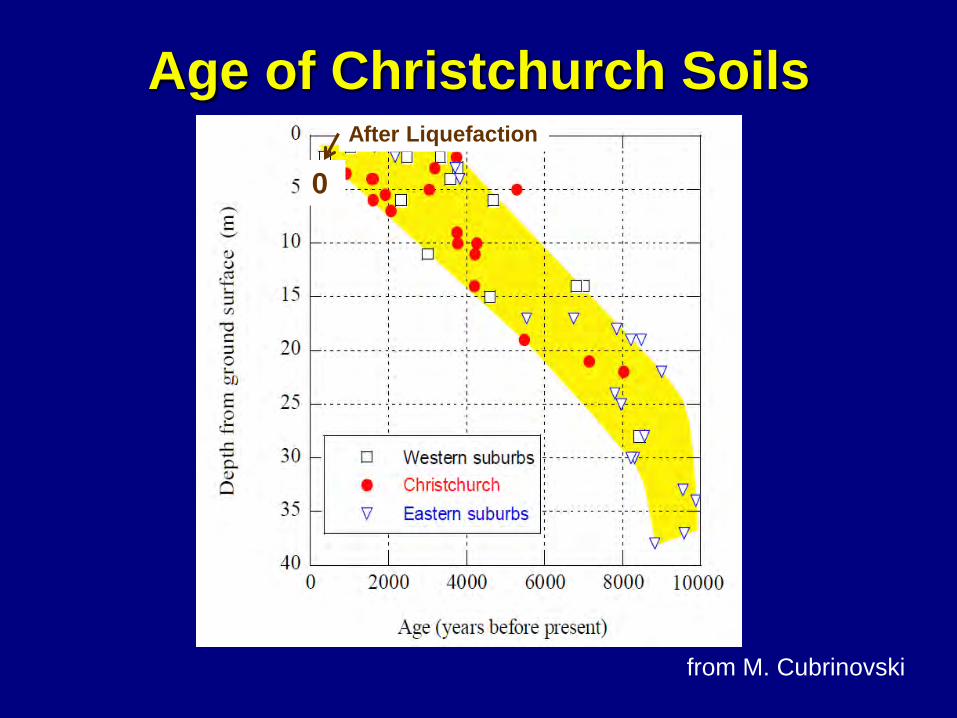
Age of Christchurch Soils
from M. Cubrinovski
After Liquefaction
0
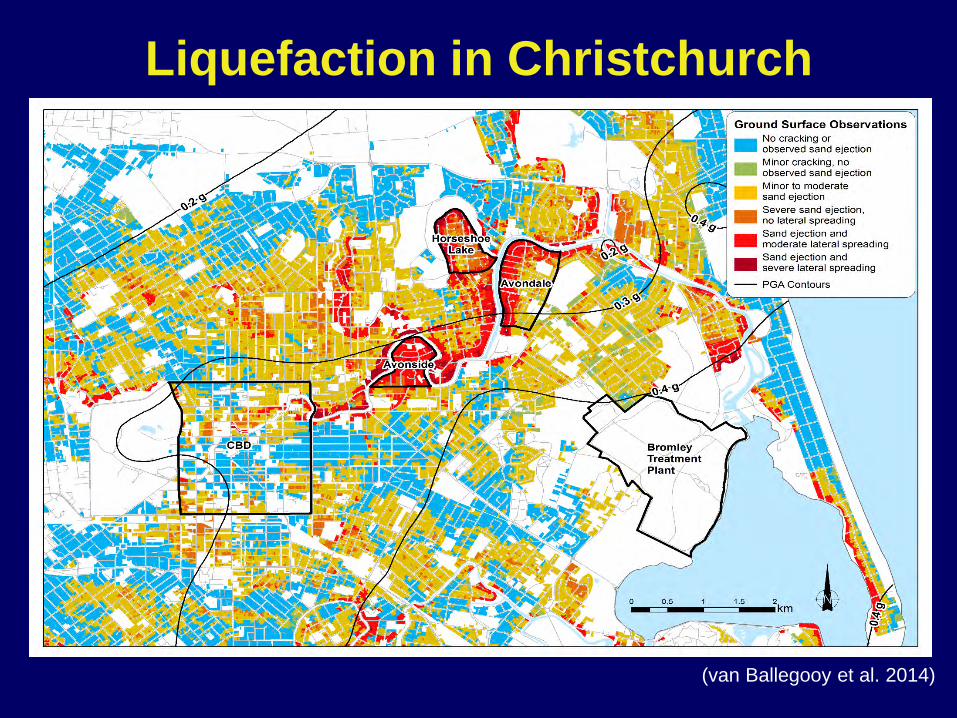
Liquefaction in Christchurch
(van Ballegooy et al. 2014)
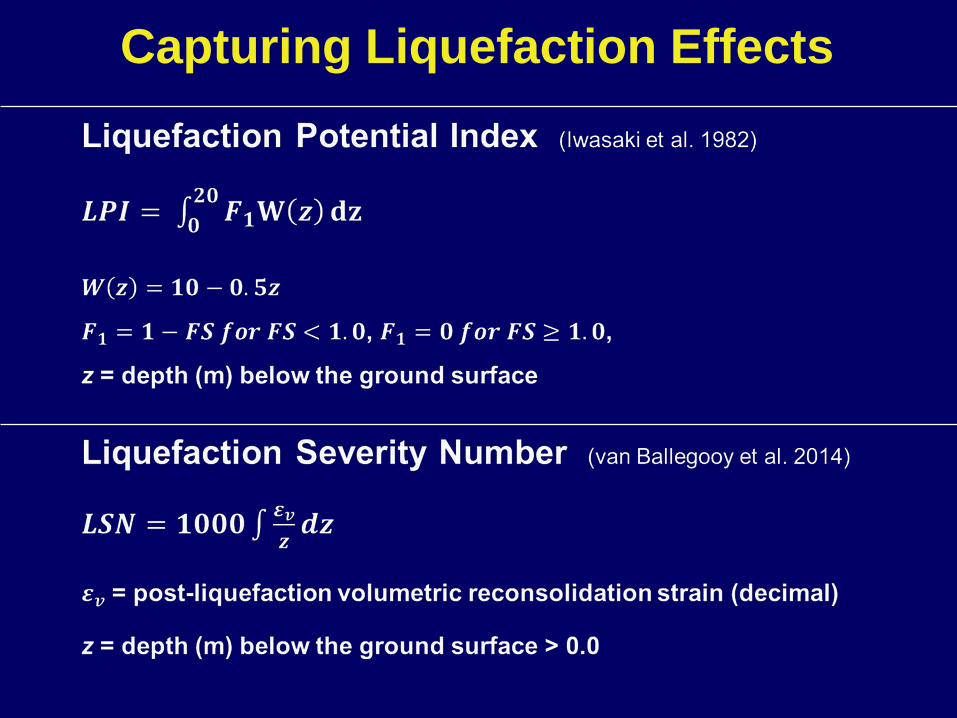
Capturing Liquefaction Effects
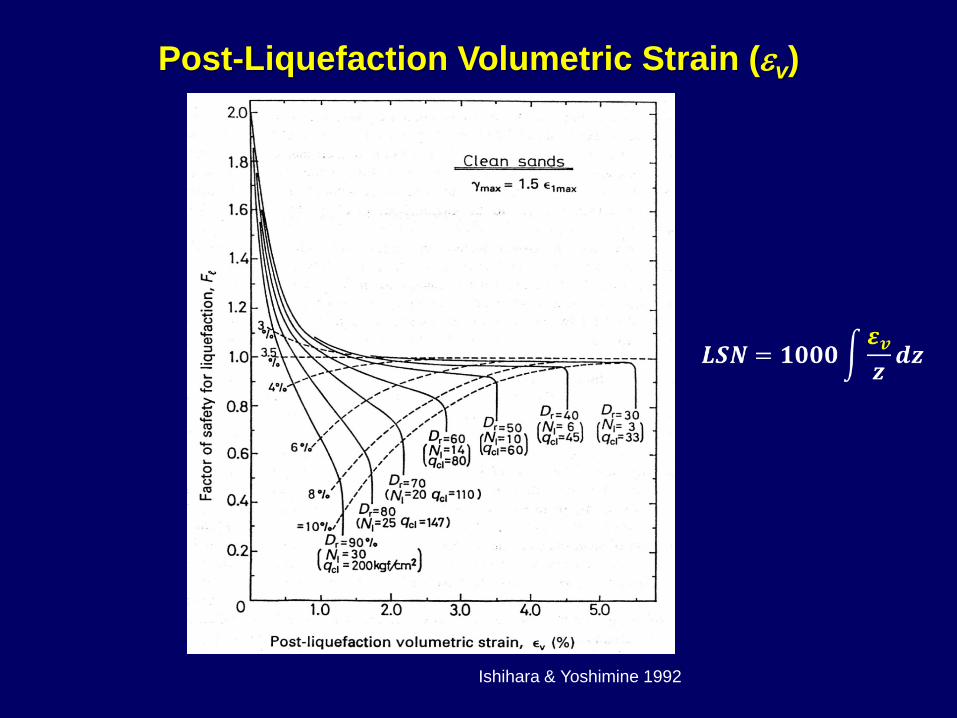
Post-Liquefaction Volumetric Strain (εv)
Ishihara & Yoshimine 1992
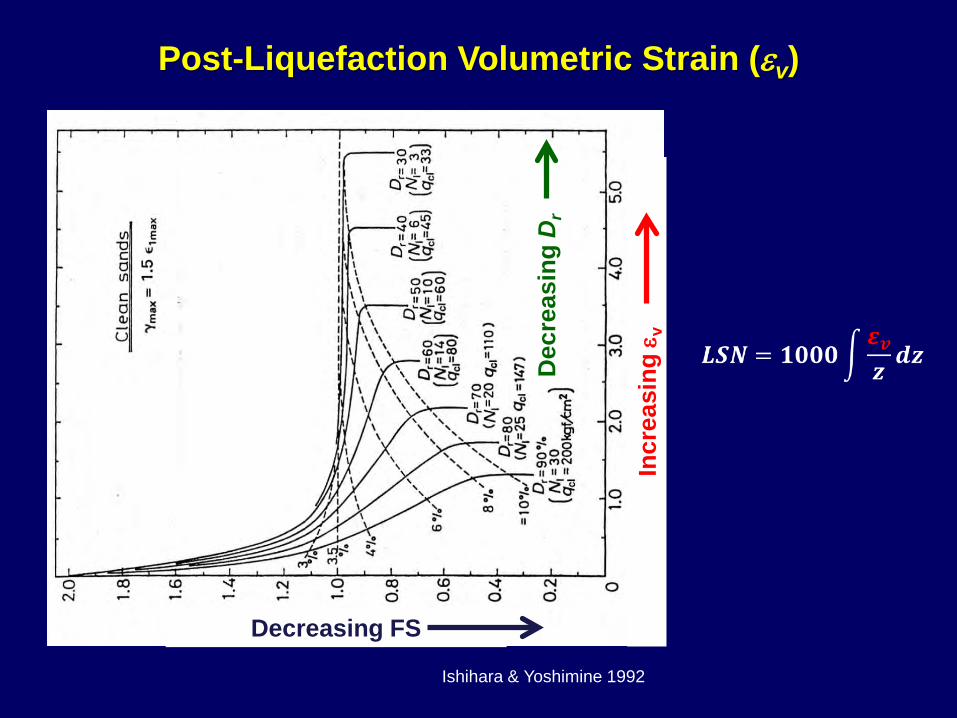
Post-Liquefaction Volumetric Strain (εv)
Ishihara & Yoshimine 1992
Decreasing FS In
crea
sing
ε v
Dec
reas
ing
Dr
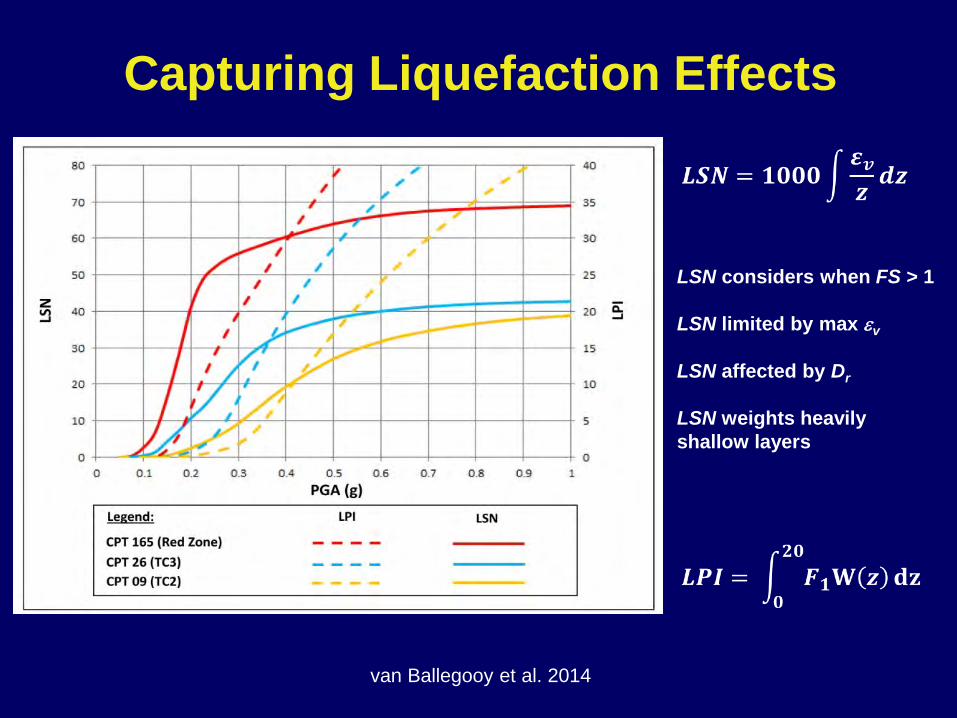
Capturing Liquefaction Effects
van Ballegooy et al. 2014
LSN considers when FS > 1
LSN limited by max εv
LSN affected by Dr
LSN weights heavily shallow layers
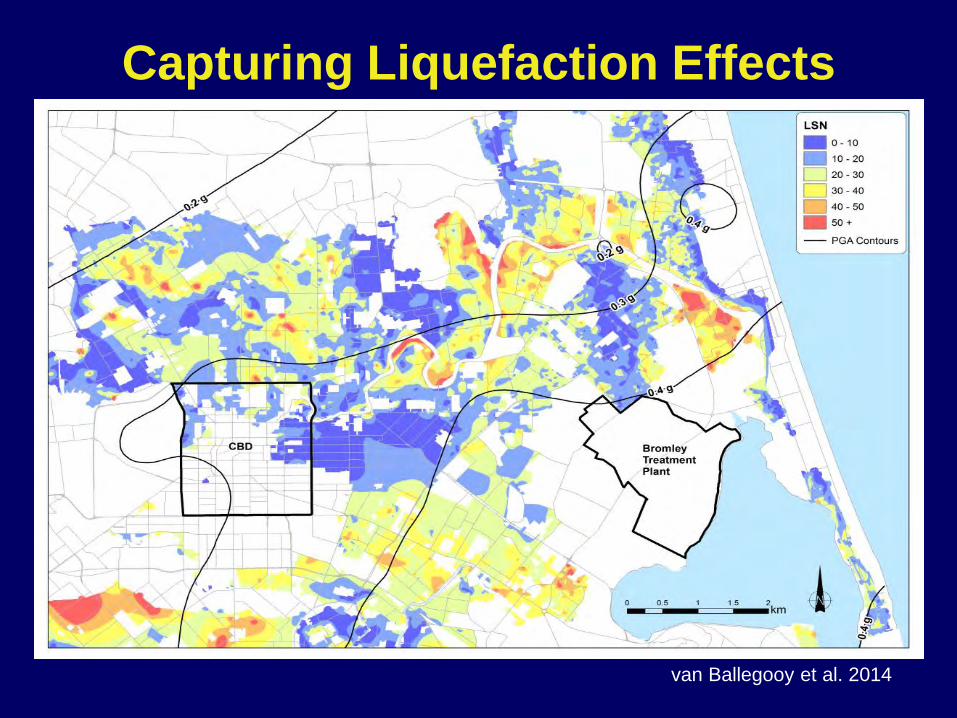
Capturing Liquefaction Effects
van Ballegooy et al. 2014

Liquefaction in Christchurch
(van Ballegooy et al. 2014)
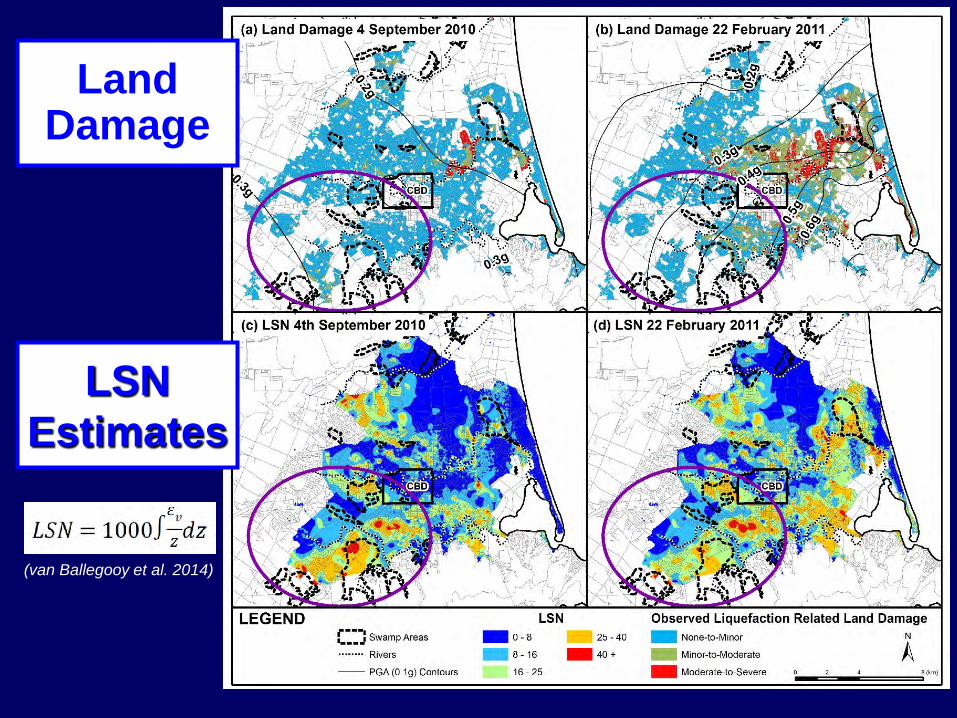
LSNEstimates
LandDamage
(van Ballegooy et al. 2014)
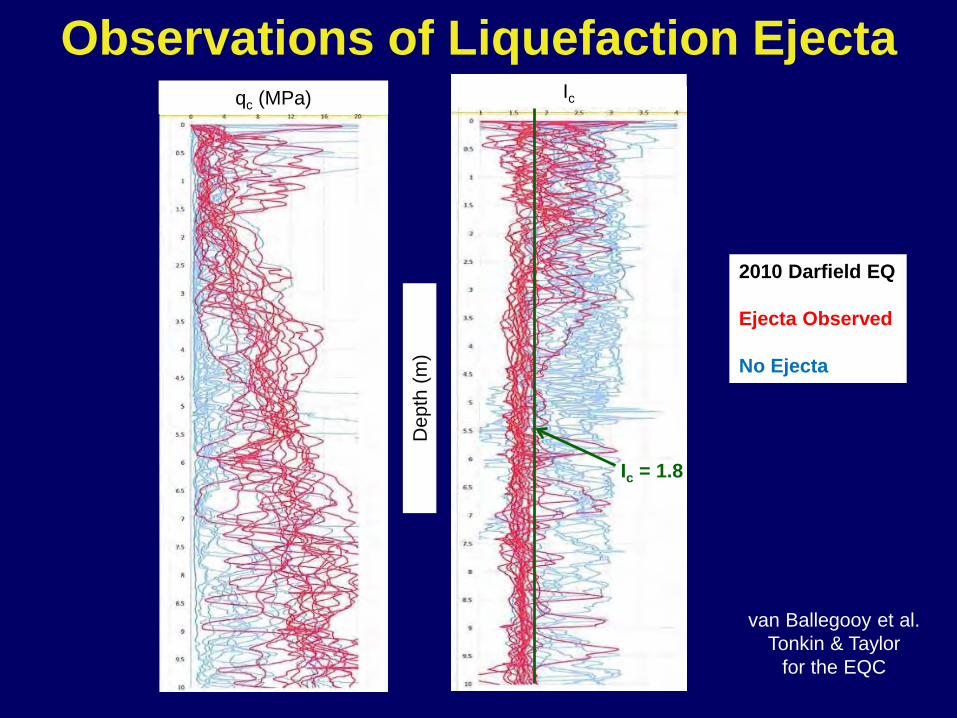
2010 Darfield EQ
Ejecta Observed
No Ejecta
van Ballegooy et al.Tonkin & Taylor
for the EQC
Ic = 1.8
qc (MPa) Ic
Dep
th (m
)
Observations of Liquefaction Ejecta
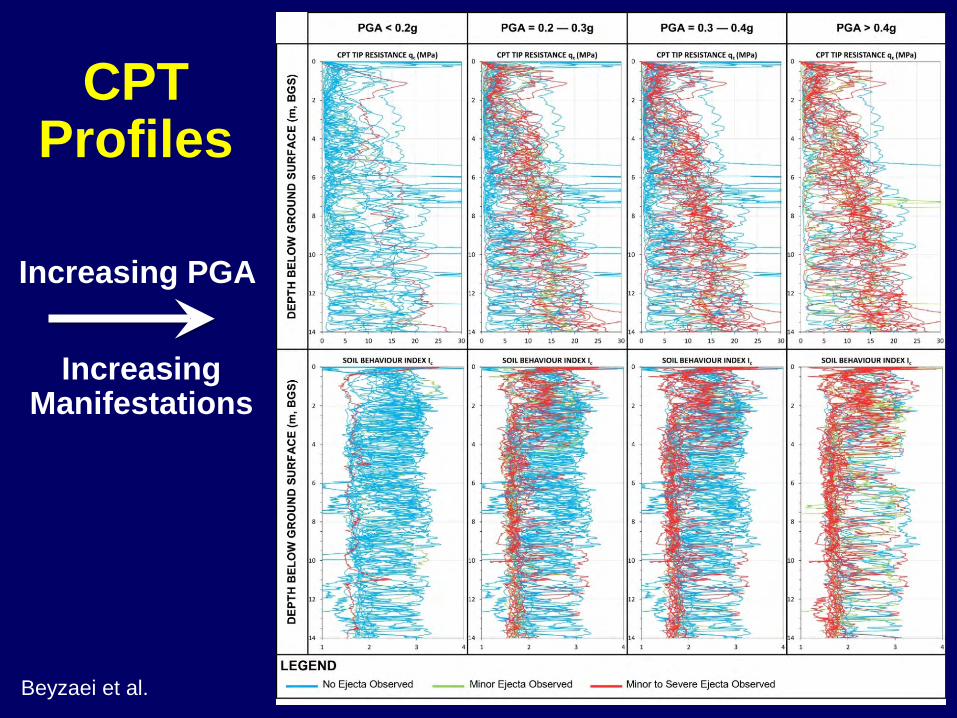
CPTProfiles
Increasing PGA
Increasing Manifestations
Beyzaei et al.
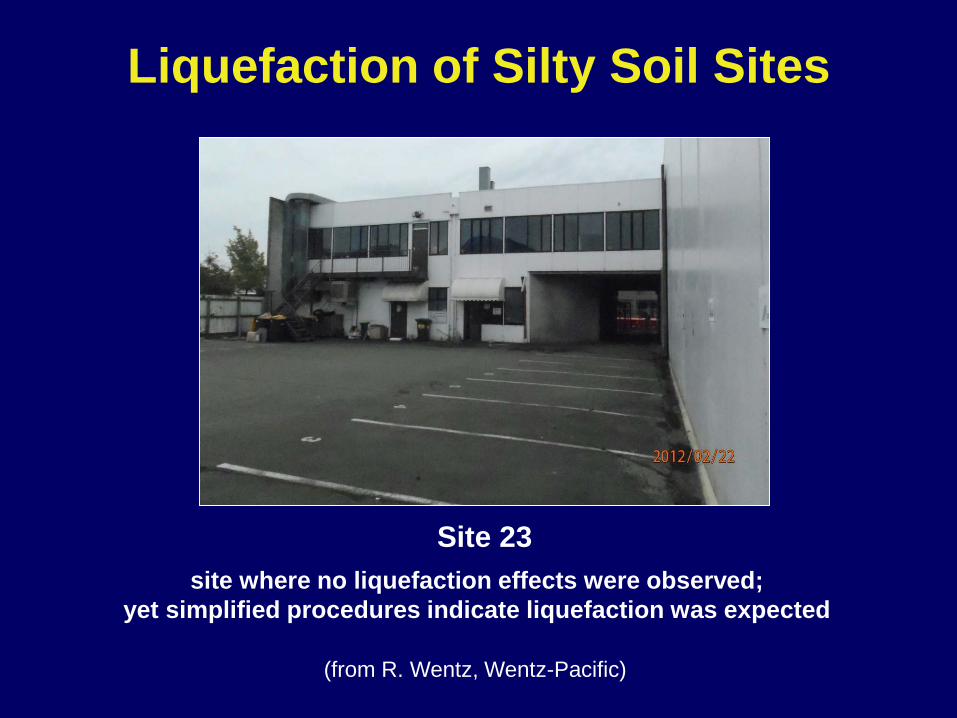
Liquefaction of Silty Soil Sites
site where no liquefaction effects were observed;yet simplified procedures indicate liquefaction was expected
(from R. Wentz, Wentz-Pacific)
Site 23
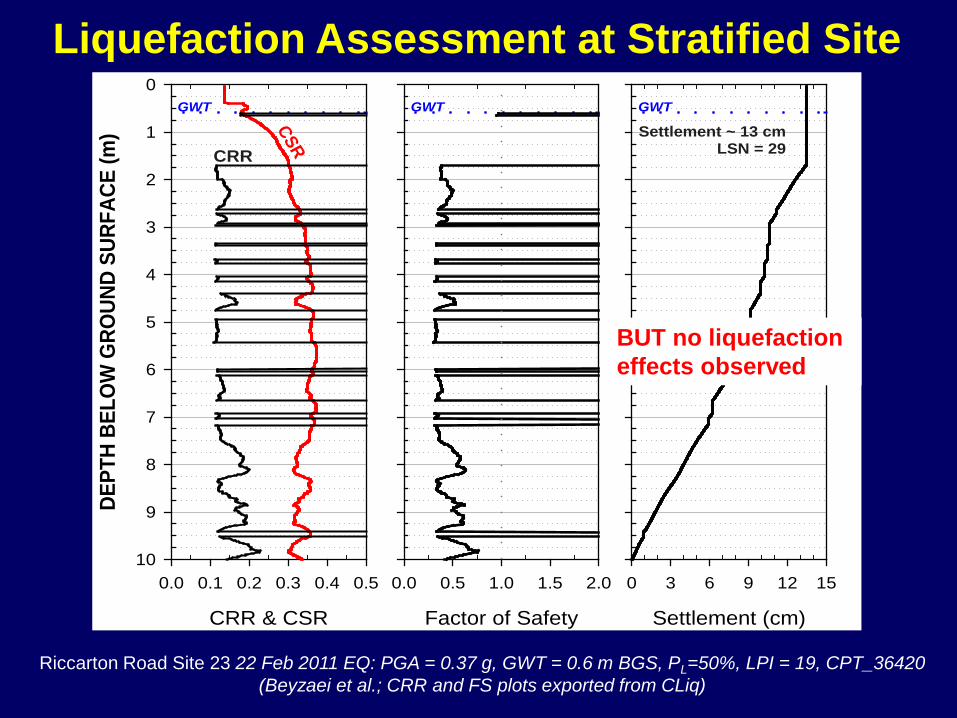
Liquefaction Assessment at Stratified Site
Riccarton Road Site 23 22 Feb 2011 EQ: PGA = 0.37 g, GWT = 0.6 m BGS, PL=50%, LPI = 19, CPT_36420 (Beyzaei et al.; CRR and FS plots exported from CLiq)
CRR & CSR
0.0 0.1 0.2 0.3 0.4 0.5
DEPT
H BE
LOW
GRO
UND
SURF
ACE
(m)
0
1
2
3
4
5
6
7
8
9
10
Factor of Safety
0.0 0.5 1.0 1.5 2.0
Settlement (cm)
0 3 6 9 12 15
GWT GWT GWT
CRR
CSR
Settlement ~ 13 cmLSN = 29
BUT no liquefaction effects observed
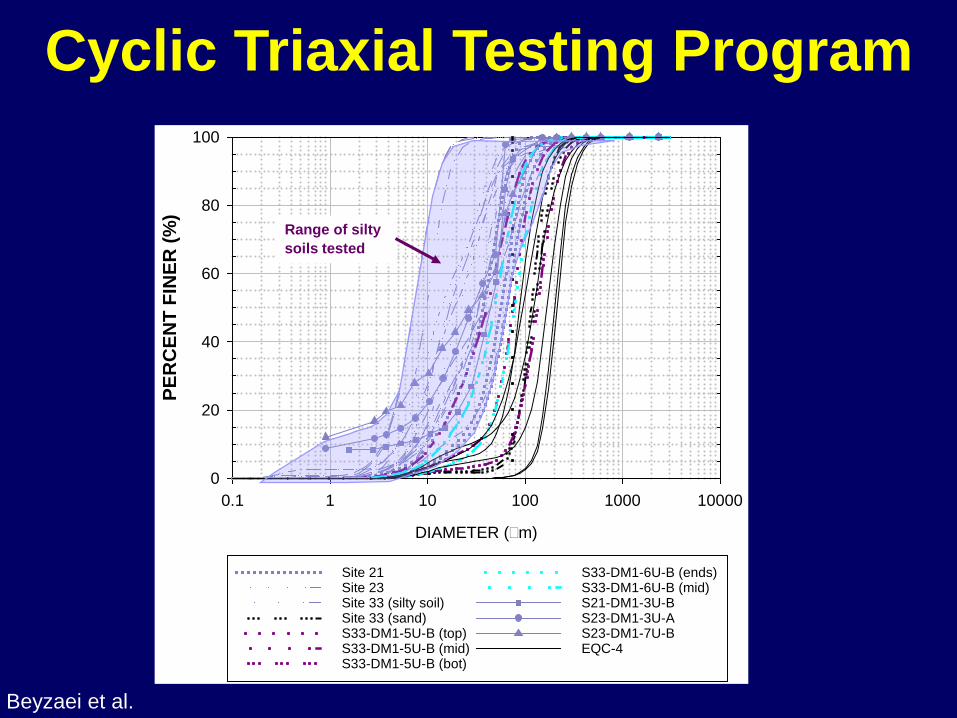
Cyclic Triaxial Testing Program
DIAMETER (m)
0.1 1 10 100 1000 10000
PER
CEN
T FI
NER
(%)
0
20
40
60
80
100
Site 21Site 23Site 33 (silty soil)Site 33 (sand)S33-DM1-5U-B (top)S33-DM1-5U-B (mid)S33-DM1-5U-B (bot)
S33-DM1-6U-B (ends)S33-DM1-6U-B (mid)S21-DM1-3U-BS23-DM1-3U-AS23-DM1-7U-BEQC-4
Range of silty soils tested
Beyzaei et al.
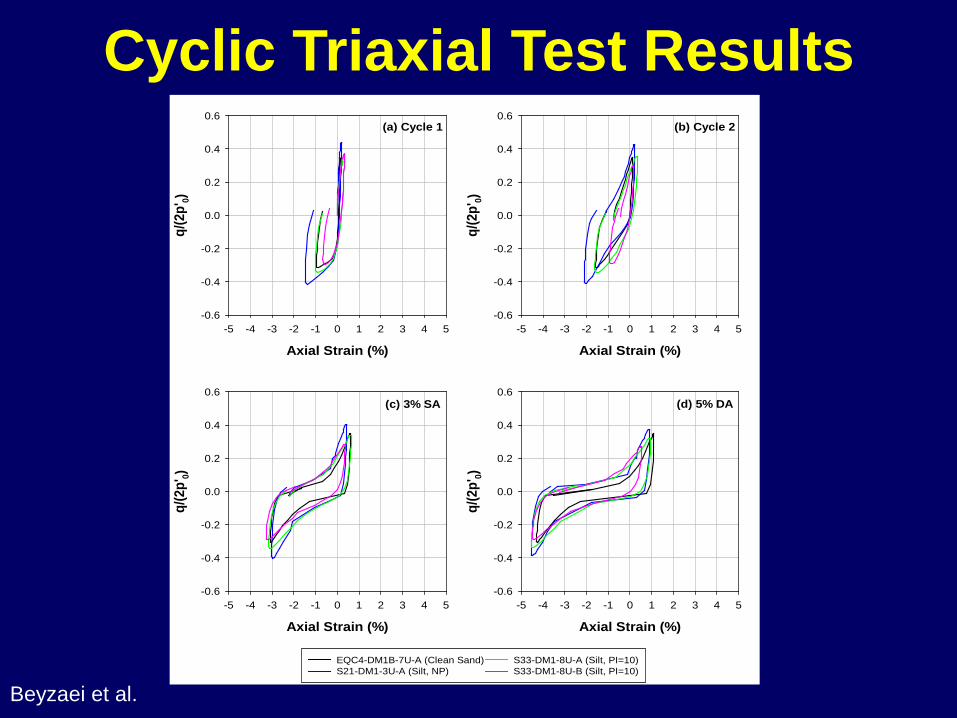
Cyclic Triaxial Test Results
Axial Strain (%)-5 -4 -3 -2 -1 0 1 2 3 4 5
q/(2
p'0)
-0.6
-0.4
-0.2
0.0
0.2
0.4
0.6
Axial Strain (%)-5 -4 -3 -2 -1 0 1 2 3 4 5
q/(2
p'0)
-0.6
-0.4
-0.2
0.0
0.2
0.4
0.6(a) Cycle 1 (b) Cycle 2
Axial Strain (%)-5 -4 -3 -2 -1 0 1 2 3 4 5
q/(2
p'0)
-0.6
-0.4
-0.2
0.0
0.2
0.4
0.6
Axial Strain (%)-5 -4 -3 -2 -1 0 1 2 3 4 5
q/(2
p'0)
-0.6
-0.4
-0.2
0.0
0.2
0.4
0.6
EQC4-DM1B-7U-A (Clean Sand)S21-DM1-3U-A (Silt, NP)
S33-DM1-8U-A (Silt, PI=10)S33-DM1-8U-B (Silt, PI=10)
(c) 3% SA (d) 5% DA
Beyzaei et al.
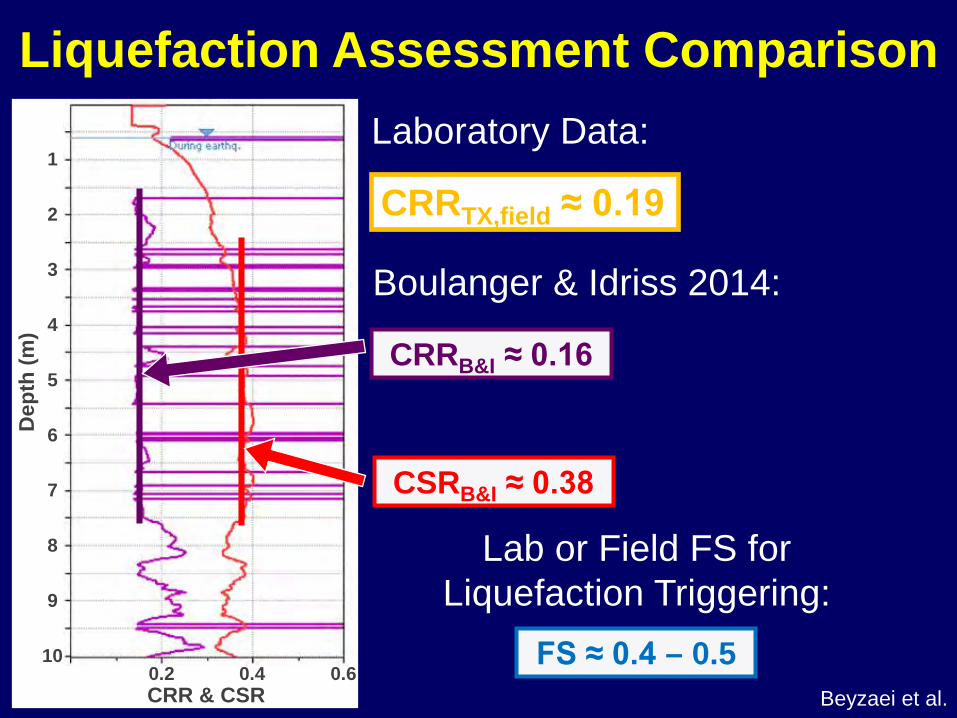
Liquefaction Assessment ComparisonLaboratory Data:
Boulanger & Idriss 2014:
CRRTX,field ≈ 0.19
CRRB&I ≈ 0.16
CSRB&I ≈ 0.38
Dep
th (m
)
6
1
7
2
8
3
9
4
10
5
CRR & CSR0.2 0.4 0.6
FS ≈ 0.4 – 0.5
Lab or Field FS for Liquefaction Triggering:
Beyzaei et al.
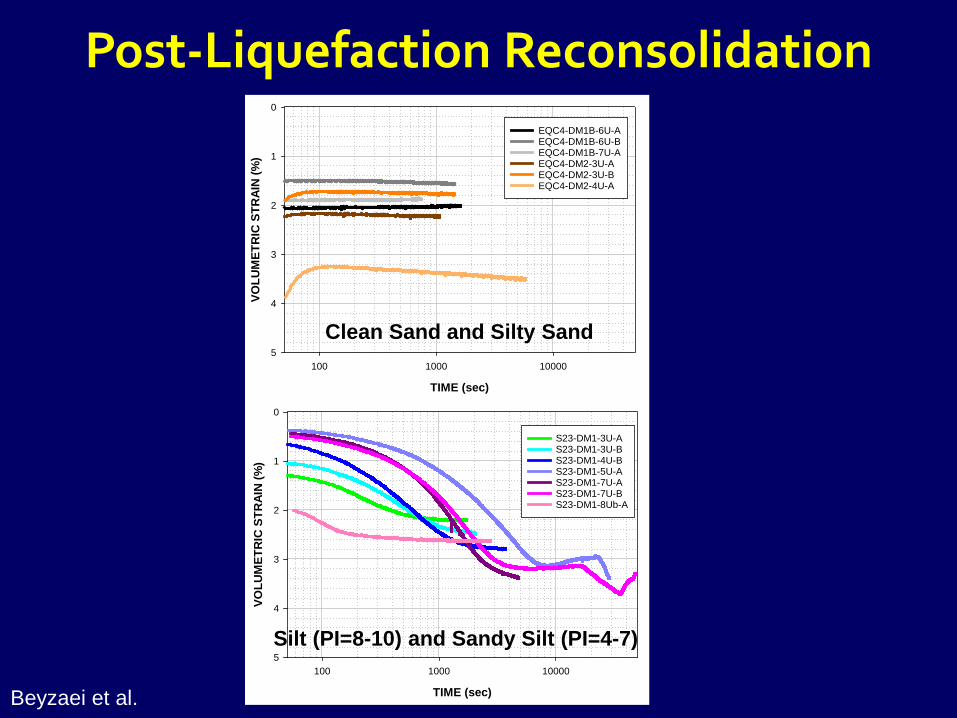
Post-Liquefaction Reconsolidation
TIME (sec)
100 1000 10000
VOLU
MET
RIC
STRA
IN (%
)
0
1
2
3
4
5
EQC4-DM1B-6U-AEQC4-DM1B-6U-BEQC4-DM1B-7U-AEQC4-DM2-3U-AEQC4-DM2-3U-BEQC4-DM2-4U-A
TIME (sec)
100 1000 10000
VOLU
MET
RIC
STRA
IN (%
)
0
1
2
3
4
5
S23-DM1-3U-AS23-DM1-3U-BS23-DM1-4U-BS23-DM1-5U-AS23-DM1-7U-AS23-DM1-7U-BS23-DM1-8Ub-A
Beyzaei et al.
Clean Sand and Silty Sand
Silt (PI=8-10) and Sandy Silt (PI=4-7)
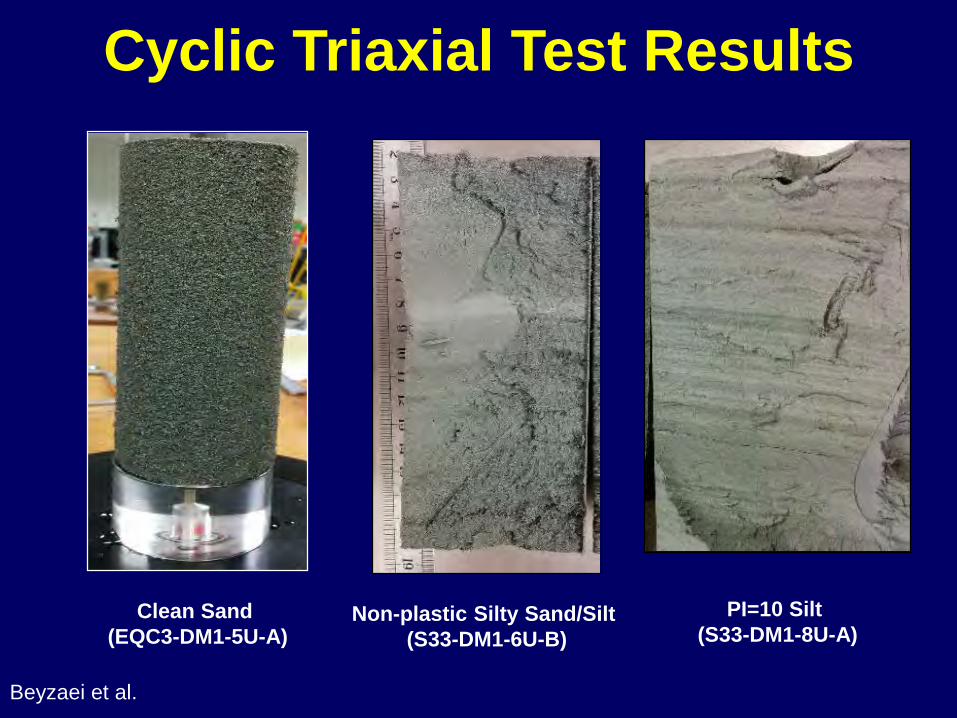
Cyclic Triaxial Test Results
Clean Sand (EQC3-DM1-5U-A)
Non-plastic Silty Sand/Silt (S33-DM1-6U-B)
PI=10 Silt (S33-DM1-8U-A)
Beyzaei et al.
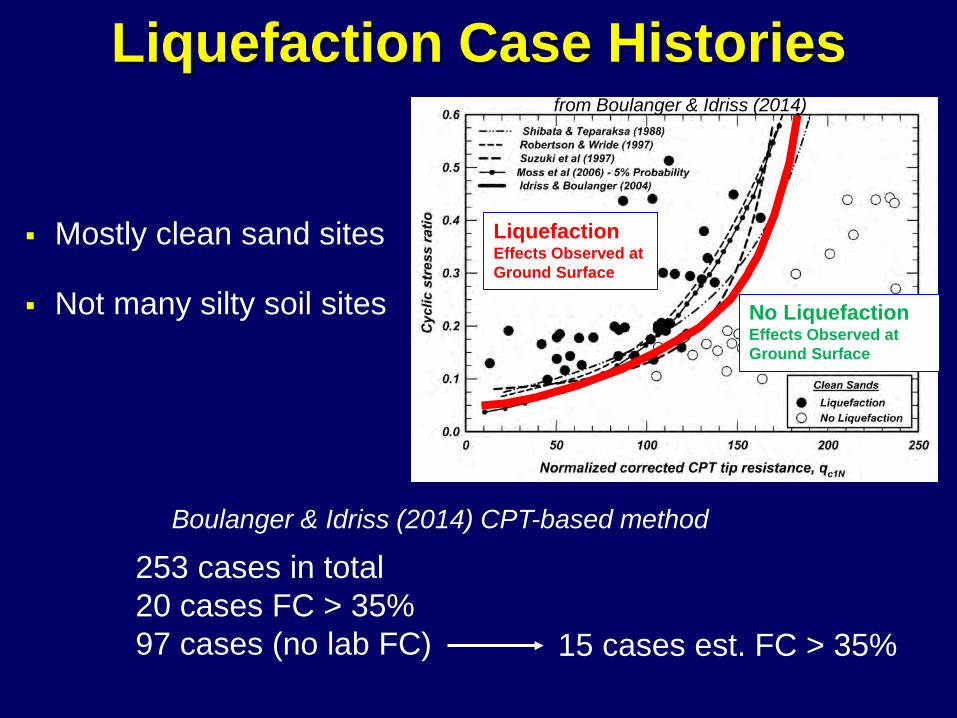
Liquefaction Case Histories
Mostly clean sand sites
Not many silty soil sites
253 cases in total20 cases FC > 35%97 cases (no lab FC)
LiquefactionEffects Observed at Ground Surface
No LiquefactionEffects Observed at Ground Surface
15 cases est. FC > 35%
Boulanger & Idriss (2014) CPT-based method
from Boulanger & Idriss (2014)
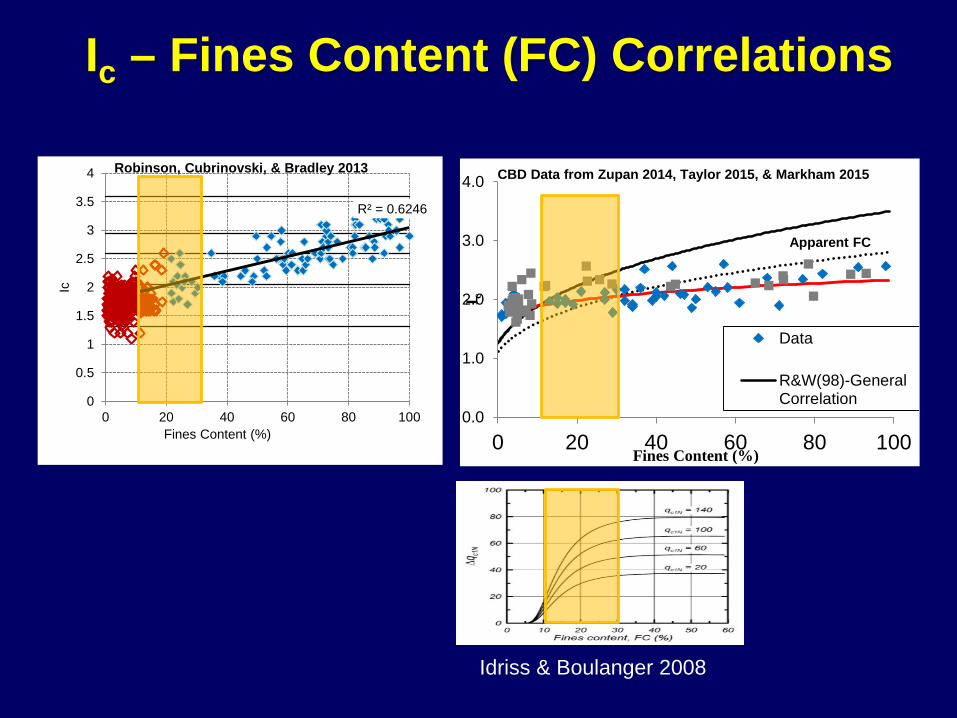
R² = 0.6246
0
0.5
1
1.5
2
2.5
3
3.5
4
0 20 40 60 80 100
Ic
Fines Content (%)0.0
1.0
2.0
3.0
4.0
0 20 40 60 80 100I c
Fines Content (%)
Data
R&W(98)-GeneralCorrelation
Ic – Fines Content (FC) Correlations
Robinson, Cubrinovski, & Bradley 2013 CBD Data from Zupan 2014, Taylor 2015, & Markham 2015
Apparent FC
Idriss & Boulanger 2008
FINES CONTENT (%)0 20 40 60 80 100
SOIL
BEH
AVI
OR
TYP
E IN
DEX
(Ic)
1.0
1.5
2.0
2.5
3.0
3.5
4.0
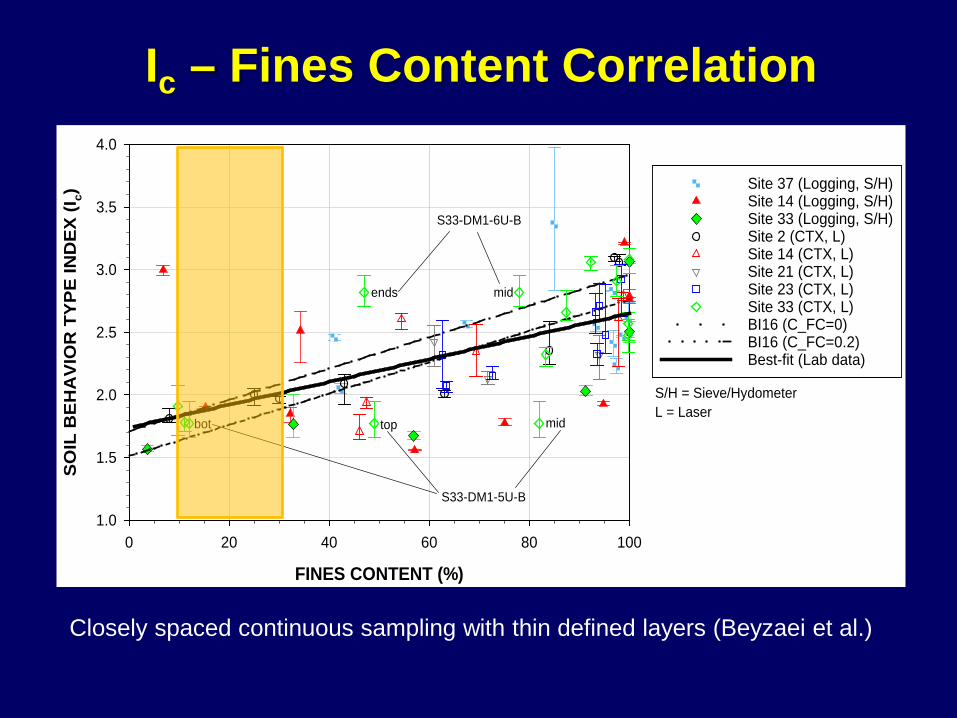
Site 37 (Logging, S/H)Site 14 (Logging, S/H)Site 33 (Logging, S/H)
BI16 (C_FC=0) BI16 (C_FC=0.2)
Site 2 (CTX, L)Site 14 (CTX, L)Site 21 (CTX, L)Site 23 (CTX, L)Site 33 (CTX, L)
Best-fit (Lab data)
S33-DM1-5U-B
S33-DM1-6U-B
ends mid
top midbot
S/H = Sieve/HydometerL = Laser
Ic – Fines Content Correlation
Closely spaced continuous sampling with thin defined layers (Beyzaei et al.)
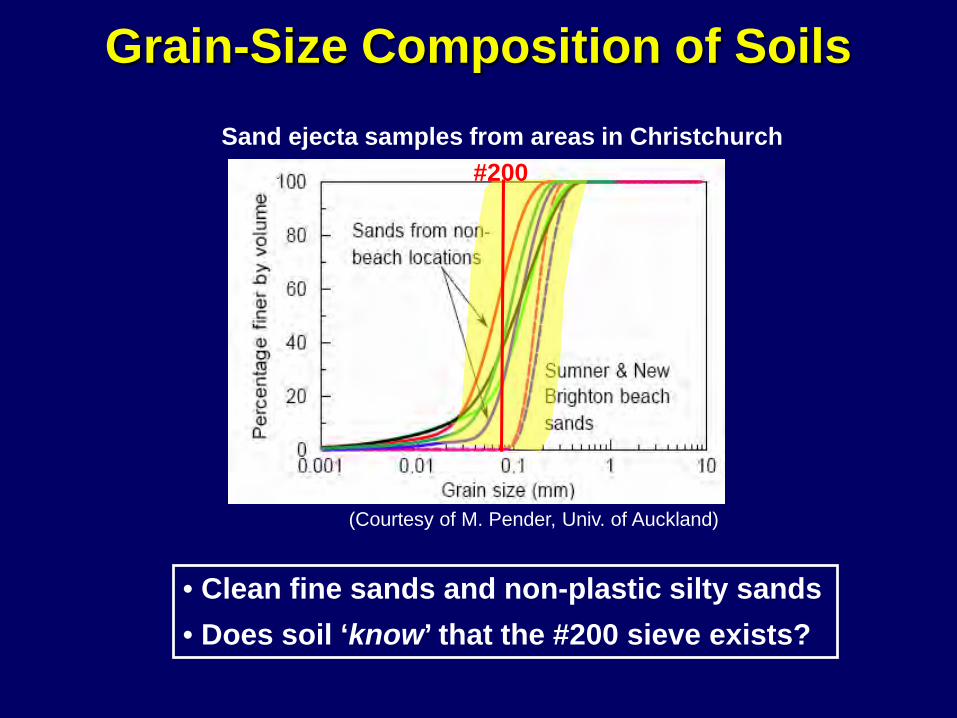
Grain-Size Composition of SoilsSand ejecta samples from areas in Christchurch
(Courtesy of M. Pender, Univ. of Auckland)
• Clean fine sands and non-plastic silty sands• Does soil ‘know’ that the #200 sieve exists?
#200
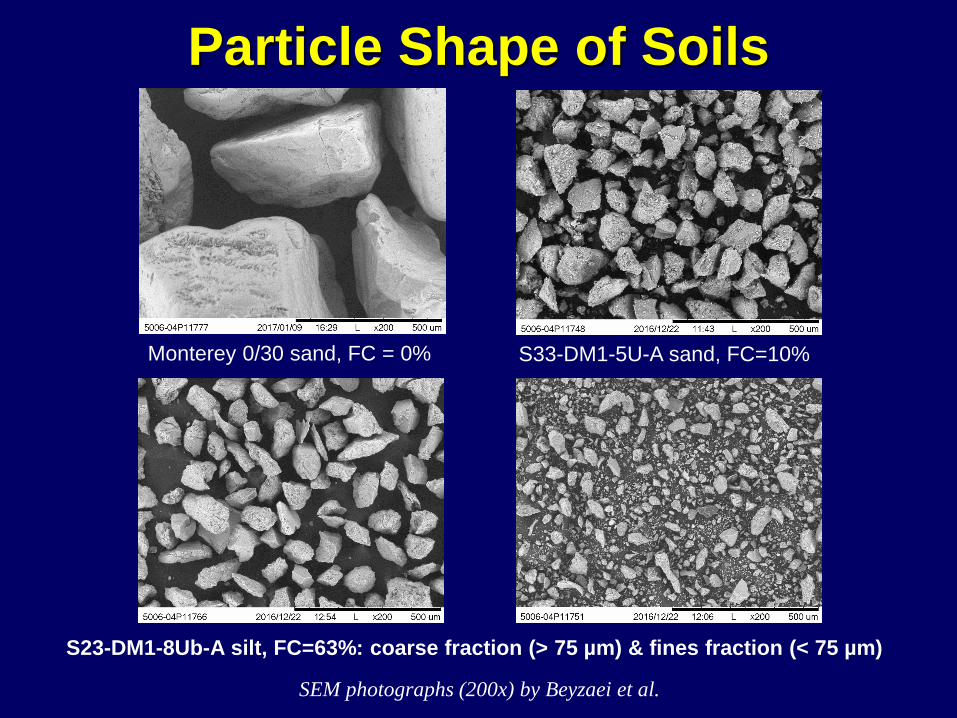
SEM photographs (200x) by Beyzaei et al.
Particle Shape of Soils
Monterey 0/30 sand, FC = 0% S33-DM1-5U-A sand, FC=10%
S23-DM1-8Ub-A silt, FC=63%: coarse fraction (> 75 µm) & fines fraction (< 75 µm)
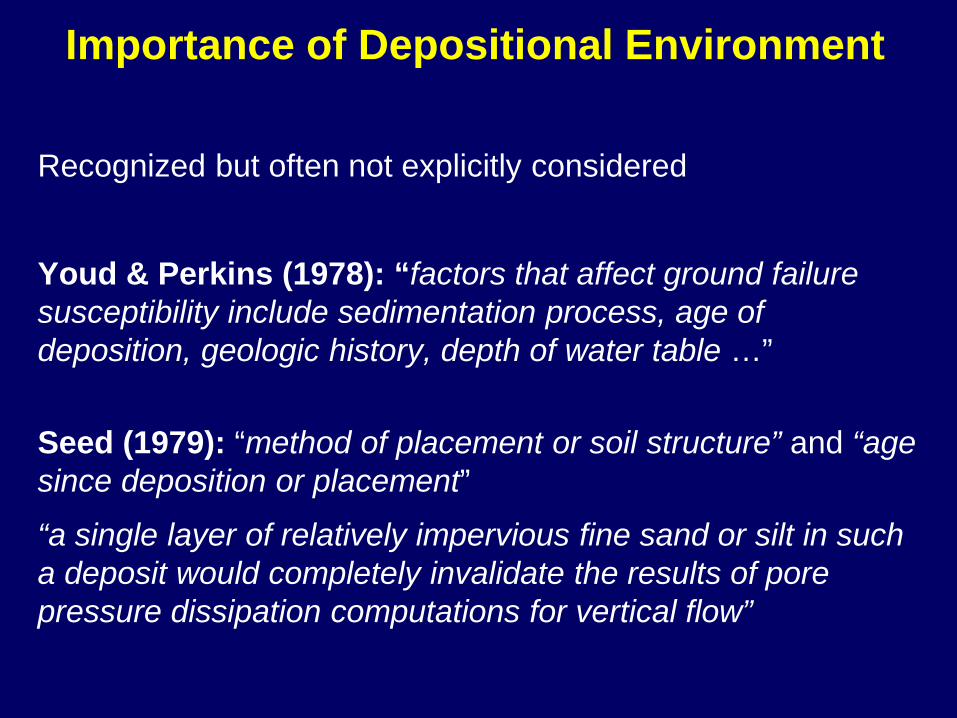
Importance of Depositional Environment
Recognized but often not explicitly considered
Youd & Perkins (1978): “factors that affect ground failure susceptibility include sedimentation process, age of deposition, geologic history, depth of water table …”
Seed (1979): “method of placement or soil structure” and “age since deposition or placement” “a single layer of relatively impervious fine sand or silt in such a deposit would completely invalidate the results of pore pressure dissipation computations for vertical flow”
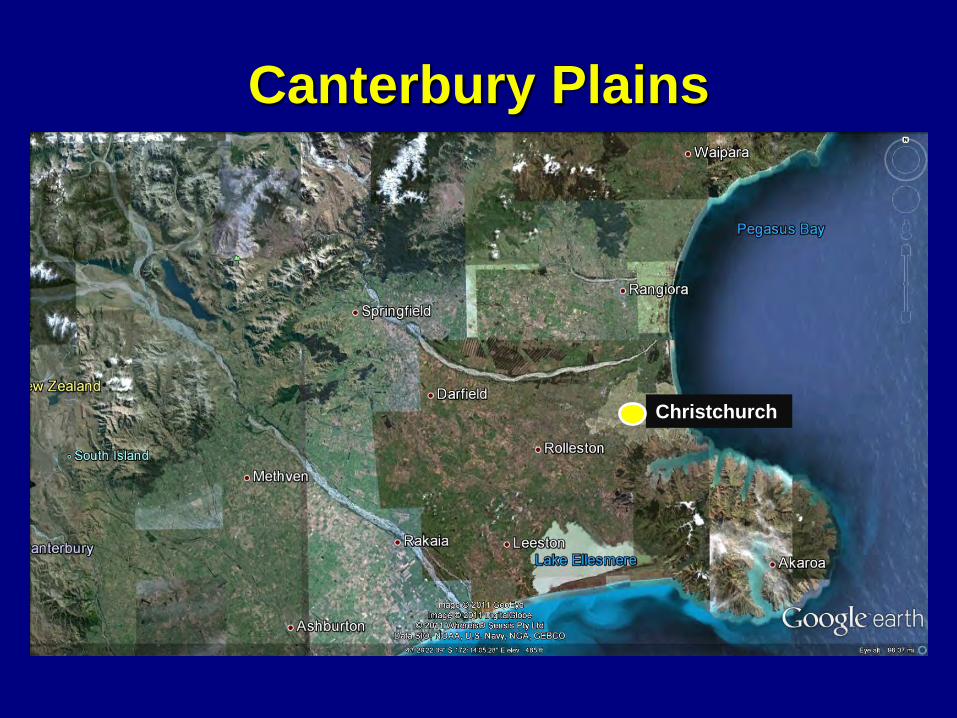
Canterbury Plains
Christchurch
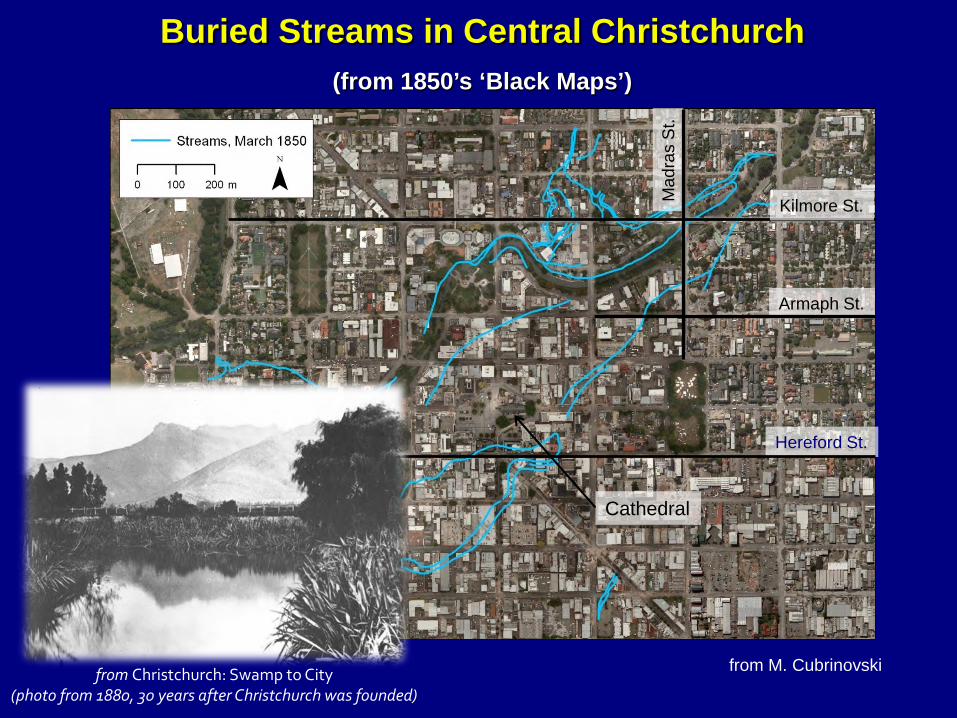
Buried Streams in Central Christchurch(from 1850’s ‘Black Maps’)
from M. Cubrinovski
Hereford St.
Armaph St.
Mad
ras
St.
Cathedral
Kilmore St.
from Christchurch: Swamp to City (photo from 1880, 30 years after Christchurch was founded)
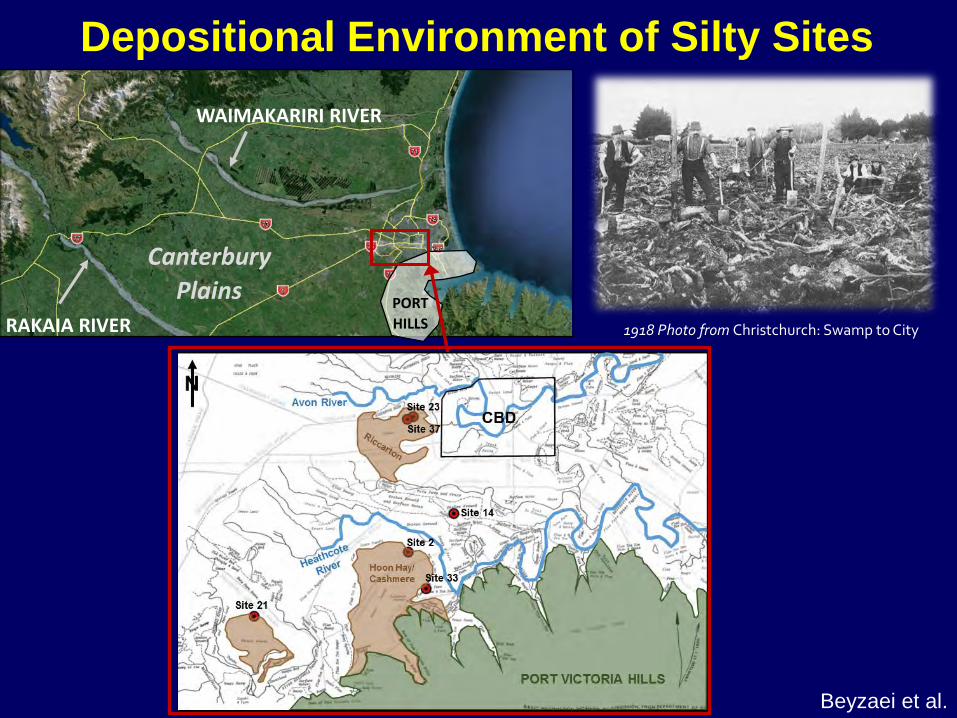
Depositional Environment of Silty Sites
RAKAIA RIVER
WAIMAKARIRI RIVER
PORT HILLS
Canterbury Plains
1918 Photo from Christchurch: Swamp to City
Beyzaei et al.
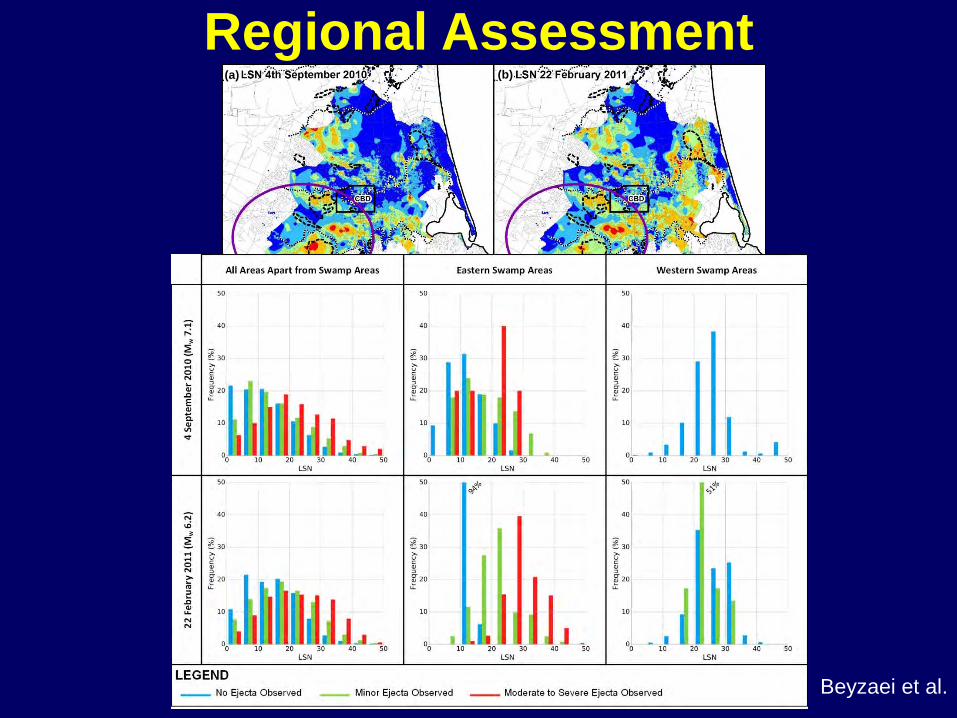
Regional Assessment(a) (b)
Beyzaei et al.
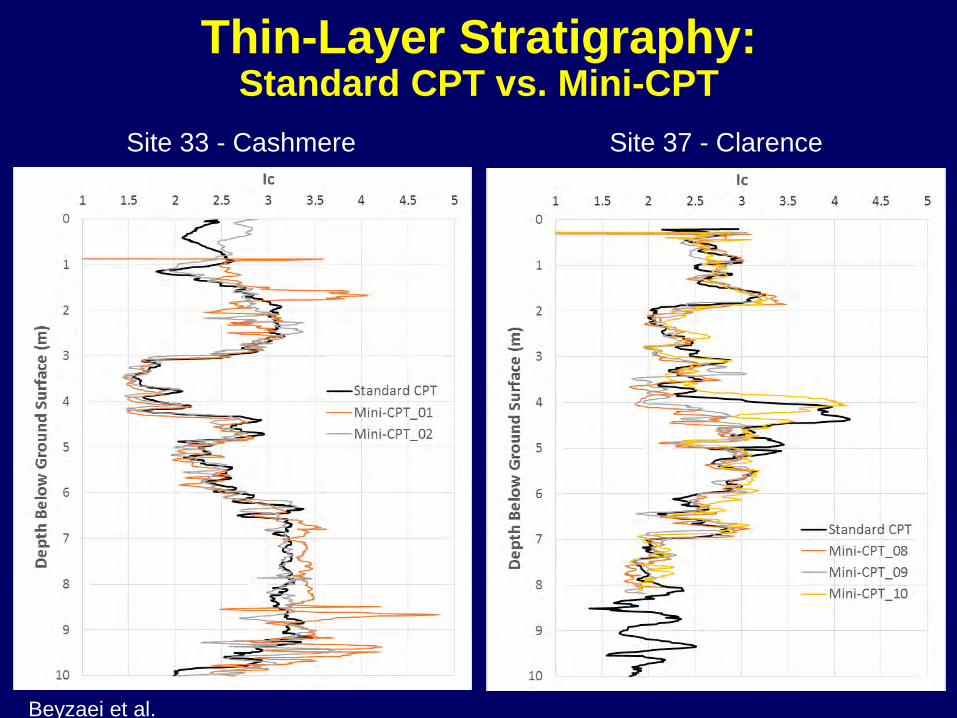
Thin-Layer Stratigraphy:Standard CPT vs. Mini-CPT
Site 33 - Cashmere Site 37 - Clarence
Beyzaei et al.
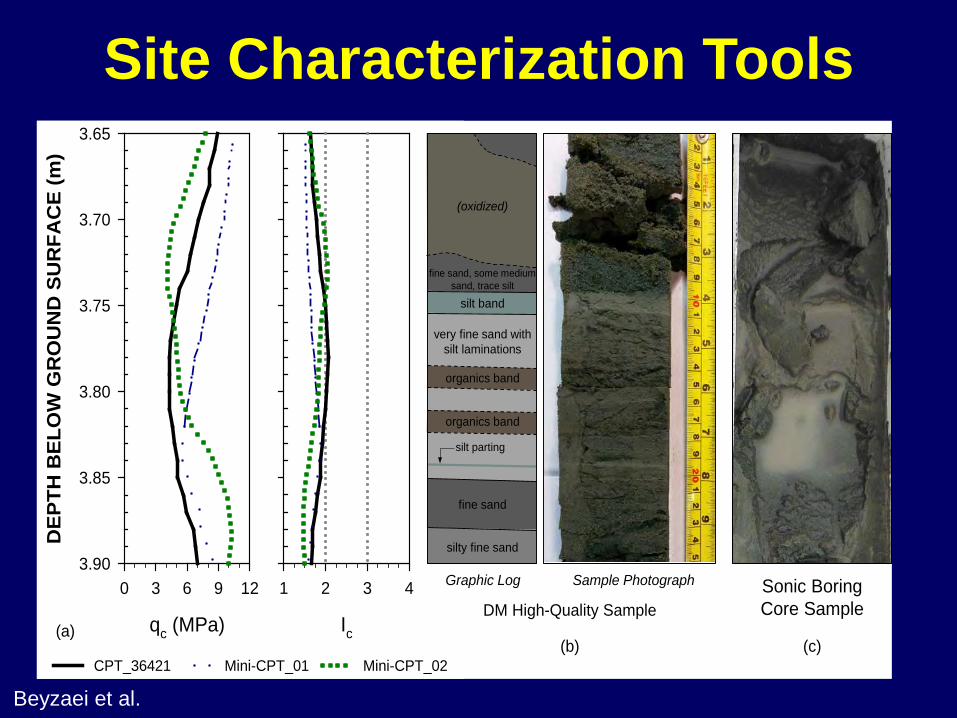
Site Characterization Tools
qc (MPa)
0 3 6 9 12
DEP
TH B
ELO
W G
RO
UN
D S
UR
FAC
E (m
)
3.65
3.70
3.75
3.80
3.85
3.90
Ic
1 2 3 4
CPT_36421 Mini-CPT_01 Mini-CPT_02
(oxidized)
silt band
organics band
organics band
very fine sand with silt laminations
silt parting
fine sand
silty fine sand
fine sand, some medium sand, trace silt
Graphic Log Sample Photograph
DM High-Quality Sample
(c)
Sonic Boring Core Sample
(b)(a)
Beyzaei et al.
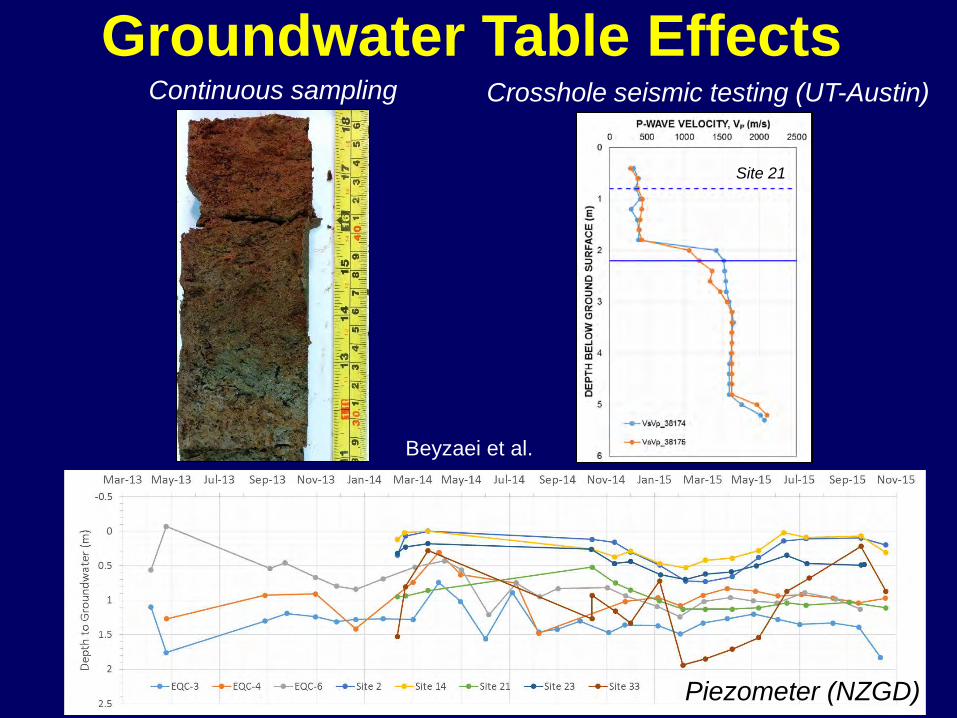
Groundwater Table EffectsCrosshole seismic testing (UT-Austin)Continuous sampling
Piezometer (NZGD)
Site 21
Beyzaei et al.
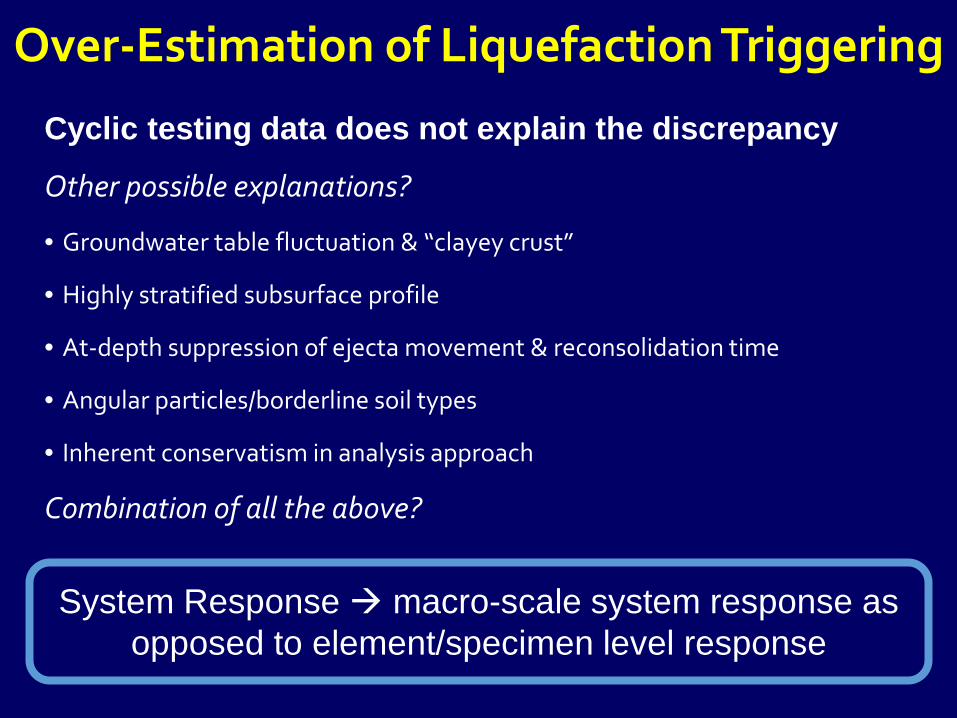
Over-Estimation of Liquefaction Triggering
Cyclic testing data does not explain the discrepancyOther possible explanations?
• Groundwater table fluctuation & “clayey crust”
• Highly stratified subsurface profile
• At-depth suppression of ejecta movement & reconsolidation time
• Angular particles/borderline soil types
• Inherent conservatism in analysis approach
Combination of all the above?
System Response macro-scale system response as opposed to element/specimen level response
www.engeo.com
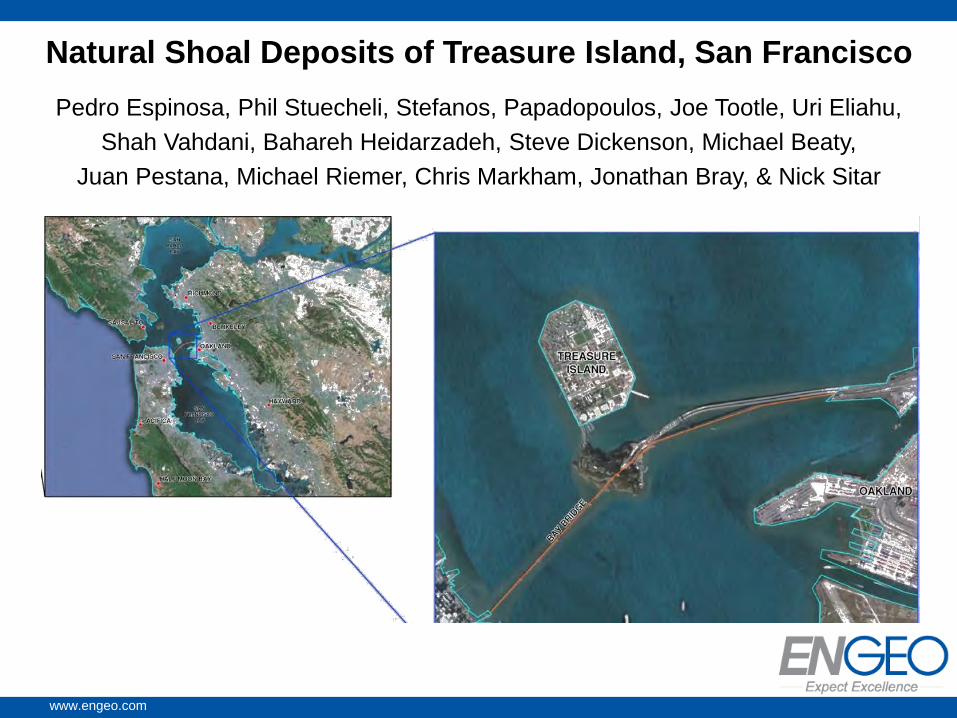
Natural Shoal Deposits of Treasure Island, San FranciscoPedro Espinosa, Phil Stuecheli, Stefanos, Papadopoulos, Joe Tootle, Uri Eliahu,
Shah Vahdani, Bahareh Heidarzadeh, Steve Dickenson, Michael Beaty, Juan Pestana, Michael Riemer, Chris Markham, Jonathan Bray, & Nick Sitar
www.engeo.com
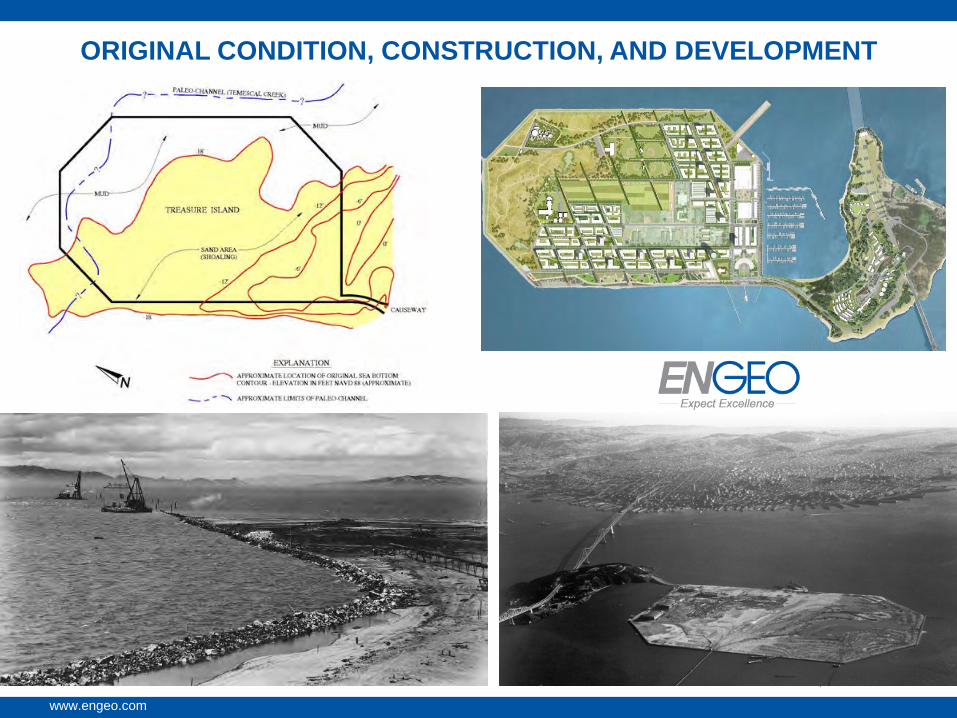
ORIGINAL CONDITION, CONSTRUCTION, AND DEVELOPMENT
www.engeo.com
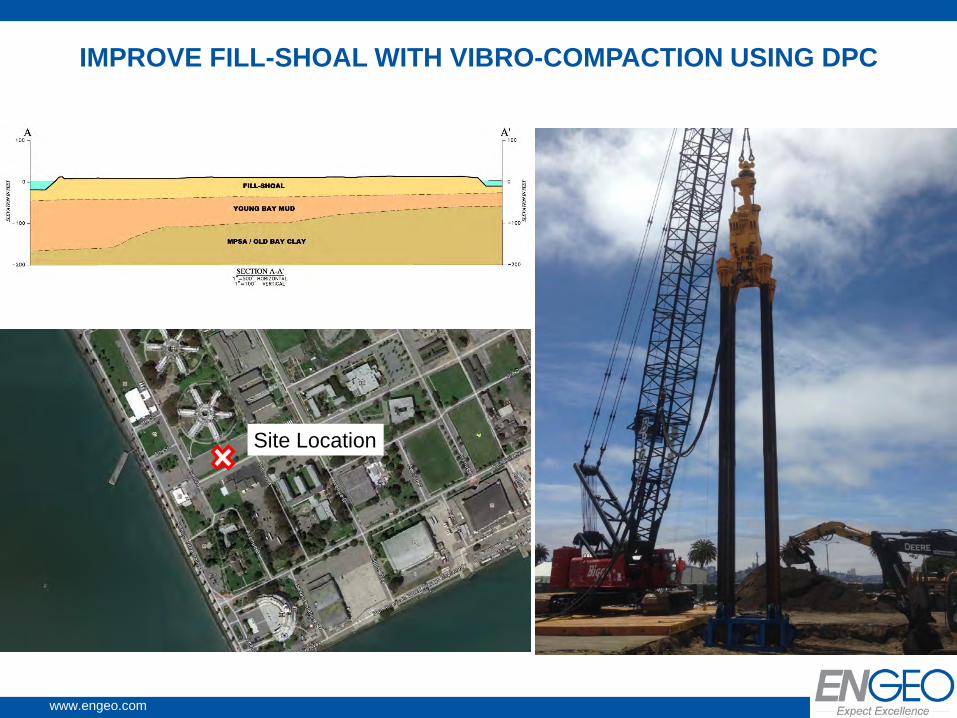
Site Location
Sourced from Google Earth
IMPROVE FILL-SHOAL WITH VIBRO-COMPACTION USING DPC
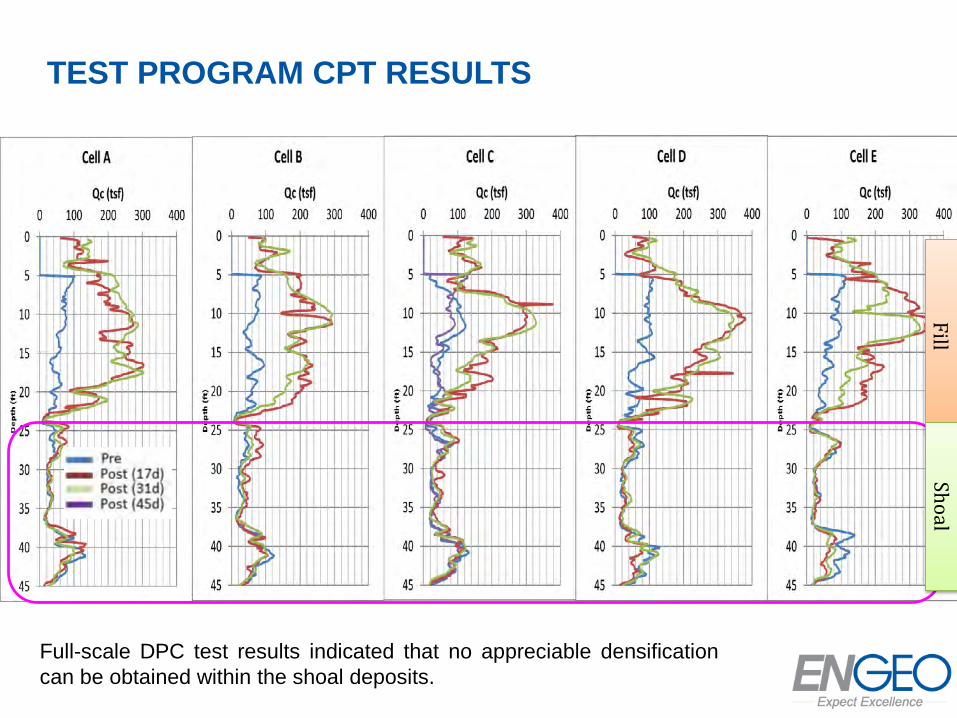
TEST PROGRAM CPT RESULTS
FillShoal
Full-scale DPC test results indicated that no appreciable densificationcan be obtained within the shoal deposits.
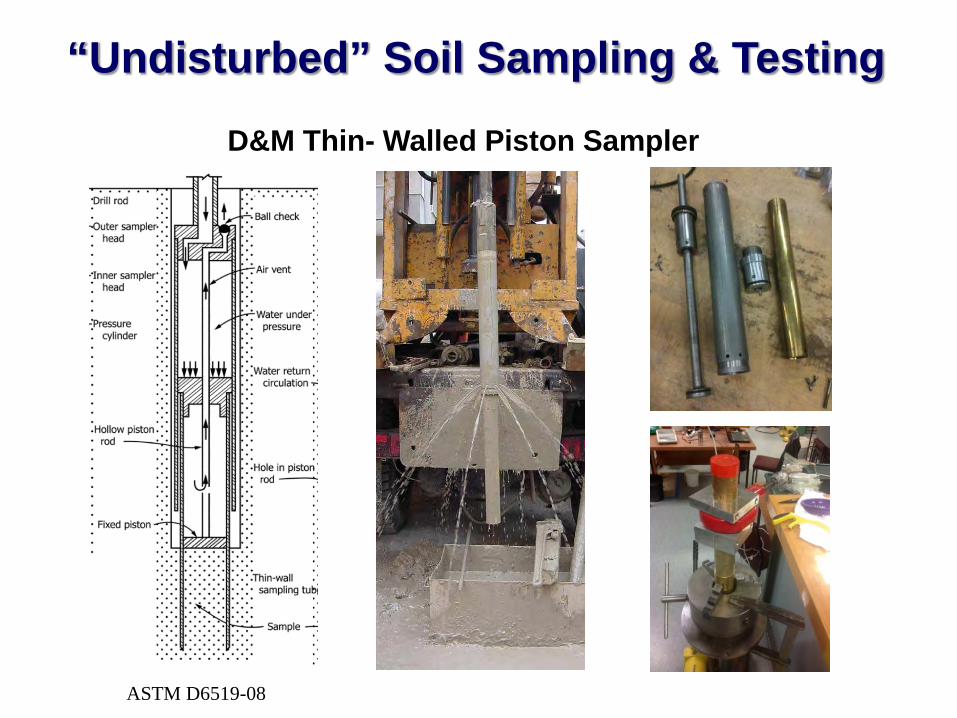
D&M Thin- Walled Piston Sampler
“Undisturbed” Soil Sampling & Testing
ASTM D6519-08
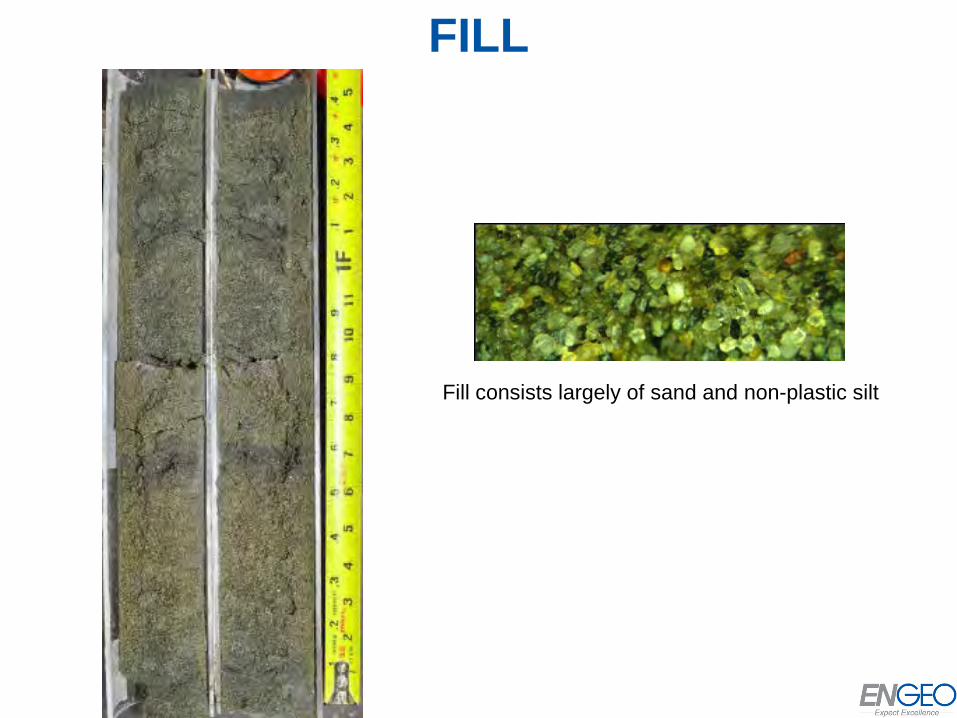
FILL
Fill consists largely of sand and non-plastic silt
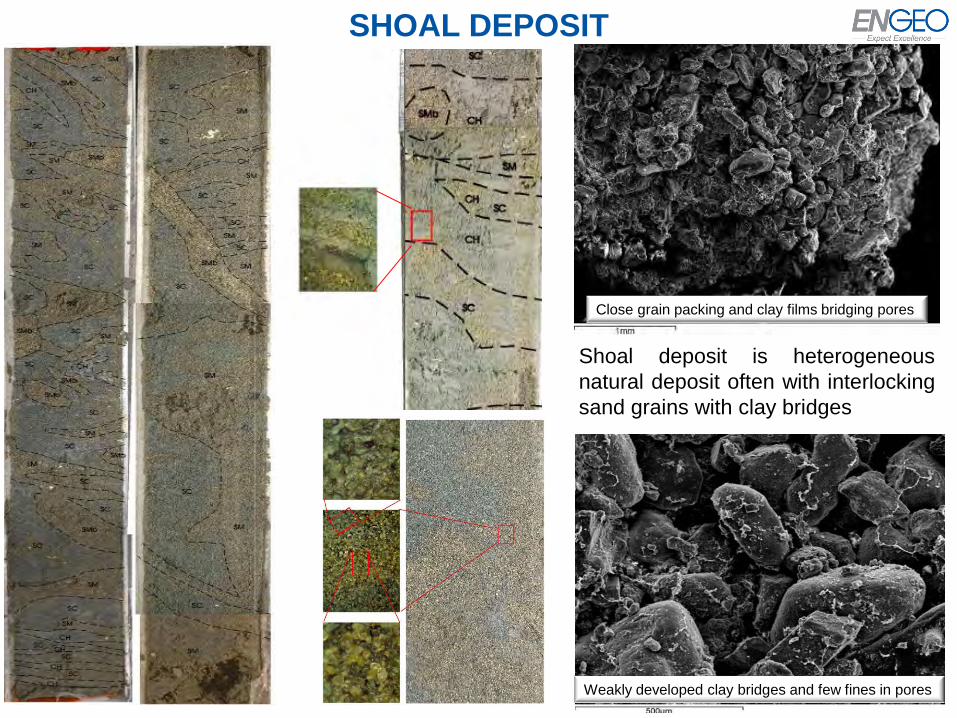
SHOAL DEPOSIT
Shoal deposit is heterogeneousnatural deposit often with interlockingsand grains with clay bridges
Close grain packing and clay films bridging pores
Weakly developed clay bridges and few fines in pores
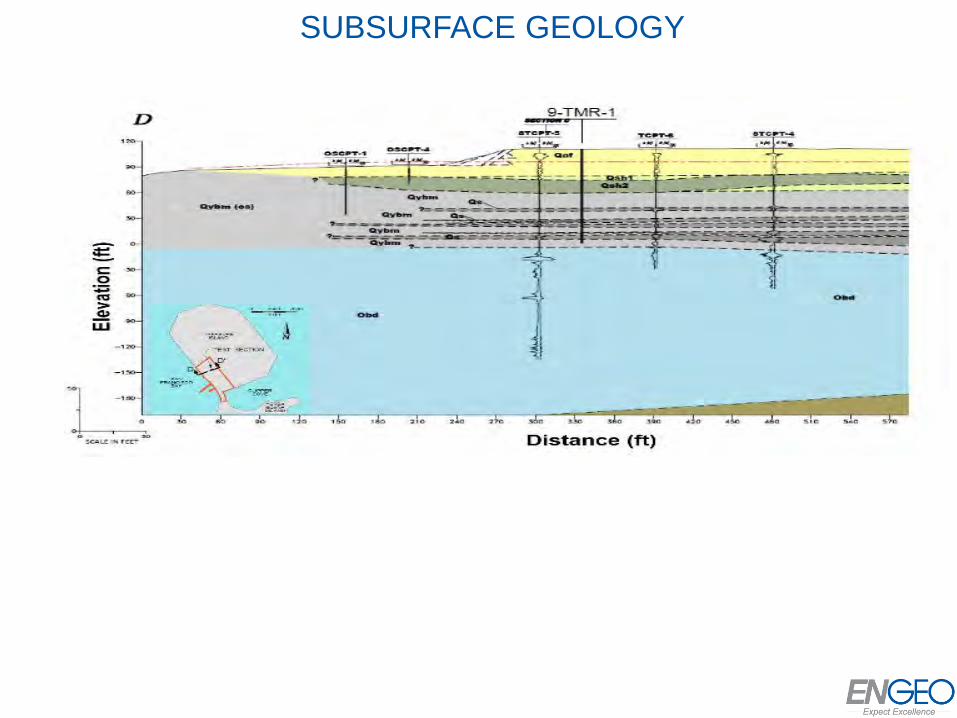
SUBSURFACE GEOLOGY
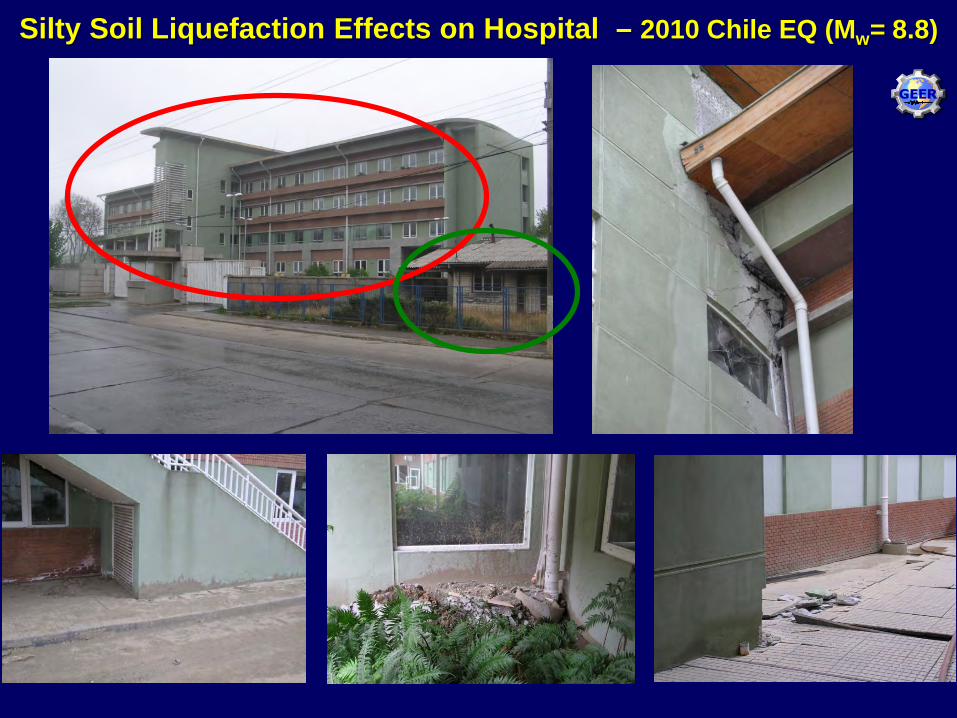
Silty Soil Liquefaction Effects on Hospital – 2010 Chile EQ (Mw= 8.8)
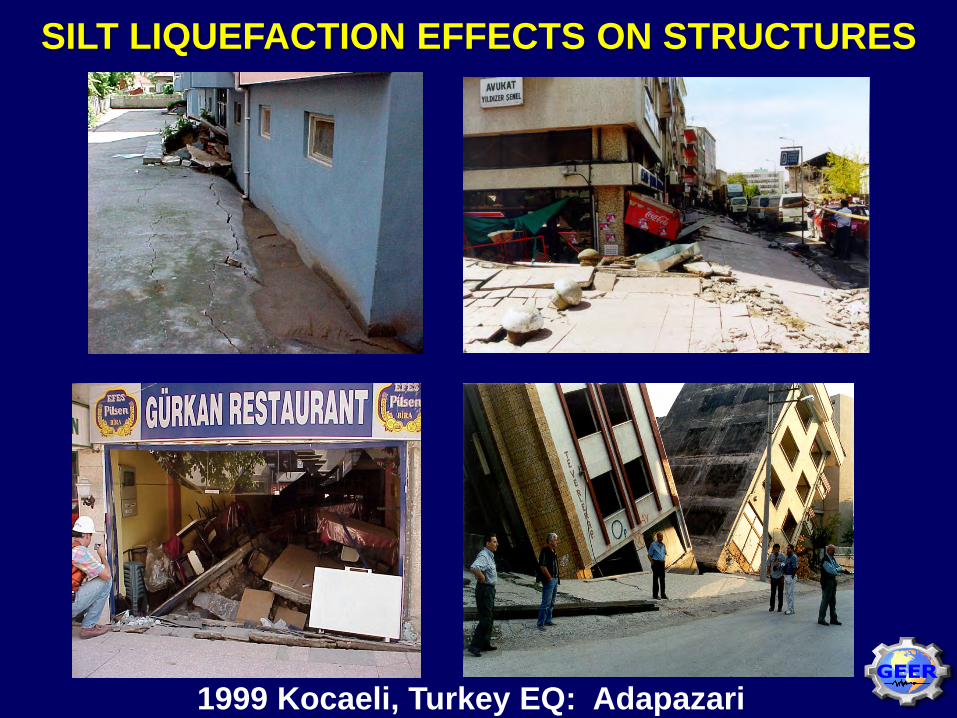
SILT LIQUEFACTION EFFECTS ON STRUCTURES
1999 Kocaeli, Turkey EQ: Adapazari
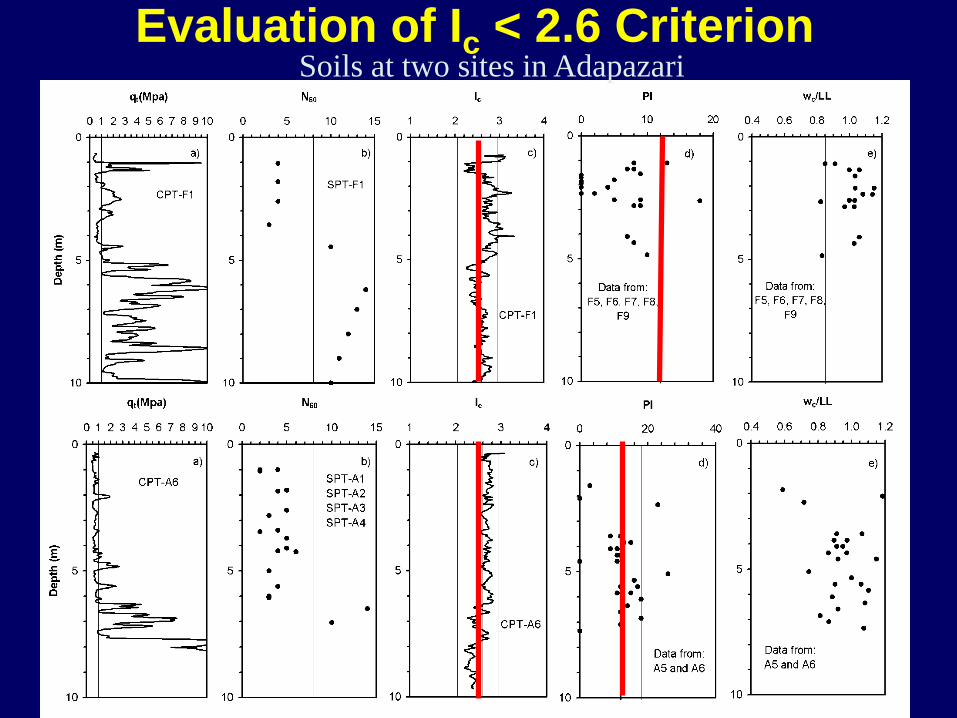
Evaluation of Ic < 2.6 CriterionSoils at two sites in Adapazari
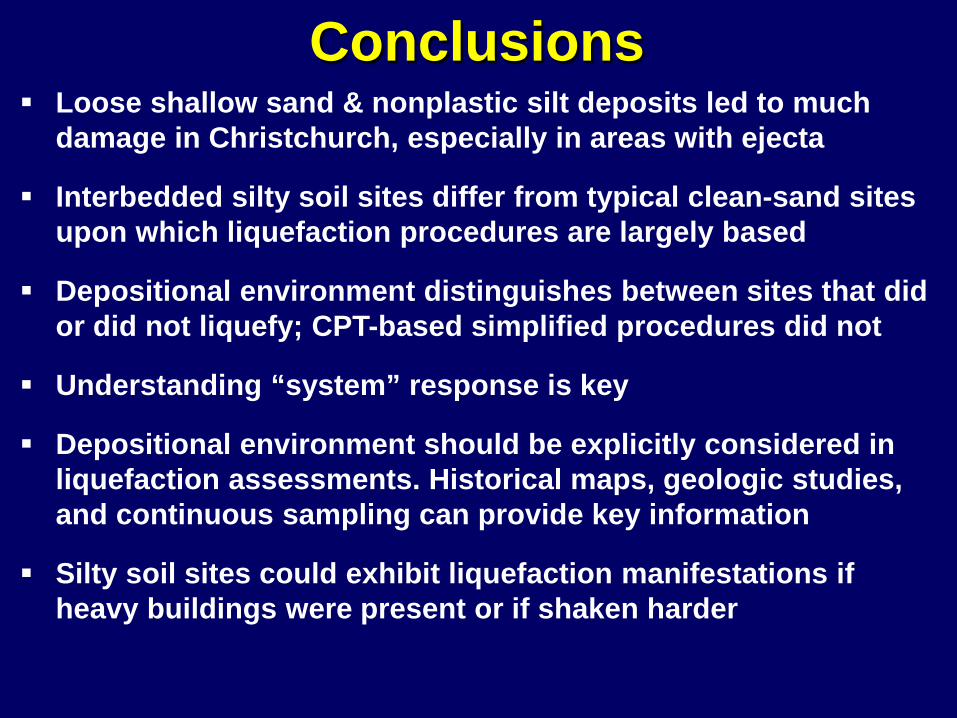
Conclusions Loose shallow sand & nonplastic silt deposits led to much
damage in Christchurch, especially in areas with ejecta
Interbedded silty soil sites differ from typical clean-sand sites upon which liquefaction procedures are largely based
Depositional environment distinguishes between sites that did or did not liquefy; CPT-based simplified procedures did not
Understanding “system” response is key
Depositional environment should be explicitly considered in liquefaction assessments. Historical maps, geologic studies, and continuous sampling can provide key information
Silty soil sites could exhibit liquefaction manifestations if heavy buildings were present or if shaken harder
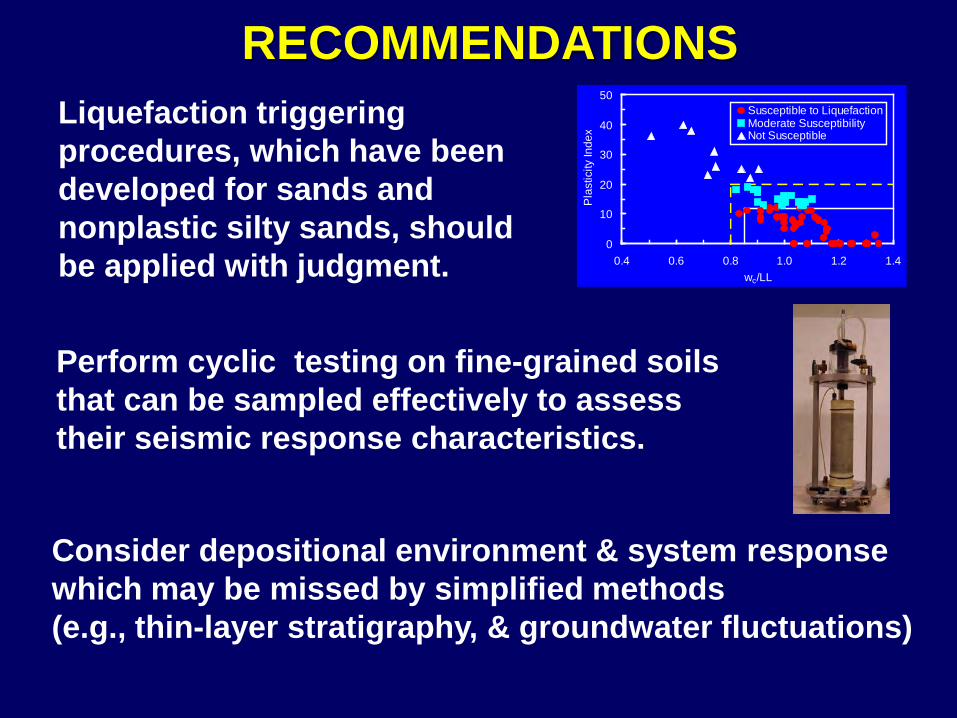
RECOMMENDATIONS
Perform cyclic testing on fine-grained soils that can be sampled effectively to assess their seismic response characteristics.
0
10
20
30
40
50
0.4 0.6 0.8 1.0 1.2 1.4wc/LL
Pla
stic
ity In
dex
Susceptible to LiquefactionModerate SusceptibilityNot Susceptible
Liquefaction triggering procedures, which have been developed for sands and nonplastic silty sands, should be applied with judgment.
Consider depositional environment & system response which may be missed by simplified methods (e.g., thin-layer stratigraphy, & groundwater fluctuations)