seismic performance of highway bridges with fusing bearing ...jfhajjar/home/filipov et al. -...
TRANSCRIPT
Seismic performance of highway bridges with fusing bearingcomponents for quasi-isolation
Evgueni T. Filipov1, Jessica R. Revell1, Larry A. Fahnestock1,*,†, James M. LaFave1,Jerome F. Hajjar2, Douglas A. Foutch1 and Joshua S. Steelman1
1Department of Civil and Environmental Engineering, University of Illinois at Urbana-Champaign, 205 NorthMathews Avenue, Urbana, IL 61801, U.S.A.
2Department of Civil and Environmental Engineering, Northeastern University, 400 Snell Engineering Center, 360Huntington Avenue, Boston, MA 02115, U.S.A.
SUMMARY
Modern highway bridges in Illinois are often installed with economical elastomeric bearings that allow forthermal movement of the superstructure, and steel fixed bearings and transverse retainers that prevent excessivemovement from service-level loadings. In the event of an earthquake, the bearing system has the potential toprovide a quasi-isolated response where failure of sacrificial elements and sliding of the bearings can cause aperiod elongation and reduce or cap the force demands on the substructure. A computational model that hasbeen calibrated for the expected nonlinear behaviors is used to carry out a parametric study to evaluate quasi-isolated bridge behavior. The study investigates different superstructure types, substructure types, substructureheights, foundation types, and elastomeric bearing types. Overall, only a few bridge variants were noted tounseat for design-level seismic input in the NewMadrid Seismic Zone, indicating that most structures in Illinoiswould not experience severe damage during their typical design life. However, Type II bearing systems, whichconsist of an elastomeric bearing and a flat PTFE slider, would in some cases result in critical damage fromunseating at moderate and high seismic input. The sequence of damage for many bridge cases indicates yieldingof piers at low-level seismic input. This is caused by the high strength of the fixed bearing element, whichjustifies further calibration of the quasi-isolation design approach. Finally, the type of ground motion, pierheight, and bearing type were noted to have significant influence on the global bridge response. Copyright ©2013 John Wiley & Sons, Ltd.
Received 1 February 2012; Revised 2 December 2012; Accepted 3 December 2012
KEY WORDS: seismic isolation; quasi-isolation; highway bridges; sliding bearings; earthquake responsehistory analysis
1. INTRODUCTION
Seismic isolation is a well-accepted design philosophy for bridges in high seismic regions of the USA[1, 2]. Although seismic isolation can provide a high level of structural performance, the designcomplexity and higher cost of construction make this approach less attractive in regions of thecountry such as Illinois where a potential for large earthquakes exists, but only at long recurrenceintervals. As a result, the concept of quasi-isolation for bridges has emerged as an innovative, yetpragmatic, design philosophy that can be broadly applied. The basic notion of quasi-isolation is thattypical bridge bearing systems can be designed and detailed such that they act as fuses to limit theforces transmitted from the superstructure to the substructure, while accommodating the concomitant
*Correspondence to: Larry A. Fahnestock, Department of Civil and Environmental Engineering, University of Illinois atUrbana-Champaign, 2108 Newmark Civil Engineering Laboratory, 205 North Mathews Avenue, Urbana, IL 61801, U.S.A.†E-mail: [email protected]
Copyright © 2013 John Wiley & Sons, Ltd.
EARTHQUAKE ENGINEERING & STRUCTURAL DYNAMICSEarthquake Engng Struct. Dyn. 2013; 42:1375–1394Published online 25 January 2013 in Wiley Online Library (wileyonlinelibrary.com). DOI: 10.1002/eqe.2277
displacements. A prime difference between classical isolation [3] and the system studied in this paperis that quasi-isolation does not require a complex design process, yet can provide damage mitigationfor significant seismic events. This philosophy, which was initially developed by the IllinoisDepartment of Transportation (IDOT), is intended to provide a cost-effective bridge with anearthquake-resisting system (ERS) [2] that limits damage for small seismic events and still preventsspan loss during a strong event in the New Madrid Seismic Zone (NMSZ). At the core of the IDOTERS is an extension of a common bridge design methodology employed in higher seismic regionsof the USA, where the substructure and superstructure should remain elastic while a specific fusingmechanism is implemented at the interface between the two [4, 5]. The concept of the IDOT ERSallows for the following three distinct levels of fusing and redundancy: Level 1—permitting damageand failure of the bearing components to allow quasi-isolation, Level 2—providing sufficient seatwidths to permit the required sliding, and Level 3—permitting some damage to the substructure solong as there is no span loss.
The research described in this paper is part of a broad program to calibrate and refine the IDOT ERSfor common highway bridges with simply supported abutment conditions and continuous spans. Theoverall research program, discussed in detail in previous publications [6], has six primarycomponents: (i) conducting full-scale tests of typical bridge bearings used in Illinois; (ii) developingnumerical models of bridge bearings, validated against test results; (iii) exploring local response ofbearings not considered experimentally; (iv) developing numerical models of full bridge systems,which capture all important aspects of behavior; (v) conducting parametric studies to explore systemlevel seismic response for a range of representative Illinois bridges; and (vi) developingrecommendations for seismic design of bridges using the quasi-isolation philosophy. This paperfocuses on the fifth component of the research program, by providing quantitative and qualitativeevaluation of the quasi-isolation system’s seismic response.
Many existing bridges in Illinois have the potential to achieve a response that would be consideredas quasi-isolation. For thermal expansion, these bridges use steel-reinforced elastomeric bearings,which are either (1) IDOT Type I bearings that are placed directly on the concrete substructure(vulcanized to only a top steel plate) or (2) IDOT Type II bearings, which consist of the following:a bottom steel plate bolted to the substructure and vulcanized to the elastomeric component, amiddle plate that is vulcanized to the top of the elastomer and coated on top withpolytetrafluoroethylene (also known as PTFE or Teflon), and a top plate with a stainless steel matingsurface carrying the girder load directly onto the PTFE surface. Transverse serviceability movementsat the elastomeric bearings are limited by stiffened angle side retainers. Low-profile fixed steelbearings are placed at one intermediate substructure with the intent to carry traffic braking loads andprevent global service load movement of the structure. Preliminary design procedures in the IDOTBridge Manual [7] aim to proportion retainers and fixed bearings to have lateral capacities equal to20% of the dead load at the bearing of interest, with the intent that these steel components willexhibit nonlinear behaviors and fail at high seismic loads. The IDOT bridge design procedures areintended primarily for typical bridges in seismic Zones 1, 2 and 3 as defined by the AmericanAssociation of State Highway and Transportation Officials (AASHTO). Bridges with complexgeometries and in locations of high seismic hazard (Zone 4) are encouraged to utilize more advancedanalysis and design techniques than prescribed in the IDOT Bridge Manual.
Recent work by Filipov et al. [8] developed nonlinear bearing and retainer element models that arebased on early experimental results from this project and are capable of simulating unique aspects ofthe cyclic bearing component response (e.g., elastomer shear deformations, friction (stick–slip), andnonlinear retainer failure). The nonlinear elements were implemented into a global prototype bridgemodel used for static pushover analyses of the quasi-isolated system. That same prototype model isthe basis for the analyses described in this paper.
Section 2 of this paper briefly describes the prototype model, outlines the variations in the parametricspace considered in this study, and discusses calibration of the bearing models. In Section 3, the inputground motion considerations are discussed, to give a basis for the incremental dynamic analyses(IDAs) carried out for each of the bridges. Section 4 discusses damage limit states that can beencountered in an earthquake and shows a sample dynamic analysis of a single bridge structure.Section 5 provides an overall evaluation of the seismic performance for typical bridge systems in Illinois.
1376 E. T. FILIPOV ET AL.
Copyright © 2013 John Wiley & Sons, Ltd. Earthquake Engng Struct. Dyn. 2013; 42:1375–1394DOI: 10.1002/eqe
2. OVERVIEW OF NONLINEAR MODELING FOR PARAMETRIC VARIATIONS
2.1. Basic bridge prototype
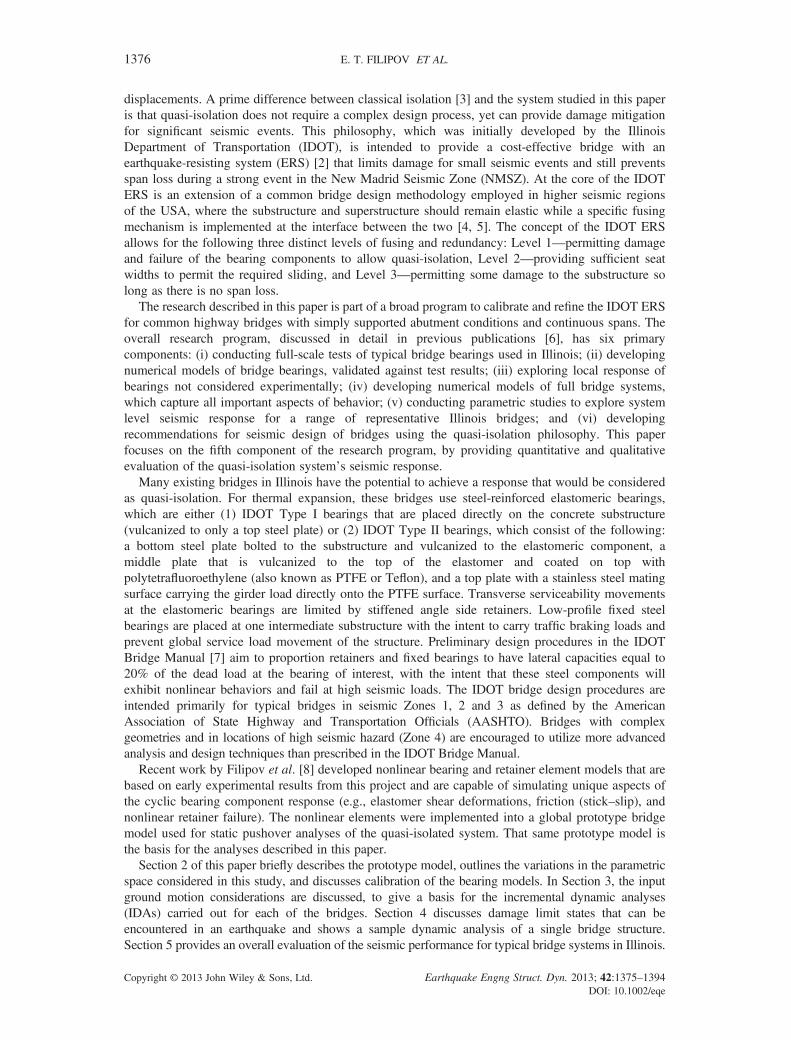
The base prototype bridge in Figure 1, is a three-span continuous steel I-girder superstructure on multi-column (4) pier substructures (all proportioned in accordance with the IDOT Bridge Manual [7]). Thebridge deck allows for two lanes of traffic, and it is constructed with six W27x84 (AASHTO M270Gr. 50) steel girders that act compositely with a 20.3 cm (8 in.)-thick concrete deck. All deckelements (including the diaphragm elements) are modeled as linear with appropriate elastic stiffness.
The multi-column piers are 4.5m (15 ft) tall and are modeled with beam–column elements withhinges and fiber sections that capture material nonlinearities in the concrete and reinforcement. Theprototype system is modeled with a fixed base, representing a stiff, steadfast foundation on a rockysubstrate. The nonlinear behavior of the abutment backwalls is modeled with a 5 cm (2 in.) gapsimulating a thermal expansion cavity, and a hyperbolic material model is used to capture thebackfill behavior. For the typical three-span bridge configuration used in this parametric study, low-profile fixed bearings are installed at the second pier (Pier 2), while Type I or Type II elastomericexpansion bearings are used at the other pier and at the abutments. The base prototype bridge usesType I elastomeric bearings where sliding occurs at the elastomer-concrete interface. Stiffness andmass proportional damping of 5% is used in the first longitudinal and transverse modes, andadditional damping occurs from hysteretic behavior of the nonlinear elements. Detailed information onthe global bridge model and the component formulations is contained in previous publications [6, 8].
2.2. Parametric variations
The parametric variations studied in this paper were based on the current bridge stock in Illinois asdefined in [9], as well as current trends of bridge design in Illinois, where elastomeric bearings arenow the preferred type of expansion bearing. At the time of the previous study, 75% of the bridgeshad three spans with total lengths ranging from 33 to 82m (110–270 ft), and consisted of 86% steelgirders and 14% concrete girders with composite decks; 67% had multi-column piers, 32% had wallpiers, and heights ranged from 2.7m (9 ft) to 14m (46 ft). Site conditions ranged from Class B to Esoils, foundations consisted primarily of piles (86%), and 33% of bridges had elastomeric bearings [9].
The bridges investigated herein incorporate variations in superstructure type, substructure type,substructure height, foundation type, and elastomeric bearing system, and provide a reasonablerepresentation of modern bridges in Illinois. On the other hand, bridges with simply supportedspans, steel rocker bearings, integral abutments, or curved superstructures are not considered in thisstudy. Bridge model variations are named with a series of letters and numbers to provide anomenclature for the parameters used in the study. The first two letters of the model name indicatethe superstructure type, (Ss, steel short; Sl, steel long; Cs, concrete short). The third letter and thefollowing two numbers designate the intermediate substructure type (C, column pier; W, wall pier)and height in feet (15 ft (4.5m) and 40 ft (12.2m)). The next letter and number indicate the bearingtype used (T1, Type I IDOT bearing; T2, Type II IDOT bearing). The final letter indicates thefoundation boundary condition flexibility (F, fixed/rock; S, flexible foundation boundary condition).The flexible boundary condition simulates a group pile foundation with a pile cap in soft soils. Itshould be noted that foundation boundary condition is an independent variable from the groundmotion properties that are defined in Section 3.
LOW-PROFILE FIXED BEARINGS
TYPE I - ELASTOMERIC BEARINGS
12.8
m (
42ft)
15.2m (50ft) 15.2m (50ft) 15.2m (50ft)
4.6m
(15f
t)
COMPOSITE STEEL SUPERSTRUCTURE
MULTI-COLUMNPIER
5cm (2 in) ABUTMENT EXPANSION GAP
FIXED/ROCK TYPEFOUNDATIONS
(a) Plan (b) Elevation
Figure 1. Base bridge prototype.
SEISMIC PERFORMANCE OF HIGHWAY BRIDGES WITH FUSING BEARING COMPONENTS 1377
Copyright © 2013 John Wiley & Sons, Ltd. Earthquake Engng Struct. Dyn. 2013; 42:1375–1394DOI: 10.1002/eqe
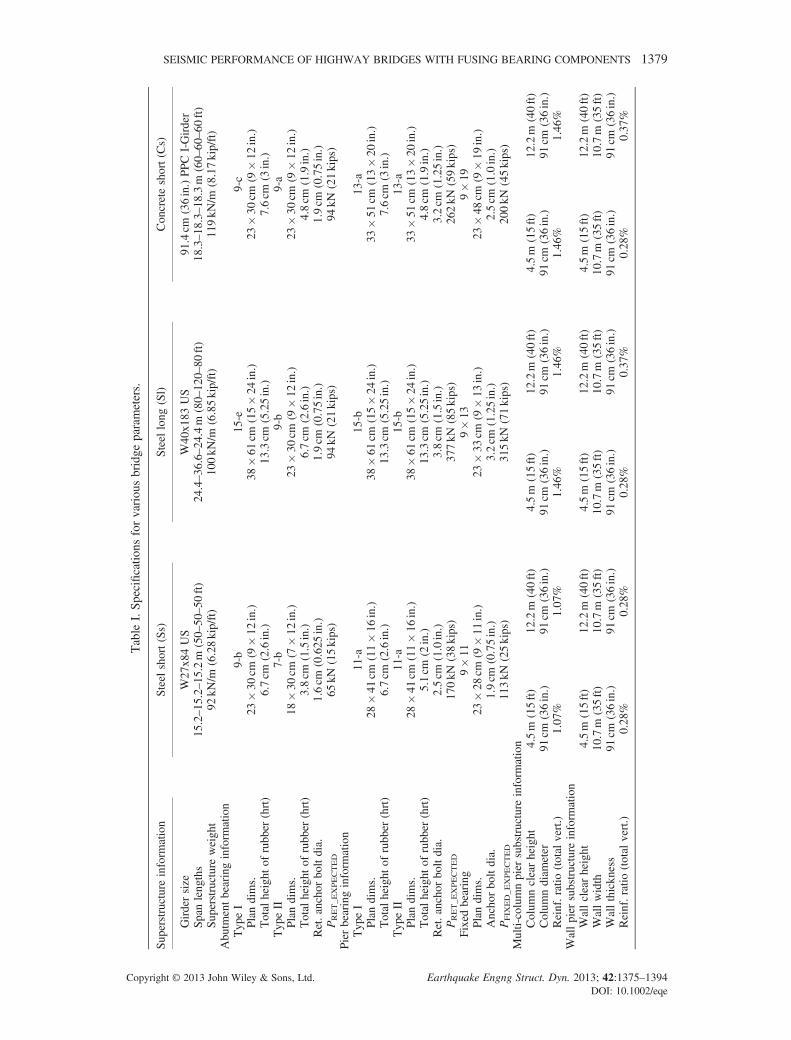
With the provided definitions, the base prototype bridge can be denoted as SsC15T1F, whereasSlW40T2S would indicate a bridge with a long steel superstructure, supported on 12.2m (40 ft) wallpiers with flexible foundation boundary conditions and Type II IDOT bearings. Later in this paper,the symbols ‘X’, ‘x’, and ‘#’ are used to designate all the variations of a particular parameter.Bridge variations defined using this nomenclature result in 48 distinct bridges that are studied in thisresearch. Details on the various parameters used are shown in Table I, and two sample meshes ofthe finite element bridge models created with OpenSees [10] are shown in Figure 2.
2.3. Calibration of the bi-directional sliding bearing elements
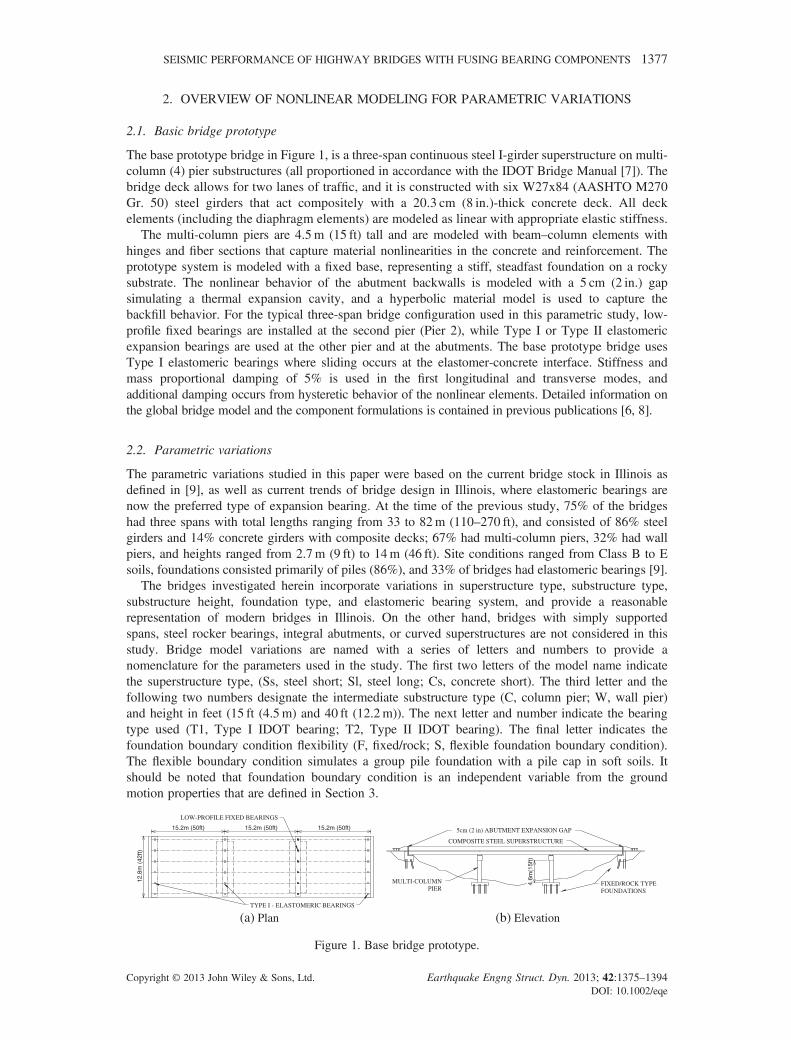
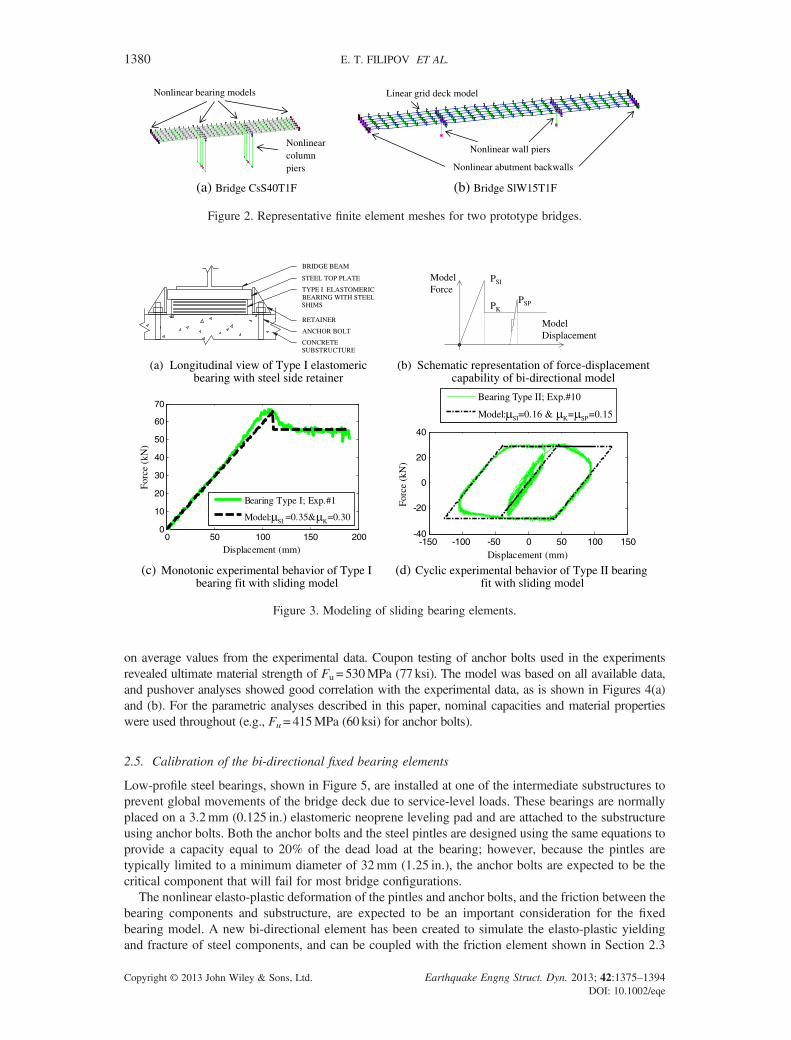
Bearing systems modeled with uncoupled, uniaxial elements are considered unreliable for multi-directional seismic analysis. For example, friction pendulum isolators modeled with uncoupledelements resulted in overestimation of forces and underestimation of system displacements, whencompared with bi-directional coupled models and experimental data [11, 12]. Although frictionpendulum bearings are not considered herein, the findings related to modeling are applicable to othertypes of isolation systems, and therefore, an orthogonally coupled, zero-length, bi-directional model(similar to that presented in [13]) was created for the modeling of friction stick–slip behaviors exhibitedby Type I and Type II IDOT bearings. The model, shown schematically in Figure 3(b), is capable ofcapturing an initial static friction break-off force (PSI), a kinetic friction force (PK), and a post-slipfriction break-off force (PSP). Different coefficients of friction are specified for each condition, and thevariable axial load on the bearing is used in the model formulation.
Experimental results from this project [14, 15] were used to inform the behavior of the slidingbearings, and sample model validation is shown in Figure 3. The Type I bearings were modeledwith a static initial coefficient of friction of mSI = 0.60, a kinetic coefficient of friction of mK= 0.45,and a post-slip coefficient of static friction of mSP = 0.50. The Type II bearings were simulated withmSI = 0.16 and mSP =mK = 0.15. The stiffness of the elastomeric bearings is calculated as the effectiveapparent shear modulus of the elastomer, approximated as 585 kPa (85 psi) on the basis ofexperimental data for strain levels sufficient to induce slip on concrete, times the plan area of thebearing divided by the total height of rubber (hrt). Monotonic and cyclic tests of the Type I bearingsshowed reliable and resilient behavior for large vertical bearing forces and large magnitudes ofbearing travel. Type II bearings also showed reliable sliding behavior; however, at large top platedisplacements, these bearings exhibit unstable behavior that requires increasingly larger forces to re-center the bearing. This instability is believed to rapidly move the bearing into an unseatedconfiguration, where the model as shown in Figure 3(b) will become invalid. This response isdiscouraged for quasi-isolation and is discussed in further detail in Section 4.1.
2.4. Calibration of the uni-directional retainer elements
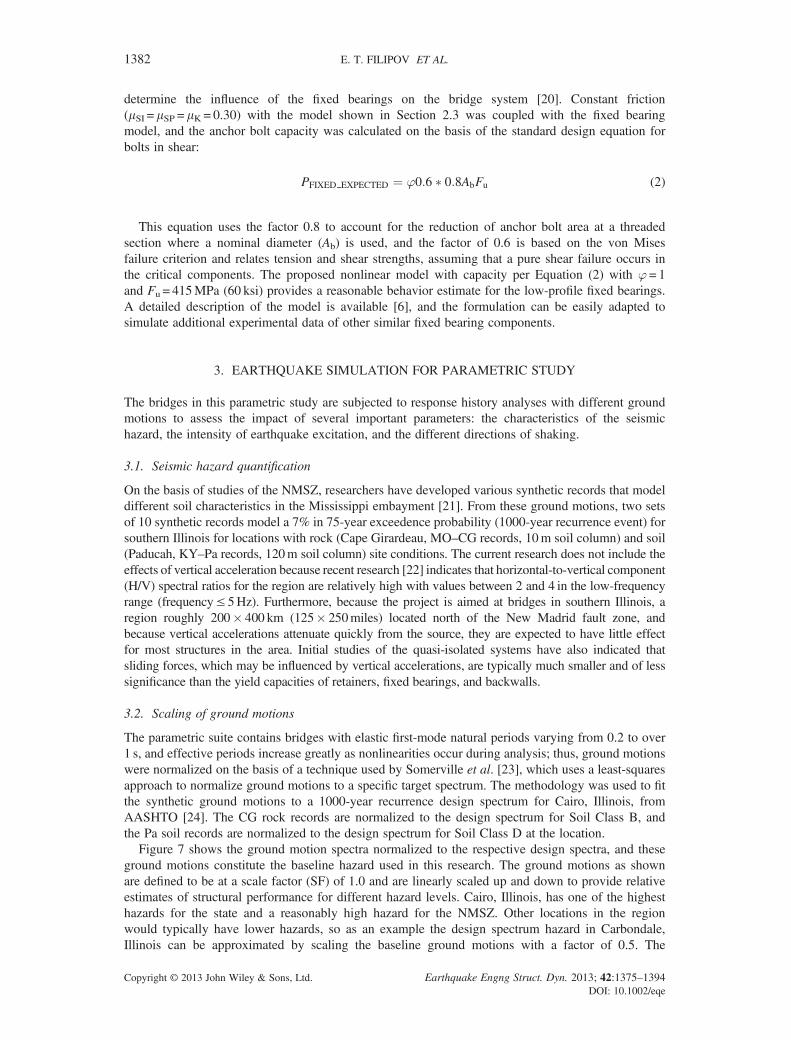
The retainers placed in the transverse direction of each elastomeric bearing were shown to exhibitroughly elasto-plastic behavior on the basis of experimental testing [14]. The failure mode consistedof localized concrete crushing (primarily for larger anchor bolts) and subsequent bolt tensile–shearfailure. A nonlinear uni-axial model has been formulated [8] that utilizes an initial gap followed byelasto-plastic response and a subsequent failure criterion at an ultimate displacement. Current designspecifications state that retainers should be installed at a gap of 3.2mm (0.125 in.); however, theexperiments showed that an additional gap of 7.6mm (0.3 in.) should be assumed in analysisbecause the oversized bolt hole in the retainer leaves additional space between the anchor bolt andthe edge of the retainer hole, and force is not developed upon instantaneous contact of the retainers.A variation of the IDOT design equation [7] for strength of retainers was found to be satisfactoryfor predicting the ultimate force capacity of the retainer element, with
PRET EXPECTED ¼ ’0:8AbFu (1)
where Ab is the nominal anchor bolt area, Fu is the ultimate tensile strength, and ’=1 for no strengthreduction. The model elastic and plastic stiffnesses were set to EE = 790MPa (115 ksi) and EP = 57MPa(8ksi), respectively, and the ratio of ultimate to yield strength PRET_EXPECTED/PRET_Y=1.80, were based
1378 E. T. FILIPOV ET AL.
Copyright © 2013 John Wiley & Sons, Ltd. Earthquake Engng Struct. Dyn. 2013; 42:1375–1394DOI: 10.1002/eqe
Table
I.Specificatio
nsforvariousbridge
parameters.
Superstructureinform
ation
Steel
short(Ss)
Steel
long
(Sl)
Concreteshort(Cs)
Girdersize
W27x84US
W40x183
US
91.4cm
(36in.)PPCI-Girder
Spanlengths
15.2–15.2–15.2m
(50–50
–50ft)
24.4–3
6.6–24.4m
(80–
120–80
ft)
18.3–18.3–18.3m
(60–60
–60ft)
Superstructureweight
92kN
/m(6.28kip/ft)
100kN
/m(6.85kip/ft)
119kN
/m(8.17kip/ft)
Abutm
entbearinginform
ation
TypeI
9-b
15-e
9-c
Plandims.
23�30
cm(9�12
in.)
38�61
cm(15�24
in.)
23�30
cm(9�12
in.)
Total
height
ofrubber
(hrt)
6.7cm
(2.6in.)
13.3cm
(5.25in.)
7.6cm
(3in.)
TypeII
7-b
9-b
9-a
Plandims.
18�30
cm(7�12
in.)
23�30
cm(9�12
in.)
23�30
cm(9�12
in.)
Total
height
ofrubber
(hrt)
3.8cm
(1.5in.)
6.7cm
(2.6in.)
4.8cm
(1.9in.)
Ret.anchorboltdia.
1.6cm
(0.625
in.)
1.9cm
(0.75in.)
1.9cm
(0.75in.)
PRET_EXPECTED
65kN
(15kips)
94kN
(21kips)
94kN
(21kips)
Pierbearinginform
ation
TypeI
11-a
15-b
13-a
Plandims.
28�41
cm(11�16
in.)
38�61
cm(15�24
in.)
33�51
cm(13�20
in.)
Total
height
ofrubber
(hrt)
6.7cm
(2.6in.)
13.3cm
(5.25in.)
7.6cm
(3in.)
TypeII
11-a
15-b
13-a
Plandims.
28�41
cm(11�16
in.)
38�61
cm(15�24
in.)
33�51
cm(13�20
in.)
Total
height
ofrubber
(hrt)
5.1cm
(2in.)
13.3cm
(5.25in.)
4.8cm
(1.9in.)
Ret.anchorboltdia.
2.5cm
(1.0in.)
3.8cm
(1.5in.)
3.2cm
(1.25in.)
PRET_EXPECTED
170kN
(38kips)
377kN
(85kips)
262kN
(59kips)
Fixed
bearing
9�11
9�13
9�19
Plandims.
23�28
cm(9�11
in.)
23�33
cm(9�13
in.)
23�48
cm(9�19
in.)
Anchorboltdia.
1.9cm
(0.75in.)
3.2cm
(1.25in.)
2.5cm
(1.0in.)
PFIX
ED_EXPECTED
113kN
(25kips)
315kN
(71kips)
200kN
(45kips)
Multi-columnpier
substructure
inform
ation
Colum
nclearheight
4.5m
(15ft)
12.2m
(40ft)
4.5m
(15ft)
12.2m
(40ft)
4.5m
(15ft)
12.2m
(40ft)
Colum
ndiam
eter
91cm
(36in.)
91cm
(36in.)
91cm
(36in.)
91cm
(36in.)
91cm
(36in.)
91cm
(36in.)
Reinf.ratio
(total
vert.)
1.07%
1.07%
1.46%
1.46%
1.46%
1.46%
Wallpier
substructure
inform
ation
Wallclearheight
4.5m
(15ft)
12.2m
(40ft)
4.5m
(15ft)
12.2m
(40ft)
4.5m
(15ft)
12.2m
(40ft)
Wallwidth
10.7m
(35ft)
10.7m
(35ft)
10.7m
(35ft)
10.7m
(35ft)
10.7m
(35ft)
10.7m
(35ft)
Wallthickness
91cm
(36in.)
91cm
(36in.)
91cm
(36in.)
91cm
(36in.)
91cm
(36in.)
91cm
(36in.)
Reinf.ratio
(total
vert.)
0.28%
0.28%
0.28%
0.37%
0.28%
0.37%
SEISMIC PERFORMANCE OF HIGHWAY BRIDGES WITH FUSING BEARING COMPONENTS 1379
Copyright © 2013 John Wiley & Sons, Ltd. Earthquake Engng Struct. Dyn. 2013; 42:1375–1394DOI: 10.1002/eqe
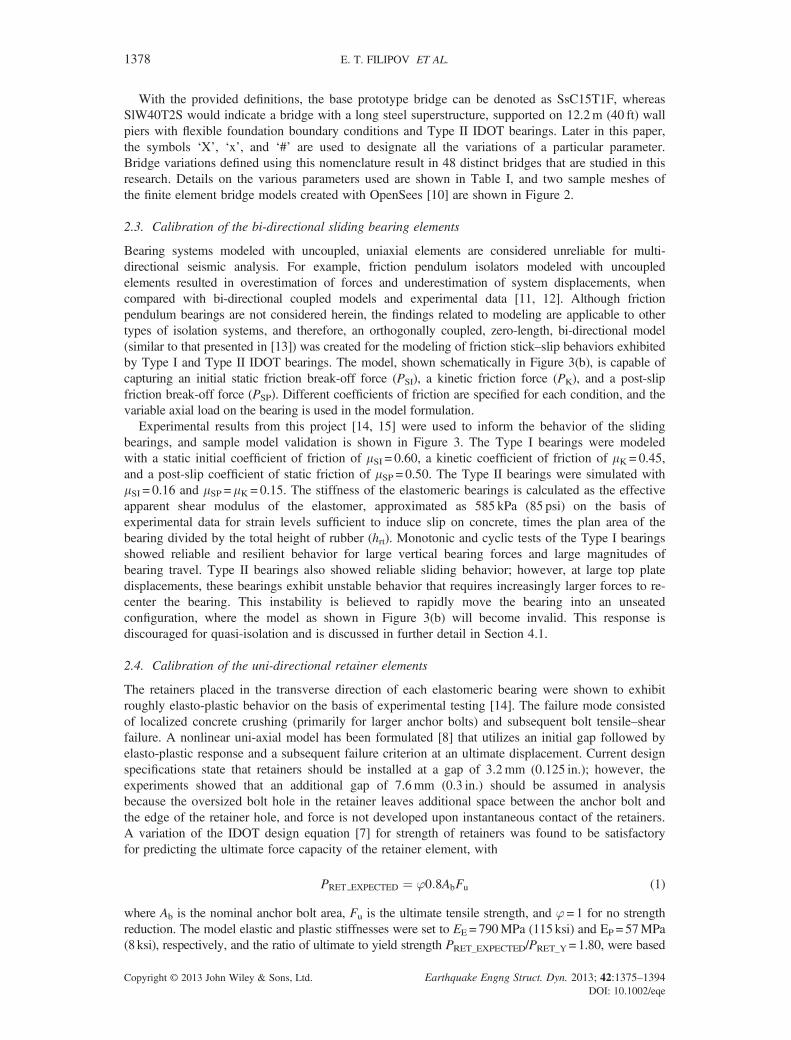
on average values from the experimental data. Coupon testing of anchor bolts used in the experimentsrevealed ultimate material strength of Fu = 530MPa (77 ksi). The model was based on all available data,and pushover analyses showed good correlation with the experimental data, as is shown in Figures 4(a)and (b). For the parametric analyses described in this paper, nominal capacities and material propertieswere used throughout (e.g., Fu=415MPa (60 ksi) for anchor bolts).
2.5. Calibration of the bi-directional fixed bearing elements
Low-profile steel bearings, shown in Figure 5, are installed at one of the intermediate substructures toprevent global movements of the bridge deck due to service-level loads. These bearings are normallyplaced on a 3.2mm (0.125 in.) elastomeric neoprene leveling pad and are attached to the substructureusing anchor bolts. Both the anchor bolts and the steel pintles are designed using the same equations toprovide a capacity equal to 20% of the dead load at the bearing; however, because the pintles aretypically limited to a minimum diameter of 32mm (1.25 in.), the anchor bolts are expected to be thecritical component that will fail for most bridge configurations.
The nonlinear elasto-plastic deformation of the pintles and anchor bolts, and the friction between thebearing components and substructure, are expected to be an important consideration for the fixedbearing model. A new bi-directional element has been created to simulate the elasto-plastic yieldingand fracture of steel components, and can be coupled with the friction element shown in Section 2.3
BRIDGE BEAM
STEEL TOP PLATE
TYPE I ELASTOMERICBEARING WITH STEELSHIMS
RETAINER
CONCRETESUBSTRUCTURE
ANCHOR BOLT
Model Force
PK
PSI
PSP
Model Displacement
(a) Longitudinal view of Type I elastomeric bearing with steel side retainer
(b) Schematic representation of force-displacementcapability of bi-directional model
0 50 100 150 2000
10
20
30
40
50
60
70
Displacement (mm)
Forc
e (k
N)
Bearing Type I; Exp.#1
Model: SI =0.35& K=0.30
-150 -100 -50 0 50 100 150-40
-20
0
20
40
Displacement (mm)
Forc
e (k
N)
Bearing Type II; Exp.#10
Model: SI=0.16 & K= SP=0.15
(c) Monotonic experimental behavior of Type I bearing fit with sliding model
(d) Cyclic experimental behavior of Type II bearingfit with sliding model
Figure 3. Modeling of sliding bearing elements.
Nonlinear bearing models
Nonlinear column piers
Nonlinear wall piers
Linear grid deck model
Nonlinear abutment backwalls
(a) Bridge CsS40T1F (b) Bridge SlW15T1F
Figure 2. Representative finite element meshes for two prototype bridges.
1380 E. T. FILIPOV ET AL.
Copyright © 2013 John Wiley & Sons, Ltd. Earthquake Engng Struct. Dyn. 2013; 42:1375–1394DOI: 10.1002/eqe
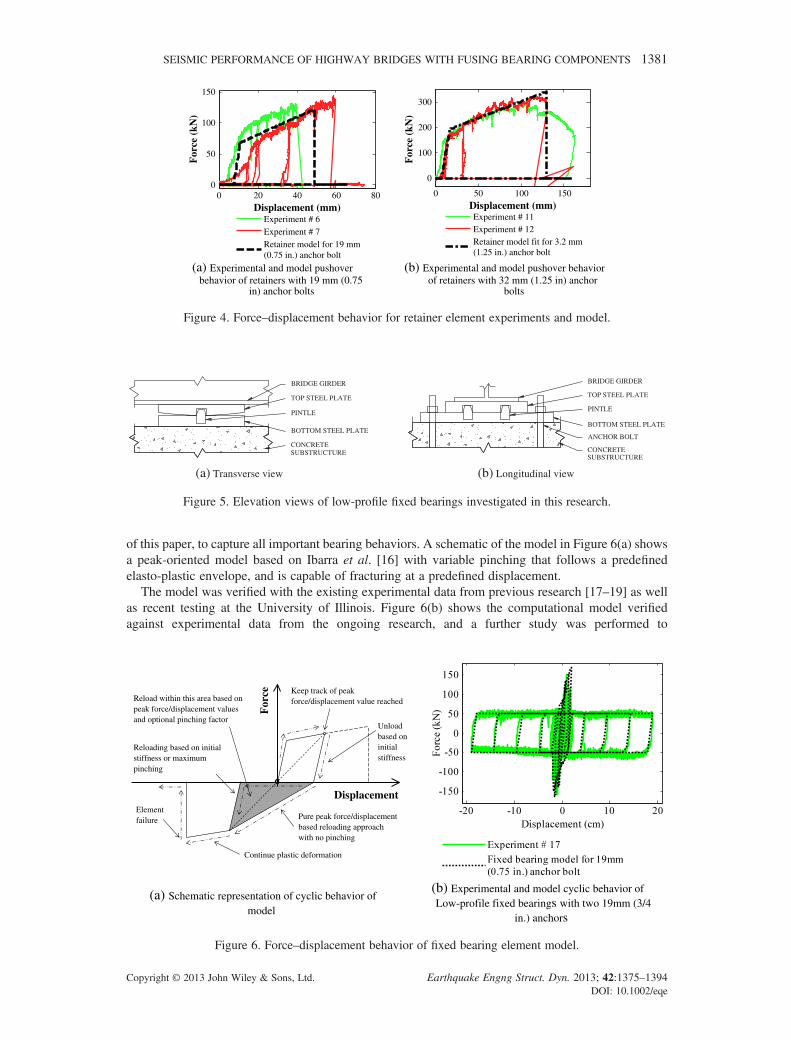
of this paper, to capture all important bearing behaviors. A schematic of the model in Figure 6(a) showsa peak-oriented model based on Ibarra et al. [16] with variable pinching that follows a predefinedelasto-plastic envelope, and is capable of fracturing at a predefined displacement.
The model was verified with the existing experimental data from previous research [17–19] as wellas recent testing at the University of Illinois. Figure 6(b) shows the computational model verifiedagainst experimental data from the ongoing research, and a further study was performed to
BRIDGE GIRDER
PINTLE
BOTTOM STEEL PLATE
CONCRETESUBSTRUCTURE
TOP STEEL PLATE
BRIDGE GIRDER
PINTLE
BOTTOM STEEL PLATE
ANCHOR BOLT
CONCRETESUBSTRUCTURE
TOP STEEL PLATE
(a) Transverse view (b) Longitudinal view
Figure 5. Elevation views of low-profile fixed bearings investigated in this research.
Keep track of peak force/displacement value reached
Unload based on initial stiffness
Pure peak force/displacement based reloading approach with no pinching
Element failure
For
ce
Displacement
Reload within this area based on peak force/displacement values and optional pinching factor
Reloading based on initial stiffness or maximum pinching
Continue plastic deformation
(a) Schematic representation of cyclic behavior of model
(b) Experimental and model cyclic behavior ofLow-profile fixed bearings with two 19mm (3/4
in.) anchors
Figure 6. Force–displacement behavior of fixed bearing element model.
0 20 40 60 800
50
100
150
Displacement (mm)F
orce
(kN
)
Experiment # 6Experiment # 7Retainer model for 19 mm(0.75 in.) anchor bolt
0 50 100 150
0
100
200
300
Displacement (mm)
For
ce (
kN)
Experiment # 11Experiment # 12Retainer model fit for 3.2 mm(1.25 in.) anchor bolt
(a) Experimental and model pushover behavior of retainers with 19 mm (0.75
in) anchor bolts
(b) Experimental and model pushover behaviorof retainers with 32 mm (1.25 in) anchor
bolts
Figure 4. Force–displacement behavior for retainer element experiments and model.
SEISMIC PERFORMANCE OF HIGHWAY BRIDGES WITH FUSING BEARING COMPONENTS 1381
Copyright © 2013 John Wiley & Sons, Ltd. Earthquake Engng Struct. Dyn. 2013; 42:1375–1394DOI: 10.1002/eqe
determine the influence of the fixed bearings on the bridge system [20]. Constant friction(mSI = mSP = mK = 0.30) with the model shown in Section 2.3 was coupled with the fixed bearingmodel, and the anchor bolt capacity was calculated on the basis of the standard design equation forbolts in shear:
PFIXED EXPECTED ¼ ’0:6 � 0:8AbFu (2)
This equation uses the factor 0.8 to account for the reduction of anchor bolt area at a threadedsection where a nominal diameter (Ab) is used, and the factor of 0.6 is based on the von Misesfailure criterion and relates tension and shear strengths, assuming that a pure shear failure occurs inthe critical components. The proposed nonlinear model with capacity per Equation (2) with ’ = 1and Fu = 415MPa (60 ksi) provides a reasonable behavior estimate for the low-profile fixed bearings.A detailed description of the model is available [6], and the formulation can be easily adapted tosimulate additional experimental data of other similar fixed bearing components.
3. EARTHQUAKE SIMULATION FOR PARAMETRIC STUDY
The bridges in this parametric study are subjected to response history analyses with different groundmotions to assess the impact of several important parameters: the characteristics of the seismichazard, the intensity of earthquake excitation, and the different directions of shaking.
3.1. Seismic hazard quantification
On the basis of studies of the NMSZ, researchers have developed various synthetic records that modeldifferent soil characteristics in the Mississippi embayment [21]. From these ground motions, two setsof 10 synthetic records model a 7% in 75-year exceedence probability (1000-year recurrence event) forsouthern Illinois for locations with rock (Cape Girardeau, MO–CG records, 10m soil column) and soil(Paducah, KY–Pa records, 120m soil column) site conditions. The current research does not include theeffects of vertical acceleration because recent research [22] indicates that horizontal-to-vertical component(H/V) spectral ratios for the region are relatively high with values between 2 and 4 in the low-frequencyrange (frequency≤ 5Hz). Furthermore, because the project is aimed at bridges in southern Illinois, aregion roughly 200� 400 km (125� 250miles) located north of the New Madrid fault zone, andbecause vertical accelerations attenuate quickly from the source, they are expected to have little effectfor most structures in the area. Initial studies of the quasi-isolated systems have also indicated thatsliding forces, which may be influenced by vertical accelerations, are typically much smaller and of lesssignificance than the yield capacities of retainers, fixed bearings, and backwalls.
3.2. Scaling of ground motions
The parametric suite contains bridges with elastic first-mode natural periods varying from 0.2 to over1 s, and effective periods increase greatly as nonlinearities occur during analysis; thus, ground motionswere normalized on the basis of a technique used by Somerville et al. [23], which uses a least-squaresapproach to normalize ground motions to a specific target spectrum. The methodology was used to fitthe synthetic ground motions to a 1000-year recurrence design spectrum for Cairo, Illinois, fromAASHTO [24]. The CG rock records are normalized to the design spectrum for Soil Class B, andthe Pa soil records are normalized to the design spectrum for Soil Class D at the location.
Figure 7 shows the ground motion spectra normalized to the respective design spectra, and theseground motions constitute the baseline hazard used in this research. The ground motions as shownare defined to be at a scale factor (SF) of 1.0 and are linearly scaled up and down to provide relativeestimates of structural performance for different hazard levels. Cairo, Illinois, has one of the highesthazards for the state and a reasonably high hazard for the NMSZ. Other locations in the regionwould typically have lower hazards, so as an example the design spectrum hazard in Carbondale,Illinois can be approximated by scaling the baseline ground motions with a factor of 0.5. The
1382 E. T. FILIPOV ET AL.
Copyright © 2013 John Wiley & Sons, Ltd. Earthquake Engng Struct. Dyn. 2013; 42:1375–1394DOI: 10.1002/eqe
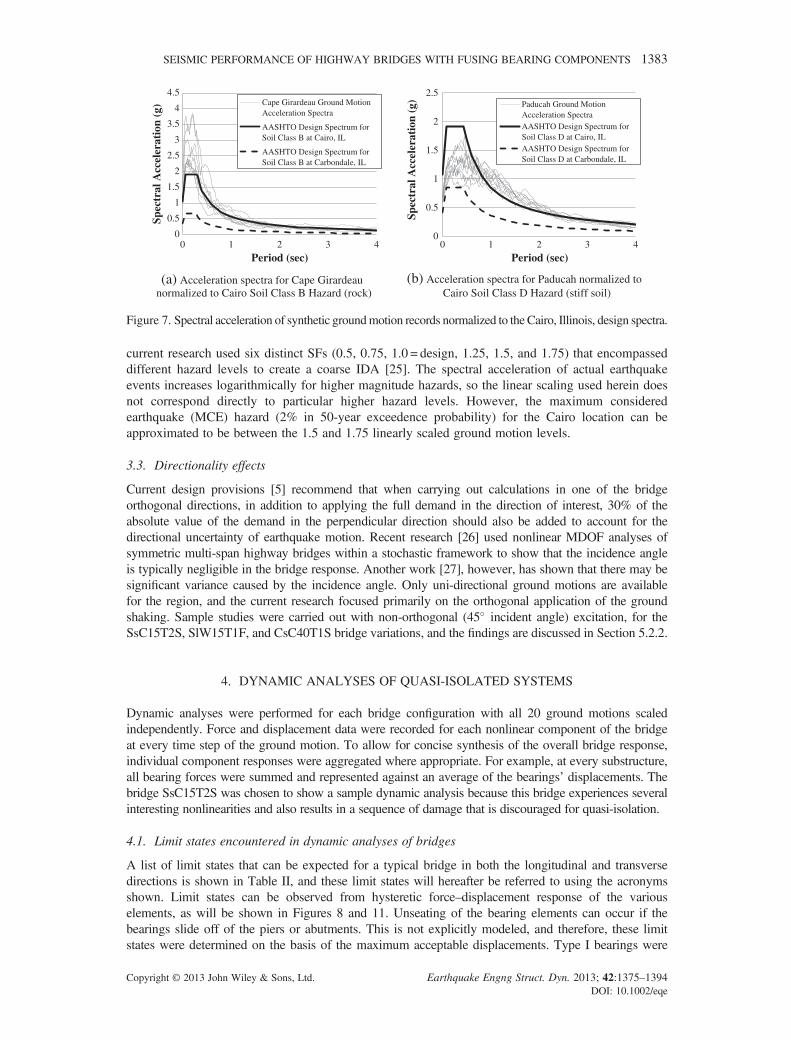
current research used six distinct SFs (0.5, 0.75, 1.0 = design, 1.25, 1.5, and 1.75) that encompasseddifferent hazard levels to create a coarse IDA [25]. The spectral acceleration of actual earthquakeevents increases logarithmically for higher magnitude hazards, so the linear scaling used herein doesnot correspond directly to particular higher hazard levels. However, the maximum consideredearthquake (MCE) hazard (2% in 50-year exceedence probability) for the Cairo location can beapproximated to be between the 1.5 and 1.75 linearly scaled ground motion levels.
3.3. Directionality effects
Current design provisions [5] recommend that when carrying out calculations in one of the bridgeorthogonal directions, in addition to applying the full demand in the direction of interest, 30% of theabsolute value of the demand in the perpendicular direction should also be added to account for thedirectional uncertainty of earthquake motion. Recent research [26] used nonlinear MDOF analyses ofsymmetric multi-span highway bridges within a stochastic framework to show that the incidence angleis typically negligible in the bridge response. Another work [27], however, has shown that there may besignificant variance caused by the incidence angle. Only uni-directional ground motions are availablefor the region, and the current research focused primarily on the orthogonal application of the groundshaking. Sample studies were carried out with non-orthogonal (45� incident angle) excitation, for theSsC15T2S, SlW15T1F, and CsC40T1S bridge variations, and the findings are discussed in Section 5.2.2.
4. DYNAMIC ANALYSES OF QUASI-ISOLATED SYSTEMS
Dynamic analyses were performed for each bridge configuration with all 20 ground motions scaledindependently. Force and displacement data were recorded for each nonlinear component of the bridgeat every time step of the ground motion. To allow for concise synthesis of the overall bridge response,individual component responses were aggregated where appropriate. For example, at every substructure,all bearing forces were summed and represented against an average of the bearings’ displacements. Thebridge SsC15T2S was chosen to show a sample dynamic analysis because this bridge experiences severalinteresting nonlinearities and also results in a sequence of damage that is discouraged for quasi-isolation.
4.1. Limit states encountered in dynamic analyses of bridges
A list of limit states that can be expected for a typical bridge in both the longitudinal and transversedirections is shown in Table II, and these limit states will hereafter be referred to using the acronymsshown. Limit states can be observed from hysteretic force–displacement response of the variouselements, as will be shown in Figures 8 and 11. Unseating of the bearing elements can occur if thebearings slide off of the piers or abutments. This is not explicitly modeled, and therefore, these limitstates were determined on the basis of the maximum acceptable displacements. Type I bearings were
0
0.5
1
1.5
2
2.5
3
3.5
4
4.5
0 1 2 3 4
Spec
tral
Acc
eler
atio
n (g
)
Period (sec)
Cape Girardeau Ground MotionAcceleration Spectra
AASHTO Design Spectrum forSoil Class B at Cairo, IL
AASHTO Design Spectrum forSoil Class B at Carbondale, IL
0
0.5
1
1.5
2
2.5
0 1 2 3 4
Spec
tral
Acc
eler
atio
n (g
)
Period (sec)
Paducah Ground MotionAcceleration SpectraAASHTO Design Spectrum forSoil Class D at Cairo, ILAASHTO Design Spectrum forSoil Class D at Carbondale, IL
(a) Acceleration spectra for Cape Girardeau normalized to Cairo Soil Class B Hazard (rock)
(b) Acceleration spectra for Paducah normalized toCairo Soil Class D Hazard (stiff soil)
Figure 7. Spectral acceleration of synthetic groundmotion records normalized to the Cairo, Illinois, design spectra.
SEISMIC PERFORMANCE OF HIGHWAY BRIDGES WITH FUSING BEARING COMPONENTS 1383
Copyright © 2013 John Wiley & Sons, Ltd. Earthquake Engng Struct. Dyn. 2013; 42:1375–1394DOI: 10.1002/eqe
experimentally shown to be reliable when subjected to large slip travel with a gravity-induced averagecompression stress within the range of 1.38 to 5.52MPa (200 to 800 psi) [15] , and the model definedin Section 2.3 was considered to be valid as long as there was sufficient contact between the bearingand the concrete substructure. Pier caps and abutment seats were considered to be dimensioned on thebasis of the IDOT Bridge Manual [7] equation, which takes into account the width of thesuperstructure, length between expansion joints, height of the piers, and the 1 s period design spectralacceleration for the bridge. Type I bearing unseating was assumed when any part of the elastomerbase extended beyond the edge of the pier cap. Type II bearings were tested to displacements largeenough so that the top plate was not in full contact with the bottom plate. Highly nonlinear and unstablebehaviors were observed for these bearings when the contact area decreased, so unseating was assumedto occur when the contact distance became less than 7.5 cm (3 in.). For example, Type II 7-b bearings,used at the abutments of steel short (Ss) structures, are assumed to begin unseating at a longitudinaldisplacement of 10.5 cm (4 in.). Unseating of the bearings can cause extensive damage to thesuperstructure, substructure, and diaphragm elements, or lead to a local or global collapse of the girders.Also, after unseating occurs, the validity of the computational models becomes questionable and thesystem is considered to have reached a critical limit state. However, this type of unseating for Type IIbearings is not considered unacceptable on the basis of current IDOT ERS philosophy because it doesnot necessarily lead to a loss of span.
Although a nonlinear model was used to simulate the behavior of the flexible foundation boundarycondition, no significant nonlinearity was encountered in the foundation elements, and limit states werenot encountered for the foundation systems. Because robust steel H-pile foundations were used both atthe abutments and at the piers, other types of foundations used in Illinois may experience morenonlinear behavior under similar seismic excitation. In the future, base shear data from this study canbe used to determine if other foundation systems may be applicable for carrying quasi-isolated bridges.
When subjecting a bridge to transverse excitation, the limit states of bearings sliding and retainersfailing are technically considered as independent events; however, by inspection of the results, it
-20 0 20-0.2
0
0.2
Bearing disp.(cm)
Bea
ring
for
ce(M
N) Abutment #1
-10 -5 0
-4
-2
0
Backwall disp. (cm)
Bac
kwal
l for
ce(M
N)
-20 0 20-0.5
0
0.5
Bearing disp.(cm)
Bea
ring
for
ce(M
N) Pier #1
-5 0 5-1
0
1
Rel. pier disp.(cm)
Pier
for
ce(M
N)
-1 0 1
-1
0
1
Bearing disp.(cm)
Bea
ring
for
ce(M
N) Pier #2
-10 0 10-1
0
1
Rel. pier disp.(cm)
Pier
for
ce(M
N)
-20 0 20-0.2
0
0.2
Bearing disp.(cm)
Bea
ring
for
ce(M
N) Abutment #2
0 5 100
5
Backwall disp. (cm)
Bac
kwal
l for
ce(M
N)
SF=1.5 : Ground motion Pa 03Max. relative displacement , and force
SF=0.5 : Ground motion Pa 03Max. relative displacement , and force
Figure 8. Longitudinal behavior of the SsC15T2S bridge subjected to pure longitudinal excitation.
Table II. Typical limit states observed in bridge prototypes.
Acceptable for quasi-isolation Acceptable as Level 3 fusing for quasi-isolation
EA—elastomeric bearings slide at abutment P1—Pier 1 yieldsEP—elastomeric bearings slide at Pier 1 P2—Pier 2 yieldsRA—retainer failure at abutmentRP—retainer failure at Pier 1 Discouraged for quasi-isolation
Fb—fixed (low-profile) bearing anchorage failure UA—unseating of bearing at abutmentBw—backwall yielding UP—unseating of bearing at pier
1384 E. T. FILIPOV ET AL.
Copyright © 2013 John Wiley & Sons, Ltd. Earthquake Engng Struct. Dyn. 2013; 42:1375–1394DOI: 10.1002/eqe
was noted that the retainers had a much larger influence on global behavior than did the bearings. Theretainer capacity was the primary factor controlling the force transferred between superstructure andsubstructure, and until the retainers had failed, the system movement and relative bearingdisplacements remained essentially zero. Therefore, when considering limit states for transverseanalyses, only the retainer failure limit states (RA and RP) are used hereafter, indicating simultaneousoccurrence of the elastomeric bearing sliding limit states (EA and EP).
4.2. Longitudinal dynamic behavior of bridge type SsC15T2S
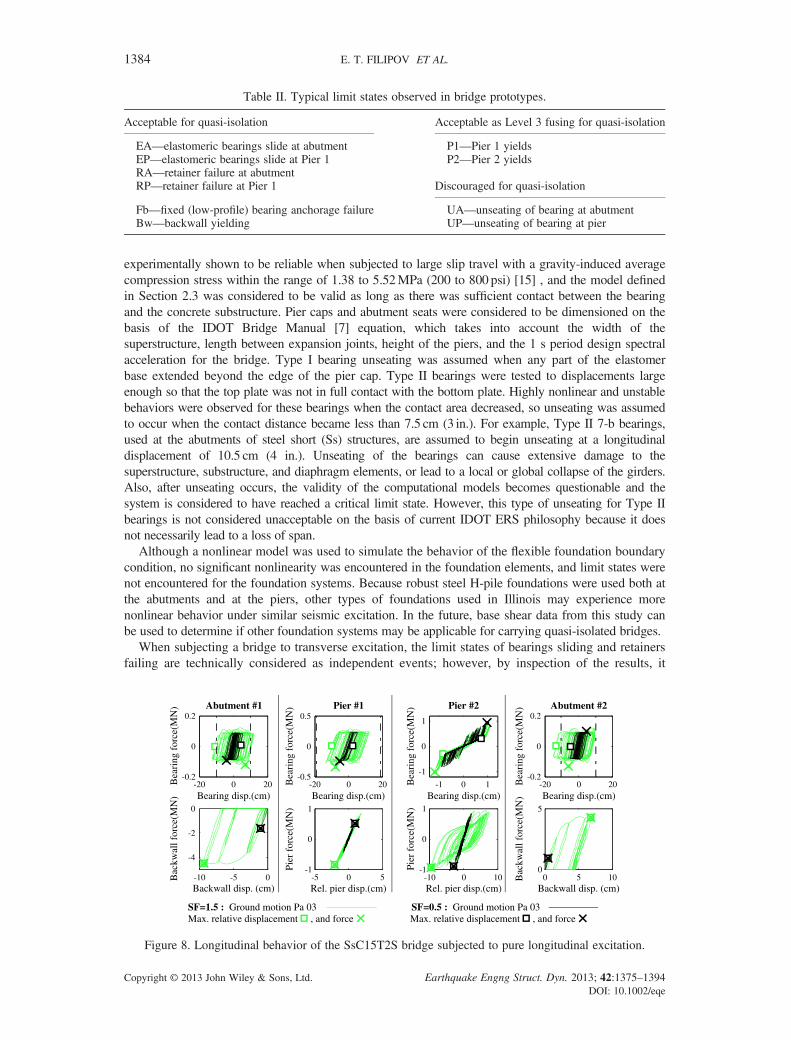
The longitudinal force–displacement hysteretic behaviors of the bearings, backwalls, and piers of theSsC15T2S bridge are shown in Figure 8. The bridge was subjected to pure longitudinal groundshaking from one of the Pa ground motions with SFs of 0.5 and 1.5. The relative pier displacementwas calculated by taking the top of the pier displacement and subtracting the foundation sheardeformation and the base rotation times the pier height, thereby giving a force–displacementbehavior that is comparable for different foundations and pier heights. In Figure 8, the maximumrecorded forces and relative displacements are shown with Xs and squares, respectively. Relativedisplacements of the bearings indicate the magnitude of movement at the sliding interface (i.e., thedisplacement when the bearing lateral force is unloaded).
Figure 8 shows the occurrence of several interesting nonlinear behaviors for the typical longitudinalanalyses. The ground motion applied at SF = 0.5 results in only elastic deformation of the columnpiers, and there is minor elastic contact with the backwalls. However, when the motion is appliedwith SF = 1.5, column Pier 2 experiences yielding, the backwall is engaged and experiencesnonlinear deformation, and the bearings slide much more, subsequently unseating at Abutment 2(where the UA limit state is indicated by the vertical dash–dot lines).
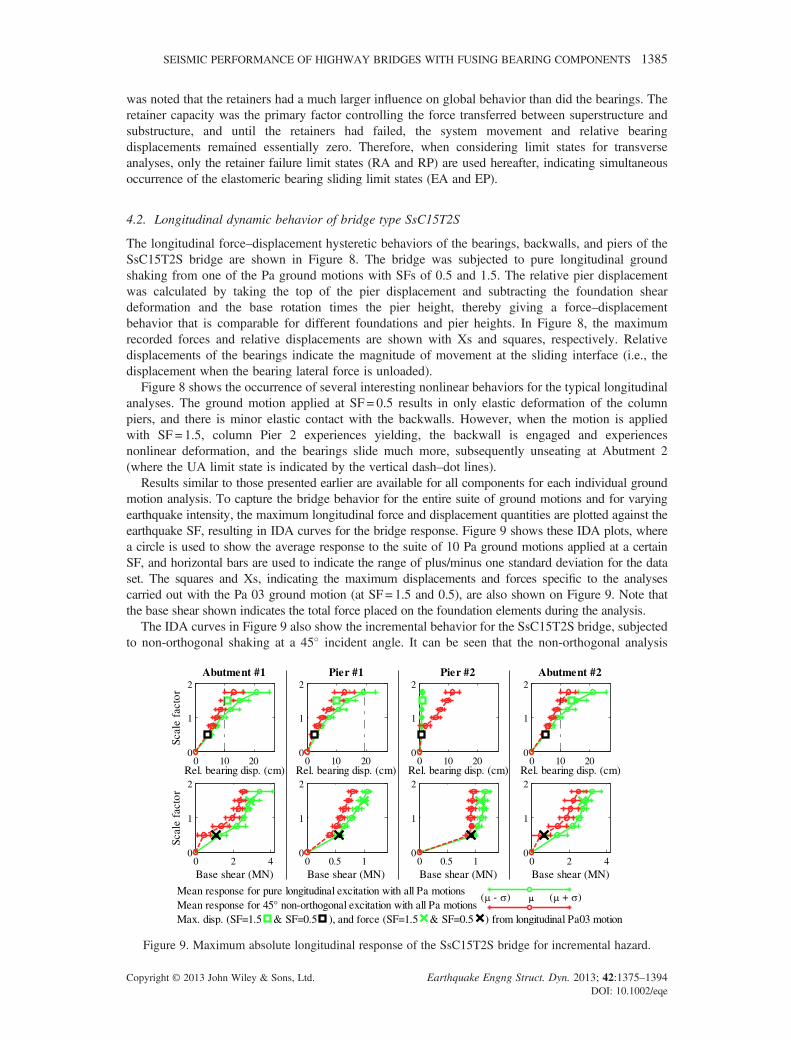
Results similar to those presented earlier are available for all components for each individual groundmotion analysis. To capture the bridge behavior for the entire suite of ground motions and for varyingearthquake intensity, the maximum longitudinal force and displacement quantities are plotted against theearthquake SF, resulting in IDA curves for the bridge response. Figure 9 shows these IDA plots, wherea circle is used to show the average response to the suite of 10 Pa ground motions applied at a certainSF, and horizontal bars are used to indicate the range of plus/minus one standard deviation for the dataset. The squares and Xs, indicating the maximum displacements and forces specific to the analysescarried out with the Pa 03 ground motion (at SF= 1.5 and 0.5), are also shown on Figure 9. Note thatthe base shear shown indicates the total force placed on the foundation elements during the analysis.
The IDA curves in Figure 9 also show the incremental behavior for the SsC15T2S bridge, subjectedto non-orthogonal shaking at a 45� incident angle. It can be seen that the non-orthogonal analysis
0 10 200
1
2
Scal
e fa
ctor
Rel. bearing disp. (cm)
Abutment #1
0 10 200
1
2
Rel. bearing disp. (cm)
Pier #1
0 10 200
1
2
Rel. bearing disp. (cm)
Pier #2
0 10 200
1
2
Rel. bearing disp. (cm)
Abutment #2
0 2 40
1
2
Scal
e fa
ctor
Base shear (MN)0 0.5 1
0
1
2
Base shear (MN)0 0.5 1
0
1
2
Base shear (MN)0 2 4
0
1
2
Base shear (MN)
Mean response for pure longitudinal excitation with all Pa motionsMean response for 45° non-orthogonal excitation with all Pa motions
( - ) ( + )
Max. disp. (SF=1.5 & SF=0.5 ), and force (SF=1.5 & SF=0.5 ) from longitudinal Pa03 motion
Figure 9. Maximum absolute longitudinal response of the SsC15T2S bridge for incremental hazard.
SEISMIC PERFORMANCE OF HIGHWAY BRIDGES WITH FUSING BEARING COMPONENTS 1385
Copyright © 2013 John Wiley & Sons, Ltd. Earthquake Engng Struct. Dyn. 2013; 42:1375–1394DOI: 10.1002/eqe
causes the fixed bearing components at Pier 2 to fracture at SF = 1.0 and slide, whereas the purelongitudinal case causes only minor nonlinear behavior. For the non-orthogonal shaking, thecoupled longitudinal and transverse forces exceed the bearing capacity, whereas in the purelongitudinal case, Pier 2 experienced yielding before the fixed bearings fracture, as can be observedfrom the third column of base shear plots shown in Figure 9. Finally, these IDA plots show that,with the exception of the Pier 2 fixed bearing displacements, all other force and displacementresponses are greater for the pure longitudinal excitation. The non-orthogonal shaking case alsoshows similar results when compared with pure transverse excitation in Section 4.3. Similar resultswere noted from the SlW15T1F and CsC40T1S bridges, and it was concluded that non-orthogonalshaking was overall not as critical as shaking in a single orthogonal direction.
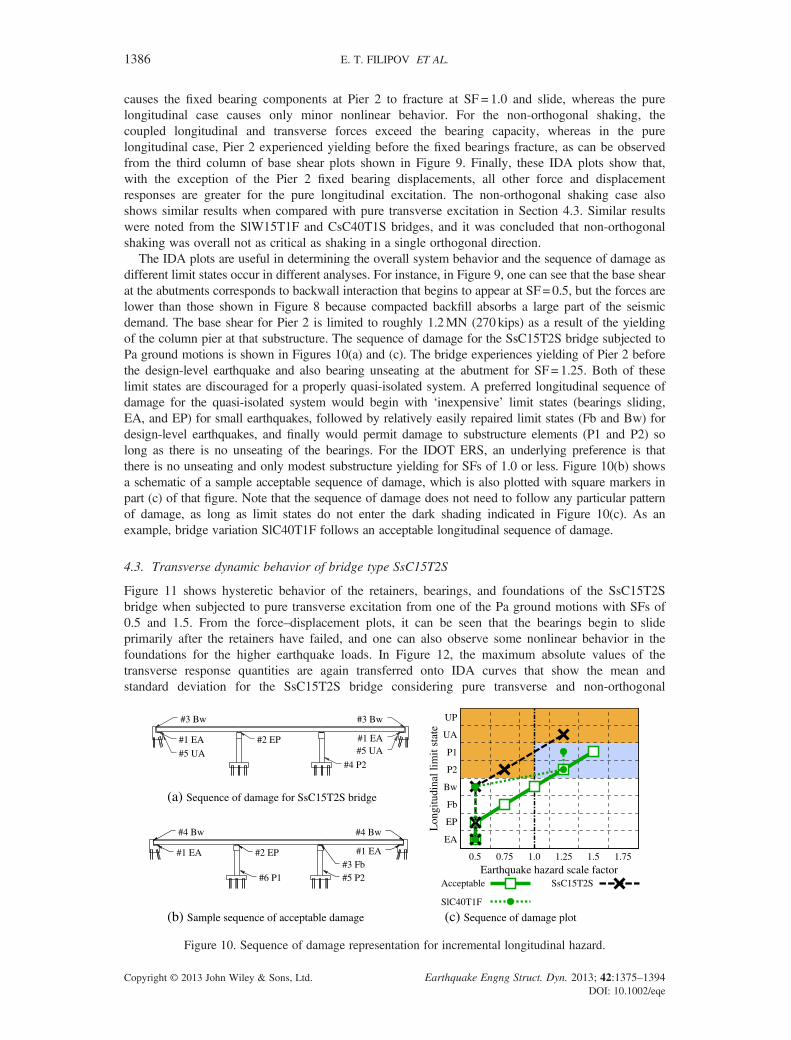
The IDA plots are useful in determining the overall system behavior and the sequence of damage asdifferent limit states occur in different analyses. For instance, in Figure 9, one can see that the base shearat the abutments corresponds to backwall interaction that begins to appear at SF= 0.5, but the forces arelower than those shown in Figure 8 because compacted backfill absorbs a large part of the seismicdemand. The base shear for Pier 2 is limited to roughly 1.2MN (270 kips) as a result of the yieldingof the column pier at that substructure. The sequence of damage for the SsC15T2S bridge subjected toPa ground motions is shown in Figures 10(a) and (c). The bridge experiences yielding of Pier 2 beforethe design-level earthquake and also bearing unseating at the abutment for SF= 1.25. Both of theselimit states are discouraged for a properly quasi-isolated system. A preferred longitudinal sequence ofdamage for the quasi-isolated system would begin with ‘inexpensive’ limit states (bearings sliding,EA, and EP) for small earthquakes, followed by relatively easily repaired limit states (Fb and Bw) fordesign-level earthquakes, and finally would permit damage to substructure elements (P1 and P2) solong as there is no unseating of the bearings. For the IDOT ERS, an underlying preference is thatthere is no unseating and only modest substructure yielding for SFs of 1.0 or less. Figure 10(b) showsa schematic of a sample acceptable sequence of damage, which is also plotted with square markers inpart (c) of that figure. Note that the sequence of damage does not need to follow any particular patternof damage, as long as limit states do not enter the dark shading indicated in Figure 10(c). As anexample, bridge variation SlC40T1F follows an acceptable longitudinal sequence of damage.
4.3. Transverse dynamic behavior of bridge type SsC15T2S
Figure 11 shows hysteretic behavior of the retainers, bearings, and foundations of the SsC15T2Sbridge when subjected to pure transverse excitation from one of the Pa ground motions with SFs of0.5 and 1.5. From the force–displacement plots, it can be seen that the bearings begin to slideprimarily after the retainers have failed, and one can also observe some nonlinear behavior in thefoundations for the higher earthquake loads. In Figure 12, the maximum absolute values of thetransverse response quantities are again transferred onto IDA curves that show the mean andstandard deviation for the SsC15T2S bridge considering pure transverse and non-orthogonal
#1 EA #1 EA#2 EP
#4 P2#5 UA #5 UA
#3 Bw #3 Bw
0.5 0.75 1.0 1.25 1.5 1.75
EA
EP
Fb
Bw
P2
P1
UA
UP
Earthquake hazard scale factor
Lon
gitu
dina
l lim
it st
ate
Acceptable SsC15T2S
SlC40T1F
(a) Sequence of damage for SsC15T2S bridge
#1 EA #1 EA#2 EP
#5 P2
#4 Bw #4 Bw
#6 P1#3 Fb
(b) Sample sequence of acceptable damage (c) Sequence of damage plot
Figure 10. Sequence of damage representation for incremental longitudinal hazard.
1386 E. T. FILIPOV ET AL.
Copyright © 2013 John Wiley & Sons, Ltd. Earthquake Engng Struct. Dyn. 2013; 42:1375–1394DOI: 10.1002/eqe
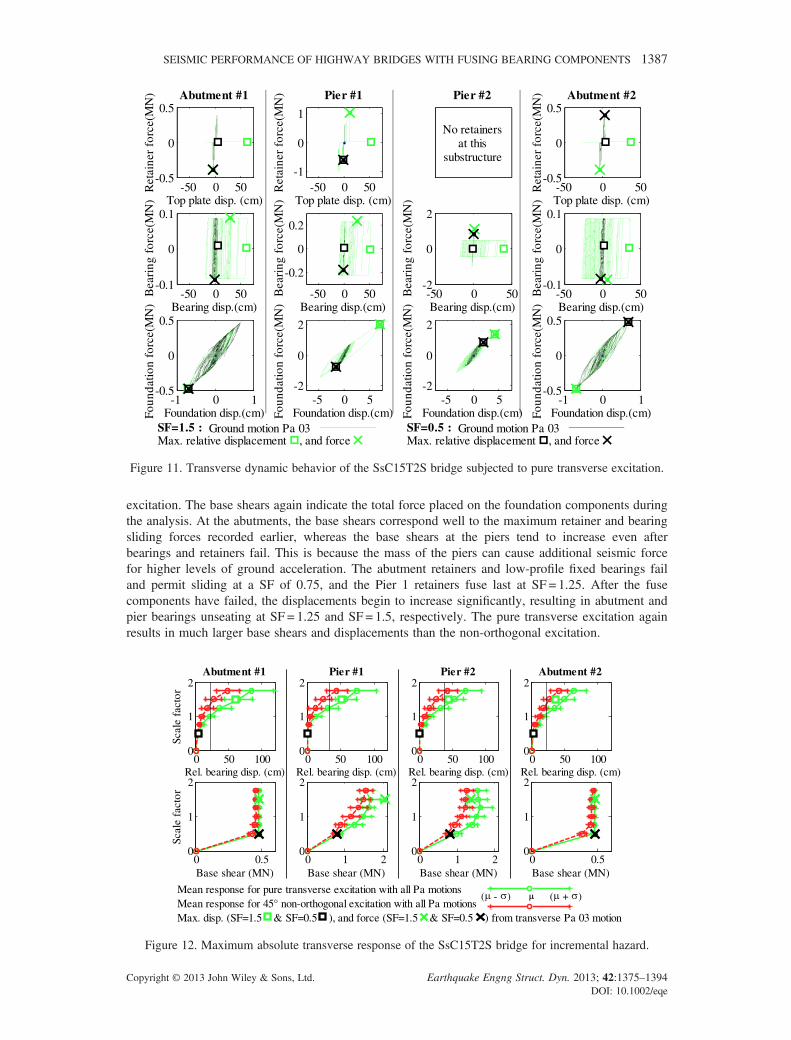
excitation. The base shears again indicate the total force placed on the foundation components duringthe analysis. At the abutments, the base shears correspond well to the maximum retainer and bearingsliding forces recorded earlier, whereas the base shears at the piers tend to increase even afterbearings and retainers fail. This is because the mass of the piers can cause additional seismic forcefor higher levels of ground acceleration. The abutment retainers and low-profile fixed bearings failand permit sliding at a SF of 0.75, and the Pier 1 retainers fuse last at SF = 1.25. After the fusecomponents have failed, the displacements begin to increase significantly, resulting in abutment andpier bearings unseating at SF = 1.25 and SF = 1.5, respectively. The pure transverse excitation againresults in much larger base shears and displacements than the non-orthogonal excitation.
0 50 1000
1
2
Scal
e fa
ctor
Rel. bearing disp. (cm)
Abutment #1
0 50 1000
1
2
Rel. bearing disp. (cm)
Pier #1
0 50 1000
1
2
Rel. bearing disp. (cm)
Pier #2
0 50 1000
1
2
Rel. bearing disp. (cm)
Abutment #2
0 0.50
1
2
Scal
e fa
ctor
Base shear (MN)0 1 2
0
1
2
Base shear (MN)0 1 2
0
1
2
Base shear (MN)0 0.5
0
1
2
Base shear (MN)
Mean response for pure transverse excitation with all Pa motionsMean response for 45° non-orthogonal excitation with all Pa motions
( - ) ( + )
Max. disp. (SF=1.5 & SF=0.5 ), and force (SF=1.5 & SF=0.5 ) from transverse Pa 03 motion
Figure 12. Maximum absolute transverse response of the SsC15T2S bridge for incremental hazard.
-50 0 50-0.5
0
0.5
Top plate disp. (cm)
Ret
aine
r fo
rce(
MN
) Abutment #1
-50 0 50-0.1
0
0.1
Bearing disp.(cm)
Bea
ring
for
ce(M
N)
-1 0 1-0.5
0
0.5
Foundation disp.(cm)Foun
datio
n fo
rce(
MN
)
-50 0 50-1
0
1
Top plate disp. (cm)
Ret
aine
r fo
rce(
MN
) Pier #1
-50 0 50
-0.2
0
0.2
Bearing disp.(cm)
Bea
ring
for
ce(M
N)
-5 0 5-2
0
2
Foundation disp.(cm)Foun
datio
n fo
rce(
MN
)
Pier #2
-50 0 50-2
0
2
Bearing disp.(cm)
Bea
ring
for
ce(M
N)
-5 0 5-2
0
2
Foundation disp.(cm)Foun
datio
n fo
rce(
MN
)
-50 0 50-0.5
0
0.5
Top plate disp. (cm)
Ret
aine
r fo
rce(
MN
) Abutment #2
-50 0 50-0.1
0
0.1
Bearing disp.(cm)
Bea
ring
for
ce(M
N)
-1 0 1-0.5
0
0.5
Foundation disp.(cm)Foun
datio
n fo
rce(
MN
)
No retainersat this
substructure
SF=1.5 : Ground motion Pa 03Max. relative displacement , and force
SF=0.5 : Ground motion Pa 03Max. relative displacement , and force
Figure 11. Transverse dynamic behavior of the SsC15T2S bridge subjected to pure transverse excitation.
SEISMIC PERFORMANCE OF HIGHWAY BRIDGES WITH FUSING BEARING COMPONENTS 1387
Copyright © 2013 John Wiley & Sons, Ltd. Earthquake Engng Struct. Dyn. 2013; 42:1375–1394DOI: 10.1002/eqe
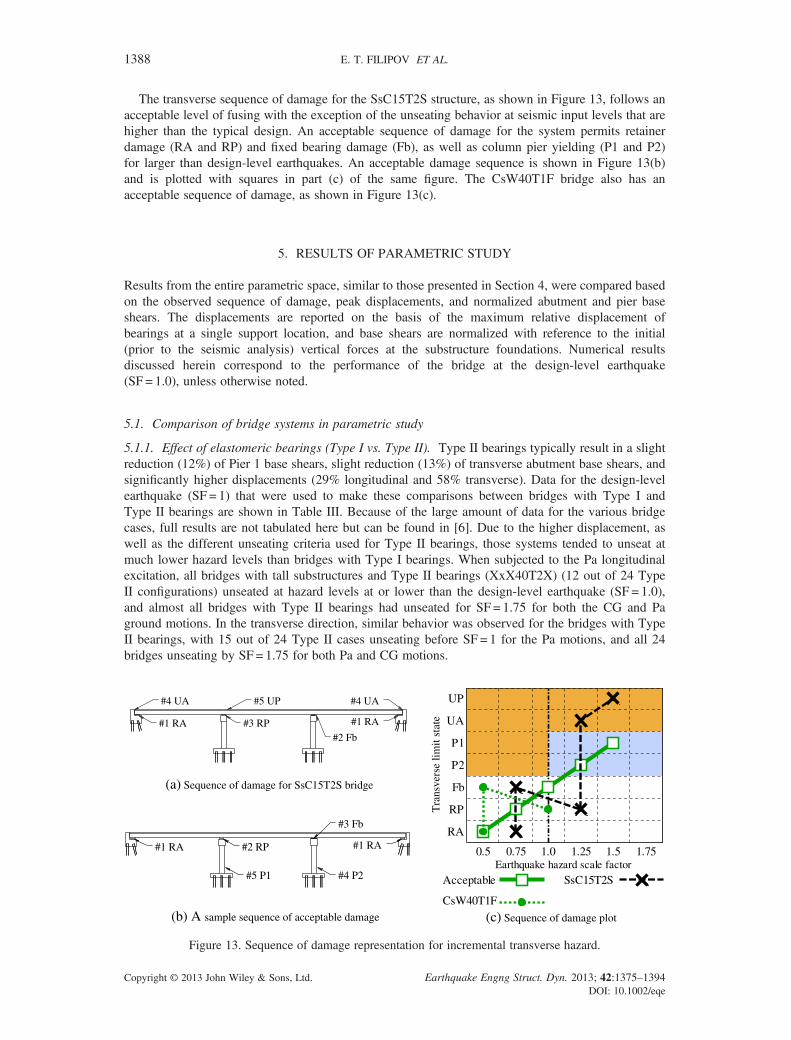
The transverse sequence of damage for the SsC15T2S structure, as shown in Figure 13, follows anacceptable level of fusing with the exception of the unseating behavior at seismic input levels that arehigher than the typical design. An acceptable sequence of damage for the system permits retainerdamage (RA and RP) and fixed bearing damage (Fb), as well as column pier yielding (P1 and P2)for larger than design-level earthquakes. An acceptable damage sequence is shown in Figure 13(b)and is plotted with squares in part (c) of the same figure. The CsW40T1F bridge also has anacceptable sequence of damage, as shown in Figure 13(c).
5. RESULTS OF PARAMETRIC STUDY
Results from the entire parametric space, similar to those presented in Section 4, were compared basedon the observed sequence of damage, peak displacements, and normalized abutment and pier baseshears. The displacements are reported on the basis of the maximum relative displacement ofbearings at a single support location, and base shears are normalized with reference to the initial(prior to the seismic analysis) vertical forces at the substructure foundations. Numerical resultsdiscussed herein correspond to the performance of the bridge at the design-level earthquake(SF = 1.0), unless otherwise noted.
5.1. Comparison of bridge systems in parametric study
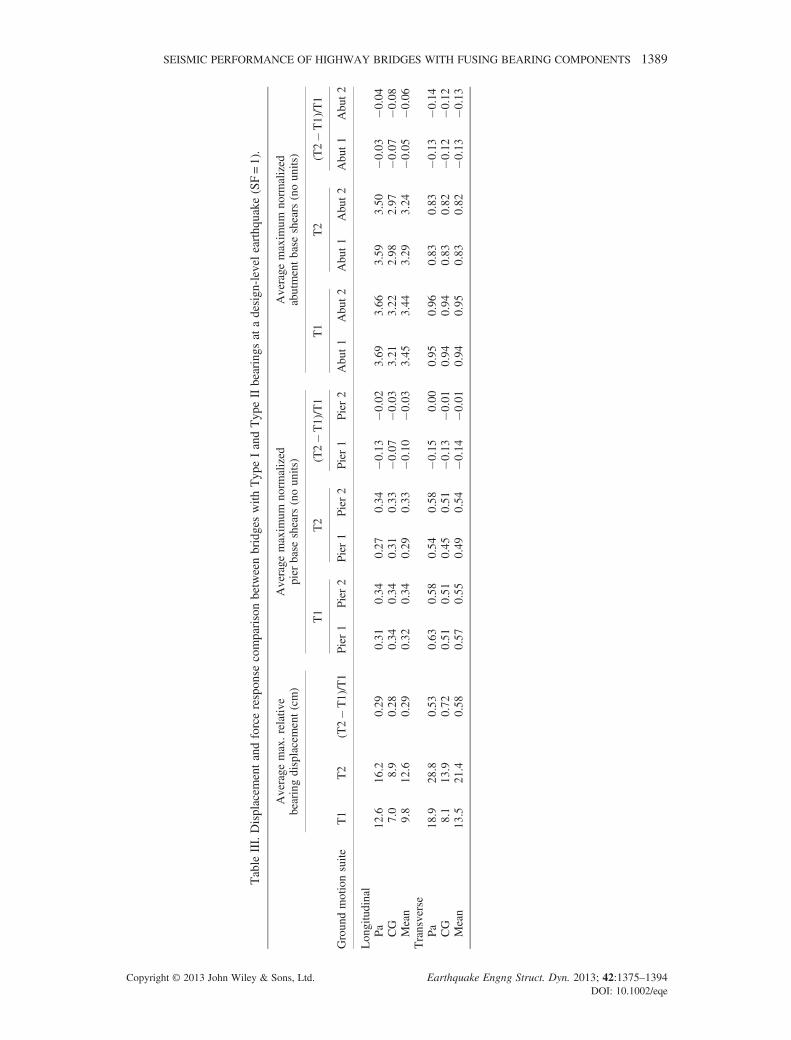
5.1.1. Effect of elastomeric bearings (Type I vs. Type II). Type II bearings typically result in a slightreduction (12%) of Pier 1 base shears, slight reduction (13%) of transverse abutment base shears, andsignificantly higher displacements (29% longitudinal and 58% transverse). Data for the design-levelearthquake (SF = 1) that were used to make these comparisons between bridges with Type I andType II bearings are shown in Table III. Because of the large amount of data for the various bridgecases, full results are not tabulated here but can be found in [6]. Due to the higher displacement, aswell as the different unseating criteria used for Type II bearings, those systems tended to unseat atmuch lower hazard levels than bridges with Type I bearings. When subjected to the Pa longitudinalexcitation, all bridges with tall substructures and Type II bearings (XxX40T2X) (12 out of 24 TypeII configurations) unseated at hazard levels at or lower than the design-level earthquake (SF = 1.0),and almost all bridges with Type II bearings had unseated for SF = 1.75 for both the CG and Paground motions. In the transverse direction, similar behavior was observed for the bridges with TypeII bearings, with 15 out of 24 Type II cases unseating before SF = 1 for the Pa motions, and all 24bridges unseating by SF = 1.75 for both Pa and CG motions.
#1 RA #1 RA#3 RP
#4 UA #4 UA#5 UP
#2 Fb
RA
RP
Fb
P2
P1
UA
UP
Earthquake hazard scale factor
Tra
nsve
rse
limit
stat
e
Acceptable SsC15T2S
CsW40T1F
(a) Sequence of damage for SsC15T2S bridge
#1 RA #1 RA#2 RP
#4 P2#5 P1
#3 Fb
(b) A sample sequence of acceptable damage (c) Sequence of damage plot
0.5 0.75 1.0 1.25 1.5 1.75
Figure 13. Sequence of damage representation for incremental transverse hazard.
1388 E. T. FILIPOV ET AL.
Copyright © 2013 John Wiley & Sons, Ltd. Earthquake Engng Struct. Dyn. 2013; 42:1375–1394DOI: 10.1002/eqe
Table
III.Displacem
entandforceresponse
comparisonbetweenbridgeswith
TypeIandTypeIIbearings
atadesign-level
earthquake
(SF=1).
Groundmotionsuite
Average
max.relativ
ebearingdisplacement(cm)
Average
maxim
umnorm
alized
pier
base
shears
(nounits)
Average
maxim
umnorm
alized
abutmentbase
shears
(nounits)
T1
T2
(T2�T1)/T1
T1
T2
(T2�T1)/T1
T1
T2
(T2�T1)/T1
Pier1
Pier2
Pier1
Pier2
Pier1
Pier2
Abut1
Abut2
Abut1
Abut2
Abut1
Abut2
Longitudinal
Pa
12.6
16.2
0.29
0.31
0.34
0.27
0.34
�0.13
�0.02
3.69
3.66
3.59
3.50
�0.03
�0.04
CG
7.0
8.9
0.28
0.34
0.34
0.31
0.33
�0.07
�0.03
3.21
3.22
2.98
2.97
�0.07
�0.08
Mean
9.8
12.6
0.29
0.32
0.34
0.29
0.33
�0.10
�0.03
3.45
3.44
3.29
3.24
�0.05
�0.06
Transverse
Pa
18.9
28.8
0.53
0.63
0.58
0.54
0.58
�0.15
0.00
0.95
0.96
0.83
0.83
�0.13
�0.14
CG
8.1
13.9
0.72
0.51
0.51
0.45
0.51
�0.13
�0.01
0.94
0.94
0.83
0.82
�0.12
�0.12
Mean
13.5
21.4
0.58
0.57
0.55
0.49
0.54
�0.14
�0.01
0.94
0.95
0.83
0.82
�0.13
�0.13
SEISMIC PERFORMANCE OF HIGHWAY BRIDGES WITH FUSING BEARING COMPONENTS 1389
Copyright © 2013 John Wiley & Sons, Ltd. Earthquake Engng Struct. Dyn. 2013; 42:1375–1394DOI: 10.1002/eqe
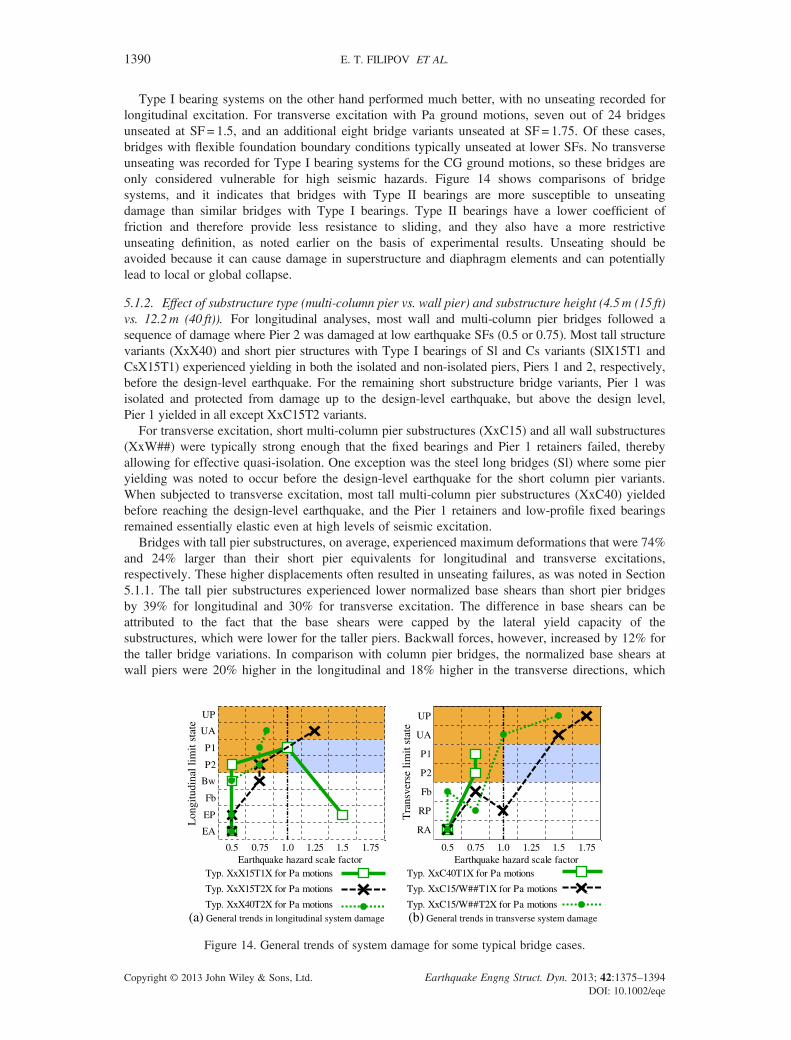
Type I bearing systems on the other hand performed much better, with no unseating recorded forlongitudinal excitation. For transverse excitation with Pa ground motions, seven out of 24 bridgesunseated at SF = 1.5, and an additional eight bridge variants unseated at SF = 1.75. Of these cases,bridges with flexible foundation boundary conditions typically unseated at lower SFs. No transverseunseating was recorded for Type I bearing systems for the CG ground motions, so these bridges areonly considered vulnerable for high seismic hazards. Figure 14 shows comparisons of bridgesystems, and it indicates that bridges with Type II bearings are more susceptible to unseatingdamage than similar bridges with Type I bearings. Type II bearings have a lower coefficient offriction and therefore provide less resistance to sliding, and they also have a more restrictiveunseating definition, as noted earlier on the basis of experimental results. Unseating should beavoided because it can cause damage in superstructure and diaphragm elements and can potentiallylead to local or global collapse.
5.1.2. Effect of substructure type (multi-column pier vs. wall pier) and substructure height (4.5m (15 ft)vs. 12.2m (40 ft)). For longitudinal analyses, most wall and multi-column pier bridges followed asequence of damage where Pier 2 was damaged at low earthquake SFs (0.5 or 0.75). Most tall structurevariants (XxX40) and short pier structures with Type I bearings of Sl and Cs variants (SlX15T1 andCsX15T1) experienced yielding in both the isolated and non-isolated piers, Piers 1 and 2, respectively,before the design-level earthquake. For the remaining short substructure bridge variants, Pier 1 wasisolated and protected from damage up to the design-level earthquake, but above the design level,Pier 1 yielded in all except XxC15T2 variants.
For transverse excitation, short multi-column pier substructures (XxC15) and all wall substructures(XxW##) were typically strong enough that the fixed bearings and Pier 1 retainers failed, therebyallowing for effective quasi-isolation. One exception was the steel long bridges (Sl) where some pieryielding was noted to occur before the design-level earthquake for the short column pier variants.When subjected to transverse excitation, most tall multi-column pier substructures (XxC40) yieldedbefore reaching the design-level earthquake, and the Pier 1 retainers and low-profile fixed bearingsremained essentially elastic even at high levels of seismic excitation.
Bridges with tall pier substructures, on average, experienced maximum deformations that were 74%and 24% larger than their short pier equivalents for longitudinal and transverse excitations,respectively. These higher displacements often resulted in unseating failures, as was noted in Section5.1.1. The tall pier substructures experienced lower normalized base shears than short pier bridgesby 39% for longitudinal and 30% for transverse excitation. The difference in base shears can beattributed to the fact that the base shears were capped by the lateral yield capacity of thesubstructures, which were lower for the taller piers. Backwall forces, however, increased by 12% forthe taller bridge variations. In comparison with column pier bridges, the normalized base shears atwall piers were 20% higher in the longitudinal and 18% higher in the transverse directions, which
EA
EP
Fb
Bw
P2
P1
UA
UP
Earthquake hazard scale factor
Lon
gitu
dina
l lim
it st
ate
Typ. XxX15T1X for Pa motions
Typ. XxX15T2X for Pa motions
Typ. XxX40T2X for Pa motions
RA
RP
Fb
P2
P1
UA
UP
Earthquake hazard scale factorTyp. XxC40T1X for Pa motions
Typ. XxC15/W##T1X for Pa motions
Typ. XxC15/W##T2X for Pa motions(a) General trends in longitudinal system damage (b) General trends in transverse system damage
0.5 0.75 1.0 1.25 1.5 1.75 0.5 0.75 1.0 1.25 1.5 1.75
Tra
nsve
rse
limit
stat
e
Figure 14. General trends of system damage for some typical bridge cases.
1390 E. T. FILIPOV ET AL.
Copyright © 2013 John Wiley & Sons, Ltd. Earthquake Engng Struct. Dyn. 2013; 42:1375–1394DOI: 10.1002/eqe
can again be attributed to the yield capacity of the different systems. The abutment force anddisplacement response did not vary significantly between column and wall pier systems, and thelongitudinal pier response was also similar for the two systems. In the transverse direction, however,wall piers are much stiffer than column piers and experienced 177% higher pier bearingdisplacements and roughly 20% higher normalized pier base shears.
5.1.3. Effect of superstructure type (steel short/steel long/concrete short). As is discussed in Section 5.1.2,the steel long (Sl) superstructures often experienced pier yielding earlier than the other superstructures.This can be attributed to the higher axial load at the substructures, as well as the higher fuse capacities,which are designed as a factor of the dead load. System displacements increased with superstructurelength, and the steel short (Ss) superstructure generally had slightly higher normalized base shears. Thisis primarily because the substructure mass was higher when compared with the superstructure. Therewere slight differences in displacement between the three cases, as the bridges differ in structuralperiod. However, the systems performed about equivalently in terms of unseating, so the seat widthequations effectively incorporate superstructure length.
5.1.4. Effect of foundation stiffness (fixed vs. flexible boundary condition). Bridge cases with flexiblefoundation conditions experienced generally small differences in bearing displacement and normalizedbase shear when compared with the fixed foundation variations. Because the flexible foundations couldaccommodate some displacement, their presence at times altered the sequence of damage such thatpiers and fixed bearings experienced lower forces and were thereby damaged at higher SFs ofexcitation, or were not damaged at all. Because of the higher displacement demands, flexiblevariations were somewhat more prone to unseating, typically reaching the UA or UP limit state at aSF of about 0.25 lower that what was observed for fixed foundation cases (i.e., unseating at SF = 1.5vs. SF = 1.75).
5.2. Other observations on bridge performance
5.2.1. Effect of ground motion type (CG motions vs. Pa motions). Results for all 48 bridge variantssubjected to Pa ground motions were compared with results from the CG ground motions at thedesign-level earthquake hazard. Under longitudinal excitation, Pa ground motions resulted in 81%higher bearing displacements, 4% lower intermediate substructure base shears, and 20% higherabutment backwall forces than the CG counterparts. For transverse excitation, the Pa motionsresulted in 116% higher bearing displacements and 18% higher base shears at the intermediatesubstructures, and the abutment base shears remained equivalent because they were limited by theretainer and bearing sliding force capacity for both types of excitation. The increase in base shear anddisplacements was more significant in structures with longer periods (i.e., Sl vs. Ss superstructure, tallvs. short substructure, and flexible vs. fixed base) that were more susceptible to lower frequencyexcitation. By general observation of damage patterns in the entire parametric space, it was noted thatthe Pa and CG motions produce approximately the same sequence of damage, but the Pa motionsnormally result in limit states being reached at lower SFs of excitation than with the CG motions. Forexample, in the transverse direction, 31% more bridges experienced unseating when subjected to the Pathan the CG motions.
5.2.2. Non-orthogonal (45� incident angle) application of ground motions. Non-orthogonal seismicexcitation was found to be equal or less critical compared with uni-directional ground motionapplication for the quasi-isolated system studied in this paper. The SsC15T2S, SlW15T1F, andCsC40T1S bridge variations were studied with uni-directional and non-orthogonal excitation, and itwas determined that the mean bridge response was less for non-orthogonal ground motionapplication. As can be observed from Figures 9 and 12, the non-orthogonal excitation can often alterthe sequence of damage (that is, cause bearing failure or pier yielding) before it would occur in oneof the orthogonal directions, but the peak displacements and base shears would still be recorded forcases where pure orthogonal excitation is applied. This behavior occurs because the bridge testedwith non-orthogonal excitation takes advantage of multiple lateral systems, including the sideretainers and strong axis of the pier substructures for the transverse force component, and theabutment backwall for the longitudinal force component.
SEISMIC PERFORMANCE OF HIGHWAY BRIDGES WITH FUSING BEARING COMPONENTS 1391
Copyright © 2013 John Wiley & Sons, Ltd. Earthquake Engng Struct. Dyn. 2013; 42:1375–1394DOI: 10.1002/eqe
5.2.3. Performance of bridge systems within the New Madrid Seismic Zone. It is important to notethat the ground motions used in this study were initially normalized to design spectra for Cairo,Illinois, which is nearly the highest hazard for Illinois and the NMSZ in general. This level ofhazard was chosen as the baseline for this study to establish an upper bound on response for Illinoisbridges. Bridges with quasi-isolation systems farther away from the NMSZ and with lower hazardlevels are expected to experience significantly less damage than those shown in this study. Theparametric variations used in this study provide a representative sample of modern bridges in Illinoisthat employ elastomeric bearings and simply supported abutment conditions. The chosen pierheights, span lengths, foundation stiffnesses, and ground motions provide a reasonable selection ofcommon bridge cases in the NMSZ, and it is reasonable to apply the results and recommendationspresented herein to similar structures.
The results from this research are generally consistent with other studies on bridges in the NMSZ.When studying fragilities of wall pier bridges in Illinois, Bignell and LaFave [28] found that overall,bridge systems in the region are expected to experience only moderate damage for the MCE-levelhazard, which is similar to the conclusions herein. Similarly, they noted that pier properties wereimportant in the general bridge response, but in contrast to the study presented in this paper, theyfound that bearings (steel roller, low-profile fixed, and elastomeric in some cases) had little influenceon the bridge fragility. A study of multi-span simply supported bridges by Nielson and DesRoches[29] showed that for the MCE-level hazard, significant vulnerabilities exist at the piers, at theabutments, and in the unseating of girders. The study found that longitudinal and transversedisplacement demands were of the same order, whereas the IDA results shown herein indicate thatfor continuous bridges, transverse deformations tend to be much greater than longitudinal, especiallyat higher degrees of excitation. The difference in deformation demand can be attributed to thebearings used in the previous research, where steel dowels at the intermediate substructures did notfuse and permit sliding as is intended for quasi-isolated systems.
6. CONCLUSIONS
This research investigated the seismic performance of typical bridge configurations currently used in thestate of Illinois. The analyzed bridges featured different superstructures, substructures, foundationstiffnesses, and types of elastomeric bearings. The structures were selected as a representative sampleof bridges in southern Illinois, and performance observations can be generalized to similar systems inthe region. Bridge response was studied using nonlinear numerical models where transient seismicanalyses were carried out for incremental hazard levels. The parametric analyses point to the followingconclusions:
• From the current parametric study, only a few bridge variants were noted to unseat for design-level earthquakes, indicating that most structures in Illinois would not experience severe damageduring their typical design life. Because a high hazard level was used as a baseline to scale theground motions, unseating and span loss are not likely for regions with moderate seismic hazard.
• Bridges with Type II IDOT bearings were shown to be more prone to unseating, as the area of thebearing surface often proved to be insufficient given the magnitude of the displacement demand.Unseating of the bearings is an unstable and unpredictable behavior leading to large displace-ments, potential damage to deck and diaphragm elements, and possible local or global collapse.Tall structures with Type II bearings experienced longitudinal unseating before design-level earth-quakes, and nearly all bridges with Type II bearings experienced both transverse and longitudinalunseating for MCE-level hazards.
• Bridges with Type I bearings showed reliable behavior in preventing system collapse. No unseatingwas noted for longitudinal excitation of these bridges, and unseating of the bearings in the transversedirection was only observed at MCE-level hazard for ground motions scaled on the basis of a designspectrum for Soil Class D ground motions.
• The sequence of damage of most bridge structures indicates some yielding of the piers with fixedbearings for small earthquakes and potential unseating of some bridges for large seismic events,
1392 E. T. FILIPOV ET AL.
Copyright © 2013 John Wiley & Sons, Ltd. Earthquake Engng Struct. Dyn. 2013; 42:1375–1394DOI: 10.1002/eqe
which are both discouraged for quasi-isolation. Calibration of fuse component capacities and revisionof seat width equations can improve the sequence of damage for many bridge systems.
• Displacements in the longitudinal direction are generally much lower than in the transverse direc-tion because of the influence of the backwall elements. For design-level earthquakes, transversebearing displacements were roughly 36% higher than the longitudinal, and the transverse displa-cements increased faster as the intensity of the earthquake increased. This difference arisesbecause after the retainers and fixed bearings have failed, there is no active restraint of the systemin the transverse direction.
• Bridge displacement response was noted to be significantly larger for systems with tall piersubstructures and Type II bearings.
• Ground motions simulating soil site conditions and scaled on the basis of a design spectrum forSoil Class D typically resulted in larger force and displacement demands than rock groundmotions, which were scaled on the basis of a design spectrum for Soil Class B, of similar intensity.The soil ground motions also resulted in more limit states being reached at lower hazard levels.
ACKNOWLEDGEMENTS
This paper is based on the results of ICT R27-70, Calibration and Refinement of Illinois’ Earthquake ResistingSystem Bridge Design Methodology. ICT R27-70 was conducted in cooperation with the Illinois Center forTransportation (ICT); IDOT, Division of Highways; and the US Department of Transportation, FederalHighway Administration (FHWA). The contents of this paper reflect the view of the authors, who areresponsible for the facts and the accuracy of the data presented herein. The contents do not necessarily reflectthe official views or policies of the ICT, IDOT, or FHWA. The authors would like to thank the members ofthe project Technical Review Panel, chaired by D.H. Tobias, for their valuable assistance with this research.Grid resources from the Texas Advanced Computing Center (TACC) at The University of Texas at Austin wereused to generate research results reported within this paper.
REFERENCES
1. Buckle IG. Seismic isolation: history, application, and performance—a world view. Earthquake Spectra 1990; 6(2):161–201.
2. Tobias DH, Anderson RE, Hodel CE, Kramer WM, Wahab RM, Chaput RJ. Overview of earthquake resisting systemdesign and retrofit strategy for bridges in Illinois. Practice Periodical on Structural Design and Construction2008; 13(3):147–158.
3. Buckle IG, Constantinou MC, Dicleli M, Ghasemi H. Seismic Isolation of Highway Bridges, MCEER Report 06-SP07, University of Buffalo. 2006.
4. American Association of State Highway and Transportation Officials(AASHTO). Guide Specifications for SeismicIsolation Design—Third Edition. American Association of State Highway and Transportation Officials (AASHTO):Washington, D.C. 2010.
5. AASHTO. Guide specifications for LRFD seismic bridge design with interims. American Association of StateHighway and Transportation Officials (AASHTO): Washington, D.C. 2009.
6. Filipov ET. Nonlinear seismic analysis of quasi-isolation systems for earthquake protection of bridges. Thesis, Universityof Illinois at Urbana Champaign, Urbana, Illinois, 2012.
7. Illinois Department of Transportation (IDOT), Bridge Manual. Springfield, IL, 2009.8. Filipov ET, Fahnestock LA, Steelman JS, Hajjar JF, LaFave JM, Foutch DA. Evaluation of quasi-isolated seismic bridge
behavior using nonlinear bearing models. Engineering Structures. Accepted 2012. doi:10.1016/j.engstruct.2012.10.0119. Bignell JL, LaFave JM, Hawkins NM. Seismic vulnerability assessment of wall pier supported highway bridges using
nonlinear pushover analyses, Engineering Structures 2005; 27(14):2044–2063.10. McKenna F, Mazzoni S, Fenves GL. Open System for Earthquake Engineering Simulation (OpenSees). University of
California, Berkeley, CA. http://opensees.berkeley.edu/, 2006. (23 September 2011)11. Becker TC, Mahin SA. Experimental and analytical study of the bi-directional behavior of the triple friction pendulum
isolator. Earthquake Engineering and Structural Dynamics 2011. DOI: 10.1002/eqe.113312. Mosqueda G, Whittaker AS, Fenves GL. Characterization and modeling of friction pendulum bearings subjected to
multiple components of excitation. Journal of Structural Engineering 2004; 130(3):433–442.13. Constantinou MC, Mokha A, Reinhorn A. Teflon bearings in base isolation II: modeling. Journal of Structural
Engineering 1990; 116(2):455–474.14. Steelman JS, Fahnestock LA, LaFave JM, Hajjar JF, Filipov ET, Foutch DA. Seismic response of bearings for quasi-
isolated bridges—testing and component modeling. Structures Congress, Las Vegas, NV, 2011.15. Steelman JS, Fahnestock LA, Filipov ET, LaFave JM, Hajjar JF, Foutch DA. Shear and friction response of non-seismic
laminated elastomeric bridge bearings subject to seismic demands. Journal of Bridge Engineering 2012; (April 26):DOI:10.1061/(ASCE)BE.1943-5592.0000406.
SEISMIC PERFORMANCE OF HIGHWAY BRIDGES WITH FUSING BEARING COMPONENTS 1393
Copyright © 2013 John Wiley & Sons, Ltd. Earthquake Engng Struct. Dyn. 2013; 42:1375–1394DOI: 10.1002/eqe
16. Ibarra IF, Medina RA, Krawinkler H. Hysteretic models that incorporate strength and stiffness deterioration.Earthquake Engineering and Structural Dynamics 2005; 34(12):1489–1511.
17. Mander JB, Kim DK, Chen SS, Premus GJ. Response of steel bridge bearings to reversed cyclic loading. ReportNCEER-96-0014 State University of New York at Buffalo, Buffalo, NY, 1996.
18. Klinger RE, Mendoca JA, Malik JB. Effect of reinforcing details on the shear resistance of anchor bolts underreversed cyclic loading. ACI Journal 1982; 79(1):3–12.
19. Gomez I, Kavinde A, Smith C, Deierlein G. Shear transfer in exposed column base plates. AISC report, University ofCalifornia, Davis & Stanford University 2009.
20. Filipov ET, Revell JR, Steelman JS, Fahnestock LA, LaFave JM, Foutch DA, Hajjar JF. Sensitivity of quasi-isolatedbridge seismic response to variations in bearing and backwall elements. Paper No. 2978, Proceedings of the 15thWorld Conference on Earthquake Engineering, Lisbon, Portugal, 2012.
21. Fernandez JA, Rix GJ. Seismic hazard analysis and probabilistic ground motions in the upper Mississippi embayment.2008. ASCE Conference Proceedings. DOI:10.1061/40975(318)8.
22. Zandieh A, Pezeshk S. A Study of horizontal-to-vertical component spectral ratio in the New Madrid Seismic Zone.Bulletin of the Seismological Society of America 2011; 101(1):287–296.
23. Somerville P, Smith N, Punyamurthula S, Sun J. Development of ground motion time histories for phase 2 of theFEMA/SAC steel project. SAC/BD-97/04, Sacramento, CA, 1997.
24. AASHTO. Seismic Design Paramaters CD. American Association of State Highway and Transportation Officials(AASHTO), 2008.
25. Vamvatsikos D, Cornell CA. Incremental dynamic analysis. Earthquake Engineering and Structural Dynamics 2002;31(3):491–514.
26. Mackie KR, Cronin KJ, Nielson BG. Response sensitivity of highway bridges to randomly oriented multi-componentearthquake excitation. Journal of Earthquake Engineering 2011; 15(6): 850–876. DOI: 10.1080/13632469.2010.551706
27. Bisadi V, Head M. Orthogonal effects in nonlinear analysis of bridges subjected to multicomponent earthquakeexcitation, Structures Congress 2010. DOI:10.1061/41130(369)20
28. Bignell J, LaFave J. Analytical fragility analysis of southern Illinois wall pier supported highway bridges. EarthquakeEngineering and Structural Dynamics 2010; 39(7):709–729.
29. Nielson BG, DesRoches R. Seismic performance assessment of simply supported and continuous multispan con-crete girder highway bridges. Journal of Bridge Engineering 2007; 12(5):611. DOI:10.1061/(ASCE)1084-0702(2007)12:5(611)
1394 E. T. FILIPOV ET AL.
Copyright © 2013 John Wiley & Sons, Ltd. Earthquake Engng Struct. Dyn. 2013; 42:1375–1394DOI: 10.1002/eqe