sediment transport, part i: bed load transport · sediment transport, part i: bed load transport by...
TRANSCRIPT
SEDIMENT TRANSPORT, PART I: BED LOAD TRANSPORT
By Leo C. van Rijn1
ABSTRACT: A method is presented which enables the computation of the bed-load transport as the product of the saltation height, the particle velocity and the bed-load concentration. The equations of motions for a solitary particle are solved numerically to determine the saltation height and particle velocity. Experiments with gravel particles (transported as bed load) are selected to calibrate the mathematical model using the lift coefficient as a free parameter. The model is used to compute the saltation heights and lengths for a range of flow conditions. The computational results are used to determine simple relationships for the saltation characteristics. Measured transport rates of the bed load are used to compute the sediment concentration in the bed-load layer. A simple expression specifying the bed-load concentration as a function of the flow and sediment conditions is proposed. A verification analysis using about 600 (alternative) data shows that about 77% of the predicted bed load-transport rates are within 0.5 and 2 times the observed values.
INTRODUCTION
The transport of sediment particles by a flow of water can be in the form of bed-load and suspended load, depending on the size of the bed material particles and the flow conditions. The suspended load may also contain some wash load, which is generally defined as that portion of the suspended load which is governed by the upstream supply rate and not by the composition and properties of the bed material. Although in natural conditions there will be no sharp division between the bed-load transport and suspended load transport, it is necessary to define a layer with bed-load transport for mathematical representation. Usually, three modes of particle motion are distinguished: (1) Rolling and sliding motion or both; (2) saltation motion; and (3) suspended particle motion. When the value of the bed-shear velocity just exceeds the critical value for initiation of motion, the particles will be rolling and sliding or both, in continuous contact with the bed. For increasing values of the bed-shear velocity, the particles will be moving along the bed by more or less regular jumps, which are called saltations. When the value of the bed-shear velocity exceeds the fall velocity of the particles, the sediment particles can be lifted to a level at which the upward turbulent forces will be comparable with or of higher order than the submerged weight of the particles and as a result the particles may go in suspension.
Usually, the transport of particles by rolling, sliding and saltating is called the bed-load transport. For example, Bagnold (3-7) defines the bed-load transport as that in which the successive contacts of the particles with the bed are strictly limited by the effect of gravity, while the
'Proj. Engr., Delft Hydraulics Lab., P.O. Box 152, Emmeloord, The Netherlands. Note.—Discussion open until March 1, 1985. To extend the closing date one
month, a written request must be filed with the ASCE Manager of Technical and Professional Publications. The manuscript for this paper was submitted for review and possible publication on October 25, 1982. This paper is part of the Journal of Hydraulic Engineering, Vol. 110, No. 10, October, 1984. ©ASCE, ISSN 0733-9429/84/0010-1431/$01.00. Paper No. 19220.
1431
J. Hydraul. Eng., 1984, 110(10): 1431-1456
Dow
nloa
ded
from
asc
elib
rary
.org
by
Uni
vers
ity o
f O
ttaw
a on
12/
17/1
5. C
opyr
ight
ASC
E. F
or p
erso
nal u
se o
nly;
all
righ
ts r
eser
ved.
suspended load transport is defined as that in which the excess weight of the particles is supported wholly by a random succession of upward impulses imparted by turbulent eddies. Einstein (11), however, has a somewhat different approach. Einstein defines the bed-load transport as the transport of sediment particles in a thin layer of 2 particle diameters thick just above the bed by sliding, rolling and sometimes by making jumps with a longitudinal distance of a few particle diameters. The bed layer is considered as a layer in which the mixing due to the turbulence is so small that it cannot influence the sediment particles, and therefore suspension of particles is impossible in the bed-load layer. Further, Einstein assumes that the average distance travelled by any bed-load particle is a constant distance of 100 particle diameters, independent of the flow conditions, transport rate and the bed conposition. In the view of Einstein, the saltating particles belong to the suspension mode of transport, because the jump lengths of saltating particles are considerably larger than a few grain diameters. This approach of Einstein is followed by Engelund and Freds0e (13).
In the present study, the approach of Bagnold is followed, which means that the motion of the bed-load particles is assumed to be dominated by gravity forces, while the effect of turbulence on the overall trajectory is supposed to be of minor importance. This latter statement means that the trajectory of a saltating particle can be somewhat wavy at certain locations due to the highest (turbulent) fluid velocities of the spectrum. However, the overall dimensions of the trajectory are typically those of a saltating particle.
It is assumed that the (theoretical) maximum saltation height for a given flow condition can be determined from the equations of motion (excluding turbulent fluid forces) for a bed-load particle. As a start of a particle trajectory will be caused by random fluid forces, the height (and length) of a trajectory are random variables. However, by estimating the most unfavorable initial conditions, a maximum saltation height can be computed.
If for given flow conditions there are sediment particles with a jump height larger than the (computed) maximum saltation height present in the flow, then these particles are assumed to be transported as suspended load. All particles with a jump height smaller than the maximum saltation height are transported as bed load. According to Bagnold (6) a particle is suspended when the bed-shear velocity («*) exceeds the fall velocity (wb). Therefore, the saltation mode of transport is dominant when the bed-shear velocity is smaller than the fall velocity (u*/wb < 1).
In the present analylsis, the bed-load transport is defined as the transport of particles by rolling and saltating along the bed surface. The transport rate (qb) of the bed load is defined as the product of the particle velocity (ub), the saltation height (86) and the bed-load concentration (cb) resulting in qb = ubhbcb. To compute the bed-load transport rate, the particle characteristics must be known. In the present analysis, new relationships for the particle characteristics are proposed. These relationships are based on the numerical solution of the equations of motion for a saltating particle. Using the proposed relationships and measured bed-load data, the concentration of bed-load particles has been computed and represented by a simple function. Finally, a verification analysis of
1432
J. Hydraul. Eng., 1984, 110(10): 1431-1456
Dow
nloa
ded
from
asc
elib
rary
.org
by
Uni
vers
ity o
f O
ttaw
a on
12/
17/1
5. C
opyr
ight
ASC
E. F
or p
erso
nal u
se o
nly;
all
righ
ts r
eser
ved.
predicted and measured bed-load transport rates for particles in the range 200-2,000 |xm is presented.
CHARACTERISTIC PARAMETERS
The steady and uniform (two-dimensional) flow of water and sediment particles is defined by seven basic parameters: density of water (p); density of sediment (ps); dynamic viscosity coefficient (p,); particle size (D); flow depth (d); channel slope (S); and acceleration of gravity (g). These seven basic parameters can be reduced to a set of four dimen-sionless parameters being a particle mobility parameter (w*/(s - VjgD), a particle Reynolds' number (u*D/v), a depth-particle size ratio (AI'D) and a specific density parameter (Ps/P), (46).
In the present analysis, it is assumed that the bed-load transport rate can be described sufficiently accurately by two dimensionless parameters only, being a dimensionless particle parameter (D*) and a transport stage parameter (T). The D#-parameter can be derived by eliminating the shear velocity from the particle mobility parameter and the particle Reynolds' number, while the T-parameter expresses the mobility of the particles in terms of the stage of movement relative to the critical stage for initiation of motion. The introduction of the D*- and T-parameters is not new. Similar expressions have been used by Ackers-White (2) and Yalin (46). The particle and transport stage parameters are defined as
(S " 1) g a. particle parameter, D* = D5( (1)
in which D50 = particle size, s = specific density (ps/p), g = acceleration of gravity, v = kinematic viscosity coefficient (p./p).
(«i)2-(M*c r)2
b. transport stage parameter, T = -^— (2) ("*,cr)
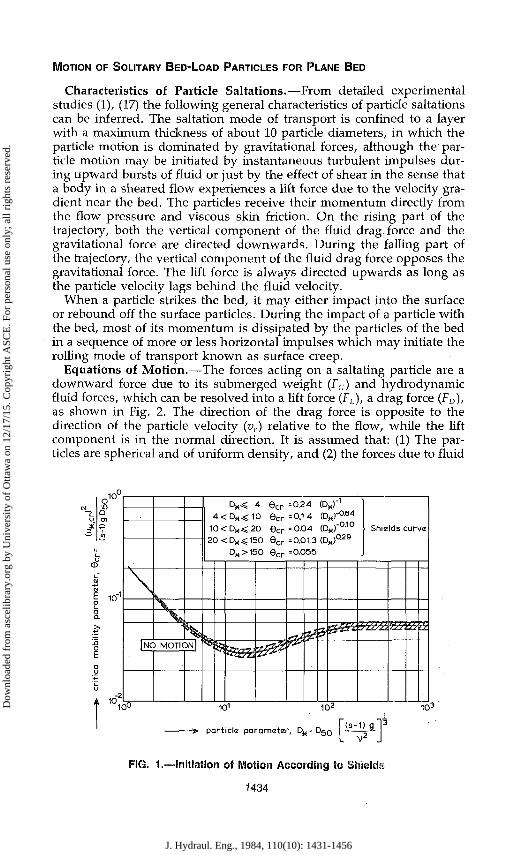
in which u* = (g05/C) u = bed-shear velocity related to grains, C = Chezy-coefficient related to grains, u = mean flow velocity, M#iCr = critical bed-shear velocity according to Shields (38) as given in analytical (by the writer) and graphical form in Fig. 1.
In the aforementioned concept, the u* -parameter is described in terms of the mean flow velocity and a Chezy-coefficient related to the grains of the bed. The w* -parameter can also be described in terms of a bed-form factor (|X;,) and the overall bed-shear velocity (M*), as follows: «* = p,°5 p,* with m = (C/C)2 and C = overall Chezy-coefficient. Later on this method to eliminate bed form roughness, which is simple and convenient, will be described in more detail and verified using data. In the present approach it is preferred to use the mean flow velocity instead of the overall bed-shear velocity (or energy gradient) to compute the transport stage because the energy gradient is not an appropriate parameter for morphological computations (mathematical modeling). Other disadvantages of the use of the energy gradient may be: (1) The variations due to nonequilibrium phenomena (rising and falling stages); and (2) measuring problems in (isolated) field conditions.
1433
J. Hydraul. Eng., 1984, 110(10): 1431-1456
Dow
nloa
ded
from
asc
elib
rary
.org
by
Uni
vers
ity o
f O
ttaw
a on
12/
17/1
5. C
opyr
ight
ASC
E. F
or p
erso
nal u
se o
nly;
all
righ
ts r
eser
ved.
MOTION OF SOLITARY BED-LOAD PARTICLES FOR PLANE BED
Characteristics of Particle Saltations.—From detailed experimental studies (1), (17) the following general characteristics of particle saltations can be inferred. The saltation mode of transport is confined to a layer with a maximum thickness of about 10 particle diameters, in which the particle motion is dominated by gravitational forces, although the particle motion may be initiated by instantaneous turbulent impulses during upward bursts of fluid or just by the effect of shear in the sense that a body in a sheared flow experiences a lift force due to the velocity gradient near the bed. The particles receive their momentum directly from the flow pressure and viscous skin friction. On the rising part of the trajectory, both the vertical component of the fluid drag, force and the gravitational force are directed downwards. During the falling part of the trajectory, the vertical component of the fluid drag force opposes the gravitational force. The lift force is always directed upwards as long as the particle velocity lags behind the fluid velocity.
When a particle strikes the bed, it may either impact into the surface or rebound off the surface particles. During the impact of a particle with the bed, most of its momentum is dissipated by the particles of the bed in a sequence of more or less horizontal impulses which may initiate the rolling mode of transport known as surface creep.
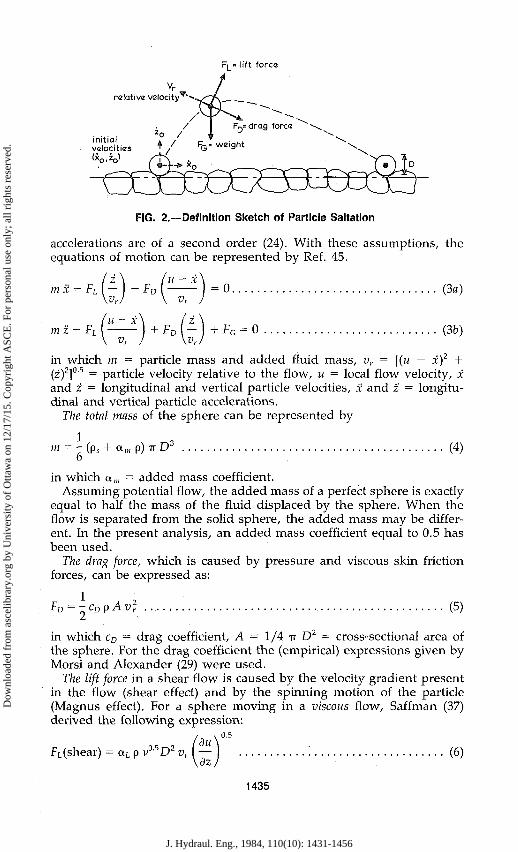
Equations of Motion.—The forces acting on a saltating particle are a downward force due to its submerged weight (FG) and hydrodynamic fluid forces, which can be resolved into a lift force (FL), a drag force (FD), as shown in Fig. 2. The direction of the drag force is opposite to the direction of the particle velocity (vr) relative to the flow, while the lift component is in the normal direction. It is assumed that: (1) The particles are spherical and of uniform density, and (2) the forces due to fluid
I U
m-1
m"2
^ N
| NO MOTION |
D„.g: 4 6 „ = 0.24 (DJ-1
4 < D„ < 10 6cr = °-1 4 (D«)"a64
10 < DK< 20 6cr = ° - 0 4 (D«r0'10
20 < DM < 150 6 c r = 0.01 3 (DM)Q29
D^>150 6 c r =0.055
'
Shields curve
10° 101 102
particle parameter, DM=D50 -
103
FIG. 1.—Initiation of Motion According to Shields
1434
J. Hydraul. Eng., 1984, 110(10): 1431-1456
Dow
nloa
ded
from
asc
elib
rary
.org
by
Uni
vers
ity o
f O
ttaw
a on
12/
17/1
5. C
opyr
ight
ASC
E. F
or p
erso
nal u
se o
nly;
all
righ
ts r
eser
ved.
S t i e s 7 / FQ= weight
F[_« I if t force
R->=drag force
FIG. 2.—Definition Sketch of Particle Saltation
accelerations are of a second order (24). With these assumptions, the equations of motion can be represented by Ref. 45.
FL
mz- FL
'u - x
= 0. Vr
+ F D [ - | + F c = 0
(3a)
(3b)
in which m = particle mass and added fluid mass, vr = [(« — x)2 + (z)2]0'5 = particle velocity relative to the flow, u = local flow velocity, x and z = longitudinal and vertical particle velocities, X and z = longitudinal and vertical particle accelerations.
The total mass of the sphere can be represented by
- (ps + am p) TT D 3 (4)
in which a„, = added mass coefficient. Assuming potential flow, the added mass of a perfect sphere is exactly
equal to half the mass of the fluid displaced by the sphere. When the flow is separated from the solid sphere, the added mass may be different. In the present analysis, an added mass coefficient equal to 0.5 has been used.
The drag force, which is caused by pressure and viscous skin friction forces, can be expressed as:
FD = -cDpAv2 (5)
in which cD = drag coefficient, A = 1/4 TT D 2 = cross-sectional area of the sphere. For the drag coefficient the (empirical) expressions given by Morsi and Alexander (29) were used.
The lift force in a shear flow is caused by the velocity gradient present in the flow (shear effect) and by the spinning motion of the particle (Magnus effect). For a sphere moving in a viscous flow, Saffman (37) derived the following expression:
FL(shear) = aL p v 0 5 D 2 v, — \dz
(6)
1435
J. Hydraul. Eng., 1984, 110(10): 1431-1456
Dow
nloa
ded
from
asc
elib
rary
.org
by
Uni
vers
ity o
f O
ttaw
a on
12/
17/1
5. C
opyr
ight
ASC
E. F
or p
erso
nal u
se o
nly;
all
righ
ts r
eser
ved.
in which otL = lift coefficient (= 1.6 for viscous flow), du/dz = velocity gradient.
Eq. 6 is only valid for small Reynolds' numbers. The lift force due to the spinning motion in a viscous flow was determined by Rubinow and Keller (34):
FL(spin) = aL p D3 vr w (7)
in which aL = lift coefficient (= 0.4 for viscous flow), co = angular velocity of the particle.
Saffman (37) showed theoretically that for viscous flow the lift force due to the particle rotation is less by an order of magnitude than that due to the shear effect and may therefore be neglected. Although the previous considerations are only valid for viscous flow, it is assumed that also in turbulent flow conditions the lift force is mainly caused by the shear effect, which is described by Eq. 6 using the lift coefficient o^ as a calibration parameter. This latter approach has been used because in the present state of research an exact expression for the lift force in turbulent flow conditions is not available.
The submerged particle weight can be described by
FG = -irD3 (p, - p)g (8) 6
The vertical flow velocity distribution is described by
u(z) = ^ In ( - ) (9)
in which M* = bed-shear velocity, K = constant of Von Karman (= 0.4), z0 = 0.11 (V/M*) + 0.03 ks = zero-velocity level above the bed, ks = equivalent roughness height of Nikuradse.
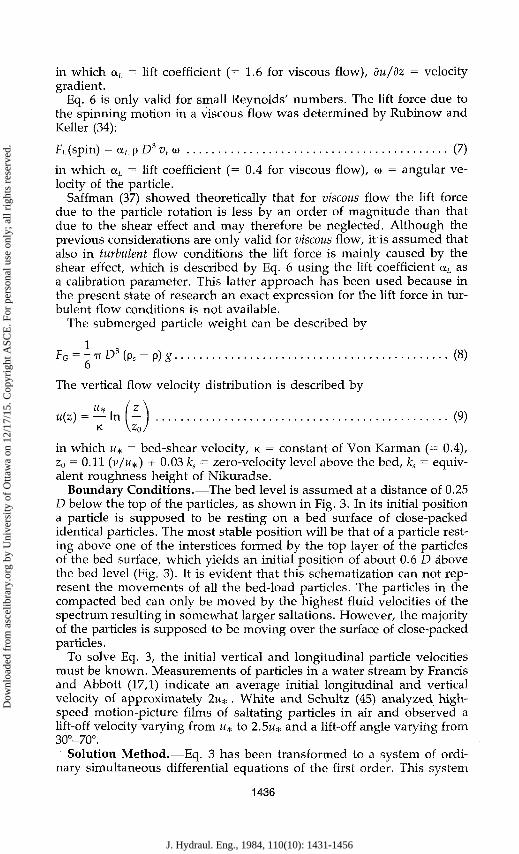
Boundary Conditions.—The bed level is assumed at a distance of 0.25 D below the top of the particles, as shown in Fig. 3. In its initial position a particle is supposed to be resting on a bed surface of close-packed identical particles. The most stable position will be that of a particle resting above one of the interstices formed by the top layer of the particles of the bed surface, which yields an initial position of about 0.6 D above the bed level (Fig. 3). It is evident that this schematization can not represent the movements of all the bed-load particles. The particles in the compacted bed can only be moved by the highest fluid velocities of the spectrum resulting in somewhat larger saltations. However, the majority of the particles is supposed to be moving over the surface of close-packed particles.
To solve Eq. 3, the initial vertical and longitudinal particle velocities must be known. Measurements of particles in a water stream by Francis and Abbott (17,1) indicate an average initial longitudinal and vertical velocity of approximately 2w* . White and Schultz (45) analyzed highspeed motion-picture films of saltating particles in air and observed a lift-off velocity varying from w* to 2.5M* and a lift-off angle varying from 30°-70°.
Solution Method.—Eq. 3 has been transformed to a system of ordinary simultaneous differential equations of the first order. This system
1436
J. Hydraul. Eng., 1984, 110(10): 1431-1456
Dow
nloa
ded
from
asc
elib
rary
.org
by
Uni
vers
ity o
f O
ttaw
a on
12/
17/1
5. C
opyr
ight
ASC
E. F
or p
erso
nal u
se o
nly;
all
righ
ts r
eser
ved.
0.25 D
FIG. 3.—Initial Position of Particle
has been solved numerically by means of an automatic step-change differential equation solver, resulting in a solution accurate to four digits (35).
CALIBRATION AND COMPUTATIONAL RESULTS
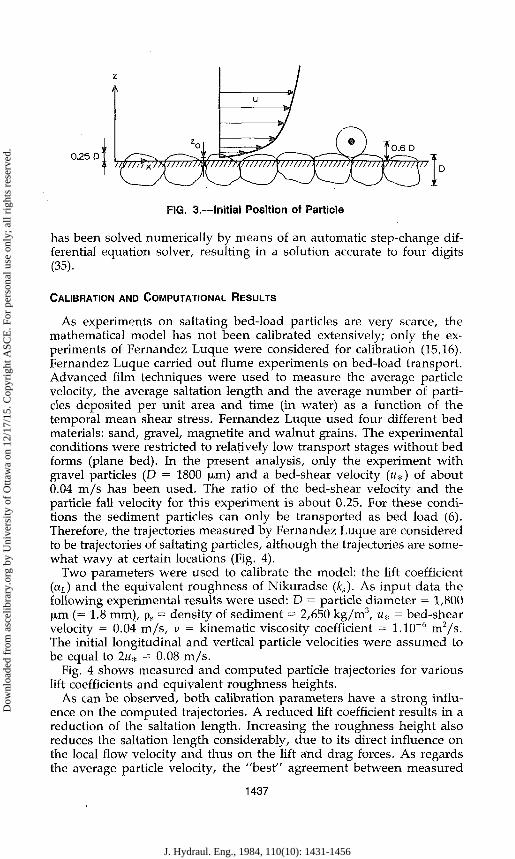
As experiments on saltating bed-load particles are very scarce, the mathematical model has not been calibrated extensively; only the experiments of Fernandez Luque were considered for calibration (15,16). Fernandez Luque carried out flume experiments on bed-load transport. Advanced film techniques were used to measure the average particle velocity, the average saltation length and the average number of particles deposited per unit area and time (in water) as a function of the temporal mean shear stress. Fernandez Luque used four different bed materials: sand, gravel, magnetite and walnut grains. The experimental conditions were restricted to relatively low transport stages without bed forms (plane bed). In the present analysis, only the experiment with gravel particles (D = 1800 (j,m) and a bed-shear velocity (w#) of about 0.04 m/s has been used. The ratio of the bed-shear velocity and the particle fall velocity for this experiment is about 0.25. For these conditions the sediment particles can only be transported as bed load (6). Therefore, the trajectories measured by Fernandez Luque are considered to be trajectories of saltating particles, although the trajectories are somewhat wavy at certain locations (Fig. 4).
Two parameters were used to calibrate the model: the lift coefficient (at) and the equivalent roughness of Nikuradse (ks). As input data the following experimental results were used: D = particle diameter = 1,800 (xm (= 1.8 mm), ps = density of sediment = 2,650 kg/m3, M* = bed-shear velocity = 0.04 m/s, v = kinematic viscosity coefficient = 1.10-6 m2/s. The initial longitudinal and vertical particle velocities were assumed to be equal to 2M* = 0.08 m/s.
Fig. 4 shows measured and computed particle trajectories for various lift coefficients and equivalent roughness heights.
As can be observed, both calibration parameters have a strong influence on the computed trajectories. A reduced lift coefficient results in a reduction of the saltation length. Increasing the roughness height also reduces the saltation length considerably, due to its direct influence on the local flow velocity and thus on the lift and drag forces. As regards the average particle velocity, the "best" agreement between measured
1437
J. Hydraul. Eng., 1984, 110(10): 1431-1456
Dow
nloa
ded
from
asc
elib
rary
.org
by
Uni
vers
ity o
f O
ttaw
a on
12/
17/1
5. C
opyr
ight
ASC
E. F
or p
erso
nal u
se o
nly;
all
righ
ts r
eser
ved.
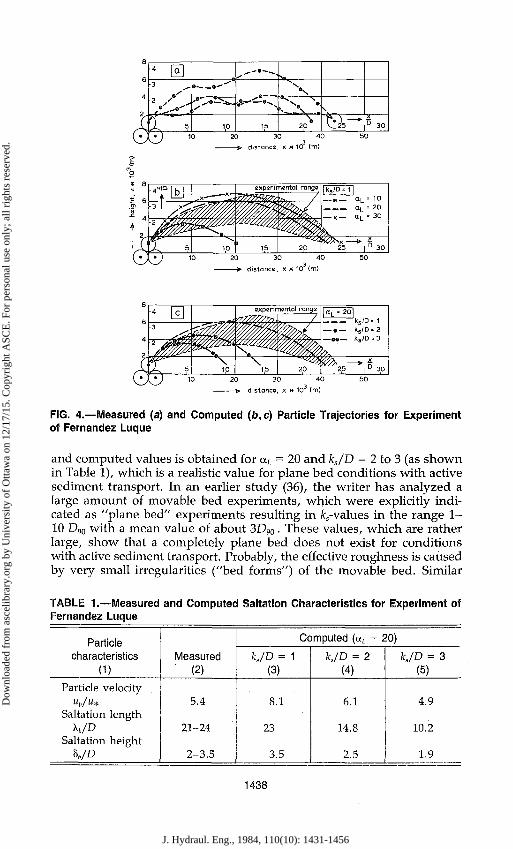
FIG. 4.—Measured (a) and Computed (b,c) Particle Trajectories for Experiment of Fernandez Luque
and computed values is obtained for aL = 20 and ks/D = 2 to 3 (as shown in Table 1), which is a realistic value for plane bed conditions with active sediment transport. In an earlier study (36), the writer has analyzed a large amount of movable bed experiments, which were explicitly indicated as "plane bed" experiments resulting in ^-values in the range 1-10 D90 with a mean value of about 3D90. These values, which are rather large, show that a completely plane bed does not exist for conditions with active sediment transport. Probably, the effective roughness is caused by very small irregularities ("bed forms") of the movable bed. Similar
TABLE 1.—Measured and Computed Saltation Characteristics for Experiment of Fernandez Luque
Particle characteristics
(D Particle velocity
Saltation length K/D
Saltation height
Measured (2)
5.4
21-24
2-3.5
K/D = (3)
8.1
23
3.5
Computed («t = 20)
1 K/D = 2 (4)
6.1
14.8
2.5
K/D = 3 (5)
4.9
10.2
1.9
1438
J. Hydraul. Eng., 1984, 110(10): 1431-1456
Dow
nloa
ded
from
asc
elib
rary
.org
by
Uni
vers
ity o
f O
ttaw
a on
12/
17/1
5. C
opyr
ight
ASC
E. F
or p
erso
nal u
se o
nly;
all
righ
ts r
eser
ved.
0.3 L
0 s'""~
1 -—
5
_ ,
10
longitudinal flow velocity - longitudinal particle velocity
15
- —_̂
3̂ a L =20 k s / D . 1
^
20
w X
... 25 | 30 20 30 40 50
—> distance, x K 10 (m)
\ E \
""- — 5 — --J<£ JU~
l i f t force Fr Fc — drag force FQ/FQ FQ = submerged weight
• —
' 1 -- 25 | 30
> distance, x H 10 (m)
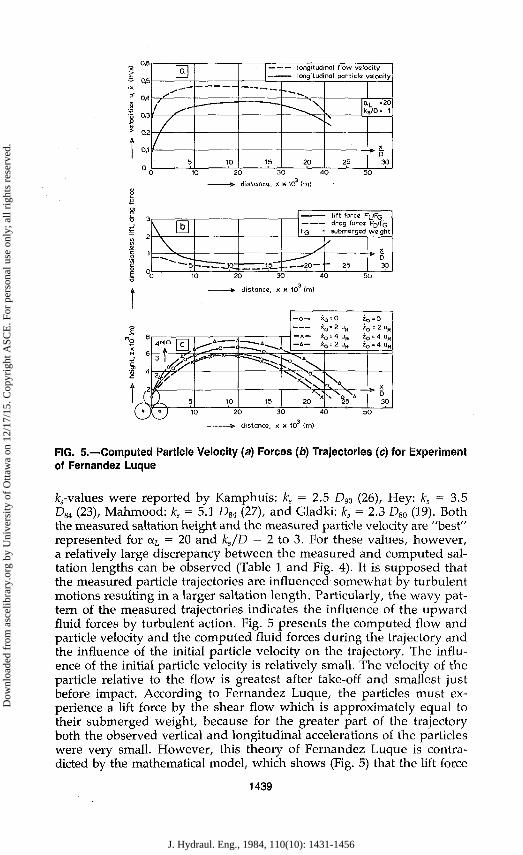
FIG. 5.—Computed Particle Velocity (a) Forces (b) Trajectories (c) for Experiment of Fernandez Luque
fc-values were reported by Kamphuis: ks = 2.5 D90 (26), Hey: ks = 3.5 DM (23), Mahmood: fc, = 5.1 D84 (27), and Gladki: ks = 2.3 D80 (19). Both the measured saltation height and the measured particle velocity are "best" represented for aL = 20 and kJD = 2 to 3. For these values, however, a relatively large discrepancy between the measured and computed saltation lengths can be observed (Table 1 and Fig. 4). It is supposed that the measured particle trajectories are influenced somewhat by turbulent motions resulting in a larger saltation length. Particularly, the wavy pattern of the measured trajectories indicates the influence of the upward fluid forces by turbulent action. Fig. 5 presents the computed flow and particle velocity and the computed fluid forces during the trajectory and the influence of the initial particle velocity on the trajectory. The influence of the initial particle velocity is relatively small. The velocity of the particle relative to the flow is greatest after take-off and smallest just before impact. According to Fernandez Luque, the particles must experience a lift force by the shear flow which is approximately equal to their submerged weight, because for the greater part of the trajectory both the observed vertical and longitudinal accelerations of the particles were very small. However, this theory of Fernandez Luque is contradicted by the mathematical model, which shows (Fig. 5) that the lift force
1439
J. Hydraul. Eng., 1984, 110(10): 1431-1456
Dow
nloa
ded
from
asc
elib
rary
.org
by
Uni
vers
ity o
f O
ttaw
a on
12/
17/1
5. C
opyr
ight
ASC
E. F
or p
erso
nal u
se o
nly;
all
righ
ts r
eser
ved.
due to shear is not more than half the submerged weight for the greater part of the trajectory.
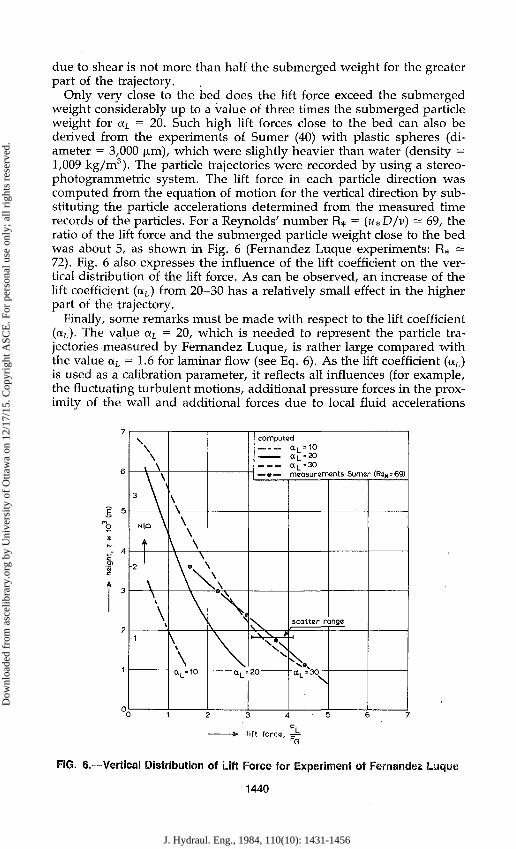
Only very close to the bed does the lift force exceed the submerged weight considerably up to a value of three times the submerged particle weight for a t = 20. Such high lift forces close to the bed can also be derived from the experiments of Sumer (40) with plastic spheres (diameter = 3,000 (Jim), which were slightly heavier than water (density = 1,009 kg/m3). The particle trajectories were recorded by using a stereo-photogrammetric system. The lift force in each particle direction was computed from the equation of motion for the vertical direction by substituting the particle accelerations determined from the measured time records of the particles. For a Reynolds' number R# = (u*D/v) = 69, the ratio of the lift force and the submerged particle weight close to the bed was about 5, as shown in Fig. 6 (Fernandez Luque experiments: R# = 72). Fig. 6 also expresses the influence of the lift coefficient on the vertical distribution of the lift force. As can be observed, an increase of the lift coefficient (aL) from 20-30 has a relatively small effect in the higher part of the trajectory.
Finally, some remarks must be made with respect to the lift coefficient (CLL). The value aL = 20, which is needed to represent the particle trajectories measured by Fernandez Luque, is rather large compared with the value aL = 1.6 for laminar flow (see Eq. 6). As the lift coefficient (aL) is used as a calibration parameter, it reflects all influences (for example, the fluctuating turbulent motions, additional pressure forces in the proximity of the wall and additional forces due to local fluid accelerations
\ \ \ \ \
•V N|Q \
t 1
2
\ \
\
\ V \ \ \ \ \
\
\ " c x L = i o
\
<xL =
compu ted a , = 1 0 a L » 2 0 a L » 3 0
— e— measurements burner lKeM=69)
v s .
.w * 20
scatter r
V h a L = 3 0
x
ange
0 1 2 3 4 5 6 7
• l i f t force, =t .
FIG. 6.—Vertical Distribution of Lift Force for Experiment of Fernandez Luque
1440
J. Hydraul. Eng., 1984, 110(10): 1431-1456
Dow
nloa
ded
from
asc
elib
rary
.org
by
Uni
vers
ity o
f O
ttaw
a on
12/
17/1
5. C
opyr
ight
ASC
E. F
or p
erso
nal u
se o
nly;
all
righ
ts r
eser
ved.
which are not taken into account by the mathematical model. To get some insight into the saltation mechanism for small sand par
ticles, the particle trajectory for a particle of 100 (xm was computed. For comparison with a large particle, the flow conditions were taken equal to those in the experiments of Fernandez Luque (D = 1,800 (xm). Further, it was assumed that the lift coefficient (aL) computed by Saffman (37) for viscous flow (aL =1.6) also holds for hydraulically smooth flow (R* = u*D/v < 5), while for rough flow conditions (R* > 70) the lift coefficient is supposed to be constant aL = 20. For the transitional flow regime (5 < R# < 70) the lift coefficient is supposed to vary linearly from 1.6 to 20.
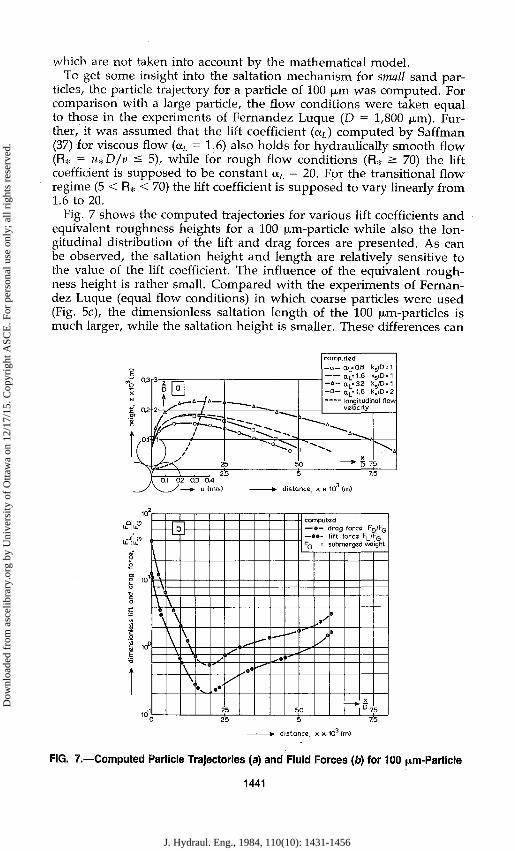
Fig. 7 shows the computed trajectories for various lift coefficients and equivalent roughness heights for a 100 |xm-particle while also the longitudinal distribution of the lift and drag forces are presented. As can be observed, the saltation height and length are relatively sensitive to the value of the lift coefficient. The influence of the equivalent roughness height is rather small. Compared with the experiments of Fernandez Luque (equal flow conditions) in which coarse particles were used (Fig. 5c), the dimensionless saltation length of the 100 (iim-particles is much larger, while the saltation height is smaller. These differences can
•> distance, x M 10 <m)
FIG. 7.—Computed Particle Trajectories (a) and Fluid Forces (b) for 100 .̂m-Particle
1441
J. Hydraul. Eng., 1984, 110(10): 1431-1456
Dow
nloa
ded
from
asc
elib
rary
.org
by
Uni
vers
ity o
f O
ttaw
a on
12/
17/1
5. C
opyr
ight
ASC
E. F
or p
erso
nal u
se o
nly;
all
righ
ts r
eser
ved.
be explained by considering the longitudinal distribution of the lift and drag forces (Figs. 5b and 7). For a small particle the saltation process is dominated by the drag force, which is always larger than the lift force. For a large particle, this situation is just the opposite with a dominating lift force. Another remarkable phenomenon is the large value of the initial lift and drag forces with respect to the submerged particle weight and also the rapid and large decrease of these forces in the higher parts of the trajectory.
COMPUTATION OF SALTATION CHARACTERISTICS FOR VARIOUS
FLOW CONDITIONS
To learn more about the relationship between the saltation characteristics and the flow conditions, the saltation characteristics were computed for various particle diameters (D = 100-2,000 (im) and flow conditions (K* = 0.02-0.14 m/s) assuming a flat bed (35).
The following assumptions were used: ks = 2D, x0 = z0 = 2u*, z(0) = 0.6D, ps = 2,650 kg/m3, v = 1.10"6 m2/s, am = 0.5, aL = 1.6 for R* < 5, aL = 20 for R* > 70 and a t = 1.6 to 20 (linear) for R* = 5-70, K = 0.4.
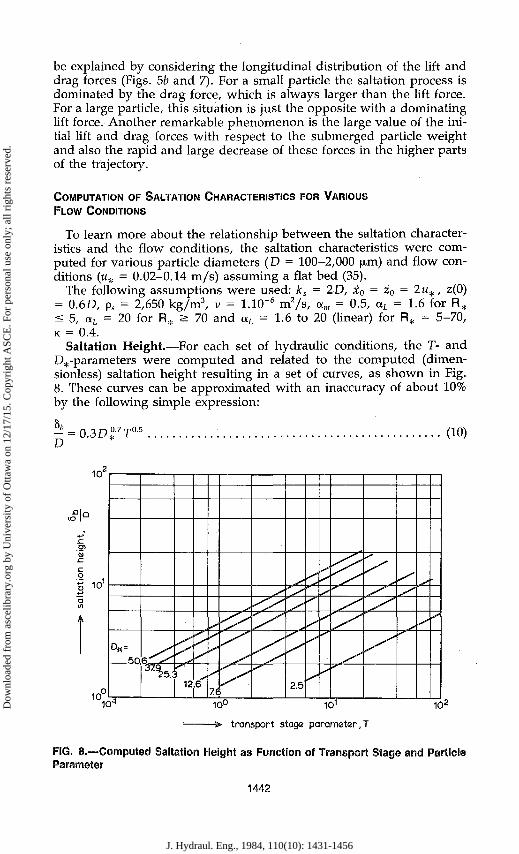
Saltation Height.—For each set of hydraulic conditions, the T- and D.,.-parameters were computed and related to the computed (dimen-sionless) saltation height resulting in a set of curves, as shown in Fig. 8. These curves can be approximated with an inaccuracy of about 10% by the following simple expression:
D = 0.3 D°-7T05 (10)
-*• transport stage parameter,T
FIG. 8.—Computed Saltation Height as Function of Transport Stage and Particle Parameter
1442
J. Hydraul. Eng., 1984, 110(10): 1431-1456
Dow
nloa
ded
from
asc
elib
rary
.org
by
Uni
vers
ity o
f O
ttaw
a on
12/
17/1
5. C
opyr
ight
ASC
E. F
or p
erso
nal u
se o
nly;
all
righ
ts r
eser
ved.
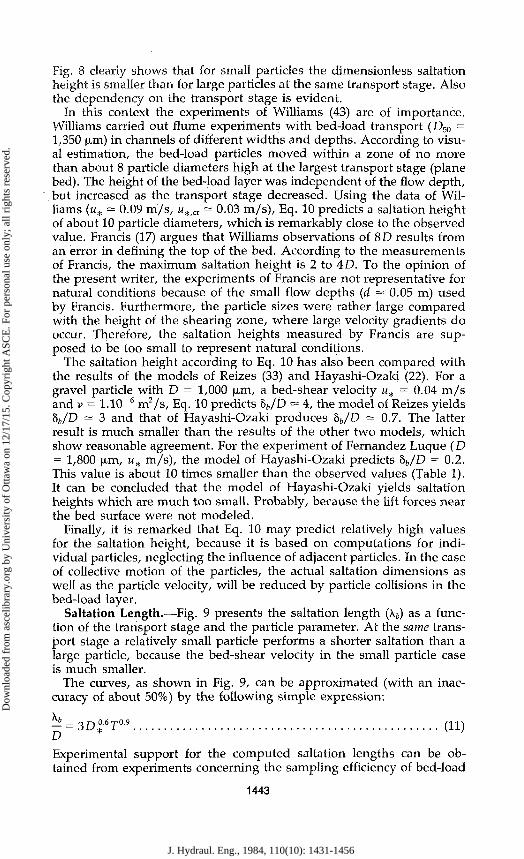
Fig. 8 clearly shows that for small particles the dimensionless saltation height is smaller than for large particles at the same transport stage. Also the dependency on the transport stage is evident.
In this context the experiments of Williams (43) are of importance. Williams carried out flume experiments with bed-load transport (D50 = 1,350 jim) in channels of different widths and depths. According to visual estimation, the bed-load particles moved within a zone of no more than about 8 particle diameters high at the largest transport stage (plane bed). The height of the bed-load layer was independent of the flow depth, but increased as the transport stage decreased. Using the data of Williams (H* = 0.09 m/s, «,.,„ = 0.03 m/s), Eq. 10 predicts a saltation height of about 10 particle diameters, which is remarkably close to the observed value. Francis (17) argues that Williams observations of 8D results from an error in defining the top of the bed. According to the measurements of Francis, the maximum saltation height is 2 to 4D. To the opinion of the present writer, the experiments of Francis are not representative for natural conditions because of the small flow depths (d = 0.05 m) used by Francis. Furthermore, the particle sizes were rather large compared with the height of the shearing zone, where large velocity gradients do occur. Therefore, the saltation heights measured by Francis are supposed to be too small to represent natural conditions.
The saltation height according to Eq. 10 has also been compared with the results of the models of Reizes (33) and Hayashi-Ozaki (22). For a gravel particle with D = 1,000 (im, a bed-shear velocity u„, = 0.04 m/s and v = 1.10~s m2/s, Eq. 10 predicts 86/D = 4, the model of Reizes yields bb/D = 3 and that of Hayashi-Ozaki produces bb/D = 0.7. The latter result is much smaller than the results of the other two models, which show reasonable agreement. For the experiment of Fernandez Luque (D = 1,800 |xm, u* m/s), the model of Hayashi-Ozaki predicts hb/D = 0.2. This value is about 10 times smaller than the observed values (Table 1). It can be concluded that the model of Hayashi-Ozaki yields saltation heights which are much too small. Probably, because the lift forces near the bed surface were not modeled.
Finally, it is remarked that Eq. 10 may predict relatively high values for the saltation height, because it is based on computations for individual particles, neglecting the influence of adjacent particles. In the case of collective motion of the particles, the actual saltation dimensions as well as the particle velocity, will be reduced by particle collisions in the bed-load layer.
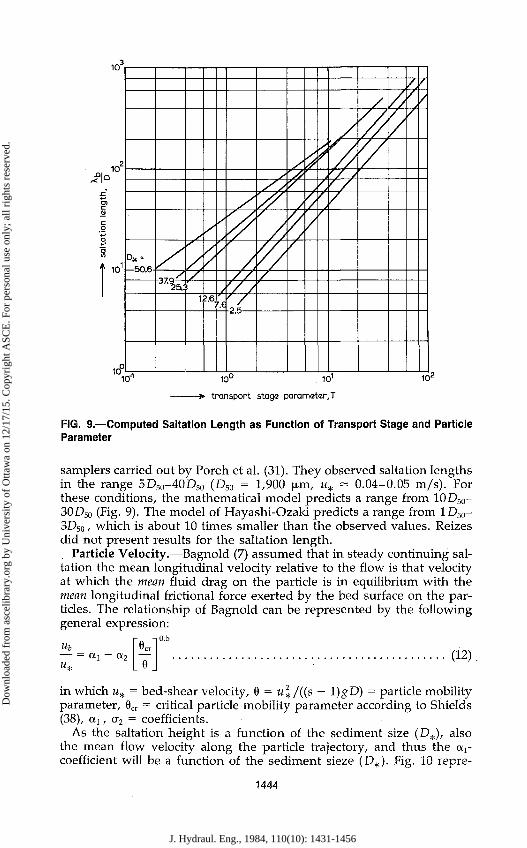
Saltation Length.—Fig. 9 presents the saltation length (Kb) as a function of the transport stage and the particle parameter. At the same transport stage a relatively small particle performs a shorter saltation than a large particle, because the bed-shear velocity in the small particle case is much smaller.
The curves, as shown in Fig. 9, can be approximated (with an inaccuracy of about 50%) by the following simple expression:
- = 3D#°-6r0-9 (ii)
Experimental support for the computed saltation lengths can be obtained from experiments concerning the sampling efficiency of bed-load
1443
J. Hydraul. Eng., 1984, 110(10): 1431-1456
Dow
nloa
ded
from
asc
elib
rary
.org
by
Uni
vers
ity o
f O
ttaw
a on
12/
17/1
5. C
opyr
ight
ASC
E. F
or p
erso
nal u
se o
nly;
all
righ
ts r
eser
ved.
10"
10
10' - 5 0 . 6 -/ 37k:
1 !.6. '.«
// /,
10"' 10u 101
-»• transport stags parameter, T
10'
FIG. 9.—Computed Saltation Length as Function of Transport Stage and Particle Parameter
samplers carried out by Poreh et al. (31). They observed saltation lengths in the range 5D50-40DS0 (D50 = 1,900 (Jim, M* = 0.04-0.05 m/s). For these conditions, the mathematical model predicts a range from 10D50-30D50 (Fig. 9). The model of Hayashi-Ozaki predicts a range from 1D50-3D50, which is about 10 times smaller than the observed values. Reizes did not present results for the saltation length.
Particle Velocity.—Bagnold (7) assumed that in steady continuing saltation the mean longitudinal velocity relative to the flow is that velocity at which the mean fluid drag on the particle is in equilibrium with the mean longitudinal frictional force exerted by the bed surface on the particles. The relationship of Bagnold can be represented by the following general expression:
«(, = <*i a2
er (12)
in which u% = bed-shear velocity, 0 = u\/{{s - l)gD) = particle mobility parameter, 0cr = critical particle mobility parameter according to Shields (38), <*!, a2 = coefficients.
As the saltation height is a function of the sediment size (D^), also the mean flow velocity along the particle trajectory, and thus the 04-coefficient will be a function of the sediment sieze (D*). Fig. 10 repre-
1444
J. Hydraul. Eng., 1984, 110(10): 1431-1456
Dow
nloa
ded
from
asc
elib
rary
.org
by
Uni
vers
ity o
f O
ttaw
a on
12/
17/1
5. C
opyr
ight
ASC
E. F
or p
erso
nal u
se o
nly;
all
righ
ts r
eser
ved.

n\ x 10 3 l=J
measured (sand) ® Fernandez Luque DM= 19.5 ® Fernandez Luque D H = 3 9 a Francis D«=49
computed _ _ _ _ van Rijn
Engelund-Freds*e
0 0.1 0.2 0.3 0.4 0.5 0.6 0.7 0.8 0.9 1.0 o -fi.5 fcb
mobi l i t y pa ramete r , m FIG. 10.—Particle Velocity as Function of Flow Conditions and Particle Parameter
sents the computed (using Eq. 3) particle velocity as a function of the flow conditions and sediment size. The curves, as shown in Fig. 10, can be approximated (with an inaccuracy of about 10%) by:
— = 9 + 2.6 log D* - 8 (13)
For a particle mobility parameter (6) approaching the critical value, the particle velocity is supposed to approach zero. Fig. 10 shows some data of Fernandez Luque (15) and Francis (17). As regards the experiments of Fernandez Luque, only the sand (D = 900 (im) and the gravel (D = 1,800 |i,m) experiments for a flat bed-surface slope ((3 = 0) were used. From the experiments of Francis only the gravel data were used. As can be observed, the (scarce) data do not confirm the influence of the D*-parameter as expressed by the mathematical model. More experimental research is necessary to investigate the D^-influence. The computational results can also be approximated (20% inaccuracy) by the following simple expression:
[(s - l)gD]° = 1.5Ta (14)
1445
J. Hydraul. Eng., 1984, 110(10): 1431-1456
Dow
nloa
ded
from
asc
elib
rary
.org
by
Uni
vers
ity o
f O
ttaw
a on
12/
17/1
5. C
opyr
ight
ASC
E. F
or p
erso
nal u
se o
nly;
all
righ
ts r
eser
ved.
0.8
0.7
0.6
TN 0.5 • I E n 0-4
H
f 0.3
0.2
0.1
2 Tb=0.61 N/m. (measured average bed-shear stress)
xjj=Q21 N/m (according to Equation 16)
T. Theasured surface shear stress (Raudkivi)
I I I I 0 0.1 0.2 0.3 0.4 0.5 0.6 0.7 0.8 0.9 1.0
w x *• x
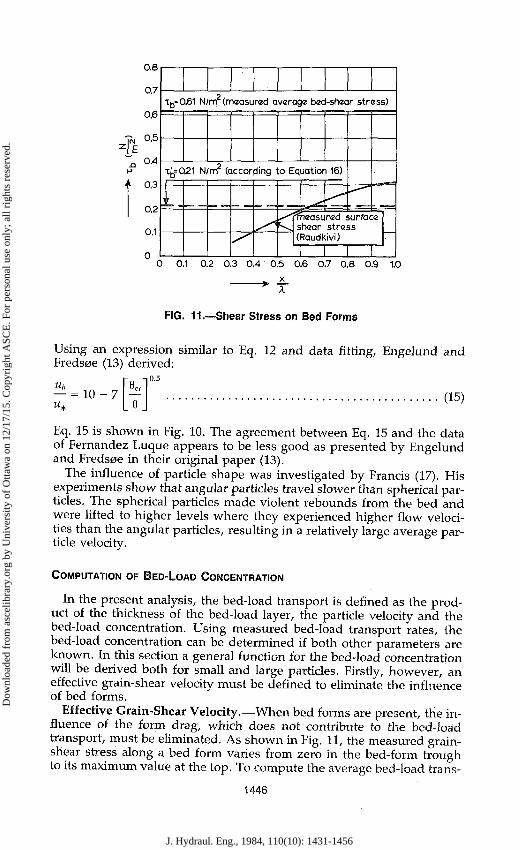
FIG. 11.—Shear Stress on Bed Forms
Using an expression similar to Eq. 12 and data fitting, Engelund and Fredsae (13) derived:
Hj, = 1 0 - 7 (15)
Eq. 15 is shown in Fig. 10. The agreement between Eq. 15 and the data of Fernandez Luque appears to be less good as presented by Engelund and Fredsee in their original paper (13).
The influence of particle shape was investigated by Francis (17). His experiments show that angular particles travel slower than spherical particles. The spherical particles made violent rebounds from the bed and were lifted to higher levels where they experienced higher flow velocities than the angular particles, resulting in a relatively large average particle velocity.
COMPUTATION OF BED-LOAD CONCENTRATION
In the present analysis, the bed-load transport is defined as the product of the thickness of the bed-load layer, the particle velocity and the bed-load concentration. Using measured bed-load transport rates, the bed-load concentration can be determined if both other parameters are known. In this section a general function for the bed-load concentration will be derived both for small and large particles. Firstly, however, an effective grain-shear velocity must be defined to eliminate the influence of bed forms.
Effective Grain-Shear Velocity.—When bed forms are present, the influence of the form drag, which does not contribute to the bed-load transport, must be eliminated. As shown in Fig. 11, the measured grain-shear stress along a bed form varies from zero in the bed-form trough to its maximum value at the top. To compute the average bed-load trans-
1446
J. Hydraul. Eng., 1984, 110(10): 1431-1456
Dow
nloa
ded
from
asc
elib
rary
.org
by
Uni
vers
ity o
f O
ttaw
a on
12/
17/1
5. C
opyr
ight
ASC
E. F
or p
erso
nal u
se o
nly;
all
righ
ts r
eser
ved.
port, it is necessary to estimate the average grain-shear stress (T£) at the upsloping part of the bed form. It is assumed that at or near the location where the average grain-shear stress is acting, the local flow velocity profile is about the same at that for a plane bed flow with the same mean flow velocity (u) and particle size (D50). Therefore, the average grain-shear stress is:
T - P * ^ ; (16>
in which t'h = (effective) grain-shear stress; u = cross section or depth-averaged flow velocity; and C = Chezy-coefficient related to grain roughness.
As the transport stage parameter (T) in Eq. 2 is given in terms of the grain-shear velocity (w*), Eq. 16 is transformed to:
"* = ^ r (IT)
The Chezy-coefficient related to the surface (or grain) roughness of the sediment bed is defined as:
/12M
in which Rb = hydraulic radius related to the bed according to the side-wall correction method of Vanoni-Brooks (42).
As stated before, the effective roughness height of a movable "plane" bed surface may be about 3D90. This value is based on the analysis of about 100 flume and field data with plane bed conditions (36).
To evaluate the value of the effective bed-shear stress expressed by Eq. 16, an experiment of Raudkivi (32) concerning the flow over small ripples is considered. He conducted experiments in a small closed-circuit flume (width = 0.075 m). The bed material consisted of particles with D50 = 400 |xm and D90 = 580 (Am. The bed was covered with small ripples. To carry out accurate pressure measurements along one individual ripple, the bed forms over the entire length of the flume were replaced by identical bed forms of galvanized metal sheet. Along one ripple the normal pressures (by means of taps) and surface shear stresses (by means of Pitot-tubes) were measured. The average shear stress related to the form drag was determined by averaging the measured pressure distribution over the ripple length (X), resulting in T'6' = 0.46 N/m2. In a similar way, the average surface shear-stress was found to be T̂ = 0.15 N/m2 . The measured shear-stress distribution is shown in Fig. 11. Consequently, the total average bed-shear stress is rb = Tb + TJ,' = 0.61 N/m2 , which is in good agreement with the average bed-shear stress based on the surface slope (S) and the hydraulic radius (Rb) yielding Tb = 0.65 N / m2 (32).
The effective surface shear-stress was computed according to Eq. 16 and
C = 18 log 11.5 uR„
= 60 m a 5 /s (19)
1447
J. Hydraul. Eng., 1984, 110(10): 1431-1456
Dow
nloa
ded
from
asc
elib
rary
.org
by
Uni
vers
ity o
f O
ttaw
a on
12/
17/1
5. C
opyr
ight
ASC
E. F
or p
erso
nal u
se o
nly;
all
righ
ts r
eser
ved.
resulting in t'b — 0.21 N/m2. To compute the Chezy-coefficient related to the surface roughness (C), a resistance Eq. 19 for hydraulically smooth flow conditions was used because the ripples consisted of relatively smooth galvanized metal sheet material. In the case of a sediment bed, Eq. 18 should be used.
Summarizing, it is concluded that the present method, which is simpler and no more crude than other existing methods (2,11,12), yields an acceptable estimate of the average skin friction at the upsloping part of the bed forms (Fig. 11).
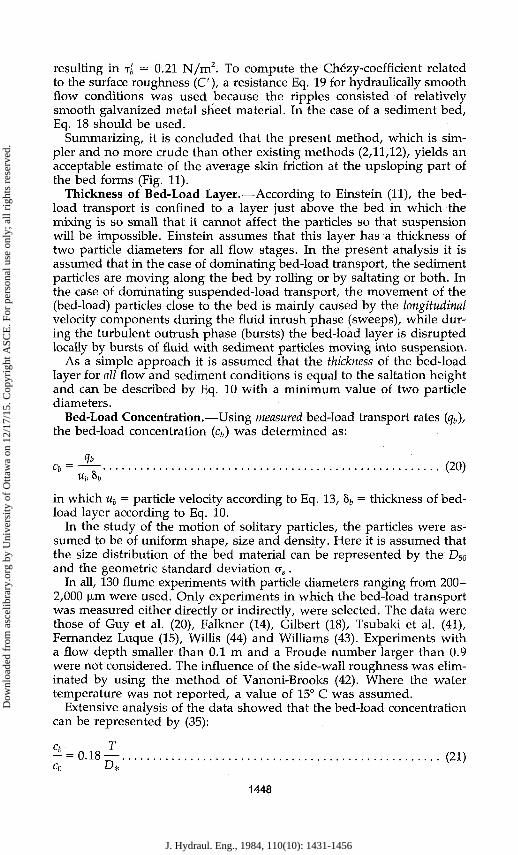
Thickness of Bed-Load Layer.—According to Einstein (11), the bed-load transport is confined to a layer just above the bed in which the mixing is so small that it cannot affect the particles so that suspension will be impossible. Einstein assumes that this layer has a thickness of two particle diameters for all flow stages. In the present analysis it is assumed that in the case of dominating bed-load transport, the sediment particles are moving along the bed by rolling or by saltating or both. In the case of dominating suspended-load transport, the movement of the (bed-load) particles close to the bed is mainly caused by the longitudinal velocity components during the fluid inrush phase (sweeps), while during the turbulent outrush phase (bursts) the bed-load layer is disrupted locally by bursts of fluid with sediment particles moving into suspension.
As a simple approach it is assumed that the thickness of the bed-load layer for all flow and sediment conditions is equal to the saltation height and can be described by Eq. 10 with a minimum value of two particle diameters.
Bed-Load Concentration.—Using measured bed-load transport rates (qb), the bed-load concentration (cb) was determined as:
o-^r • • • • • ( 2 0 )
in which ub = particle velocity according to Eq. 13, 8;, = thickness of bed-load layer according to Eq. 10.
In the study of the motion of solitary particles, the particles were assumed to be of uniform shape, size and density. Here it is assumed that the size distribution of the bed material can be represented by the D50 and the geometric standard deviation CTS .
In all, 130 flume experiments with particle diameters ranging from 200-2,000 fxm were used. Only experiments in which the bed-load transport was measured either directly or indirectly, were selected. The data were those of Guy et al. (20), Falkner (14), Gilbert (18), Tsubaki et al. (41), Fernandez Luque (15), Willis (44) and Williams (43). Experiments with a flow depth smaller than 0.1 m and a Froude number larger than 0.9 were not considered. The influence of the side-wall roughness was eliminated by using the method of Vanoni-Brooks (42). Where the water temperature was not reported, a value of 15° C was assumed.
Extensive analysis of the data showed that the bed-load concentration can be represented by (35):
J = 0-18 — (21) c0 D*
1448
J. Hydraul. Eng., 1984, 110(10): 1431-1456
Dow
nloa
ded
from
asc
elib
rary
.org
by
Uni
vers
ity o
f O
ttaw
a on
12/
17/1
5. C
opyr
ight
ASC
E. F
or p
erso
nal u
se o
nly;
all
righ
ts r
eser
ved.
olu
C0= maximum bad concentration =
-V -% r >
/ / / 0
';H X
<
<
X >
y •
- ; ^ "» '
9
^ri
^
sV
D
065J
]
/ „ / /
/ ' / / / •
/a
P *
^ i
t-V - i £> * r t
0
3
o°^
sEqua ion (21)
f l o w - p a r t i c l e parameter,
oGuy et al • Guy et al e Guy et al o Guy et al e Guy et al D Falkner m Falkner u Falkner s Falkner
(190 nm) (270 j im] (280 um) (450 urn) (930 jinn) (180 j jm) (280 um) (400 j im) (500 j im)
9 Gi lber t a Gi lbert s Gi lbert A Tsubaki et al A Tsubaki et al o Fernandez Luque 0 Fernandez Luque It Willis X Williams
( 505 jim) ( 785 Jim) (1710 pm) (1260 jim) (1460 jjm) ( 900 jjm) (1800 Jim) ( 540jim) (1350 um)
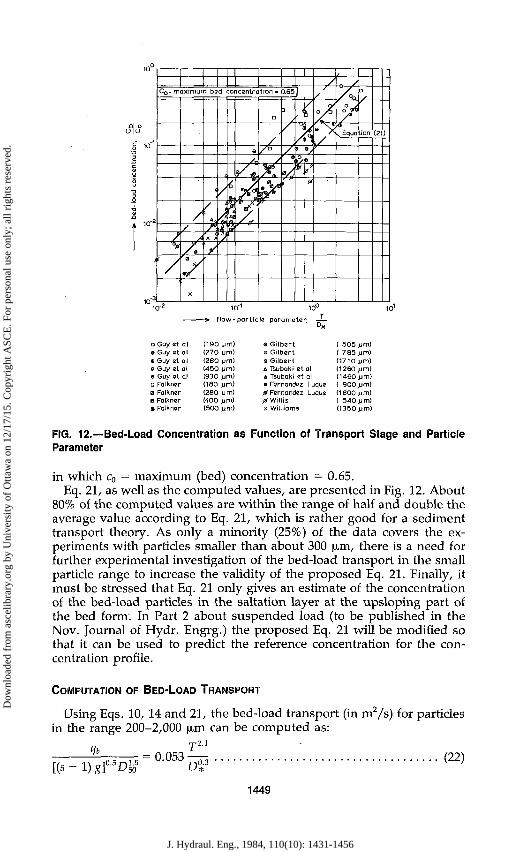
FIG. 12,—Bed-Load Concentration as Function of Transport Stage and Particle Parameter
in which c0 = maximum (bed) concentration = 0.65. Eq. 21, as well as the computed values, are presented in Fig. 12. About
80% of the computed values are within the range of half and double the average value according to Eq. 21, which is rather good for a sediment transport theory. As only a minority (25%) of the data covers the experiments with particles smaller than about 300 |xm, there is a need for further experimental investigation of the bed-load transport in the small particle range to increase the validity of the proposed Eq. 21. Finally, it must be stressed that Eq. 21 only gives an estimate of the concentration of the bed-load particles in the saltation layer at the upsloping part of the bed form. In Part 2 about suspended load (to be published in the Nov. Journal of Hydr. Engrg.) the proposed Eq. 21 will be modified so that it can be used to predict the reference concentration for the concentration profile.
COMPUTATION OF BED-LOAD TRANSPORT
Using Eqs. 10, 14 and 21, the bed-load transport (in m2/s) for particles in the range 200-2,000 |ji,m can be computed as:
T21 qb
n . . , = 0.053 — r , (22) [ ( s - l ) g ] o s Djo 5 D l 3
1449
J. Hydraul. Eng., 1984, 110(10): 1431-1456
Dow
nloa
ded
from
asc
elib
rary
.org
by
Uni
vers
ity o
f O
ttaw
a on
12/
17/1
5. C
opyr
ight
ASC
E. F
or p
erso
nal u
se o
nly;
all
righ
ts r
eser
ved.
The input data are: mean flow velocity («), mean flow depth (d), mean flow width (b), particle diameters (D5o,D90), density of water and sediment (p, ps), viscosity coefficient (v) and acceleration of gravity (g). The computation of the bed-load transport is as follows:
1. Compute particle parameter, D# using Eq. 1. 2. Compute critical bed-shear velocity, «* cr according to Shields
(Fig- 1). 3. Compute Chezy-coefficient related to grains, C using Eq. 18. 4. Compute effective bed-shear velocity, « i (with a maximum value
equal to M*) using Eq. 17. 5. Compute transport stage parameter, T using Eq. 2. 6. Compute bed-load transport, qb using Eq. 22.
VERIFICATION
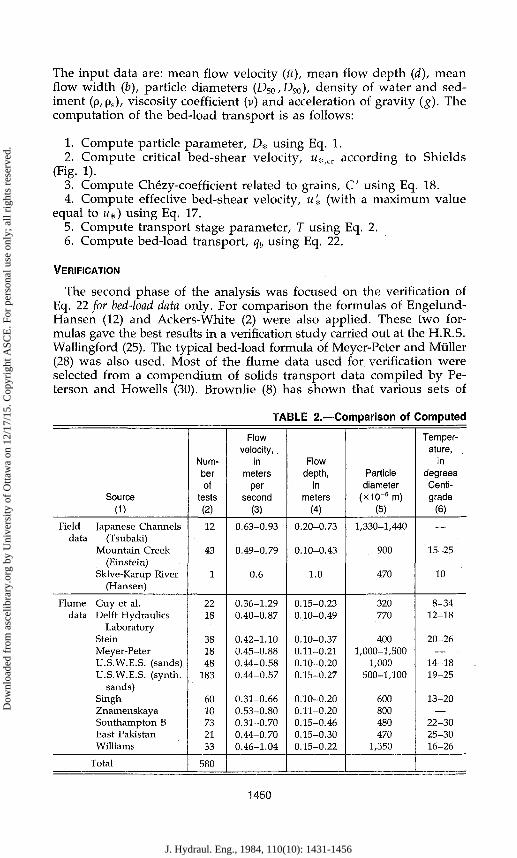
The second phase of the analysis was focused on the verification of Eq. 22 for bed-load data only. For comparison the formulas of Engelund-Hansen (12) and Ackers-White (2) were also applied. These two formulas gave the best results in a verification study carried out at the H.R.S. Wallingford (25). The typical bed-load formula of Meyer-Peter and Miiller (28) was also used. Most of the flume data used for verification were selected from a compendium of solids transport data compiled by Peterson and Howells (30). Brownlie (8) has shown that various sets of
TABLE 2.—Comparison of Computed
Source (1)
Field Japanese Channels data (Tsubaki)
Mountain Creek (Einstein)
Skive-Karup River (Hansen)
Flume Guy et al. data Delft Hydraulics
Laboratory Stein Meyer-Peter U.S.W.E.S. (sands). U.S.W.E.S. (synth.
sands) Singh Znamenskaya Southampton B East Pakistan Williams
Total
Number of
tests (2)
12
43
1
22 18
38 18 48
183
60 10 73 21 33
580
Flow velocity, .
in meters
per second
(3)
0.63-0.93
0.49-0.79
0.6
0.36-1.29 0.40-0.87
0.42-1.10 0.45-0.88 0.44-0.58 0.44-0.57
0.31-0.66 0.53-0.80 0.31-0.70 0.44-0.70 0.46-1.04
Flow depth,
in meters
(4)
0.20-0.73
0.10-0.43
1.0
0.15-0.23 0.10-0.49
0.10-0.37 0.11-0.21 0.10-0.20 0.15-0.27
0.10-0.20 0.11-0.20 0.15-0.46 0.15-0.30 0.15-0.22
Particle diameter
(x10"6m) (5)
1,330-1,440
900
470
320 770
400 1,000-1,500
1,000 500-1,100
600 800 480 470
1,350
Temperature,
in degrees Centigrade
(6)
15-25
10
8-34 12-18
20-26
14-18 19-25
13-20
22-30 25-30 16-26
1450
J. Hydraul. Eng., 1984, 110(10): 1431-1456
Dow
nloa
ded
from
asc
elib
rary
.org
by
Uni
vers
ity o
f O
ttaw
a on
12/
17/1
5. C
opyr
ight
ASC
E. F
or p
erso
nal u
se o
nly;
all
righ
ts r
eser
ved.
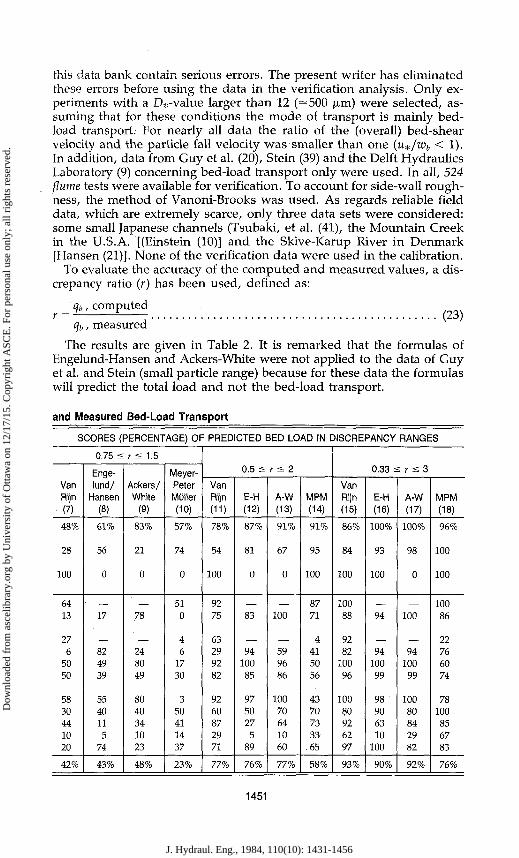
this data bank contain serious errors. The present writer has eliminated these errors before using the data in the verification analysis. Only experiments with a D*-value larger than 12 (=500 fim) were selected, assuming that for these conditions the mode of transport is mainly bed-load transport. For nearly all data the ratio of the (overall) bed-shear velocity and the particle fall velocity was smaller than one (u*/wb < 1). In addition, data from Guy et al. (20), Stein (39) and the Delft Hydraulics Laboratory (9) concerning bed-load transport only were used. In all, 524 flume tests were available for verification. To account for side-wall roughness, the method of Vanoni-Brooks was used. As regards reliable field data, which are extremely scarce, only three data sets were considered: some small Japanese channels (Tsubaki, et al. (41), the Mountain Creek in the U.S.A. [(Einstein (10)] and the Skive-Karup River in Denmark [Hansen (21)]. None of the verification data were used in the calibration.
To evaluate the accuracy of the computed and measured values, a discrepancy ratio (r) has been used, defined as:
r _ > > computed cjt,, measured
The results are given in Table 2. It is remarked that the formulas of Engelund-Hansen and Ackers-White were not applied to the data of Guy et al. and Stein (small particle range) because for these data the formulas will predict the total load and not the bed-load transport.
and Measured Bed-Load Transport
SCORES (PERCENTAGE) OF PREDICTED BED LOAD IN DISCREPANCY RANGES
Van Rijn (7)
48%
28
100
64 13
27 6
50 50
58 30 44 10 20
42%
0.75 ==
Enge-lund/
Hansen (8)
61%
56
0
— 17
82 49 39
55 40 11 5
74
43%
r < 1.5
Ackers/ White
(9)
83%
21
0
— 78
24 80 49
80 40 34 10 23
48%
Meyer-Peter Muller (10)
57%
74
0
51 0
4 6
17 30
3 50 41 14 37
23%
Van Rijn (11)
78%
54
100
92 75
63 29 92 82
92 60 87 29 71
77%
0.5 £
E-H (12)
87%
81
0
— 83
94 100 85
97 50 27 5
89
76%
r =£ 2
A-W (13)
91%
67
0
— 100
59 96 86
100 70 64 10 60
77%
MPM (14)
91%
95
100
87 71
4 41 50 56
43 70 73 33
.65
58%
Van Rijn (15)
86%
84
100
100 88
92 82
100 96
100 80 92 62 97
93%
0.33 < r < 3
E-H (16)
100%
93
100
94
94 100 99
98 90 63 10
100
90%
A-W (17)
100%
98
0
100
94 100 99
100 80 84 29 82
92%
MPM (18)
96%
100
100
100 86
22 76 60 74
78 100 85 67 83
76%
1451
J. Hydraul. Eng., 1984, 110(10): 1431-1456
Dow
nloa
ded
from
asc
elib
rary
.org
by
Uni
vers
ity o
f O
ttaw
a on
12/
17/1
5. C
opyr
ight
ASC
E. F
or p
erso
nal u
se o
nly;
all
righ
ts r
eser
ved.
The proposed method scores an average percentage of 42% in the discrepancy ratio range of 0.75-1.5, and an average percentage of 77% in the range 0.5-2. The formulas of Engelund-Hansen and Ackers-White have about the same accuracy. In the range 0.5-2 the Engelund-Hansen formula scores a percentage of 76%, while the Ackers-White formula has a value of 77%. The formula of Meyer-Peter and Miiller yields the least good results with a score of 58% in the range 0.5-2. A sensitivity analysis showed that the computed bed-load transport according to the proposed method is rather sensitive to the computed grain-shear velocity («*) in the case of a small flow depth (flumes) and a large particle diameter (D50 = 1,000-2,000 n-m). For example, the data of Meyer-Peter had a considerably better score for a grain roughness ks = D9Q instead of ks = 3D90. An analysis of the computed and measured transport rates showed that the computed values are somewhat too large for a T-pa-rameter in the range 1-5. No serious errors in relation to the D*-param-eter are present (35). Finally, the accuracy of the measured transport rates is reviewed. It must be stressed that an investigation of flume experiments performed under similar flow conditions (equal depth, velocity, particle size, temperature) by various research workers showed deviations upto a factor 2 (35). Thus, even under controlled flume conditions, the accuracy of the measured values may be rather low, which may be caused by the influence of the applied width-depth ratio (43), the applied adjustment period to establish uniform flow conditions and the applied experimental method (sand feed or recirculating flume).
Concludingly, it may be stated that it is hardly possible to predict the transport rate with an inaccuracy less than a factor 2.
CONCLUSIONS
The aim of this study was to investigate the motion of the bed-load particles and to establish simple expressions for the particle characteristics and transport rate both for small and large particles. Particularly, in the small particle range (100-500 (xm) a reliable bed-load transport formula is of importance because the predicted bed-load transport can be used as a boundary condition (reference concentration) in the mathematical modelling of suspended sediment, as will be shown in Part 2 about suspended load (to be published).
The main conclusions of this study are:
1. The saltation of a small particle is dominated by drag forces resulting in long but flat particle trajectories, while the saltation of a large particle is dominated by lift forces resulting in short but high trajectories.
2. Close to the bed the lift force is relatively large compared with the submerged particle weight both for small and large particles.
3. The saltation height and the particle velocity, which were used to determine the bed-load concentration can be represented by simple expressions.
4. Using the expressions for the saltation height and the particle velocity, a simple function for the bed-load concentration has been derived from measured bed-load transport rates.
5. The proposed equations predict a reliable estimate of the bed-load
1452
J. Hydraul. Eng., 1984, 110(10): 1431-1456
Dow
nloa
ded
from
asc
elib
rary
.org
by
Uni
vers
ity o
f O
ttaw
a on
12/
17/1
5. C
opyr
ight
ASC
E. F
or p
erso
nal u
se o
nly;
all
righ
ts r
eser
ved.
transport in the particle range 200-2,000 |xm, which is based on a verification study using 580 flume and field data, resulting in a score of 77% of the predicted bed-load transport rates in the range of 0.5-2.0 times the measured values.
6. The overall inaccuracy of the predicted transport rates may not be less than a factor 2 because the data used for calibration and verification show deviations upto a factor 2.
ACKNOWLEDGMENTS
H.N.C. Breusers and N. J. van Wijngaarden of the Delft Hydraulics Laboratory and M. de Vries of the Delft University of Technology are gratefully acknowledged for their theoretical support.
APPENDIX I.—REFERENCES
1. Abbott, J. E., and Francis, J. R. D., "Saltation and Suspension Trajectories of Solid Grains in a Water Stream," Proc. Royal Soc, London, England, Vol. 284, A 1321, 1977.
2. Ackers, P., and White, W. R., "Sediment Transport: New Approach and Analysis," Journal of the Hydraulics Division, ASCE, No. HY11, 1973.
3. Bagnold, R. A., The Physics of Blown Sands and Desert Dunes, Methuen, London, England, 1941.
4. Bagnold, R. A., "Experiments on a Gravity-free Dispersion of Large Solid Spheres in a Newtonian Fluid Under Shear," Proc. Royal Soc, London, England, Vol. 225A, 1954.
5. Bagnold, R. A., "The Flow of Cohesionless Grains in Fluids," Proc. Royal Soc, London, England, Vol. 249, 1956.
6. Bagnold, R. A., "An Approach to the Sediment Transport Problem from General Physics," Geological Survey Prof. Paper 422-1, Wash., 1966.
7. Bagnold, R. A., "The Nature of Saltation and of Bed-Load Transport in Water," Proc Royal Soc, London, England, A 332, 1973.
8. Brownlie, W. R., discussion of "Total Load Transport in Alluvial Channels," Journal of the Hydraulics Division, Proc, ASCE, No. HY12, 1981.
9. Delft Hydraulics Laboratory, "Verification of Flume Tests and Accuracy of Flow Parameters," Note R 657-VI, Delft, The Netherlands, June, 1979 (in Dutch).
10. Einstein, H. A., "Bed-Load Transportation in Mountain Creek," U.S. Department of Agriculture, Washington, D.C., 1944.
11. Einstein, H. A., "The Bed-Load Function for Sediment Transportation in Open Channel Flow," United States Department of Agriculture, Washington, D.C., Technical Bulletin No. 1026, Sept., 1950, p. 25.
12. Engelund, F., and Hansen, E., "A Monograph on Sediment Transport," Tek-nisk Forlag,. Copenhagen, Denmark, 1967.
13. Engelund, F., and Freds0e, J., "A Sediment Transport Model for Straight Alluvial Channels," Nordic Hydrology 7, 1967, pp. 294 and 298.
14. Falkner, H., "Studies of River Bed Materials and Their Movement with Special Reference to the Lower Mississippi River, Paper 17, U.S. Waterways Exp. Station, Vicksburg, Miss., 1935.
15. Fernandez Luque, R., "Erosion and Transport of Bed-load Sediment," Dissertation, Krips Repro B.V., Meppel, The Netherlands, 1974.
16. Fernandez Luque, R., and Beek, R. van, "Erosion and Transport of Bed-load Sediment," Journal of Hydraulic Research, Vol. 14, No. 2, 1976.
17. Francis, J. R. D., "Experiments on the Motion of Solitary Grains along the Bed of a Water-Stream," Proc. Royal Soc, London, England, A332, 1973.
18. Gilbert, G. K., "Transportation of Debris by Running Water," Prof. Paper 86, U.S. Geol. Survey, Wash., 1914.
1453
J. Hydraul. Eng., 1984, 110(10): 1431-1456
Dow
nloa
ded
from
asc
elib
rary
.org
by
Uni
vers
ity o
f O
ttaw
a on
12/
17/1
5. C
opyr
ight
ASC
E. F
or p
erso
nal u
se o
nly;
all
righ
ts r
eser
ved.
19. Gladki, H., discussion of "Determination of Sand Roughness for Fixed Beds," Journal of Hydraulic Research, Vol. 13, No. 2, 1975.
20. Guy, H. P., Simons, D. B., and Richardson, E. V., "Summary of Alluvial Channel Data from Flume Experiments," 1956-1961, Geol. Survey Prof. Paper 462-1, Wash., 1966.
21. Hansen, E., "Bed-Load Investigation in Skive-Karup River," Technical University Denmark, Bulletin No. 12, 1966.
22. Hayashi, T., and Ozaki, S., "On the Unit Step Length of Saltation of Sediment Particles in the Bed-Load Layer," Third Int. Symp. on Stochastic Hydraulics, Tokyo, Japan, 1980.
23. Hey, R. D., "Flow Resistance in Gravel-Bed Rivers," Journal of the Hydraulics Div., Proc, ASCE, No. HY4, 1979.
24. Hinze, J. O., Turbulence, 2nd Ed., McGraw-Hill Book Co., New York, N.Y., 1975.
25. Hydraulics Research Station Wallingford, "Sediment Transport: An Appraisal of Available Methods," Int. 119, Wallingford, England, Nov., 1973.
26. Kamphuis, J. W., "Determination of Sand Roughness for Fixed Beds," Journal of Hydraulic Research, Vol. 12, No. 2, 1974.
27. Mahmood, K., "Flow in Sand Bed Channels," Water Management Tech. Report, No. 11, Colorado State Univ., Fort Collins, Colo., 1971.
28. Meyer-Peter, E., and Muller, R., "Formulas for Bed-Load Transport," Proceedings, Second Congress IAHR, Stockholm, Sweden, 1948.
29. Morsi, S. A., and Alexander, A. J., "An Investigation of Particle Trajectories in Two-Phase Flow Systems," Journal of Fluid Mechanics, Vol. 55, Part 2, 1972, p. 207.
30. Peterson, A. W., and Howells, R. F., "A Compendium of Solids Transport Data for Mobile Boundary Channels," Report No. HY-1973-ST3, Dep. of Civ. Eng., Univ. of Alberta, Canada, Jan., 1973.
31. Poreh, M., Sagiv, A., and Seginer, J., "Sediment Sampling Efficiency of Slots," Journal of the Hydraulics Division, ASCE, No. HY10, Oct., 1970.
32. Raudkivi, A. J., "Study of Sediment Ripple Formation," Journal of the Hydraulics Division, ASCE, No. HY6, Nov., 1963.
33. Reizes, J. A., "Numerical Study of Continuous Saltation," Journal of the Hydraulics Division, ASCE, No. HY9, 1978.
34. Rubinow, S. I., and Keller, J. B., "The Transverse Force on a Spinning Sphere Moving in a Viscous Fluid," Journal of Fluid Mechanics, Vol. 11, 1961, p. 454.
35. Rijn, L. C. van, "Computation of Bed-Load Concentration and Bed-Load Transport," Delft Hydraulics Laboratory, Research Report S 487-1, Delft, The Netherlands, Mar. 1981.
36. Rijn, L. C. van, "Equivalent Roughness of Alluvial Bed," Journal of the Hydraulics Division, ASCE, No. HY10, 1982.
37. Saffman, P. G., "The Lift on a Small Sphere in a Slow Shear Flow," Journal of Fluid Mechanics, Vol. 22, 1965, p. 393, and Vol. 31, 1968.
38. Shields, A., Anwendung der Ahnlichkeitsmechanik und der Turbulenzfor-schung auf die Geschiebebewegung, Mitt, der Preuss. Versuchsanst. fur Wasserbau und Schiffbau, Heft 26, Berlin, Germany 1936.
39. Stein, R. A., "Laboratory Studies of Total Load and Apparent Bed Load," Journal of Geophysical Research, Vol. 70, No. 8, 1965.
40. Sumer, B. M., and Deigaard, R., "Experimental Investigation of Motions of Suspended Heavy Particles and the Bursting Process," Institute of Hydrodynamics and Hydraulic Engineering, Tech. Univ. Denmark, No. 23, Nov., 1979, p. 86.
41. Tsubaki, T., and Shinohara, K., "On the Characteristics of Sand Waves Formed upon Beds of Open Channels and Rivers," Reports of Research Institute for Applied Mechanics, Vol. VII, No. 25, Japan, 1959.
42. Vanoni, V. A., and Brooks, N. H., "Laboratory Studies of the Roughness and Suspended Load of Alluvial Streams," Sedimentation Laboratory, California Institute of Technology, Report E-68, Pasadena, Calif., 1957.
43. Williams, P. G., "Flume Width and Water Depth Effects in Sediment Trans-
1454
J. Hydraul. Eng., 1984, 110(10): 1431-1456
Dow
nloa
ded
from
asc
elib
rary
.org
by
Uni
vers
ity o
f O
ttaw
a on
12/
17/1
5. C
opyr
ight
ASC
E. F
or p
erso
nal u
se o
nly;
all
righ
ts r
eser
ved.
port Experiments," Geol. Survey Prof. Paper 562-H, page H5, Washington, D.C., 1970.
44. Willis, J. C , "Suspended Load from Error-Function Models," Journal of the Hydraulics Division, ASCE, No. HY7, July, 1979.
45. White, B. R., and Schultz, J. C , "Magnus Effect in Saltation," Journal of Fluid Mechanics, Vol. 81, 1977, p. 507.
46. Yalin, M. S., Mechanics of Sediment Transport, Pergamon Press, New York, N.Y., 1972, pp. 54-61.
APPENDIX li.—NOTATION
The following symbols are used in this paper:
A C
c Cb
cD D
D* d
FD FG FL Fw
g ks
m Q Hb
Rb R r S s T u u
uh
w* wi
M*,cr Vr
Wb
x,z x,z x,z
Zo
<*L a,„ h 9
= = = = = = = = = = = = = = = = = = = = = = = = = = = = = = = = = = = = = = =
area of cross section (L2); Chezy-coefficient (L°-5r_1); Chezy-coefficient related to grain roughness (L0 5r_ 1); bed-load concentration (volume = ps 103 cb in ppm); drag-coefficient; particle diameter (I); dimensionless particle parameter; flow depth (L); fluid drag force (MLT~2); gravitational force (MLT~2); fluid lift force (MLT~2); frictional force (MLT~2) acceleration of gravity (LT~2); equivalent roughness of Nikuradse (L); mass (M); flow discharge (L3r_ 1); bed-load transport per unit width (L2T_1); hydraulic radius (L); Reynolds number; discrepancy ratio; slope; specific density; transport stage parameter; longitudinal flow velocity (LT'1); average flow velocity (LT'1); particle velocity (LT™1); bed-shear velocity (LT'1); effective bed-shear velocity (LT-1); critical bed-shear velocity according to Shields (LT'1); relative particle velocity (LT'1); particle fall velocity of bed material (LT'1); longitudinal, vertical coordinate (L); longitudinal, vertical particle velocity (LT'1); longitudinal, vertical particle acceleration (LT'2); zero-velocity level (L); lift coefficient; added mass coefficient; saltation height (L); particle mobility parameter;
1455
J. Hydraul. Eng., 1984, 110(10): 1431-1456
Dow
nloa
ded
from
asc
elib
rary
.org
by
Uni
vers
ity o
f O
ttaw
a on
12/
17/1
5. C
opyr
ight
ASC
E. F
or p
erso
nal u
se o
nly;
all
righ
ts r
eser
ved.
K = constant of Von Karman; Xb = saltation length (L); (x = dynamic viscosity coefficient (ML^T*1);
|j-(, = bed form factor; v = kinematic viscosity coefficient (L2T_1); p = density of fluid (ML'3);
ps = densi ty of sed imen t (ML"3); <rs = geometric standard deviation of bed material; Tfc = bed-shear stress ( M L _ 1 r ~ 2 ) ; T£ = effective b e d shear s t ress (ML~%T~2); a n d a) = angular velocity (T~x).
1456
J. Hydraul. Eng., 1984, 110(10): 1431-1456
Dow
nloa
ded
from
asc
elib
rary
.org
by
Uni
vers
ity o
f O
ttaw
a on
12/
17/1
5. C
opyr
ight
ASC
E. F
or p
erso
nal u
se o
nly;
all
righ
ts r
eser
ved.