sediment transport-environmental health
TRANSCRIPT

LOGOSediment transport and Coastal
erosion
Al-Azhar University-Gaza
Master Program of Water and Environmental
Science

Contents
Introduction 1
Study Area2
Materials & Methods3
Results & Discussion4
Conclusions5
2

33
Rosetta Promontory
Mediterranean Sea
Nile River
1900
1964
1971
1988
1990
1991
1996
2000
1900
1964
1971
1988
1990
1991
1996
2000
1900
1964
1971
1988
1990
1991
1996
2000

1
2
3
1. Introduction
Construction of the low Aswan dam in 1902 and the
high Aswan dam in 1964 has almost completely
interrupted the Nile River sediment discharge to the sea
(Inman et al, 1976)
Bardawil lagoon sandbar and Delta continue to act as a
significant source and supplier of sand to Gaza coast
(Inman et al, 1976)
Most sediments coming to Gaza are originally from Nile
River and it is about 350,000 cubic meter annually
(Perlin and Kit, 1999)
4

1. Introduction
5

1. Introduction
Alongshore sediment transport can calculate using the following
expressions:
CERC expression
(1)
Kamphuis expression
(2)
where
Hb = breaking wave height,
mb = seabed slop,
D50 = characteristic rock diameter,
αb = breaking wave angle.
6

1. Introduction
7
Sediment,
m3/year
Duration
(d)
ab
(Deg)
Hb
(m)
a0
(Deg)
Ts
(Sec)
Hs
(m)
Wave
Scenarios
60,74628980.62266.30.5H ≤ 1.0m
73,4046361.46157.11.31.0 < H ≤ 2.0
48,8511082.53178.02.42.0 < H ≤ 3.0
31,0502.793.49188.83.43.0 < H ≤ 4.0
3,0780.334.3259.44.2H > 4.0m
220,000365Total
Annual bulk sediment transport rates for Gaza beach (idku)
1. Introduction
8
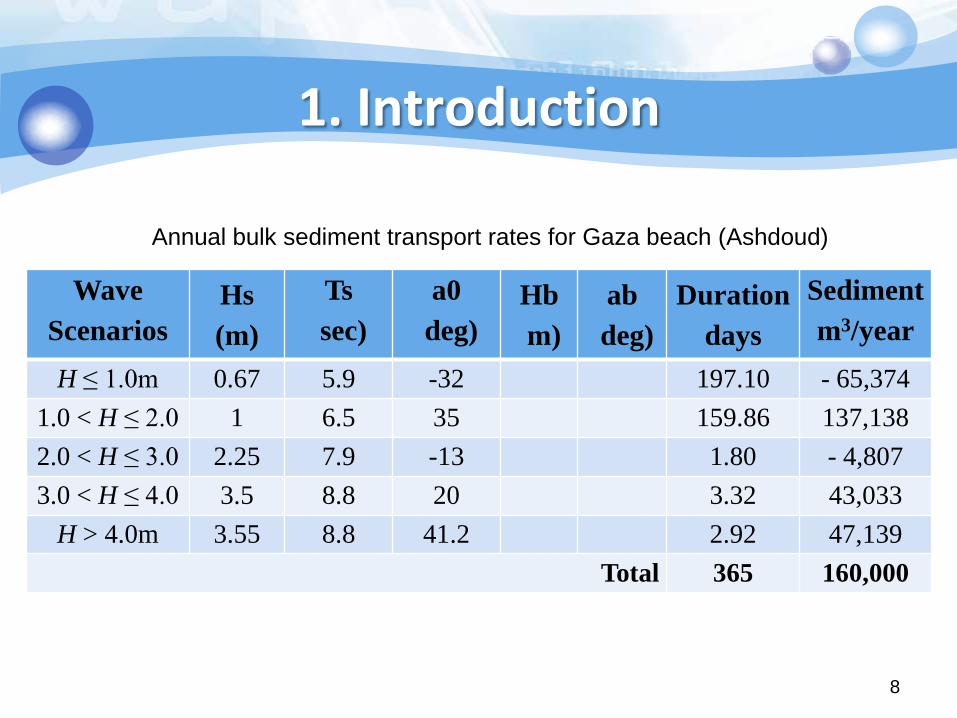
Sediment
m3/year
Duration
days
ab
deg)
Hb
m)
a0
deg)
Ts
sec)
Hs
(m)
Wave
Scenarios
- 65,374197.10-325.90.67H ≤ 1.0m
137,138159.86356.511.0 < H ≤ 2.0
- 4,8071.80-137.92.252.0 < H ≤ 3.0
43,0333.32208.83.53.0 < H ≤ 4.0
47,1392.9241.28.83.55H > 4.0m
160,000365Total
Annual bulk sediment transport rates for Gaza beach (Ashdoud)
1. Introduction
9
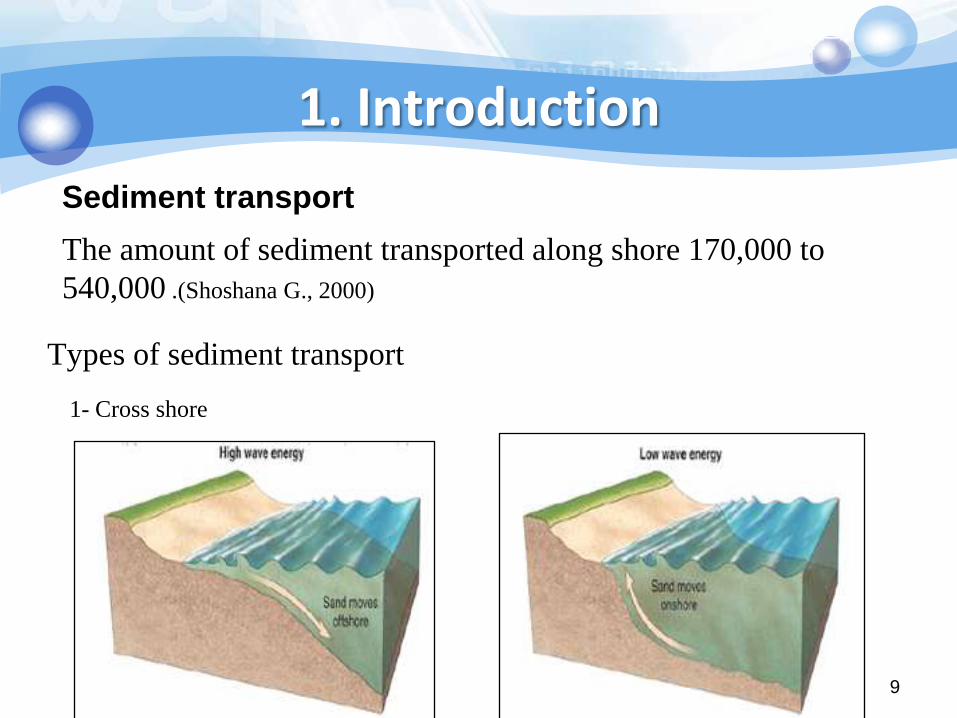
Sediment transport
Types of sediment transport
The amount of sediment transported along shore 170,000 to
540,000 .(Shoshana G., 2000)
1- Cross shore

1. Introduction
10
Sediment transport
2- Alongshore

1. Introduction
In recent decades, the coast of Gaza has been
plagued by a serious shortage of sand and by erosion11

4
1. Introduction
The coast of Gaza was affected by man-made structures
prior to the fishing harbour (Zviely and Klein, 2003)
In 1972 two groins, 120m long each 500m apart
12

5The erosion was controlled by a series of nine
detached breakwaters built in 1978
The detached
breakwaters, 50-120 m
long, were built 50 m
from the coast line at a
depth of 1 m
1. Introduction
13
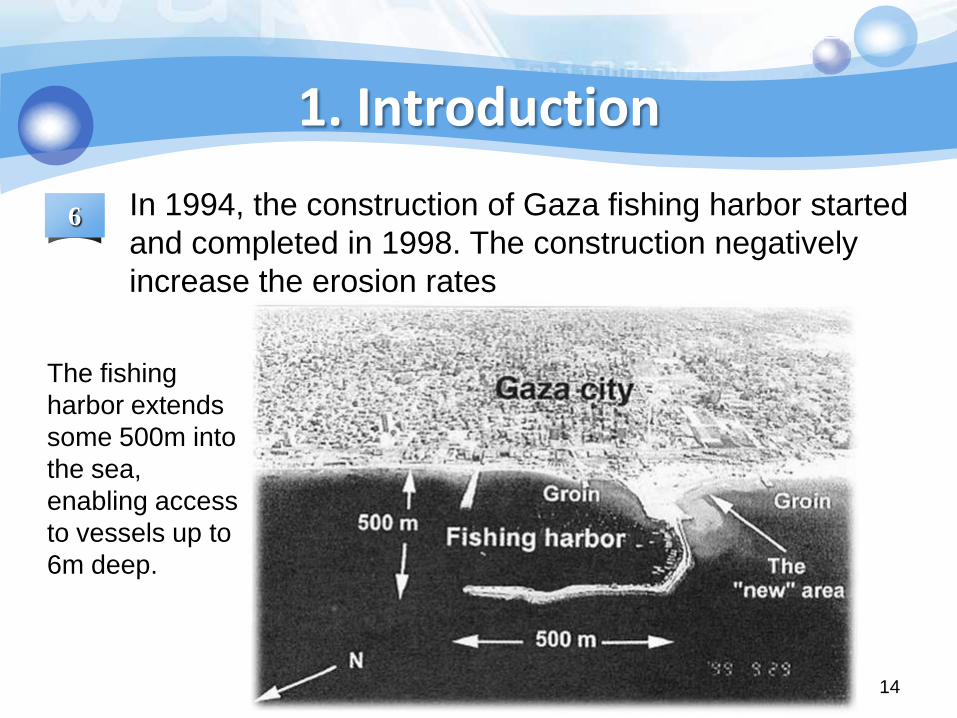
6 In 1994, the construction of Gaza fishing harbor started
and completed in 1998. The construction negatively
increase the erosion rates
The fishing
harbor extends
some 500m into
the sea,
enabling access
to vessels up to
6m deep.
1. Introduction
14

2. Study Area
The study covers an area
extended from Wadi Gaza up to
3km north the Gaza fishing
harbour
15

16
Gaza harbor

17

18

3. Materials and Methods
Data were collected from analyses of Landsat
images from 1972 to 2010 and combined with
sample collection for grain size analyses in
order to study the shoreline change
Numerical model runs to predict the
morphodynamics around the mitigation
structures were carried out
19

3.1 Satellite images
Image source DateResolution
[m m]
Landsat 1 MSS 29-06-1972 60.0 60.0
Landsat 5 MSS 14-05-1984 60.0 60.0
Landsat 5 TM 29-05-1998 30.0 30.0
Landsat 5 TM 29-03-2003 30.030.0
Landsat 7 ETM+ 04-06-2010 30.030.0
3. Materials and Methods
The infrared band was selected for
the subsequent image processing.
The image processing procedures
were carried out using ERDAS
Imagine and ArcGIS
20

3.2 Numerical model
The relocation of fishing harbor to offshore,
groins field system, detached breakwaters and
wide-crested submerged breakwaters were
suggested and examined using the
morphodynamic numerical model of nearshore
waves, currents, and sediment transport in order
to mitigate the coastal erosion (Seif et al., 2011)
3. Materials and Methods
21

4. Results and Discussion
Image period
Erosion Accretion
area ×103
[m2]
rate ×103
[m2 year-1]
area ×103
[m2]
rate ×103
[m2 year-1]
1972-1984 180 15 122 10
1984-1998 200 14 224 16
1998-2003 8 2 190 38
2003-2010 143 20 70 10
Total 531 14 606 16
Accretion and erosion rates for the study area
4.1 Remote sensing findings
The impact has extended to about 2.5km
to north and to south the harbor
The waterline advanced at the south of
harbor by 0.75 m year-1 and treated at the
north of harbor by 1.15 m year-1
22

4.2 Sediment transport rates
The net annual rate of wave-induced
alongshore sediment transport range from
minimum 160×103 to maximum 220×103 m3,
and the average annual rate of 190×103 m3,
northward
The sand volume of accretion was estimated
80×103 m3 per year
4. Results and Discussion
23

4.3 Numerical model results
4. Results and Discussion
Offshore fishing harbor
model test
Unit: m
0.2
0.2
0.20.4
0.4
0.4
0.6
0.6
0.60.8
0.8
0.81
1
11.2
1.2
1.21.4
1.4
1.4
1.6 1.6
1.81.8
222.2
2.22.4 2.4
2.6 2.6
2.8 2.8
33.23.43.6
3.84
4.2
0
0
0 0
0
0000
00000
000
0
1000
800
600
400
200
0
0 200 400 600 800 1000
X(m
)
Y(m )
1000
800
600
400
200
0 200 400 600 800 1000
X(m
)
Y(m)
1m/s
-1
0
1
2
34
5 5
6
7
8
5 5
1000
800
600
400
200
0
0 200 400 600 800 1000
X(m
)
Y(m )
Unit: m-1
0
1
2
34
5 5
6
7
8
3
5 5
1000
800
600
400
200
0
0 200 400 600 800 1000
X(m
)
Y(m )
Unit: m
N
N
24

25

4. Results and Discussion
Detached breakwater
model test
0.2 0.20.4 0.4
0.60.811.21.41.61.822.22.42.62.83
3.23.43.6
3.8
4
4.2
0
0
0
800
600
400
200
0
0 100 200 300 400 500 600
X(m
)
Y(m )
Unit: m1m/s
800
600
400
200
0 200 400 600
X(m
)
Y(m)
-1
0
1
2
3
4
5
6
7
8
9
10
11
12
13
1414
800
600
400
200
0
0 100 200 300 400 500 600
X(m
)
Y(m )
Unit: m -1
0
1
2
34
5
6
7
8
9
10
11
12
13
1414
5
800
600
400
200
0
0 100 200 300 400 500 600
X(m
)Y(m )
Unit: m
N4.3 Numerical model results
26

4. Results and Discussion4.3 Numerical model results N
Submerged
breakwaters model
test
0.20.40.60.811.2
1.4
1.4
1.4
0
0
800
600
400
200
0
0 100 200 300 400 500 600
X(m
)
Y(m )
Unit: m
1m/s
800
600
400
200
0 200 400 600
X(m
)
Y(m)
-1
0
1
2
3
45
6
7
8
9
10
11
12
13
1414
32
800
600
400
200
0
0 100 200 300 400 500 600
X(m
)
Y(m )
Unit: m -1
0
12
3
4
5
6
7
8
9
10
11
12
13
1414
32
800
600
400
200
0
0 100 200 300 400 500 600
X(m
)
Y(m )
Unit: m
27

4. Results and Discussion4.3 Numerical model results N
0.20.40.60.811.21.41.61.82
2.22.42.62.83
3.23.43.6
3.8
4
4.2
0
0
800
600
400
200
0
0 100 200 300 400 500 600
X(m
)
Y(m )
Unit: m
1m/s
800
600
400
200
0 200 400 600
X(m
)
Y(m)
-1
0
1
2
3
4
5
6
7
8
9
10
11
12
13
1414
800
600
400
200
0
0 100 200 300 400 500 600
X(m
)
Y(m )
Unit: m -1
012
3
4
5
6
7
8
9
10
11
12
13
1414
800
600
400
200
0
0 100 200 300 400 500 600
X(m
)Y(m )
Unit: m
Groins field system model
test
28

4. Results and Discussion
4.3 Numerical model results
Mitigation alternativeAnnual rate
[m3 km-1]Remarks
Relocation of harbor + 4×10³ Accretion
Detached BW ‒23×103 Erosion
Submersed BW +28×103 Accretion
Groins field system ‒22×103 Erosion
Environmental impact of various mitigation alternatives
29

The erosion problem along Gaza beach is due
to the man-made structures as confirmed by
analyzing the historical satellite images from
1972 to 2010
The numerical model results show that the
offshore harbor is the best alternative for Gaza
beach restoration
Alternatively, the wide-crested submerged
breakwater, “artificial reef”, is an effective
structure for preventing sandy beach erosion
5. Conclusions
30

Mazen Abualtayef, Ahmed Abu Foul, Ahmed Khaled Seif, Abdel Fattah Abd
Rabou, Omar Matar, Rashad Alhourani, Samir Matar, and Ibrahim Alshiekh.
Mitigation measures for Gaza caostal erosion. 4th International Engineering
Conference, Islamic University of Gaza, Gaza, Palestine, pp 1-13, October
15-16, 2012
Ahmed Seif. Numerical simulation of 3D morphodynamic around coastal
structures using quasi-3D nearshore current model. Doctorate thesis, Tottori
university, 2011.
Ahmed Seif, Masamitsu Kuroiwa, Mazen Abualtayef, Hajime Mase, Yuhei
Matsubara. A hydrodynamic model of nearshore waves and wave-induced
currents. Inter. J. Nav. Archit. Oc. Engng, 3(3), 216-224, 2011.
Burcharth H, Hawkins S, Zanuttigh B, Lamberti A. Environmental design
guidelines for low crested coastal structures, 2007.
Lee E. Harris, Ph.D., P.E. Investigations and recommendations for solutions
to the beach erosion problems in the city of Herzliya, Israel, 2007.
References
31

Dov Zviely and Micha Klein. The environmental impact of the Gaza Strip
coastal constructions. Journal of coastal research, 19(4), 1122-1127, 2003.
M. A. Azab and A. M. Noor. Change detection of the North Sinai coast by
using remote sensing and geographic information system, 2003.
Palestinian National Authority, Ministry of Environmental affairs. Gaza Coastal
and Marine Environmental Protection and Management Action Plan, 2000.
References
32
