securitization in india - asian development bank criteria for securitization in india 59 2 basel iii...
TRANSCRIPT

SECURITIZATION IN INDIAManaging Capital Constraints and Creating Liquidity to Fund Infrastructure Assets
India needs to spend close to Rs43 trillion (about $646 billion) on infrastructure through to 2022. Such a staggering requirement cannot be met though traditional sources such as public sector bank loans. India must immediately explore and quickly ramp up financing from alternative investment sources. This report provides an overview of infrastructure financing in India, sheds light on the challenges faced by the country’s banking sector, suggests an optimal mechanism for securitizing the infrastructure assets of public sector banks, and outlines a range of scenarios and factors that must be in place for this mechanism to be successfully realized.
About the Asian Development Bank
ADB’s vision is an Asia and Pacific region free of poverty. Its mission is to help its developing member countries reduce poverty and improve the quality of life of their people. Despite the region’s many successes, it remains home to a large share of the world’s poor. ADB is committed to reducing poverty through inclusive economic growth, environmentally sustainable growth, and regional integration.
Based in Manila, ADB is owned by 67 members, including 48 from the region. Its main instruments for helping its developing member countries are policy dialogue, loans, equity investments, guarantees, grants, and technical assistance.
SECURITIZATION IN INDIA MANAgINg CApITAl CONSTRAINTS AND CREATINg lIqUIDITy TO FUND INFRASTRUCTURE ASSETS
AsiAn Development BAnk6 ADB Avenue, Mandaluyong City1550 Metro Manila, Philippineswww.adb.org
ASIAN DEVELOPMENT BANK
Securitization covers.indd 1 11/8/17 6:15 PM

ASIAN DEVELOPMENT BANK
Jennifer Romero-Torres • Sameer Bhatia • Sudip Sural
SEcurITIzATION IN INDIAMANAGING CAPITAL CONSTRAINTS AND CREATING LIQUIDITY TO FUND INFRASTRUCTURE ASSETS

Creative Commons Attribution 3.0 IGO license (CC BY 3.0 IGO)
© 2017 Asian Development Bank6 ADB Avenue, Mandaluyong City, 1550 Metro Manila, PhilippinesTel +63 2 632 4444; Fax +63 2 636 2444www.adb.org
Some rights reserved. Published in 2017.
ISBN 978-92-9257-983-8 (print), 978-92-9257-984-5 (electronic)Publication Stock No. TCS179100-2DOI: http://dx.doi.org/10.22617/TCS179100-2
The views expressed in this publication are those of the authors and do not necessarily reflect the views and policies of the Asian Development Bank (ADB) or its Board of Governors or the governments they represent.
ADB does not guarantee the accuracy of the data included in this publication and accepts no responsibility for any consequence of their use. The mention of specific companies or products of manufacturers does not imply that they are endorsed or recommended by ADB in preference to others of a similar nature that are not mentioned.
By making any designation of or reference to a particular territory or geographic area, or by using the term “country” in this document, ADB does not intend to make any judgments as to the legal or other status of any territory or area.
This work is available under the Creative Commons Attribution 3.0 IGO license (CC BY 3.0 IGO) https://creativecommons.org/licenses/by/3.0/igo/. By using the content of this publication, you agree to be bound by the terms of this license. For attribution, translations, adaptations, and permissions, please read the provisions and terms of use at https://www.adb.org/terms-use#openaccess
This CC license does not apply to non-ADB copyright materials in this publication. If the material is attributed to another source, please contact the copyright owner or publisher of that source for permission to reproduce it. ADB cannot be held liable for any claims that arise as a result of your use of the material.
Please contact [email protected] if you have questions or comments with respect to content, or if you wish to obtain copyright permission for your intended use that does not fall within these terms, or for permission to use the ADB logo.
Notes: In this publication, “$” refers to US dollars. ADB recognizes “China” as the People’s Republic of China. Corrigenda to ADB publications may be found at http://www.adb.org/publications/corrigenda

iii
Contents
Figures and Tables v
Foreword vii
Acknowledgments ix
Abbreviations xi
I. Introduction 1
II. Infrastructure Financing in India 3A. Overview 3B. Gap Analysis for Infrastructure Investment in India 4C. Key Issues and Challenges in Infrastructure Financing 7D. Recent Developments in Infrastructure Financing in India 10
III. Banking Sector in India 13A. Overview 13B. Assessment of the Infrastructure Loan Portfolio
of Public Sector Banks in India 15C. The Capital Adequacy Challenge 17D. The Government’s Recapitalization Initiative: The Indradhanush Plan 20
IV. The Securitization Market in India 22A. Securitization Structures in India 22B. Key Trends 26C. Benefits and Challenges of Securitization 29D. Infrastructure Securitization in India: An Assessment
of the Enabling Framework 31
V. Securitization of Infrastructure Assets in India 39A. Overview 39B. Structure for Infrastructure Asset Securitization in India 39
VI. Value Analysis and Success Factors 49A. Overview 49B. About the State Bank of India 49C. Financial Analysis: Structure Characteristics 51D. Outcome: Scenario Analysis 52E. Key Success Factors 56

iv Contents
conclusion 58
Appendixes1 Criteria for Securitization in India 592 Basel III Risk Weights 613 Detailed Analysis of the Regulatory Framework 634 Regulatory Framework Highlights 695 Accounting Framework for Securitization 836 Detailed Assumptions for Value Analysis 947 Base-Case Outcomes: Detailed 97
About the Authors 98

v
Figures and Tables
Figures1 Sectoral Breakup of Infrastructure Needs in India, FY2017–FY2022 42 Gross Fixed Capital Formation, Indian Private Sector 53 Projected Infrastructure Investment—Debt 74 Scheduled Commercial Banks in India—Credit Portfolio, FY2006–FY2017 95 Banking Structure in India 136 Deployment of Nonfood Credit—Scheduled Commercial Banks
(as of February 2017) 167 How Securitization Works 228 Securitization Structure in India 239 Par Structure—An Illustration 2410 Premium Structure—An Illustration 2511 Risk Tranching in Securitization 2512 Time Tranching in Securitization 2613 Key Events in the Indian Securitization Market 2714 Securitization Issuance in India, by Volume 2815 Retail Asset Securitization—Pass-Through Certificates
and Direct Assignments 2816 Legal Framework Governing Securitization in India 3117 Accounting Process for Securitization 3718 Derecognition Process 3719 Credit Tranching—An Illustration 4120 Excess Interest Spread—An Illustration 4221 Cash Collateral—An Illustration 4322 Guarantee Facility—An Illustration 4423 Structure for Infrastructure Asset Securitization in India 4524 State Bank of India—Key Ratios 50A5 Accounting Framework for Securitization 85
Tables1 World Economic Forum—Countrywise Infrastructure Ranking 32 Past Trends in Infrastructure Investment in India 53 Forecast Debt Supply for Infrastructure from Public Sector Banks
and Scheduled Commercial Banks 84 Sources of Infrastructure Debt Funding—Global 85 Outstanding Credit of Scheduled Commercial Banks in India 146 Nonbanking Financial Companies in India—Year-on-Year Growth 157 Infrastructure Exposure of Selected Public Sector Banks in India 168 Public Sector Banks in India—Gross Nonperforming Assets
and Restructured Advances 17

vi Tables and Figures
9 Infrastructure Sector—Share in Restructured and Nonperforming Asset Advances 17
10 Year-on-Year Minimum Capital Ratios for Banks Operating in India 1811 Minimum Capital Ratios—Comparison of Capital Requirement Standards 1812 Impact of Basel III on Banks’ Capital Compared with Basel II 1913 Annual Credit Growth Rates, by Bank Group 1914 Estimated Capital Requirement of Banks by Fiscal Year 2019 2015 Indradhanush Plan to Revamp Public Sector Banks—Capitalization 2116 Estimated Gap in Total Capital Requirement for Public Sector Banks 2117 Key Regulations for Originators 3518 Summary of Key Regulations for Investors 3519 State Bank of India—Outstanding Credit Portfolio 4920 State Bank of India—Basel III Compliance Scenario 5021 State Bank of India—Asset Pool Sample 5122 Base-Case Outcome—Inflows 5323 Base-Case Outcome—Outflows 5324 Base-Case Outcome—Net Gains 5425 Scenario 2—Inflows 5426 Scenario 2—Outflows 5527 Scenario 2—Net Gains A2.1 Basel III Risk Weights 61A2.2 Risk Weights for Securitization Exposures 62A2.3 Risk Weights for Commercial Real Estate Securitization Exposures 62A3.1 Regulatory Framework Overview 63A3.2 Minimum Holding Period Guidelines 64A3.3 Minimum Retention Requirement for Infrastructure Loans 65A3.4 Ministry of Labour and Employment—Investment Regulations, 2013 67A4.1 Comparative Summary of Investment Guidelines 69A4.2 Insurance Regulatory and Development Authority Regulations—Life
Insurance Business in India 71A4.3 Insurance Regulatory and Development Authority Regulations—General
Insurance Business in India 72A4.4 Exposure Norms for Insurance Companies 73A4.5 National Pension System Models 77A4.6 Investment Guidelines for the All-Citizens Model 78A4.7 Investment Guidelines for the Government Sector and the Corporate Model 79A5.1 Road Map for Implementation of Indian Accounting Standards 83A5.2 Comparison of Accounting Standards for Securitization 84A6.1 Interest Rate and Credit Enhancement Assumptions 94A6.2 Amortization Profile Assumptions 94A6.3 S&P Global’s Cumulative Default Rates 96A7 Base-Case Outcomes 97

vii
Foreword
The importance of infrastructure as a key driver of a country’s economic growth and competitiveness is well established. For India, the need for infrastructure is even more
pronounced: The World Economic Forum’s Global Competitiveness Report 2016–17 ranks India 68th out of 138 economies in terms of infrastructure (4.03 out of 7.00 in the Global Competitiveness Index). Other emerging economies such as the People’s Republic of China and Indonesia are ranked higher than India, and boast better basic infrastructure.
The Asian Development Bank (ADB), in partnership with the Government of India, has been at the forefront of catalyzing public–private partnerships (PPPs) for infrastructure development in India. Since 2006, ADB has provided various technical assistance and innovative financing programs to support government initiatives to mainstream and finance PPP projects across the country. In line with its country partnership strategy for India, ADB is supporting the role of financial intermediaries, introducing financial structures that encourage private sector participation in challenging sectors, and providing long-term funding for infrastructure projects. Other initiatives include support for the creation of a bond guarantee fund in India and a project bond guarantee facility to draw more institutional investors into critical infrastructure projects in the country.
While the Government of India has made significant efforts to boost infrastructure funding—including a record investment of Rs4 trillion in its annual budget for FY2018—a dearth of viable financing structures and adequate risk-adjusted returns has hampered private investment in India’s infrastructure. Meanwhile, rising nonperforming loans and the incremental capital requirements of Basel III for banks are further constraining investment.
In this regard, ADB has been instrumental in creating depth in the domestic debt and capital markets in India. Recent technical assistance to the Government of India explored the potential of monetizing the infrastructure assets of public sector banks in the country. Converting banks’ illiquid infrastructure assets into marketable securities can help create alternative investment opportunities for institutional investors, such as insurance funds and pension funds that may have an appetite for long-dated assets that match their long-term liabilities. Taking this approach would also help banks improve their capital position and unlock enormous funding potential for greenfield infrastructure projects.
We hope this publication will serve as a catalyst in further deepening and strengthening the securitization market in India, thereby providing avenues for meeting the country’s growing infrastructure investment needs.
Hun KimDirector GeneralSouth Asia Regional Department

ix
The Asian Development Bank is pleased to present this publication as an outcome of Technical Assistance (TA) 8876-IND: Enabling Monetization of Infrastructure Assets
in India, under the leadership and supervision of Jennifer Romero-Torres as well as guidance provided by Bruno Carrasco. This TA, which began in 2015, was aimed at designing and structuring a viable framework to enable the securitization of infrastructure assets on public sector banks in India.
For their technical input and administration of the TA output, including this publication, we wish to acknowledge the valuable contribution of a team of experts from CRISIL, Sameer Bhatia (the lead engagement consultant under the TA), Sudip Sural, Karthik Krishnan, and Shikha Parekh.
This publication could not have been prepared without the strong commitment and support of the Ministry of Finance, Government of India. The authors express sincere gratitude for the support and technical guidance provided during our TA engagement and implementation process by Joint Secretary Pankaj Jain of the Department of Financial Services, and Joint Secretary Sharmila Chavaly of the Department of Economic Affairs. Special thanks to Sunil Srivastava, deputy managing director, State Bank of India (SBI), and the project finance team at the SBI, for sharing information that was critical to the implementation of the TA. This publication also benefited from the valuable contributions of regulators, staff of government agencies, and market participants, whom the authors met during several rounds of consultations and during the final dissemination workshop under the TA.
The authors appreciate the comments from Vivek Rao, as peer reviewer of this publication, and offer heartfelt thanks to Sheila Foronda-Mariano for providing excellent support and assistance. The authors wish to acknowledge the editing services of Paul Dent, cover design by Michael Cortes, proofreading services of Mary Ann Asico, and layout by Alfredo De Jesus.
Acknowledgments
xi
Abbreviations
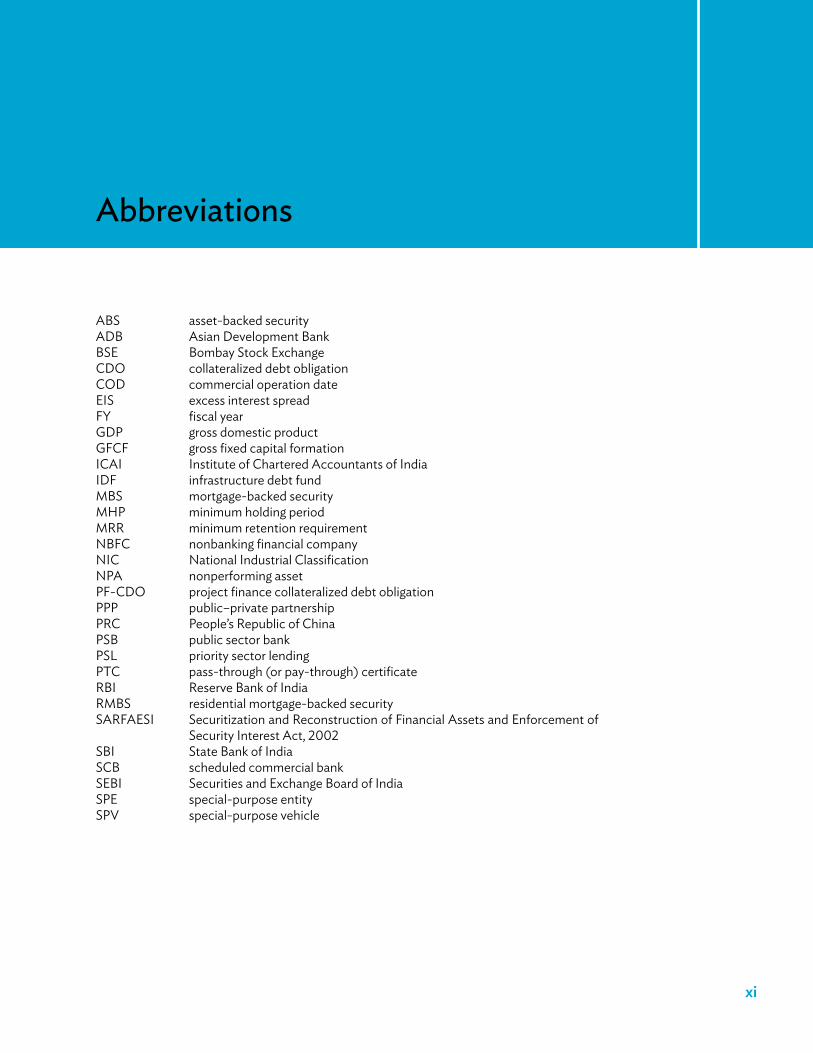
ABS asset-backed securityADB Asian Development BankBSE Bombay Stock ExchangeCDO collateralized debt obligationCOD commercial operation dateEIS excess interest spreadFY fiscal yearGDP gross domestic productGFCF gross fixed capital formationICAI Institute of Chartered Accountants of IndiaIDF infrastructure debt fundMBS mortgage-backed securityMHP minimum holding periodMRR minimum retention requirementNBFC nonbanking financial companyNIC National Industrial ClassificationNPA nonperforming assetPF-CDO project finance collateralized debt obligationPPP public–private partnershipPRC People’s Republic of ChinaPSB public sector bankPSL priority sector lendingPTC pass-through (or pay-through) certificateRBI Reserve Bank of IndiaRMBS residential mortgage-backed securitySARFAESI Securitization and Reconstruction of Financial Assets and Enforcement of
Security Interest Act, 2002SBI State Bank of IndiaSCB scheduled commercial bankSEBI Securities and Exchange Board of IndiaSPE special-purpose entitySPV special-purpose vehicle

1
I. Introduction
India’s infrastructure requires close to Rs43 trillion of investments from 2017 to 2022. CRISIL estimates the debt requirement of the infrastructure sector at Rs30 trillion. Globally,
infrastructure is typically financed by institutional investors, with matching long-term liabilities and risk–return expectations; in India, banks have been the driver of infrastructure financing.
However, India’s banking sector is under pressure, as banks, weighed down by bad loans and weak profitability, are reaching their exposure limits in infrastructure lending. Among public sector banks (PSBs), the problem is more acute. Since 2016, PSBs have accumulated nearly 88% of the nonperforming assets (NPAs) of the banking sector, compared with their 70% asset base. Compounding the banking sector’s problems are the new Basel III norms for bank capital, which will be fully implemented by 2019. Various studies have estimated that India’s banking sector needs between Rs2.5 trillion and Rs6.0 trillion in capital to meet these norms.
The problems afflicting India’s banking sector also affect the country’s infrastructure sector. In this context, this paper explores the securitization of infrastructure assets to
(i) strengthen the capital position of PSBs so that they are well placed to fund new credit growth opportunities and meet Basel III requirements; and
(ii) improve fund flow to the infrastructure sector by securitizing infrastructure assets, thus enhancing its access to institutional investors such as pension funds, insurance funds, and mutual funds, building on the large pool of savings available in India.
Securitization allows a lender to sell a pool of assets on which bond market securities are issued. This, especially if undertaken through the sale of pass-through securities, frees up capital and enables access to bond market participants such as insurance funds, pension funds, and mutual funds.
Since India’s securitization market is in the early stages of development, infrastructure-securitized papers could be structured as a full sale, supported by credit enhancements provided through internal and external mechanisms, to help meet the risk–return expectations of institutional investors in India. With an asset pool comprising operational, nonthermal power assets, infrastructure-securitized papers are of positive value for originating banks.
However, critical factors will need to be addressed to promote significant uptake of infrastructure-securitized papers in India. These factors consist of appropriately selected asset pools, mechanisms to manage floating-to-fixed interest rate risk of infrastructure assets, and institutional and monitoring mechanisms.

Securitization in india: Managing Capital Constraints and Creating Liquidity to Fund Infrastructure Assets2
In this context, this paper explores the securitization of existing infrastructure assets by PSBs in India, as a means to (i) strengthen their capital position to meet Basel III requirements, (ii) free up capital to help fund new credit growth opportunities, and (iii) ultimately improve fund flow to the infrastructure sector by enhancing its access to institutional investors.

3
II. Infrastructure Financing in India
A. Overview
India needs significant investments in infrastructure. The World Economic Forum’s Global Competitiveness Report 2016–17 ranks India 68th out of 138 economies in
terms of infrastructure (Table 1). India scored 4.03 out of a possible 7.00 on the Global Competitiveness Index. Other emerging economies such as the People’s Republic of China (PRC) and Indonesia rank higher than India, and boast better basic infrastructure.
Table 1: World Economic Forum—countrywise Infrastructure ranking
Economy RankHong Kong, China 1Russian Federation 35People’s Republic of China 42Indonesia 60Namibia 66India 68
Source: World Economic Forum’s Global Competitiveness Report 2016–17.
The Government of India has identified infrastructure as a key challenge to be tackled to promote economic growth. In its Union Budget for FY2018, the government announced investment of up to Rs4 trillion in the infrastructure sector, equivalent to 2.4% of gross domestic product (GDP),1 with focus on roads and railways.
India’s infrastructure will require investment of Rs43 trillion from 2017 to 2022, of which close to 70% will be required in transportation, power, and urban infrastructure (Figure 1).
1 Source: International Monetary Fund. GDP in Constant Prices as of March 2017.

Securitization in india: Managing Capital Constraints and Creating Liquidity to Fund Infrastructure Assets4
B. Gap Analysis for Infrastructure Investment in India
Past TrendsAccording to data from the Planning Commission, Government of India, investments in infrastructure in India over 2002–2012 (the period of the country’s Tenth and Eleventh Five-Year Plans) were worth Rs32.6 trillion. The Twelfth Five-Year Plan (2012–2017) was formulated against the backdrop of this remarkable performance. The plan projected an investment in infrastructure of Rs55.75 trillion in 2012–2017, more than double the investment in the Eleventh Five-Year Plan.
However, infrastructure investments have fallen significantly below the levels projected in the Twelfth Five-Year Plan. An Asian Development Bank (ADB) report titled “Meeting Asia’s Infrastructure Needs,” highlighted the fact that India invested about 6% of its GDP in the infrastructure sector in 2013, well below the intended average of 8% in the Twelfth Five-Year Plan.
The National Institution for Transforming India (NITI) Aayog estimated a likely shortfall of about 30% in the envisaged investment in the first 2 years of the Twelfth Five-Year Plan—20% in public and 43% in private investments. Given this estimate, infrastructure investment from 2012 to 2014 was close to Rs14 trillion, compared with the envisaged Rs20 trillion (Table 2). The slowdown in infrastructure investments resulted primarily from the sharp decline in private sector investment. According to these estimates, the private sector has contributed only 39% of the total infrastructure investment, well below the envisaged target of 48% in the Twelfth Five-Year Plan.
Gross fixed capital formation (GFCF) for the private sector, an indicator of new capacity addition by companies, declined by 300 basis points as a percentage of GDP from 2010 to 2015 (Figure 2).
Figure 1: Sectoral Breakup of Infrastructure Needs in India, FY2017–FY2022
(Rs trillion)
13.3
9.0
8.6
8.0
5.14.7
3.40.4
52.50.0
10.0
20.0
30.0
40.0
50.0
60.0
Power Roads Railways Ports Irrigation Urban Infra Telecom Airports Total
Source: CRISIL research estimates.

Infrastructure Financing in India 5
Table 2: Past Trends in Infrastructure Investment in India
Item
Tenth Five-Year Plan (2002–2007)
Actual
Eleventh Five-Year Plan (2007–2012)
Actual 2012–2014* Total GDP in market prices (Rs trillion) 165 336 214
Total investment in infrastructure (Rs trillion) 8.4 24.2 13.7
Share of total investment in GDP (%) 5.0 7.2 6.4
Public sector investment (Rs trillion) 6.51 15.3 8.1
Private sector investment (Rs trillion) 1.9 8.9 5.3
Share of private sector investment as a percentage of total investment 22 37 39
GDP = gross domestic product.* According to estimates released by the National Institution for Transforming India (NITI) Aayog in 2015.Source: Planning Commission, Government of India.
Figure 2: Gross Fixed capital Formation, Indian Private Sector(% of gross domestic product)
16.018.3 17.1 17.8
21.8 23.0 21.9
27.2 26.1 25.6 25.327.0 26.4
24.6 23.3 22.1
0.0
5.0
10.0
15.0
20.0
25.0
30.0
2000 2001 2002 2003 2004 2005 2006 2007 2008 2009 2010 2011 2012 2013 2014 2015
Sources: World Bank national accounts data; Organisation for Economic Co-operation and Development national accounts data.

6 Securitization in india: Managing Capital Constraints and Creating Liquidity to Fund Infrastructure Assets
A major reason for this decline in GFCF is project stalling, which has adversely affected the balance sheets of the corporate sector and the PSBs and, in turn, constrains future private investments.2 Cost and time overruns, high leverage levels, and slower-than-expected growth in the economy have also made many capital-intensive projects financially unviable, with companies reluctant to invest. Banks are no longer lending aggressively for large projects, especially in stressed, capital-intensive sectors such as power, metals, and mining, which account for more than 60% of overall private capital expenditure (capex).
Projected Debt Investment in InfrastructureIndia is foreseen to require around Rs43 trillion in infrastructure investments from 2017 to 2022.
Estimates released by NITI Aayog in 2015 indicate that private investment has contributed around 40% of total infrastructure investments in the country. In light of the declining trend in GFCF, it is assumed that private sector investment will remain low in the short term. However, this share is forecast to rise in the medium term, to about 45% by 2022, with the government’s increased focus on boosting infrastructure investments. The private sector is therefore expected to contribute Rs19 trillion to overall funding requirements. Considering the long-term nature of these investments, it is estimated that they are likely to be funded by long-term debt (assumed at current levels of 70% of overall investments). The public sector would provide the remaining Rs24 trillion, Rs17 trillion of this in the form of long-term debt.3
These estimates show a total debt requirement of Rs30 trillion for infrastructure development from 2017 to 2022 (Figure 3).
Projected Debt Supply from BanksHistorically, infrastructure financing has been the stronghold of commercial banks. Infrastructure contributes almost 15% of total nonfood credit extended by the banking sector in India. Although the amount of lending for infrastructure in value terms has more than doubled (from $63 billion in FY2010 to $140 billion in FY2014), lending in percentage terms has remained stagnant. Also, the rise in NPAs has exerted tremendous pressure on the banking sector’s overall profitability.
The growth rate of bank credit has likewise slowed significantly, especially since November 2016, when the government withdrew large banknote denominations from circulation, drying up demand for business borrowings. In February 2017, credit disbursements by scheduled commercial banks (SCBs) in India grew by only 4.8%, the slowest rate since 1998. Industry experts and bankers have pegged this rate at 5%–6% in FY2018, and at around 7% over the long term.
Debt supply from banks has been estimated in this context, and assuming an average credit growth rate of 7% until FY2022. With 14% exposure to the infrastructure sector, debt supply from banks will amount to merely Rs5,073 billion until FY2022.
2 Sameer Bhatia and Vivek Rao. Forthcoming. Establishing a Project Completion Risk Guarantee Facility for the Infrastructure Sector in India: A Need of the Hour. Manila: Asian Development Bank.
3 Based on budgetary support estimates, excluding direct support to infrastructure line ministries.

Infrastructure Financing in India 7
Figure 3: Projected Infrastructure Investment—Debt
Investment in infrastructure: Rs43 trillion
Private investmentrequirement: Rs19 trillion
Private debtrequirement: Rs19 trillion
Public debtrequirement: Rs17 trillion
Total debt requirement by 2017–2022: Rs30 trillion
Public investmentrequirement: Rs24 trillion
Private sector share: 44%* Public sector’s share: 56%*
* According to estimates released by the National Institution for Transforming India (NITI) Aayog in 2015.Source: CRISIL Analysis.
Projected Debt Supply from Public Sector BanksPSBs account for close to 70% of total credit in the banking system. However, this share has declined due to significant stress in asset quality and slender capitalization. According to the report of the committee reviewed corporate governance in banks in India, submitted to the Reserve Bank of India (RBI) in May 2014, the market share of public sector banks will fall to 60% by 2025 if current concerns are not addressed.
The sluggish growth of PSB credit has also raised concerns. Credit provided by this banking segment grew by only 4% in February 2017, and growth prospects are flat. Annual credit growth rates of 4%–6% are forecast until FY2021 or FY2022.
PSBs are overexposed to the infrastructure sector, with 16.5% of their total outstanding credit tied up in infrastructure projects. But even if they were to trim down their exposure to the industry standard of 15% for each sector, as expected, PSBs could still provide close to Rs1,632 billion for infrastructure, or about 32% of bank funding for the sector, until FY2022 (Table 3).
C. Key Issues and Challenges in Infrastructure Financing
Infrastructure projects are typically complex and capital intensive, and have long gestation periods. The key issues faced in infrastructure funding are discussed below

8 Securitization in india: Managing Capital Constraints and Creating Liquidity to Fund Infrastructure Assets
Limited Sources of FinancingGlobally, infrastructure debt is financed by project loans or project bonds. In developed economies such as the United States and Europe, a major portion of debt financing to the sector is undertaken through the issuance of project bonds. About 23% of total debt funding to the infrastructure sector in 2016 was sourced through project bonds in Europe (Table 4). Although project loans are also prevalent in developed economies, these are sourced primarily by development finance institutions or in the form of direct loans by institutional investors. Commercial banks play a negligible role in funding the infrastructure sector.
Table 3: Forecast Debt Supply for Infrastructure from Public Sector Banks and Scheduled commercial Banks
Item FY2018–FY2022Growth rate of gross nonfood credit (%) 7Gross nonfood credit (Rs billion) 466,983Share of infrastructure in outstanding gross nonfood credit (%) 15Incremental credit to infrastructure sector from scheduled commercial
banks (Rs billion) 5,073Share of PSBs in gross nonfood credit (%) 66Share of infrastructure in outstanding gross nonfood credit for PSBs (%) 15.5Incremental credit to infrastructure sector by PSBs (Rs billion) 1,632PSBs’ share in incremental bank credit to infrastructure (%) 32
FY = fiscal year, PSB = public sector bank.Source: CRISIL estimates.
Table 4: Sources of Infrastructure Debt Funding—Global
RegionShare of Project Bonds in Total Debt Funding (%)
North America 20Europe 23Latin America 26Asia Pacific 6Middle East and Africa 7Total (Global) 16
Source: Thomson Reuters Project Finance International.
In India, however, in India, commercial banks have been the driver of infrastructure debt financing, contributing close to 50% of infrastructure debt investment. As a result, the share of bank credit to infrastructure sector has almost doubled, from 7.5% in FY2006 to over 15.1% in FY2016 (Figure 4).

Infrastructure Financing in India 9
Limited-Recourse LendingInfrastructure projects in India are characterized by nonrecourse or limited-recourse lending. The security package comprises project cash flows (through an escrow account), rights under a public–private partnership (PPP) agreement, and first charge on the project assets. Lenders require additional security from promoters in the form of guarantees or other sources. As a result, banks in India lend on a relationship basis, with riskier projects financed by banks because of ongoing lending relations between the bank and the promoter. Relationship-based lending seldom factors in a risk-based approach to pricing, resulting in a mismatch between the riskiness of the project and the low premium charged by banks for financing the high construction or operations risk.
Sectoral Exposure ManagementThe growth in lending by banks to infrastructure is constrained by their high existing exposure. Though the RBI does not mandate a sector exposure limit, banks fix their internal exposure limits so exposures are evenly spread across sectors and the risk of overexposure to a single sector is minimized. This internal sector exposure limit for banks is typically around 15%. The banking system has been breaching this limit for infrastructure lending since 2011. However, as a result of being the key financiers of infrastructure debt in India, most banks in India have a relatively high sectoral exposure, limiting their ability of banks to take on additional exposure to infrastructure.
Asset–Liability Mismatch
Infrastructure projects are typically complex and capital intensive, and require long-tenure financing (around 10 to 15 years), while bank deposits, in the form of savings and term deposits, are essentially short term (6 months to 5 years). This potential mismatch in tenures has resulted in increasing risk of asset–liability mismatch for banks. While this
Figure 4: Scheduled commercial Banks in India—credit Portfolio, FY2006–FY2017
024681012
%141618
01020304050
Rs tr
illion 60
708090
FY2006 FY2007 FY2008 FY2009 FY2010 FY2011 FY2012 FY2013 FY2014 FY2015 FY2016 FY2017YTD
Outstanding bank credit to the infrastructure sectorTotal outstanding bank creditInfrastructure exposure share
FY = fiscal year, YTD = year-to-date.Source: Reserve Bank of India (RBI).

10 Securitization in india: Managing Capital Constraints and Creating Liquidity to Fund Infrastructure Assets
was sustainable in a higher-deposit and lower-credit growth scenario, increasing demand for long-term infrastructure credit and limited uptake of short-term credit result in higher liquidity risks for banks in India.
Deterioration in Asset QualityIncreasing demand for infrastructure credit resulted in aggressive lending by banks to the sector during the high-growth phase of the Indian economy. However, the economic slowdown that followed the global financial crisis in 2008 adversely affected borrowers’ capacity to repay existing debt. The slowdown, coupled with regulatory delays which have plagued PPPs in India over decades, resulted in rising NPAs in the infrastructure sector, and thereby among Indian banks. Growth in stressed assets was further compounded by time and cost overruns, delays in land acquisition, operational issues in project implementation, and poor project evaluation and monitoring by banks in India.
D. Recent Developments in Infrastructure Financing in India
To ease pressure on the banking system to fund infrastructure develoopment in India, the government has rolled out various initiatives aimed at deepening access of infrastructure projects to capital markets. These initiatives are discussed below.
Passage of the Insolvency and Bankruptcy Code, 2016 In 2016, India’s Parliament approved the long-awaited Insolvency and Bankruptcy Code, which repealed several outdated laws and amended 11 other laws to speed up the resolution of financial distress, boost investor confidence, and encourage risk-adjusted investments in the medium term.
Establishment of the National Infrastructure Investment Fund The National Infrastructure Investment Fund is a sovereign wealth fund, established to maximize economic impact through infrastructure development with commercially viable projects in India. It is structured as a fund of funds and will be established as a category II alternative investment fund, with 49% government holding. The National Infrastructure Investment Fund will focus on sourcing investments from foreign and domestic investors.
Launch of Masala Bonds
Offshore rupee-denominated bonds, termed “masala bonds,” are key investment vehicles for sourcing foreign investment in India, as well as encouraging full convertibility of the Indian currency. However, a robust price discovery mechanism and adequate liquidity will be critical to enhancing the attractiveness and acceptability of the bonds to foreign institutional investors.

Infrastructure Financing in India 11
Establishment of Infrastructure Investment TrustsInfrastructure investment trusts have been established to mobilize capital for infrastructure investments in India. With their added taxation benefits (tax pass-through) and rationalized capital gains tax structure introduced in the Union Budget for FY2015, infrastructure investment trusts will be critical to unlocking currently tied-up developer funds and aid in financing and refinancing infrastructure projects in the country.
Granting of Tax Pass-Through Status to Securitized Papers in India In the Union Budget for FY2016, securitized papers were granted complete tax pass-through status, thereby addressing the most critical barrier to the growth of the infrastructure securitization market in India. Before the announcement, securitized papers were subject to distribution tax of 30%, which significantly reduced yields for investors and dampened investor interest in securitized instruments.
Revision of External Commercial Borrowing FrameworkThe RBI’s revised external commercial borrowing guidelines have addressed the key challenges of sourcing funding from foreign investors. For example, verified infrastructure-focused companies in India can raise medium-term foreign funds under track I, and long-term risk-pricing-based foreign funds under track III. As a result, investors can now be adequately compensated for the additional risk of funding infrastructure projects of long tenure or high credit risk.
Implementation of Partial Credit Guarantee Scheme of the India Infrastructure Finance CompanyUnder the partial credit guarantee scheme, the India Infrastructure Finance Company, supported by ADB, provides partial credit guarantee to enhance the ratings of project bond issuances, to channel long-term funds through the bond market to the infrastructure sector. By virtue of the India Infrastructure Finance Company’s “AAA” credit rating, the rating of the bonds can be enhanced to a maximum of “AA+.”
Credit Enhancement of Bonds by Commercial Banks Since September 2015, the RBI has permitted commercial banks in India to provide partial credit enhancement (PCE) for infrastructure bonds in the country. This enhancement takes the form of an irrevocable contingent line of credit to meet payment shortfalls for bond servicing. Projects with a minimum stand-alone credit rating of “BBB” and without any other facility arrangements with the PCE-issuing banks, are eligible under this scheme. The extent of PCE that can be provided is limited to 20% of the bond issue size and must be used at the time the bond is issued.
12 Securitization in india: Managing Capital Constraints and Creating Liquidity to Fund Infrastructure Assets
Implementation of 5:25 Flexible Structuring SchemeThe RBI’s 5:25 scheme allows banks to extend long-term loans of 20–25 years to match the cash flow of infrastructure projects, while refinancing them every 5–7 years. Under this scheme, the bank offering the initial debt facility may sanction the loan for a medium term of about 5–7 years. This debt facility will cover the initial construction period, at least up to the start of commercial operations and revenue ramp-up. The repayment(s) at the end of this period, equaling in present value the remaining residual payments corresponding to the original amortization schedule, could be structured as a bullet repayment, with the intent to refinance it specified up front.
Infrastructure Debt FundingInfrastructure debt funds (IDFs), launched in 2013, essentially act as vehicles for refinancing existing debt (or as a takeout financing scheme) of infrastructure projects that have attained commercial operations, thereby creating latitude for banks to lend to fresh infrastructure projects. IDFs can be set up in India, either as trusts (mutual funds) or as nonbanking financial companies (NBFCs).
13
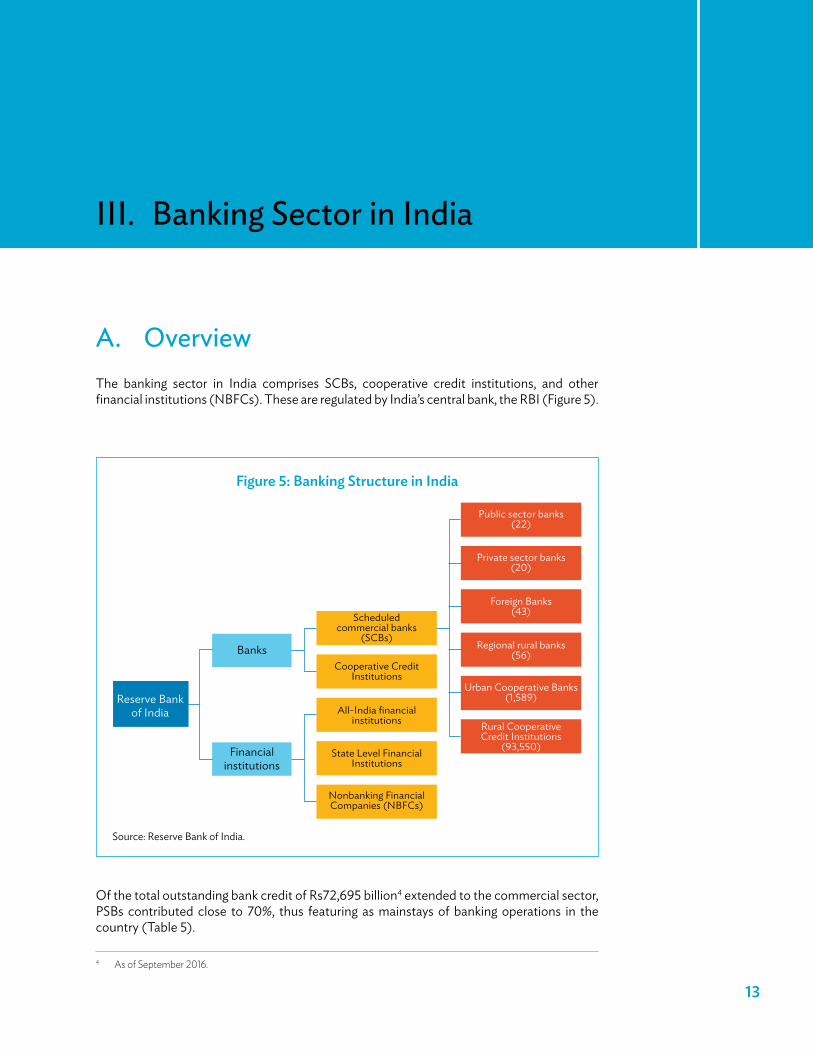
A. OverviewThe banking sector in India comprises SCBs, cooperative credit institutions, and other financial institutions (NBFCs). These are regulated by India’s central bank, the RBI (Figure 5).
III. Banking Sector in India
Figure 5: Banking Structure in India
Banks
Financialinstitutions
Scheduledcommercial banks
(SCBs)
Cooperative CreditInstitutions
All-India financialinstitutions
State Level FinancialInstitutions
Nonbanking FinancialCompanies (NBFCs)
Public sector banks(22)
Private sector banks(20)
Foreign Banks(43)
Regional rural banks(56)
Urban Cooperative Banks(1,589)
Rural CooperativeCredit Institutions
(93,550)
Reserve Bankof India
Source: Reserve Bank of India.
Of the total outstanding bank credit of Rs72,695 billion4 extended to the commercial sector, PSBs contributed close to 70%, thus featuring as mainstays of banking operations in the country (Table 5).
4 As of September 2016.

14 Securitization in india: Managing Capital Constraints and Creating Liquidity to Fund Infrastructure Assets
NBFCs in India comprise the following categories:
(i) Asset finance companies, providing financing for physical assets supporting productive or economic activity, such as automobiles, tractors, lathe machines, and generator sets.
(ii) Microfinance companies, offering financial services to underprivileged and impoverished communities.
(iii) Infrastructure finance companies, deploying at least 75% of their total assets in infrastructure loans.
(iv) Infrastructure debt funds, investing only in PPPs and post–commercial operations date (COD) infrastructure projects that have completed at least 1 year of satisfactory commercial operations.
(v) Investment companies, pursuing the acquisition of securities as their principal business.
(vi) Non-deposit-taking NBFcs, engaged principally in factoring.(vii) Mortgage guarantee companies, having at least 90% of their turnover as mortgage
guarantee business.(viii) Nonoperative financial holding companies, through which promoters and
promoter groups will be permitted to set up new banks.
NBFCs in India, accounting for close to 10% of total assets in the financial system, are broadly classified into deposit-taking and non-deposit-taking NBFCs. RBI norms provide for further classification of NBFCs, depending on their principal business. Principal business, as defined by the RBI, is the business from which the aggregate of financing real or physical assets supporting economic activity, and income arising from them, is not less than 60% of the NBFC’s total assets, and 60% of its total income.
The total outstanding assets of NBFCs in India have grown at an average of over 15% since 2014 (Table 6).
Financial institutions in India include entities such as the following:
(i) Small Industries Development Bank of India. Established in 1990 as a wholly owned subsidiary of IDBI Bank, it is the principal financial institution for the promotion, financing, and development of micro, small, and medium-sized enterprises.
Table 5: Outstanding credit of Scheduled commercial Banks in India(Rs billion)
Bank Group
Amount September
2016 March 2016 March 2015Public sector banks 49,770 51,259 49,283Private sector banks 19,209 18,129 14,334Foreign banks 3,716 3,770 3,355All scheduled commercial banks 72,695 73,158 66,972
Source: Reserve Bank of India’s quarterly Basic Statistical Returns 1, Outstanding Credit of Scheduled Commercial Banks.

Banking Sector in India 15
(ii) Export–Import Bank of India. Set up in 1982, it is the premier export financing institution in India.
(iii) National Housing Bank. A wholly owned subsidiary of the RBI, it was set up in 1988 as the apex financial institution for housing in India.
(iv) National Bank for Agriculture and rural Development. Set up in 1982, it is the apex development bank overseeing agriculture credit and other economic activities in the rural areas of India.
(v) Industrial Investment Bank of India. Set up in 1985 as the principal credit and reconstruction agency for ailing industrial enterprises, its charter was expanded in 1997, turning the agency into a full-fledged development finance institution.
(vi) Industrial Finance corporation of India. The country’s first development finance institution, it was set up in 1948 to pioneer long-term institutional credit to medium-sized and large industries.
(vii) State-level financial corporations. These corporations provide financial assistance in the form of term loans, direct subscription to equity or debentures, guarantees, discounting of bills of exchange, seed capital, etc.
B. Assessment of the Infrastructure Loan Portfolio of Public Sector Banks in India
Sector-wise Credit of Scheduled Commercial BanksAs of February 2017, gross credit outstanding for all SCBs amounted to Rs67.75 trillion, of which nonfood credit constituted RS66.9 trillion. Gross credit outstanding to the industries segment accounted for 38.4% of total outstanding credit, estimated at Rs26 trillion. Retail loans, categorized as personal loans by the RBI (and including housing loans), account for 23% of nonfood credit. Infrastructure is categorized as part of the industries portfolio by the RBI.
Infrastructure loans of Rs9 trillion account for 35% of the industry’s portfolio. Overall, infrastructure loans make up 13% of outstanding nonfood credit extended by SCBs. The chart below shows the segment-wise composition of total outstanding credit of all SCBs in India (Figure 6).
Table 6: Nonbanking Financial companies in India—Year-on-Year Growth
ItemMarch 2015
(%)March 2016
(%)Loans and advances 17.1 16.6Investments 11.5 10.8Other assets 10.6 12.7Total assets 15.7 15.5
Source: Reserve Bank of India.

16 Securitization in india: Managing Capital Constraints and Creating Liquidity to Fund Infrastructure Assets
Infrastructure Loan Portfolio of Public Sector BanksInfrastructure makes up 13%–14% of overall credit extended by SCBs since 2014—the highest exposure to a single sector, with the exception of retail. The total outstanding exposure of all SCBs to the sector stands at Rs9 trillion.
Because PSBs play a critical role in infrastructure financing, they have even higher exposure to infrastructure loans—at an average of 14.54% for a few of the largest PSBs in the country (Table 7).
Figure 6: Deployment of Nonfood credit—Scheduled commercial Banks (as of February 2017)
39%
23%
24%
14%
Loans to industry Loans to agriculture and allied sectors
Loans to the services sector Personal loans (including housing loans)
Source: Reserve Bank of India’s Monthly Bulletin, April 2017.
Table 7: Infrastructure Exposure of Selected Public Sector Banks in India(as of March 2017)
Bank
Total Infrastructure
Advances (Rs billion)
Share of Infrastructure
Advances in Total Advances (%)
State Bank of India 2,089.00 12.84IDBI Bank 771.70 19.55Canara Bank 501.30 14.66Bank of India 459.75 16.09Union Bank of India 400.30 14.70Bank of Baroda 280.21 9.41Average (weighted) 14.54
Source: Annual reports of various banks.

Banking Sector in India 17
Nonperfoming Assets and Asset Restructuring For PSBs, the share of gross NPAs (in gross advances) has increased, from 4.3% in March 2014 to 9.6% in March 2016 (Table 8). The share of restructured assets (in gross advances) has, however, fallen, from 7.7% in March 2014 to 4.9% in March 2016. The share of stressed assets (gross NPAs and restructured assets combined) in gross advances has therefore risen, from 12% in March 2014 to 15.5% in March 2016.
Table 8: Public Sector Banks in India—Gross Nonperforming Assets and restructured Advances
Date
Share of Gross Nonperforming Assets in Total
Advances(%)
Share of Restructured Advances in
Total Advances(%)
Share of Net Nonperforming Assets in Total
Advances(%)
March 2016 9.6 4.9 6.10March 2015 5.0 8.7 3.20March 2014 4.3 7.7 2.85
Source: Reserve Bank of India’s Financial Stability Report, June 2016.
The infrastructure sector’s share of restructured advances and gross NPAs is high, at 34.43% of restructured advances and 13.90% of gross NPAs as of June 2016 (Table 9). Of the sector’s total restructured and NPA advances, the power subsector has the largest share, at about 60%, despite the less than 55% share of advances.
Table 9: Infrastructure Sector—Share in restructured and Nonperforming Asset Advances
Sector
ItemInfrastructure
(%)Power
(%)Transport
(%)Telecommunications
(%)Share of total advances 14.22 7.82 2.87 1.50Share of restructured advances 34.43 20.89 8.64 1.03Share of gross nonperforming assets 13.90 5.97 4.33 1.09
Source: Reserve Bank of India’s Financial Stability Report, June 2016.
C. The Capital Adequacy ChallengeImplications of Basel III Norms for Capital Adequacy of Public Sector BanksThe Basel III regulatory accord was agreed on and circulated by the Basel Committee on Banking Supervision in 2010–2011. On 2 May 2012, the RBI issued guidelines, based on the Basel III reforms in capital regulation, that apply to all SCBs operating in India.

18 Securitization in india: Managing Capital Constraints and Creating Liquidity to Fund Infrastructure Assets
Basel III capital regulation has been implemented in India in phases since 1 April 2013, and will be fully implemented by 31 March 2019. The RBI has prescribed the minimum capital ratios5 to be maintained under various categories (Table 10).
Broadly speaking, the RBI guidelines are stricter than the global Basel III recommendations. In several respects, the Indian framework is more conservative than the Basel framework, as highlighted below (Table 11).
5 Banks should compute Basel III capital ratios as follows: common equity tier 1 capital ratio = common equity tier 1 capital or risk-weighted asset. Risk-weighted assets comprise market risk–weighted assets, credit risk–weighted assets, and operational risk–weighted assets.
Table 10: Year-on-Year Minimum capital ratios for Banks Operating in India
Item1 April 2013
1 April 2014
1 April 2015
1 April 2016
1 April 2017
1 April 2018
1 April 2019
Common equity tier 1 (CET1) 4.5 5 5.5 5.5 5.5 5.5 5.5
Capital conservation buffer (CCB) 0 0 0 0.6125 1.25 1.875 2.5
CET1 + CCB 4.5 5 5.5 6.125 6.75 7.375 8
Additional tier 1 (AT1) 1.5 1.5 1.5 1.5 1.5 1.5 1.5
Total tier 1 capital 6 6.5 7 7.625 8.25 8.875 9.5
Tier 2 capital 3 2.5 2 2 2 2 2
Total capital to risk assets ratio (CRAR) 9 9 9 9.625 10.25 10.875 11.5
Source: Reserve Bank of India.
Table 11: Minimum capital ratios—comparison of capital requirement Standards
ItemBasel III of the
Basel Committee
Basel III of the Reserve Bank of India
(as of 1 April 2019)
Basel II of the Reserve
Bank of India
Common equity tier 1 (CET1) 4.5 5.5 3.6
Capital conservation buffer (CCB)a 2.5 2.5
CET1 + CCB 7.0 8.0 3.6
Additional tier 1 capital (AT1) 1.5
Tier 1 capital (CET1 + AT1) 7.0 7.0 3.6
Tier 2 capital 1.0 2.0 2.4
Total capital (tier 1 + tier 2) 8.0 9.0 6.0
Total capital + CCB (CRAR) 10.5 11.5 9.0
Additional countercyclical bufferb in the form of common equity 0–2.5 0–2.5
a CCB is proposed to ensure that banks build up capital buffers and draw on them in times of stress. As a result, besides the minimum total capital of 8%, banks will be required to hold CCB of 2.5% of risk-weighted assets in the form of common equity.
b A countercyclical buffer is proposed to protect banks during periods of excessive aggregate credit growth. This buffer will be in effect only when there is excessive credit growth that results in risk buildup.
Sources: Reserve Bank of India; Basel Committee on Banking Supervision.
Banking Sector in India 19
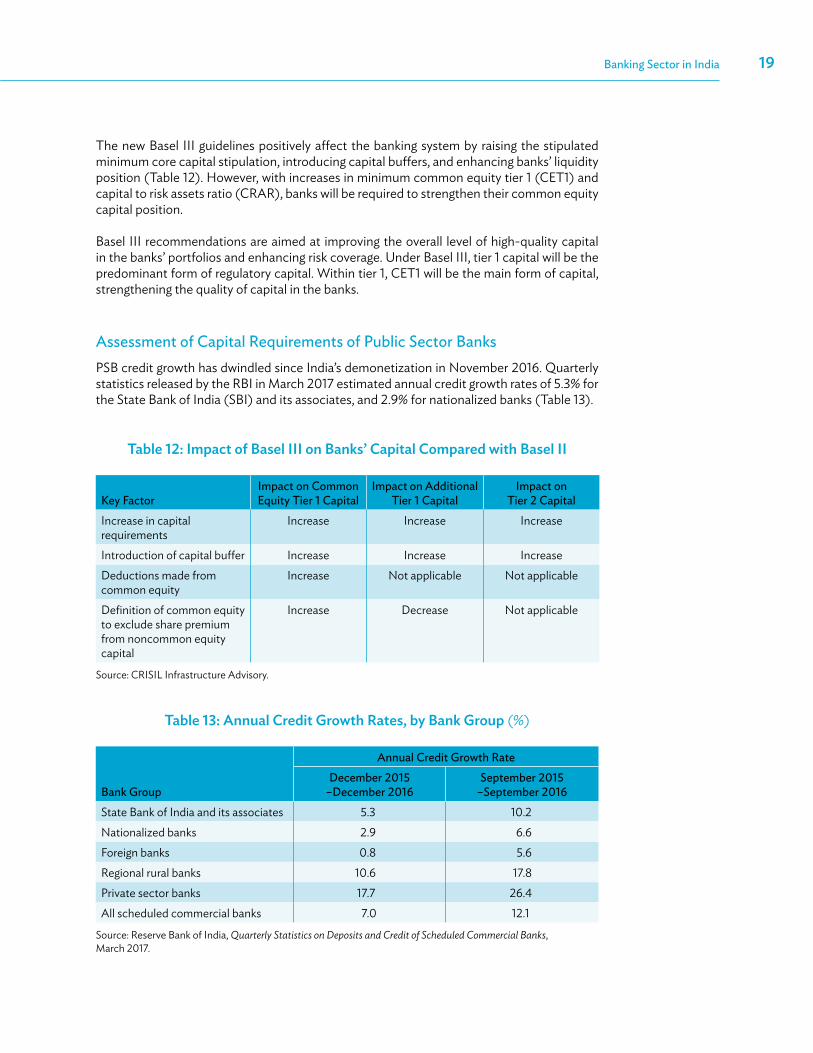
The new Basel III guidelines positively affect the banking system by raising the stipulated minimum core capital stipulation, introducing capital buffers, and enhancing banks’ liquidity position (Table 12). However, with increases in minimum common equity tier 1 (CET1) and capital to risk assets ratio (CRAR), banks will be required to strengthen their common equity capital position.
Basel III recommendations are aimed at improving the overall level of high-quality capital in the banks’ portfolios and enhancing risk coverage. Under Basel III, tier 1 capital will be the predominant form of regulatory capital. Within tier 1, CET1 will be the main form of capital, strengthening the quality of capital in the banks.
Assessment of Capital Requirements of Public Sector BanksPSB credit growth has dwindled since India’s demonetization in November 2016. Quarterly statistics released by the RBI in March 2017 estimated annual credit growth rates of 5.3% for the State Bank of India (SBI) and its associates, and 2.9% for nationalized banks (Table 13).
Table 12: Impact of Basel III on Banks’ capital compared with Basel II
Key FactorImpact on Common Equity Tier 1 Capital
Impact on Additional Tier 1 Capital
Impact on Tier 2 Capital
Increase in capital requirements
Increase Increase Increase
Introduction of capital buffer Increase Increase IncreaseDeductions made from common equity
Increase Not applicable Not applicable
Definition of common equity to exclude share premium from noncommon equity capital
Increase Decrease Not applicable
Source: CRISIL Infrastructure Advisory.
Table 13: Annual credit Growth rates, by Bank Group (%)
Annual Credit Growth Rate
Bank GroupDecember 2015
–December 2016September 2015
–September 2016State Bank of India and its associates 5.3 10.2Nationalized banks 2.9 6.6Foreign banks 0.8 5.6Regional rural banks 10.6 17.8Private sector banks 17.7 26.4All scheduled commercial banks 7.0 12.1
Source: Reserve Bank of India, Quarterly Statistics on Deposits and Credit of Scheduled Commercial Banks, March 2017.

20 Securitization in india: Managing Capital Constraints and Creating Liquidity to Fund Infrastructure Assets
An uptick in credit growth is necessary for economic growth. This will require cleaning up the balance sheets of PSBs to reduce the exposure of the banks to bad loans. The government is gradually working toward this objective through measures such as capitalizing PSBs via budgetary resources and introducing tools such as corporate debt restructuring,6 the Strategic Debt Restructuring Scheme,7 and the Scheme for Sustainable Debt of Stressed Assets.8
The capital requirements of PSBs under the Basel III regulations have been estimated with these measures in mind. The incremental capital requirement of about Rs1.9 trillion (Table 14) assumes average credit growth of 5% for PSBs until 2019. The requirement rises to Rs2.3 trillion if credit growth averages 7%, and to Rs27 trillion if PSB credit grows by 10% on average.
D. The Government’s Recapitalization Initiative: The Indradhanush Plan
Recognizing the need for a robust solution to the capitalization problems plaguing PSBs in India, in August 2015, the Department of Financial Services of the Ministry of Finance launched the Indradhanush Plan to revamp PSBs.
The plan provides for equity infusion of Rs700 billion in PSBs in India over a period of 4 years (Table 15).
6 Corporate debt restructuring refers to alteration of corporate debt, which generally involves alteration of repayment period, amount repayable, amount of installment or interest rate, etc.
7 Under the Strategic Debt Restructuring Scheme, which was introduced by the RBI in June 2015, banks lending to corporate borrowers are entitled to convert the entire amount of the loan or part of it into equity shares in the borrowing companies.
8 The Scheme for Sustainable Debt of Stressed Assets Scheme, introduced by the Securities and Exchange Board of India and the RBI in October 2016, is aimed at intensifying the financial restructuring of large debt projects by allowing lender banks to acquire equity in stressed projects. In this context, the scheme financially restructures large projects and at the same time helps the lender deal with the stressed assets.
Table 14: Estimated capital requirement of Banks by Fiscal Year 2019
ItemScenario 1: 5% PSB
Credit GrowthScenario 2: 7% PSB
Credit GrowthScenario 3: 10%
PSB Credit GrowthCredit growth of public sector
banks (PSBs) 5% 7% 10%Basel III–mandated capital
adequacy ratio 11.5%Gross credit, PSBs Rs5.5 trillion Rs7.9 trillion Rs11.8 trillionTotal incremental capital
requirement, PSBs Rs1.9 trillion Rs2.3 trillion Rs2.7 trillion
Source: CRISIL Infrastructure Advisory estimates.

Banking Sector in India 21
Under the Indradhanush Plan, disbursement in two to three tranches per year is planned, with the final tranche—equivalent to about 20% of the total infusion for the year—being dependent on the banks’ compliance wth specific performance criteria.
Although this cushion reduces the capital requirement of the banking sector, there is still a significant need for capital under the three credit-growth scenarios set out in Table 14. These estimates are shown in Table 16.
Table 15: Indradhanush Plan to revamp Public Sector Banks—capitalization
Fiscal Year
Budgetary Allocation(Rs billion)
Actual Disbursement(Rs billion)
FY2016 250 200FY2017 250 162
FY2018 100100*
FY2019 100 –Total 700 –
* Announced in Union Budget for FY2018.Source: Indradhanush Plan: Markets.
Table 16: Estimated Gap in Total capital requirement for Public Sector Banks
Item
Scenario 1: 5% PSB Credit
Growth
Scenario 2: 7% PSB Credit
Growth
Scenario 3: 10% PSB Credit
Growth
Total incremental capital requirement of public sector banks (PSBs) Rs1.9 trillion Rs2.3 trillion Rs2.7 trillion
Government infusion under the Indradhanush Plan Rs700 billion
Gap in total capital requirement of PSBs Rs1.2 trillion Rs1.6 trillion Rs2.0 trillion
Source: CRISIL Infrastructure Advisory estimates.
PSBs will therefore require Rs1 trillion in capital by 2018–2019 to meet the Basel III norms.

22
A. Securitization Structures in India
Securitization is the process of converting illiquid loans into marketable securities. The lender sells his or her right to receive future payments from the borrowers to a third party,
and is paid for it. The lender is therefore repaid at the time of securitization. These future cash flows from the borrowers are sold to investors in the form of marketable securities.
Securitization in India mainly takes the form of a trust structure, wherein the underlying assets are sold to a trustee company, which holds the security in trust for investors. The trustee company in this case is a special-purpose vehicle (SPV), which issues securities in the form of pass-through or pay-through certificates (PTCs). The trustee is the legal owner of the underlying assets. Investors holding the PTCs are entitled to beneficial interest in the underlying assets held by the trustee (Figure 8).
The parties involved in the securitization process and their respective roles are stated briefly below.
(i) Originator. The original lender and seller of receivables. In India, this is typically a bank, an NBFC, or a housing finance company.
(ii) Seller. One who pools the assets to securitize them. In India, the seller and the originator are usually the same entity.
(iii) Borrower. The counterparty to whom the originator makes a loan. Payments (typically in the form of equated monthly installments) by borrowers fund investor payouts.
IV. The Securitization Market in India
Figure 7: How Securitization Works
Financier lendsto borrowers
(at yield of x%)
Financier sellsthe right to be repaid
to a third party
Third party convertsthe receivables from
these loans intomarketable securitiesand sells to investors
(at yield of x–y)
Source: CRISIL.

The Securitization Market in India 23
Figure 8: Securitization Structure in India
Sale/Assignmentof receivables
Loan Consideration
Scheduledrepayments
Deposit ofcollections
Issuance of PTCs Consideration
Monthlypayouts
Investor
Lender
ServicerBorrower
Collection andPayout Account
CreditEnhancement
SPV (trust managedby a trustee)
PTC = pass-through (or pay-through) certificate, SPV = special-purpose vehicle.Source: CRISIL.
(iv) Issuer (SPV). The entity that issues marketable securities (to which investors subscribe) and ensures that transactions are executed on specific terms. In India, the SPV is typically set up as a trust.
(v) Arranger. Investment banks responsible for structuring the securities. They coordinate with other parties (such as investors, rating agencies, and legal counsel) to execute the transaction successfully.
(vi) Investor. The purchaser of securities. In India, investors are typically banks, insurance funds, and mutual funds.
(vii) rating agency. These agencies analyze risks associated with each transaction, stipulate credit enhancements commensurate with the ratings of the PTCs, monitor the performance of the transactions until maturity, and take appropriate rating actions.
(viii) credit enhancement provider. Typically the originator, as a facility that covers any shortfall in pool collections in relation to investor payouts. The enhancement can also be provided by a third party for a fee.
(ix) Servicer. The entity that collects periodic installments due from individual borrowers, makes payouts to investors, follows up on delinquent borrowers, and furnishes periodic information about pool performance to the rating agency. In India, the originator typically acts as the servicer.
Three types of securitized instruments are prevalent in the Indian market today. Asset-backed securities (ABSs) are instruments backed by receivables from financial assets, such as vehicle and personal loans, credit cards, and other consumer loans (but excluding housing loans). Mortgage-backed securities (MBSs) are instruments backed by receivables from housing loans. Collateral debt securities are instruments backed by various types of debt, including corporate loans or bonds.

24 Securitization in india: Managing Capital Constraints and Creating Liquidity to Fund Infrastructure Assets
The structuring of cash flows gives originators the flexibility to tailor instruments to meet investor requirements on the basis of risk appetite and tenor requirements. The two cash-flow structures that are most commonly used in India are:
(i) Par structure. The investor pays consideration equal to the principal component (par value) of future cash flows. In return, the investor is entitled to receive scheduled principal repayments from the pool, in addition to the contracted (PTC) yield every month. Typically, the asset yield is greater than the PTC yield, resulting in excess cash flows every month, often referred to as excess interest spread (EIS). For example, a pool of assets with a principal amount of Rs1 billion and a collective yield of 10% may be sold to investors at a yield of 8%. In this case, the investors are entitled to the principal amount of Rs1 billion, along with yield of 8% (Figure 9). The excess 2% yield from the pool of assets acts as EIS, offering protection (to that extent) against any shortfall in cash flow from the pool of assets.
(ii) Premium structure. The investor is entitled to the entire cash flow from the pool every month. The investor pays a consideration greater than the principal component of future cash flows. The purchase consideration is the net present value of the entire cash flows discounted at a contracted rate (PTC yield). This structure does not involve an EIS. For example, in the case of a pool of assets with a principal amount of Rs1 billion and yield of 10%, total cash flows amount to Rs1.13 billion (see Figure 10). In a premium structure, investors are entitled to the entire cash flow of Rs1.13 billion, for which the purchase consideration may be slightly higher than Rs1 billion, say, Rs1.05 billion.
Figure 9: Par Structure—An Illustration
Assests sold atface value:
Rs1,000 millionInvestors
Asset Pool:Rs1,000 million
(Pool Yield: 10%)
PrincipalRepayments
InterestPayments
Contracted yield: 8%
Excess interest: 2%Originator
Source: CRISIL.

The Securitization Market in India 25
Risk tranching is a form of cash-flow tranching prevalent in India. It involves the creation of instruments with different risk profiles. Senior PTCs are accorded the first priority on cash flows and are ranked according to credit quality (from highest to lowest) and degree of associated risk (from lowest to highest). Subordinate PTCs support payments of senior tranches, and carry lower credit ratings (Figure 11).
Figure 10: Premium Structure—An Illustration
Assets sold atpremium:
Rs1,053 millionAsset Pool(Rs1,000 millionPool Yield: 10%)
Pool Cash-flows:Principal + Interest
Investors
Originator
Pool Cash-flows:Rs1,319 million
Premium:Rs53 million
Source: CRISIL.
Figure 11: risk Tranching in Securitization
Originator SPV Investors
Cash flows fromsecuritized assets
Senior PTCs,rated AAA(SO)
Subordinate PTCs,rated BBB(SO)
PTC = pass-through (or pay-through) certificate, SPV = special-purpose vehicle, SO = structured obligation.Source: CRISIL.
Time tranching and prepayment tranching are two other forms of tranching, but these are not prevalent in India. Time tranching involves the creation of securities with different durations (Figure 12).

26 Securitization in india: Managing Capital Constraints and Creating Liquidity to Fund Infrastructure Assets
In prepayment tranching, investors prefer bond-like payouts. All prepayments are allocated to a separate strip called prepayments strip (series P). The main investor (series A) is therefore insulated against volatility arising out of prepayments. Volatility of cash flows to series P is addressed as the instrument is priced.
Credit enhancement is also important as a source of funds to protect investors in case of losses on securitization of assets. Credit enhancement improves the credit quality of securitized instruments to achieve desired credit ratings. Typically, securitization combines internal (subordinated cash flows, EIS) and external (cash collateral, corporate undertaking) sources of credit enhancement.
Apart from the SPV route through the issuance of PTCs, financial institutions also sell pools of assets directly to other financial institutions, without issuing PTCs. Such transactions are referred to as direct assignment transactions. Direct assignments are added to the loan books of lending institutions as loans. Investors that do not lend, such as mutual funds, cannot participate in direct assignments. These transactions are preferred by banks, since PTCs, by virtue of their being investments—would need to be marked to market, while loans and advances do not have this requirement. Because these transactions to help banks meet their priority sector lending (PSL) targets, assignees (usually banks) provide premium pricing to the originators (primarily NBFCs), which mutual funds—the other potential investor segment—cannot match. Further, only lending institutions are permitted to take part in these direct assignment transactions, making them unattractive to mutual funds and insurers.
Under RBI regulations, such transactions cannot have credit enhancements. The institution that buys the pool of assets typically adjusts the purchase price to compensate for the lack of credit enhancement.
B. Key TrendsThe securitization market in India has been operating since the early 1990s. Its growth is mainly due to the repackaging of retail assets and residential mortgages (for the most part in the priority sector segment) that continue to dominate. NBFCs and housing finance companies are the key originators of securitization deals in India, while banks are the leading investors because of PSL targets.
Figure 12: Time Tranching in Securitization
Originator SPV Investors
Cash flows fromsecuritized assets 6-month PTCs
1-year PTCs
5-year PTCs
PTC = pass-through (or pay-through) certificate, SPV = special-purpose vehicle. Source: CRISIL.

The Securitization Market in India 27
The securitization market in India is primarily dominated by ABSs. Banks and NBFCs sell their retail assets through securitization (Figure 13).
The market has matured in the past decade since the implementation of the Securitization and Reconstruction of Financial Assets and Enforcement of Security Interest (SARFAESI) Act, 2002, which provided the framework for the creation of asset reconstruction companies specializing in the securitization of assets purchased from banks. The securitization of auto loans has dominated the market throughout its development, and in the 2000s was supported by the emergence of residential MBSs.
The market has, however, seen limited diversification, both among investors and originators. The originators have typically been PSBs, foreign banks, and NBFCs, with underlying assets made up mostly of retail and corporate loans. The investors have been PSBs looking to meet their PSL needs.
The market comprised mainly ABSs, MBSs, and singe-loan sell downs (SLSDs) until FY2010. The market for SLSDs grew as corporates with surplus cash started investing in fixed-maturity plans (which further invested in SLSDs) because of the tax arbitrage that these funds provided. However, regulatory restrictions brought down the market in 2011.9 There were no prior instances of infrastructure securitization.
9 RBI, Revisions to the Guidelines on Securitisation Transactions, May 2012.
Figure 13: Key Events in the Indian Securitization Market
April 2013: Income tasdeparment imposed
demand notices onvariousMFs seeking to recover tax
on behalf of trusts; MFsburdened, withdraw
from market
February 2006: RBI releasesspecific guidelines
for securitization
First securitization dealin India (Citibankand GIC Mutual Fund, for Rs160 million)
February 2002: SARFAESIAct provides
protection for buyersof securitized paper
August 2012: RBI clamps downon single-loan selldowns;introduces MHPs, MRRs,
due diligence and stress testrequirements, prohibition on credit
enhancement in bilateral assignments;SLSDs gradually disappear from market
July 2013: RBIreleases guidelineson credit enhancement
Market gathersmomentum; ABSs,SLSDs dominate
1990–1995 1996–2001 2002–2007 2008–2013 2014 onward
Mar 2014: Distributiontax regime introducedthrough Union Budget
May 2014 - RIDFsand other fundsapproved as prioritysector
ABS = asset-backed security, MF = mutual fund, MHP = minimum holding period, MRR = minimum retention requirement, RBI = Reserve Bank of India, RIDF = Rural Infrastructure Development Fund, SARFAESI = Securitization and Reconstruction of Financial Assets and Enforcement of Security Interest, SLSD = single-loan selldown, SPV = special-purpose vehicle. Source: CRISIL.

28 Securitization in india: Managing Capital Constraints and Creating Liquidity to Fund Infrastructure Assets
Figure 14 shows the trend in securitization issuance since FY2009.
The market grew by 45% from 2015 to 2016, due to a 51% increase in the volume of ABSs. This has been on the back of mounting troubles faced by banks in securitizing corporate loans. Retail loans backed products are otherwise considered a safer investment alternative. Retail asset securitization has been bolstered by an increasing demand from PSBs and foreign banks to grow their asset book, and achieve higher credit growth.
Figure 14: Securitization Issuance in India, by Volume(Rs billion)
0
100
200
300
400
500
600
700
800
FY2009 FY2010 FY2011 FY2012 FY2013 FY2014 FY2015 FY2016 FY2017 (9 mos)
ABS SLSD/CDO MBS OtherABS = asset-backed security, FY = fiscal year, CDO = collateralized debt obligation, MBS = mortgage-backed security, mo = month, SLSD = single-loan sell down.Source: CRISIL Ratings.
Figure 15: retail Asset Securitization—Pass-Through certificates and Direct Assignments
0102030405060708090
100
%
FY2012(pre-guidelines)
FY2013(post-guidelines)
FY2014 FY2015 FY2016 FY2017 (9 mos)
Pass-through (or pay-through) certificates Direct assignments
FY = fiscal year, mo = month. Source: CRISIL.

The Securitization Market in India 29
The increasing participation of PSBs in direct assignment transactions could be explained by the same reasoning – direct assignment transactions allow the buyer to recognize the purchase as loans and advances in his books, thereby providing an impetus to credit growth.
The securitization market is expected to grow further, especially since foreign portfolio investors have now been permitted to invest in securitized debt instruments. The option for foreign investors to invest in securitization allows overseas financial entities to take a share of India’s lucrative, fast-growing retail borrowing, without having to formally get into the business.
C. Benefits and Challenges of Securitization
In a conventional debt instrument, the price of a bond is governed by the credit profile of the issuer, which, in turn, depends on the earning power of the business, the financial risk profile, and management capability. This asset pricing system has certain limitations: the earmarking of certain cash flows for the redemption of the instrument is not possible; the rating of the debt instrument and, hence, the cost of the instrument are restricted by the rating of the issuer (no cost optimization is possible for issuers with lower ratings); and customization (according to the needs of different investors) of the same debt issuance is not possible.
Securitization offers the following advantages to banks:
(i) Off-balance-sheet financing. Securitization allows the originator to create assets and generate income, while simultaneously shifting the assets off its balance sheet through a sale to the SPV. Income from the asset is therefore accelerated even if the asset is not recorded on the balance sheet, leading to a lower capital requirement and improvement in both income-related and asset-related ratios. For the originator, this frees up capital for further lending.
(ii) Alternative investor base. Securitization extends the pool of available funding sources by bringing in a new class of investors. The issuance of securities makes available alternate funding sources from institutional investors (such as insurance funds, pension funds, provident funds, and mutual funds).
(iii) Sharing of risk. This results in stratified securities, catering to the risk appetite of multiple investor classes, thereby deepening the financial market. For instance, mutual funds take higher risks compared with insurance funds. However, pension funds are most conservative, and are interested in low-risk, AAA-rated instruments.
(iv) Better asset–liability match. Asset–liability mismatches continue to be a problem for most financial institutions lending to the infrastructure sector in India. Asset securitization allows the selling institution to arrange debt issues to fund assets, with payments matching the cash flows from the assets. The funding-mismatch risk is thus transferred to entities that are more capable of bearing the risk (such as pension funds and insurance funds with long-term liabilities), which could be matched with long-term securitized commercial paper. Securitization allows a financial institution to improve its asset–liability maturity profile by replacing long-term assets with cash.
(v) positively impact on return on equity. Appropriate structuring can help increase the originator’s return on equity.

30 Securitization in india: Managing Capital Constraints and Creating Liquidity to Fund Infrastructure Assets
The key challenges pertaining to securitization are as follows:
(i) Floating interest rate. Investors generally prefer PTCs at fixed interest rates. However, since infrastructure loans have floating rates linked to the bank’s base rate, gaining investor interest is a challenge.
(ii) Syndication of banks providing loans for infrastructure asset. This is not essentially a challenge, but would be a caveat in infrastructure loan securitization deals. Most infrastructure loans in India are provided by a syndication of lenders or banks. Therefore, securitizing a bank’s portfolio will require a no-objection certificate from other banks.
(iii) Stamp duty. Stamp duty is payable on the transfer of asset rights. The implications of stamp duty on securitization of infrastructure assets are detailed in the next section.
(iv) Homogeneity of underlying asset pool. The RBI’s securitization regulations mandate the homogeneity of assets in the asset pool. The regulations do not define homogeneity from a regulatory perspective, but a pool of infrastructure assets of different sectors could be considered “homogeneous.” Therefore, the homogeneity test would depend on how the assets are identified and pooled as well as on how investors perceive the commercial risks in the structure.
(v) Transfer of debt. India’s Insolvency and Bankruptcy Code provides for control in the restructuring of delinquent assets for a minimum holding of 75%. Given the high leverage of infrastructure assets, this provision translates into a minimum requirement of 25% of debt for a creditor to have the rights of an effective negative vote in case bankruptcy procedures need to be initiated. (a) While this is a challenge for all infrastructure loans characterized by
consortium lending, it can be mitigated in a securitization structure in one of the following ways:(1) At least 25% of project debt is transferred to the trust, thereby
giving the trust the required control; or(2) Adequate arrangements are made with other creditors, to enable
investors to exercise their full rights as secured creditors. (b) The securitization trust could have the use of a money mechanism in the
trust deed in case of prepayment, but the trust may then lose its status as a pass-through trust, having taken the form of an entity with a specific business arrangement. This will have a direct impact on taxation for investors because securitization income will now have to be taxed at the trust level rather than at the investor level.
(vi) capital allocation issues. Under RBI notification,10 the residual noninvestment grade (junk) tranche retained by an originator (usually as credit enhancement) must be completely eliminated from the common equity capital. This provision restricts the capital benefits of securitization transactions. However, this problem is currently tackled through multiple tranches (AAA, BBB, and junk), where the originator retains the BBB and junk tranches. While the junk tranche attracts complete capital elimination from the common equity capital, the BBB tranche is subject to its usual capital treatment at a risk weight of 100%.11 The proportion of junk tranche determines the capital benefits provided by the securitization transaction: the lower the proportion of junk tranche, the higher the capital benefit. Retail securitization
10 Appendix 2 of this paper. 11 As discussed in section IIIC of this publication. Further, in case of a common equity capital adequacy ratio of 8%,
Rs100 million of the BBB tranche will require Rs8 million in capital, while Rs100 million of the junk tranche will require Rs100 million in capital.

The Securitization Market in India 31
transactions usually have a junk tranche of 3%–5%. Reducing the size of the junk tranche through infrastructure loan securitization is therefore important.
D. Infrastructure Securitization in India: An Assessment of the Enabling Framework
Legal FrameworkIndia’s Finance Act, 2013, passed in July 2013, provides the legal framework governing securitization trusts and their transactions. The provisions of this act are legally binding for all securitization transactions in India.
A step-wise analysis of the relevant legal provisions applicable during the lifetime of a securitization transaction is presented in Figure 16.
Figure 16: Legal Framework Governing Securitization in India
Empowered by Finance Act, 2013
Phase 1:Establishment of
securitization trust
Phase 2:Asset transfer byoriginators and
issuance ofsecurities to
investors
Phase 3:Lifetime of
securitizationtransaction
Securitization trusts are defined in RBI’s Guidelines on Securitisation of Standard Assets, February 2006, and in SEBI Regulations, 2008 (Public O�er and Listing of Securitised Debt Instruments)
• RBI Guidelines on Securitisation of Standard Assets, February 2006, govern asset transfer from originators
• Economic implications of states’ stamp duty acts need to be examined• SPV sells securities under SEBI Regulations, 2008 (Issue and Listing of Debt
Securities, and Public O�er and Listing of Securitised Debt Instruments)• Investors invest under investment guidelines issued by regulators
SPV continues to distribute beneficial interest to investors until the underlying assets in the pool have matured
• Securitization trust established by originator banks can take possession of the secured assets only after the judicial ruling
• If debt is not recovered after possession, SPV can appeal to the tribunal for bankruptcy under Companies Act, ����
Scenario 1: No defaults in underlying assets
Scenario 2: Defaults in underlying assets
RBI = Reserve Bank of India, SEBI = Securities and Exchange Board of India, SPV = special-purpose vehicle. Source: CRISIL.

32 Securitization in india: Managing Capital Constraints and Creating Liquidity to Fund Infrastructure Assets
Phase 1: Establishment of a Securitization Trust
Securitization trusts are defined by the RBI and the Securities and Exchange Board of India (SEBI) under the Finance Act, 2013. The RBI, which governs the registration of securitization companies and the sale of assets by the originator to the company, defined securitization trusts in its Guidelines on Securitisation of Standard Assets, issued in February 2006. SEBI, which governs the issuance of securitized debt paper, defined securitization trusts in its Regulations for Public Offer and Listing of Securitised Debt Instruments, 2008.
Under the RBI guidelines, a trust is an SPV set up during securitization, to which the beneficial interest in the securitized assets are sold or transferred without recourse. This SPV should be a bankruptcy-remote vehicle and should meet a set of stipulated criteria presented in Appendix 1 of this publication).
Under the SEBI regulations, a “special-purpose distinct entity” is a trust that acquires debt or receivables from funds mobilized by the entity, by issuing securitized debt instruments through one or more schemes. This definition covers any trust set up by the National Housing Bank under the National Housing Bank Act, 1987, or by the National Bank for Agriculture and Rural Development under the National Bank for Agriculture and Rural Development Act, 1981.
For the acquisition of securitized infrastructure assets, a trust should be formed by the originator bank to meet the requirements of both definitions. This trust can be formed in two ways, which determine how the trust can enforce the security interest in the asset in case of default by the loan borrower (see phase 3 discussion below):
(i) as an independent entity under the RBI’s Securitization Companies and Reconstruction Companies (Reserve Bank) Guidelines and Directions, 2003, and managed by independent trusteeship companies; or
(ii) as a subsidiary of a securitization company created and registered with the RBI under the SARFAESI Act for the specific purpose of securitization.
Phase 2: Transfer of Assets by Originators and Issuance of Securities to Investors
Transfer of Assets by Originators
The transfer of assets to a securitization trust by the originator banks or NBFCs is governed by the RBI’s Guidelines on Securitisation (section A), May 2012. Detailed guidelines are given in the section dealing with the regulatory framework.
The guidelines provide that, for an originator to derecognize the transferred asset, the transfer must be accounted for as a true sale at law and the following conditions must be met for that purpose:
(i) legal isolation, where assets are put beyond the reach of the transferor or its creditors, even in the event of a bankruptcy;
(ii) ability of the transferee to pledge or exchange the transferred assets (for securitized assets, the investors must be able to pledge or exchange the assets because the trust cannot do that); and
(iii) surrender of effective control, whereby the transferor, its consolidated affiliates, or its agents cannot effectively maintain control over the transferred assets or any rewards or risks arising out of those assets.

The Securitization Market in India 33
The experience of residential mortgage-backed security (RMBS) transactions in India indicates that these criteria can be met without substantial difficulties in most securitization transactions.
Issuance of Securities to Investors
Legal definition of a securitized debt instrument. Through the insertion of section 115TC in the Income Tax Act, the Finance Act, 2013, authorized securitized debt instruments to be defined according to the Securities and Exchange Board of India Regulations, 2008, (Public Offer and Listing of Securitised Debt Instruments), which, in turn, refer to the definition provided in the Securities Contracts (Regulation) Act, 1956.
Securitized debt instruments as so defined have to be issued by a special-purpose distinct entity to an investor, and hold any debt or receivable, including mortgage debt, assigned to the SPV. Further, the beneficial interest of the investor in the debt or receivable must be acknowledged.
Phase 3: Lifetime of a Securitization Transaction
Scenario 1: No Defaults in the Underlying Assets
The securitization trust continues to distribute the income to investors until the maturity of the underlying assets, in accordance with the agreements entered into by the trust and the investors.
Scenario 2: Defaults in the Underlying Assets
If the borrower defaults, a securitization trust registered with the RBI is empowered under section 13 of the SARFAESI Act, 2002, to classify the loan as an NPA and to take possession of the secured assets of the borrower, including the right to transfer or sell the asset and recover the debt.
If the trust is established as an independent entity, it can take possession of the security interest only after the judicial ruling.
In case a securitization trust is not able to recover the outstanding debt obligation of the borrower through the enforcement of the underlying security, it may appeal to the National Company Law Tribunal to enforce the bankruptcy of the borrowing company under section 272 of the Companies Act, 2013.
The tribunal may force the borrowing company into compulsory liquidation, following its inability to pay off its debt if
(i) the company has failed to pay the sum due within 21 days from the receipt of the creditor’s demand for payment;
(ii) any execution issued by any court or tribunal in favor of the creditor has been returned unsatisfied; or
(iii) the tribunal is convinced of the inability of the company to pay off its debt, after taking into account any contingent and prospective liabilities of the company.

34 Securitization in india: Managing Capital Constraints and Creating Liquidity to Fund Infrastructure Assets
Challenges Imposed by the Legal Framework
Possible conflicts in pooling of assets. Securitization essentially involves asset pooling. In the case of infrastructure assets, loans are primarily negotiated individually, so a standard set of terms and conditions may not exist. The lending clauses will therefore have to be scrutinized to ensure that the loan agreements in the pool do not conflict and, as as result, pose challenges for PTC issuance to investors.
Incidence of stamp duty. Since securitization transactions involve the assignment of the underlying receivables to the investors, as well as the transfer of the underlying collateral, if any, these transactions are liable for the payment of stamp duty and document registration fee.
Imposed by the state under the federal structure of India, the rate of stamp duty varies from 3% to as high as 14%.
Securitized loan pools with no underlying immovable assets are liable for stamp duty only on assignment of receivables, and for a registration fee, whereas loan pools with underlying real-estate assets, such as power projects, are liable for stamp duty on the assignment of the immovable property as well.
The incidence of stamp duty for securitized papers is not significant for loan pools with no underlying immovable assets, as five major states have recognized securitization as a separate financial transaction, and have thus reduced the stamp duty rate to 0.1% of the book value of the loan, capped at Rs100,000. For loan pools with underlying immovable assets, the asset value is usually not more than 10%–15% of the loan value, so the stamp duty is not a major deterrent to securitization.
Regulatory FrameworkThe regulatory framework for securitization in India12 was analyzed from two perspectives: regulations applicable to originators, and those applicable to potential investors.
Under the RBI’s securitization guidelines, originators are allowed to securitize all assets, except revolving credit facilities (such as credit card loans), assets purchased from other firms, collateralized debt obligations of ABSs, and loans with bullet repayment of principal and interest.
The RBI has also mandated a minimum holding period and minimum retention requirements for securitized transactions, aimed at ensuring that better underwriting standards are implemented by banks (Table 17).
While the existing regulatory framework does not prohibit any investor class from investing in securitized paper, maximum limits have been set for investments in securitized paper by institutional investors: 10% for insurance funds and 5% for pension funds. However, there is no cap on investments in securitized paper by mutual funds, banks, and alternative investment funds (Table 18).
12 For details, refer to Appendixes 3 and 4 of this publication.

The Securitization Market in India 35
Table 17: Key regulations for Originators
Item Minimum Holding Period Minimum Retention
Requirement
Definition Originators to hold the loans for a given period before securitizing them
Originators will continue to have a stake in securitized assets throughout the life of the transaction
Objective To ensure project implementation risk is not passed on to investors, a minimum recovery performance must be demonstrated
To ensure proper due diligence and better underwriting standards
Regulatory period for infrastructure loans
1 year 10% (up to a maximum of 20%) of the book value of the loan is to be retained
Source: Reserve Bank of India.
Table 18: Summary of Key regulations for Investors
InvestorKey Regulations for Lending to the
Infrastructure Sector Key Regulations for Securitization
Banks No specific regulations Banks can invest only in securitized paper that has satisfied the minimum holding period and minimum retention requirements.
Insurance funds Life insurers: At least 15% of total funds to be invested in housing and infrastructure
General insurers: At least 10% of total funds to be invested in infrastructure alone
Higher sector exposure cap to encourage investment
Life insurers: Capped at 10% of assets under management for asset-backed securities and mortgage-backed securities
General insurers: Capped at 5% of assets under management for asset-backed securities only
Mutual funds No specific regulations.Infrastructure debt funds should invest at least 90% of total funds in infrastructure.
No cap on investment in securitized paper
Pension funds (employees’ provident fund, national pension fund)
No specific regulations Capped at 5% of asset-backed securities and mortgage-backed securities
Alternative investment funds
No specific regulations Category I: Only infrastructure funds permitted to invest in securitized paper
Categories II and III: No specific regulations
Sources: Insurance Regulatory and Development Authority; Employees’ Provident Fund Organisation; National Pension Scheme.

36 Securitization in india: Managing Capital Constraints and Creating Liquidity to Fund Infrastructure Assets
Moreover, life insurance funds must invest (cumulatively) at least 15% in the housing and infrastructure sectors. Such investments are also a requirement for infrastructure-specific funds like IDF mutual funds, which are called upon to invest 90% of their assets in the sector, and alternative investment funds, category 1 (infrastructure funds subcategory), which have to invest 75%.
The analysis done for this publication indicates that the regulatory framework does not create any major impediment to investments in securitized paper of the infrastructure sector.
Taxation FrameworkSecuritized paper in India was traditionally subject to a distribution tax (at a statutory tax rate), for all income distributed to holders of securitized paper. Provisions for this distribution tax were inserted by the Finance Act, 2013. Clause 30 of this act added to the Income Tax Act a new chapter XIII-FA regarding the taxation of income from securitized paper.
The securitization trust deducts the distribution tax before income distribution, and expenses may not be deducted against this income. The result is a higher tax and a lower net yield for investments in securitized paper.
The Finance Bill, 2016, replaced the existing tax regime for securitization trusts with a regime that continued to exempt the income of a securitization trust, while rendering taxable investors’ income from the trust. The bill clearly stated that income accrued or received by investors from the securitization trust would be taxable, in the same manner and to the same extent as it would be if the investors had invested directly in the underlying assets. The pass-through status of securitization SPVs was thus reinforced. While the trust still has to deduct 30% tax at the source, investors can claim tax credits against the amounts so deducted.
Accounting Framework
Accounting Principles for Securitization Transactions: Baseline Rules
In accounting for transactions in securitization, the accounting standards set two baseline rules:
(i) conditions under which consolidated financial statements must be prepared for the special-purpose entity or trust that holds the assets, and for the originator; and
(ii) sale of assets for accounting purposes, leading to de-recognition, or removal of the assets from the balance sheet of the originator
The process of accounting for securitization is shown in Figure 17 (Accounting Standard 21) and Figure 18 (Accounting Standard 30).13
13 For details, refer to Appendix 5 of this publication.

The Securitization Market in India 37
Figure 17: Accounting Process for Securitization
Step 1
Level I
Level II
Consolidation of financialstatements
Derecognition of assets
Control test: Test if originatorholds majority voting rights of
the SPV
Risks and rewards test: Test iforiginator has retained or
transferred majority of the votingrights
Control test: Test if originatorcontrols the composition of the
board of directors
Control test: Test if originatorhas retained or transferredcontrol over the economic
benefits arising out of the asset
Step 2
SPV = special-purpose vehicle. Source: CRISIL.
Figure 18: Derecognition Process
If substantially all risksand rewards of the asset
are transferredDerecognize the asset
If substantially all risksand rewards of the asset
are retained
Continue to recognize theasset
If substantially all risksand rewards of the asset
are neither whollytransferred nor wholly
retained
Apply the control test
If control is transferred,de-recognize the asset
If control is retained,continue to recognize the
asset
Source: CRISIL.

38 Securitization in india: Managing Capital Constraints and Creating Liquidity to Fund Infrastructure Assets
Accounting for Profit or Loss on a Securitization Transaction
The profit or loss incurred in a securitization transaction must be accounted for in the profit-and-loss statement of the originator. The RBI’s guidelines on securitization dictate that the profit received from a securitization transaction cannot be recognized wholly in the year of the transaction, but should be amortized on the basis of a prescribed formula, given in Appendix 1.

39
A. Overview
Securitization can be an effective option for lenders seeking to monetize their infrastructure assets. As explained later, securitization enables banks to sell their infrastructure assets
to a securitization trust or an SPV, which, in turn, issues securities backed by these assets. Securitization can help banks diversify their risks and mitigate project risks, while offering capital to finance critical infrastructure needs. It also offers an opportunity for banks to improve their capital ratios by transferring assets from their balance sheets to securitization trusts and SPVs.
Securitization of infrastructure assets also benefits from available infrastructure schemes, since existing and upcoming funds are seen as potential investors and guarantors for securities issued by securitization trusts. All these solutions complement one another and help reduce the infrastructure funding gap.
B. Structure for Infrastructure Asset Securitization in India
Asset Pool CharacteristicsIndia’s securitization market is limited in diversity compared with other developed markets. Portfolios dominated by retail assets are originated mainly by PSBs and NBFCs. There have been no prior instances of securitization of infrastructure loans.
Investors in securitized infrastructure paper in India are likely to be institutional investors, such as insurance funds and pension funds. These investor classes have traditionally been risk averse, and their investment objectives as well as regulations do not permit investment in high-risk instruments rated below “AA.”14
Against this backdrop, the pool of underlying assets must consist of high-quality assets, which have achieved commercial operation and have demonstrated a minimum repayment history of 6 months to 1 year to make infrastructure projects less risky to investors.
14 Appendix 4 of this publication summarizes key regulations for investment in securitized paper in India’s infrastructure sector.
V. Securitization of Infrastructure Assets in India

40 Securitization in india: Managing Capital Constraints and Creating Liquidity to Fund Infrastructure Assets
The PSBs’ outstanding post–commercial operation date (COD) loan portfolio is dominated by power projects (62%), and the balance is made up of roads and highways (19%), telecommunications (12%), and projects in other sectors such as ports and aviation (7%).
Thermal power–based assets have low recovery rates and may not be amenable to securitization in India. The underlying pool of receivables is therefore likely to comprise mainly road and highway assets, since these have higher recovery rates (60%) and the second-largest share of the PSBs’ post-COD infrastructure assets (19%).
Assets in the roads and highways sector are typically in the Rs2–Rs3 billion range, with an average remaining tenure of 10–12 years. To ensure adequate diversity in the pool through the tenure of the transaction, assets with similar cash flow characteristics in other subsectors (nonthermal power, ports, and aviation) can also be included in the pool.
Given the trade-off between the marketability of a smaller pool and the built-in protection provided by a larger and more diversified pool, a medium-sized pool, comprising 20–30 assets with a minimum stand-alone credit rating of “BBB,” is deemed to be most conducive to securitization in India.
Transaction StructureThe structuring of transaction cash flows gives the originators the flexibility to tailor instruments to meet investor needs on the basis of risk appetite and tenor requirements. The two most commonly used transaction structures in India are par structure and premium structure.
The par structure is better suited for infrastructure securitization, because investors derive comfort from its familiarity.
Credit EnhancementAppetite for securitization in India exists largely for paper rated “AA” and above, with post-COD assets. Since the average rating of infrastructure assets in India is “BBB,” external support will be needed to improve the credit quality of the underlying asset pool.
While the pooling of multiple, diverse loans will provide a statistical advantage, additional support would further enhance the credit rating of the securitized paper and make it attractive to investors.
Typically, securitization transactions in India are supported by a tiered structure of internal credit enhancement mechanisms (incorporated within the allocation of cash flow) and external credit enhancements (provided by external entities).
(i) For the securitization of infrastructure assets, the internal credit enhancement could be provided through an EIS.
(ii) In line with the requirement of rating agencies in India, first-loss protection would come from a cash collateral facility provided by the originating banks. First-loss protection is usually at least one installment of pool cash flows and needs to be maintained as a cash collateral (as required by rating agencies in India).

Securitization of Infrastructure Assets in India 41
(iii) The second-loss protection mechanism could be an external guarantee facility, provided against a guarantee fee paid by the securitization trust.
Internal Credit Enhancement
Internal credit enhancements are provided directly by the cash flows of the underlying receivable pool, and are incorporated in the legal structure of the securitization transaction. In India, credit tranching and EIS are the most widely used forms of internal credit support.
Credit Tranching
Credit tranching involves the issuance of multiple classes (or tranches) of securities, with different risk–return profiles. Junior tranches are higher-risk tranches, which serve as protection mechanisms for the higher-rated senior tranches, through subordination in claim over the pool of cash flows. The cash flows are prioritized to pay the senior-most tranches first, while the losses are absorbed by the junior-most tranches. For instance, a pool of Rs1 billion ($15 million) and yield of 10% could be sold in three tranches (Figure 19). The mezzanine and equity tranches receive their payment only after the debt obligations of the senior tranche are met.
Figure 19: credit Tranching—An Illustration
Asset pool(Rs1,000 million;pool yield: 10%)
Seniortranche
AAA(Rs85 million;
yield: 7%)
Mezzanine trancheBBB
(Rs15 million; yield: 8%)
Equity tranche(Rs5 million; yield: 9%)
Poolpayments
Balance
Balance
Source: CRISIL.

42 Securitization in india: Managing Capital Constraints and Creating Liquidity to Fund Infrastructure Assets
Credit tranching helps in the creation of securities, which cater to the different risk–return frameworks of various investor classes. However, in emerging markets such as India, there is no appetite for lower-rated tranches and these usually have to be retained by the originators, resulting in significant reduction of capitalization benefits.
Excess Interest Spread
An EIS is the difference between the yield on the underlying asset pool and the yield contracted to be paid out to the investors. The spread may either revert back to the seller or be captured in a bankruptcy-remote reserve account, commonly called the spread account. For instance, a portfolio with a yield of 10% pays out 8% to the investors, with the differential of 2% being the excess interest (Figure 20).
EIS is the most widely used form of credit enhancement, and usually represents the first line of protection against credit losses.
External Credit Enhancement
External credit enhancements are provided by the originator or other third-party firms. They increase the counterparty risk of investors to entities other than the borrowers. In India, credit enhancements usually take the form of cash collateral or a guarantee facility.
Figure 20: Excess Interest Spread—An Illustration
Asset pool(Rs1,000 million;pool yield: 10%)
Principalrepayments
Interestpayments
Assets sold atface value:
Rs1,000 million
Contracted yield: 8%
Excess interest: 2%
Paymentshortfall
SpreadaccountOriginator
Investors
Source: CRISIL.

Securitization of Infrastructure Assets in India 43
Cash Collateral
In a cash-collateral account, the provider maintains funds (usually equivalent to one installment) in a distinct, bankruptcy-remote account, in the form of cash or cash equivalents (money market instruments).
The account is usually funded at the time of the issue of funds, and covers any shortfall in payments to the extent of the account size.
Rating agencies in India require originating banks to provide cash collateral for securitization transactions, resulting in additional costs for originators (Figure 21).
Guarantee Facility
A guarantee facility is an unconditional, irrevocable commitment provided by the originators or third parties to meet, either partially or fully, any shortfall in payments to investors.
Unlike cash collateral, a guarantee facility is an unfunded commitment, and the credit quality of the guarantee depends on the credit rating of the issuer and the extent to which the cash flows are guaranteed (Figure 22).
Figure 21: cash collateral—An Illustration
Poolpayments
Paymentshortfall
Asset pool(Rs100 million)
Originator
Asset-backedSecurities
(Rs1,000 million)
Cash collateralaccount
(Rs200 million)
Source: CRISIL.

44 Securitization in india: Managing Capital Constraints and Creating Liquidity to Fund Infrastructure Assets
Mechanism of the Securitization StructureThe structure of infrastructure securitization comprises a single-class of securities, rated “AA” and above and issued to institutional investors, supported by an EIS and a cash collateral account as first-loss protection and an external third-party guarantee as second-loss protection.
Investors expect the yield on these securities to be at a premium of 50–75 basis points over the prevailing rates for standard 10-year corporate bonds of the same rating, to incorporate the structural risk of securitized transactions. For example, “AAA”-rated securitized paper is expected to have a premium of 50–75 basis points over the average prevailing AAA-rated corporate bonds.
The amortization of the securitized paper will match the amortization profile of the underlying asset pool, with higher debt obligations in the initial years (because of interest on a higher principal outstanding) and tapering in the subsequent years.
This structure results in higher capitalization benefits for originators, as the complete asset pool is sold to investors. Additionally, as the credit enhancement will predominantly be provided externally, there will be adequate protection for investors throughout the tenure of the security, independent of the performance of the underlying asset pool.
A diagram representation of the securitization structure is presented in Figure 23.
Figure 22: Guarantee Facility—An Illustration
Poolpayments
Paymentshortfall
Asset pool(Rs100 million)
Originator/Third-party firm
Asset-backedsecurities
(Rs1,000 million)
Guarantee(Rs200 million)
Source: CRISIL.

Securitization of Infrastructure Assets in India 45
Figure 23: Structure for Infrastructure Asset Securitization in India
Cash flow
Originator
InstitutionalInvestors
(insurancecompanies,
pension funds,mutual funds)
Third-PartyEntity
SecuritizationTrust
Assets sold at face value
Excess interestspread (1%–2%)
Principal repayments +interest payments
100%
Asset Pool(BBB– and
aboveinfrastructure
loans)
100%
Asset-BackedSecurity
(AA and above)
Assetsconvertedinto PTCs
PTCs issued toinvestors
Provided by originating bank
2%–3%*
First-LossCash
Collateral
10%–12%*
Second-LossGuarantee
(BBB)
Tier1
Contractual obligation Transfer of securities
Credit Enhancement12%–15%
Tier2
Tier3
PTC = pass-through (or pay-through) certificate.* As a % of total pool cash flows.Source: CRISIL.
Benefits of the Securitization StructureSince assets chosen for the pool are operational, quality assets and the structure provide adequate support to the pool. Securitization of infrastructure assets could therefore be a viable proposition for the originating banks, resulting in the following benefits:
(i) release of investment surplus equivalent to the pool principal for the originators, as the complete asset pool is sold to investors (the released capital could be further deployed by the originators in high-quality assets, matching the recommended tenure for bank credit);
(ii) the provision of guarantee, as a second-loss credit enhancement is an unfunded commitment for the issuing entity, and could be offset through the levy of a guarantee fee; and
(iii) adequate protection for investors throughout the tenure of the pool and independent of pool performance, since the credit enhancement is predominantly provided through external mechanisms.

46 Securitization in india: Managing Capital Constraints and Creating Liquidity to Fund Infrastructure Assets
International Examples of Securitization
United States and Europe
Securitization transactions for project bonds have been undertaken for the underlying assets in power, oil and gas, and energy infrastructure projects. A common structure for securitizing these assets has been a project finance collateralized debt obligation (PF-CDO). In a PF-CDO, the originator transfers project finance loans and bonds to the issuer of a collateralized debt obligation (CDO) under a true sale arrangement. As a result, the CDO issuer physically holds project finance assets, and all CDO liabilities are issued in funded form.
The earliest PF-CDOs were cash securitization structures, in which the SPV purchased loans as collateral for the CDO note issues. Project Funding Corp. I (PFC I), sponsored by Credit Suisse First Boston (an investment banking division of Credit Suisse Group, before 2006), was one of the earliest such cash PF-CDOs. It closed on 5 March 1998. PFC I issued about $617 million in debt and equity securities, collateralized by a portfolio of about 40 loans made primarily to US infrastructure projects.
Lusitano Project Finance I (which closed in December 2007) was based on 20 pan-European infrastructure asset exposures, with an average outstanding balance of €53.9 million belonging to Banco Espirito Santo, a Portuguese bank. The underlying loans were originated by members of the Banco Espirito Santo Group for borrowers in the project finance markets for infrastructure, energy, and construction projects mainly in Portugal, the United Kingdom (UK), and other European jurisdictions. The pool was static, as there was no facility in the transaction for the purchase of further loans.
Geographically speaking, the UK accounted for 11 loans and 63.3% of principal outstanding. Portugal accounted for five loans and 18.2% of principal outstanding. Spain (three loans, 14.2% principal outstanding) and Hungary (one loan, 4.3% principal outstanding) made up the rest of the pool. Even though significant losses occurred in 2007 and 2008 on structured credit products with exposures to subprime mortgages or MBSs, the entire CDO (including PF-CDO) business suffered because of falling investor confidence in the CDO structure. New issuance of PF-CDOs plummeted in 2008, as investors fled the CDO market and widening credit spreads ended the opportunity for yield arbitrage.
However, it is widely believed that the CDO structuring process is time tested and conceptually sound. Project finance loans, leases, and other debt obligations are seen globally as attractive assets for CDOs, because they have higher assumed recovery rates and shorter recovery periods than CDOs with comparable ratings.
PF-CDO transactions rated by Moody’s are a relatively structured finance asset class that invests in a range of project finance assets including, among others, PPPs or private finance initiatives, regulated utilities, renewable energy projects, and large infrastructure sectors across Australia, the European Union (EU), North America, and the UK.
Australia
The securitization market in Australia is a A$40 billion market, dominated by MBSs, particularly RMBSs, which account for over 70% of the total securitized issuances every year.

Securitization of Infrastructure Assets in India 47
Australian RMBSs are attractive for a number of reasons, including the fact that Australian residential mortgages have always had a reputation for low credit risk and sound underwriting standards. In addition, house prices in Australia tend to be more stable than those in Europe and the US, and defaults are considerably low by global standards.
Assets typically securitized include mortgage loans, construction loans, credit card receivables, and sale contracts, as well as complex instruments, such as CDOs and CDOs-Squared.
Infrastructure investment in Australia has stayed at around 4% of GDP since the 1970s, with the share of private investment doubling from 25% in the early 2000s to over 50% in 2016.
Private investments in Australia are dominated by institutional investors, such as insurance companies and pension funds, and special-purpose infrastructure funds sponsored by the Government of Australia and other private sector players.
While the majority of debt raising for private investment in Australia is still in the form of loans (over 75% of total debt investment in infrastructure), as the project bond market has been subdued since the global financial crisis in 2008, a majority of this debt requirement is fulfilled by institutional investors.
Australian commercial banks have a low credit exposure of 1%–2% to the infrastructure sector. These loans are usually of a medium-term tenor and are refinanced every 3–5 years, with the refinancing risk borne by the borrower.
Because of the low credit exposure of Australian commercial banks to the infrastructure sector and the elimination of the asset–liability mismatch issue through the disbursement of medium-term credit, banks have no incentives to securitize these loans.
Institutional investors, which lend directly to infrastructure projects such as infrastructure funds, are able to match the tenor of their assets and liabilities, as both the source of funds and the tenor of infrastructure credit is long term; no asset-backed securitization transactions are originated by these investors.
These factors have led to a virtually nonexistent ABS market for infrastructure loans in Australia.
People’s Republic of China
The PRC began allowing securitization as early as 2005, but the pilot program was put on hold in 2009, following the global financial crisis. It was revived again in 2012, with the release of expanded guidelines on securitization jointly issued by the People’s Bank of China, the China Banking Regulatory Commission, and the Ministry of Finance.
The volume of ABSs that may be issued each year is regulated by the State Council, the PRC’s Cabinet, and the cap is currently set at $78.3 billion.
At present, the PRC has over $88.9 billion worth of outstanding securitized issuances, greatly dominated by CDOs, backed by corporate loans and auto-loans backed ABSs.

48 Securitization in india: Managing Capital Constraints and Creating Liquidity to Fund Infrastructure Assets
Infrastructure investment in the PRC has averaged 9% of GDP since 2007, with an average of over 95% contributed from public expenditure.
Since private contribution to infrastructure investment is very low in the PRC, the credit exposure of commercial banks to the sector is negligible, such that securitized infrastructure loans are virtually nonexistent in the country.

49
A. Overview
Due diligence was conducted on the structure identified for securitization of infrastructure assets in India, to evaluate the value generated to PSBs. As part of the due diligence, a
sample of assets was obtained from India’s largest PSB, the SBI.
B. About the State Bank of IndiaA government-owned bank headquartered in Mumbai, the SBI is one of the four-biggest banks along with the Bank of Baroda, Punjab National bank, and ICICI Bank. The SBI is the biggest provider of banking and financial services in India in terms of assets, with excellent coverage within the country and even overseas.
Its outstanding infrastructure advances constitute 17.12% of gross advances, totaling Rs2,074 billion, with the largest exposure being to power (11.81%), followed by telecommunications and roads (Table 19).
VI. Value Analysis and Success Factors
Table 19: State Bank of India—Outstanding credit Portfolio
ItemAs of December 2016 As of December 2015
Rs billion % Rs billion %Total advances 12,116 100.00 11,628 100.00Outstanding infrastructure
advances 2,074 17.12 2,014 17.32Of which:
Power 1,430 11.81 1,290 11.09Telecommunications 185 1.53 229 1.97Roads and Ports 167 1.37 186 1.60Other 292 2.41 310 2.66
Source: State Bank of India, Analyst Presentation, 3rd Quarter, FY2017.

50 Securitization in india: Managing Capital Constraints and Creating Liquidity to Fund Infrastructure Assets
The SBI’s gross NPAs rose from 6.5% in FY2016 to 7.23% in the third quarter of FY2017, largely because the rising NPAs in the (large and medium) corporate segment. This has adversely affected both the return on assets and the return on equity (Figure 24).
However, the SBI’s capital position has been on a downward trend, as far as the capital to risk assets ratio (CRAR) is concerned. The major thrust of SBI’s capital adequacy framework has been fund-raising for additional tier 1 capital, realization from strategic investments, and capital infusion by the government (Table 20).
Figure 24: State Bank of India—Key ratios
0
0.1
0.2
0.3
0.4
0.5
0.6
0.7
0.8
0
2
4
6
8
10
12
FY2014 FY2015 FY2016 Q3 FY2017Return on equity Gross nonperforming assetNet nonperforming asset Return on assets
FY = fiscal year. Source: State Bank of India annual reports.
Table 20: State Bank of India—Basel III compliance Scenario(%)
Item 2012–2013 2013–2014 2014–2015 2015–2016Q3
2016–2017Common equity
tier 1 9.59 9.31 9.81 9.60Additional tier 1 0.13 0.29 0.11 0.04Total tier 1 9.32 9.72 9.60 9.92 9.64Tier 2 3.19 2.72 2.40 3.20 2.81Total capital to risk assets ratio 12.51 12.44 12.00 13.12 12.45
Source: State Bank of India annual reports.

Value Analysis and Success Factors 51
C. Financial Analysis: Structure Characteristics
Sample Asset PoolIn order to validate the value to PSBs from the recommended structure, a detailed financial analysis was conducted on a sample of infrastructure assets from the SBI.15 Table 21 gives an overview of the characteristics of the same pool.
Characteristics of Pass-Through CertificatesInstitutional investors in India expect the yield on the securities to be at a premium of 50–75 basis points over the prevailing rate for a standard 10-year corporate bond of the same rating, to incorporate the structural risk of securitized transactions. For example, securitized paper rated “AA” and above is expected to have a premium of 75 basis points over the average prevailing similar-rated corporate bonds.
Given that the average yield on “AA”-rated corporate bonds is 8.3%, a premium of 75 basis points results in a PTC yield of 9.05%.
15 For details of the assumptions used in the financial analysis, see Appendix 6 of this publication.
Table 21: State Bank of India—Asset Pool Sample
Number of assets 9Pool size Rs25 billionWeighted average interest rate 11.19%Weighted average tenure 9.15 yearsTenure range 7–11 yearsRating range BBB– to A–
Asset distribution: Sectors
Sector No. of AssetsRoads and Highways 6
Ports 2Energy (Transmission) 1
Asset distribution: Ratings
Rating No. of Assets2
BBB+ 1BBB 3
BBB– 3Maximum asset size Rs5.52 billionMinimum asset size Rs0.35 billion
Source: CRISIL.

52 Securitization in india: Managing Capital Constraints and Creating Liquidity to Fund Infrastructure Assets
Infrastructure loans in India are based on floating interest rates, linked to the banks’ base rate, whereas PTCs are typically issued at a fixed interest rate. In the absence of a market for interest rate swaps in India, the floating rate risk in securitized paper will need to be borne by the trust.
This floating rate risk has been incorporated into the financial analysis through sensitivity analysis of the interest rate.
The amortization of securitized paper will match the amortization profile of the underlying asset pool, with a tenure of 11 years, and higher debt obligations in the initial years (because of interest on a higher principal outstanding), tapering in later years.
Credit Enhancement CharacteristicsThe quantum of credit enhancement required would be around 12%–15% of the pool principal, with 1%–2% provided by cash collateral, and the larger portion of 10%–13% provided via a guarantee facility.
An annual guarantee fee of 1% of the outstanding guaranteed amount could offset the guarantee outflow in a steady state, making the facility viable for the issuing entity.
Typically, for an identified asset pool, in a base-case scenario, 60% of the loss is borne by the EIS and the cash collateral, with the balance provided by the guarantee outflows. Of the total amount in the guarantee fund, only about 8% is used toward the absorption of PTC losses.
D. Outcome: Scenario AnalysisBase-CaseThe base-case scenario follows the default rate characteristics of the S&P Global Cumulative Default rates.16 Given a cumulative default rate for the pool of 18.11% for the tenure of 11 years, and an asset pool comprising nine assets, only one asset defaults in the sixth year (at a cumulative default rate of 12.92%), and remains in default thereafter.
The asset assumed to be defaulting is the largest asset in the lowest-rated (BBB–) asset category.
The originating bank gains up-front consideration for the sale of assets at par structure, income from treasury operations for the unused portion of the cash collateral, and the total EIS flowing back over the tenure of the PTC, resulting in total inflows of Rs27.69 billion (Rs25 billion as up-front inflows, and Rs2.69 billion inflows over the pool tenure), as shown in Table 22.
The loss due to asset default of Rs1.15 billion, after a recovery of 60%, is completely absorbed by the credit enhancements provided to the PTC holders (Table 23).
16 For details of the base-case outcome, see Appendix 7 of this publication.

Value Analysis and Success Factors 53
Of the total loss absorbed by the credit enhancements, 60% is borne by the EIS and the cash collateral combined (Rs0.46 billion), and the balance of Rs0.7 billion comes from the guarantee outflows. The net balance in the guarantee fund is Rs2.35 billion of the original Rs3.03 billion, or 92% of the original amount.
In addition, the originators also incur Rs0.53 billion in guarantee fees and other legal expenses.
Given the EIS of 2.14% in the base-case, and a single asset default in the sixth year in the underlying pool, the originating bank makes a net gain of 7.6% of the asset pool principal, as against a loss given default of 4.5% (Table 24).
Table 22: Base-case Outcome—Inflows
ItemAmount
(Rs billion)Up-front inflowsConsideration for sale of assets 25.00Inflows over the pool tenureIncome from treasury operations 0.11
Total excess interest spread for originator 2.58
Total inflows over the pool tenure 2.69
Total inflows 27.69
Source: CRISIL.
Table 23: Base-case Outcome—Outflows
ItemAmount
(Rs billion)Losses based on current holdingsTotal loss given default
(principal + interest) 1.15Post securitizationTotal loss absorbed by cash collateral 0.32Total loss absorbed by excess
interest spread 0.14
Guarantee fees and other expenses 0.31
Total outflows 0.77
Source: CRISIL.

54 Securitization in india: Managing Capital Constraints and Creating Liquidity to Fund Infrastructure Assets
Scenario 2This scenario accounts for the interest risk inherent in floating-rate infrastructure loans that are linked to a bank’s base rate. A decrement in the bank’s base rate adversely affects interest payments from the asset pool, to the extent of the change in the base rate.
Since PTCs have a fixed interest payout in every period, the reduction in interest receivable from the asset pool will lower the excess interest flowing back to the originator, affecting the net gains to banks.
In this scenario, credit enhancement has been kept at the base level of 8.6% (of the pool principal), the minimum required to provide support for the structure. Of this, about 1% is provided by cash collateral, and the balance of 7.6% comes from the external guarantee facility.
The originating bank gains up-front consideration for the sale of assets at par structure, income from treasury operations for the unused portion of the cash collateral, and the total EIS flowing back over the tenure of the PTC (Table 25).
Table 24: Base-case Outcome—Net Gains
ItemAmount
(Rs billion)
% of Pool Principal
(%)Total inflows 2.69 10.7Total outflows 0.77 3.1Net gains for banks 1.92 7.6Release of investment surplus
for banks 25.00
Source: CRISIL.
Table 25: Scenario 2—Inflows
ItemAmount
(Rs billion)Upfront inflowsConsideration for sale of assets 25.00Inflows over the pool tenureIncome from treasury operations 0.09Total excess interest spread for originator 1.77Total inflows over the pool tenure 1.86Total Inflows 26.86
Source: CRISIL.

Value Analysis and Success Factors 55
The loss due to asset default as well as declining interest of Rs1.64 billion, after 60% recovery, is completely absorbed by the credit enhancements provided to the PTC holders.
Of the total loss absorbed by the credit enhancements, 61% is borne by the EIS and the cash collateral (Rs1 billion), and the balance of Rs0.64 billion is provided by the guarantee outflows. The net balance in the guarantee fund is Rs1.54 billion of the original Rs2.17 billion, or 71% of the original amount.
The originators also incur Rs0.18 billion in guarantee fees and other legal expenses (Table 26).
In scenario 2, the originating bank makes a net gain of 2.73% of the asset pool principal, as against a total loss of 6.47% (Table 27).
Table 26: Scenario 2—Outflows
ItemAmount
(Rs billion)Losses based on current holdingsTotal loss due to asset default and
declining interest 1.64
Post-securitization lossesTotal loss absorbed by cash collateral 0.25Total loss absorbed by excess interest
spread 0.75
Guarantee fees and other expenses 0.18
Total post-securitization outflows 1.18
Total outflows 2.82
Source: CRISIL.
Table 27: Scenario 2—Net Gains
ItemAmount
(Rs billion)
% of Pool Principal
(%)Total inflows 1.86 7.44Total outflows 1.18 4.71Net gains for banks 0.68 2.73Release of investment
surplus for banks 25.00
Source: CRISIL.

56 Securitization in india: Managing Capital Constraints and Creating Liquidity to Fund Infrastructure Assets
E. Key Success FactorsFor the recommended structure to function and achieve its objectives, the following critical success factors must be realized:
Asset SelectionAssets selected for a transaction of this kind must have the necessary identified attributes, namely:
(i) operational assets, with a minimum of 1 year of stabilized operations, to provide adequate comfort to institutional investors in India;
(ii) homogenous assets, in terms of the credit risk, tenure, payment profile, to ensure that payments to investors of securitized paper are made on time; and
(iii) adequately sized asset pool, to ensure the marketability of a smaller pool and the built-in protection provided by a larger, more diversified pool.
Credit Enhancement MechanismSecuritization of infrastructure assets requires adequate support in the form of external credit enhancement to match the ratings and risk expectations of institutional investors in India.
Given the early development stage of the securitization market in the country, commercial market players may be unwilling to provide the guarantee facility in the medium term. This facility could be provided in two ways:
(i) directly by the originator; or(ii) by a government-promoted entity, functioning as a market maker.
Floating-to-Fixed Interest Rate ConversionInfrastructure loans in India are based on floating interest rates, linked to banks’ base rate. The nature of liabilities of institutional investors in India keeps them from taking on the interest rate risk of floating instruments.
In the absence of an interest rate swap market in India, the floating rate risk must be borne by one of three entities. This matter could be explored and negotiated during the transaction stage:
(i) Originator. Better suited to bear risk, as the interest payments will be linked to its base rate. Originators could provide a fixed coupon rate to investors, for a premium or fee. In the past, the interest rate risk in a few MBS transactions was borne by originators.
(ii) Investors. Investors could bear the floating rate risk through higher coupon rates adjusted to price in interest rate risk.

Value Analysis and Success Factors 57
(iii) Third-party entities. In the absence of an interest rate swap market, a government-promoted entity providing a guarantee facility could, for a fee, also provide a guarantee against the interest rate risk.
The securitization trust could renegotiate terms from floating rate to fixed rate with the developer, after the sale of assets by the originator, but it is difficult to get consent from the developers of all the projects in the pool. However, the renegotiation of a few assets in the pool could offset interest rate risk.
Institutional MechanismsTo provide the required comfort to investors, monitoring and oversight mechanisms for the underlying asset pool need to be provided by a third party.
IDFs investing in securitized paper could monitor the quality of underlying assets, or an independent monitoring authority could be set up during the transaction stage.
Secondary Market for Infrastructure Securitized PaperGiven the long-term nature of infrastructure securitized paper, a secondary market for securitization must be promoted in India, to provide investors with viable exit options, if required.
Given the early development stage of the market, PTCs in the initial transactions are expected to be privately placed with institutional buyers.

58
This publication highlights the possibility that securitization of infrastructure assets could be a viable option to help strengthen the capital position of PSBs in India, while also
deepening the access of infrastructure financing to institutional investors. This option is especially important given the challenges plaguing the infrastructure and banking sector in the country.
Although the banks’ core strengths of adequate project appraisal and monitoring skills, combined with an emerging bond market, still mean that banks will continue to provide for a substantially large portion of the debt investment requirement, the shift to other instruments such as bonds, market securities, and foreign investment is imminent and necessary.
The structure presented in this publication suggests an up-front release of investment capital, as the assets are sold at par structure. The investment surplus could be further deployed by the originators in high-quality assets, matching the recommended tenure for bank credit, in line with its average liability tenure.
Institutional investors receive a premium of 75 basis points for AAA-rated long-term, high-quality assets, matching their investment objectives and requirements.
On testing the structure on a sample asset pool, securitization of the asset pool also results in banks making a net gain of 4.28%–7.60% (net of losses absorbed by EIS and collateral, guarantee fees, and other legal expenses), as against a loss, given the default on current holdings of 4.5%–15.7% of the pool principal.
In a scenario of an annual decline in interest rates of 25 basis points, the minimum net gain to banks is 2.73%, as against a loss due to asset default and a 6.47% decline in interest rates.
There have been no prior instances of infrastructure loan securitization in India—and limited instances globally—with adequate support and institutional mechanisms. But infrastructure securitization will nonetheless unlock significant value for the Indian economy, the effects of which will be felt across all industries and sectors.
Conclusion

59
Reserve Bank of India’s Guidelines on Securitisation of Standard AssetsCriteria to be met by SPV
“8. [Special‑purpose vehicle (SPV)] is set up during the process of securitisation to which the beneficial interest in the securitised assets are sold or transferred on a without recourse basis. The SPV may be a partnership firm, a trust or a company. Any reference to SPV in these guidelines would also refer to the trust settled or declared by the SPV as a part of the process of securitisation. The SPV should meet the following criteria to enable the originator to treat the assets transferred by it to the SPV as a true sale and apply the prudential guidelines on capital adequacy and other aspects with regard to the securitisation exposures assumed by it.
8.1 Any transaction between the originator and the SPV should be strictly on an arm’s‑length basis. Further, it should be ensured that any transaction with the SPV should not intentionally provide for absorbing any future losses.
8.2 The SPV and the trustee should not have resembling names or imply any connection or relationship with the originator of the assets in their title or name.
8.3 The SPV should be entirely independent of the originator. The originator should not have any ownership, proprietary interest, or beneficial interest in the SPV. The originator should not hold any share capital in the SPV.
8.4 The originator shall have only one representative, without veto power, on the board of the SPV, provided that the board has at least four members and independent directors are in the majority.
8.5 The originator shall not exercise direct or indirect control over the SPV and the trustees, and shall not settle the trust deed.
8.6 The SPV should be bankruptcy remote and nondiscretionary.8.7 The trust deed should lay down, in detail, the functions to be performed by
the trustee, its rights, and obligations, as well as the rights and obligations of the investors in relation to the securitized assets. The trust deed should not give the trustee any discretion in the manner of disposal and management or application of the trust property. To protect their interests, investors should be empowered in the trust deed to change the trustee at any point in time.
8.8 The trustee should perform trusteeship functions only in relation to the SPV, and should not undertake any other business with the SPV.
8.9 The originator shall not support the SPV’s losses, except under the facilities explicitly permitted under these guidelines and shall also not be liable for the recurring expenses of the SPV.
Appendix 1Criteria for Securitization in India

Appendix 160
8.10 The securities issued by the SPV shall compulsorily be rated by a rating agency registered with the Securities and Exchange Board of India (SEBI), and such publicly available rating shall at no time be over 6 months old. For the purpose of rating and subsequent updating, the SPV should supply necessary information to the rating agency in a timely manner. Commonality and conflict of interest, if any, between the SPV and the rating agency should also be disclosed.
8.11 The SPV should inform investors in the securities issued by it that the securities are not insured, and that they do not represent deposit liabilities of the originator, the servicer, or the trustees.
8.12 The SPV should make available to the Reserve Bank of India a copy of the trust deed and the SPV’s accounts and statement of affairs, if required to do so.”

61
Appendix 2Basel III Risk Weights
Table A2.1: Basel III risk Weights
Asset Risk WeightInvestments in government securities 0%Claims on foreign sovereigns 0%–100%, depending
on credit ratingClaims on public sector entities 20%–100%, depending
on credit ratingClaims on commercial banks:(i) For investment in equity shares of banks wherein less
than 10% of the outstanding shares are held by the investing bank
(ii) For investment in equity shares of banks wherein less than 10% of the outstanding shares are held by the investing bank
125%
250%Investment in bank bonds 20%Claims on foreign banks 20%–50%, depending
on credit ratingClaims on corporates 20%–100%, depending
on credit ratingIndividual housing loans 50%–75%, depending
on the book valueCommercial real estate loans 100%Claims on venture capital funds, which are considered
high-risk exposures 150%Treatment of securitization exposuresCredit enhancements with first-loss positions 1,111%Exposure of “B+” rating and below, unrated exposures 1,111%Securitization exposures that do not meet the Reserve Bank of
India’s securitization guidelines 1,111%
Source: Reserve Bank of India.
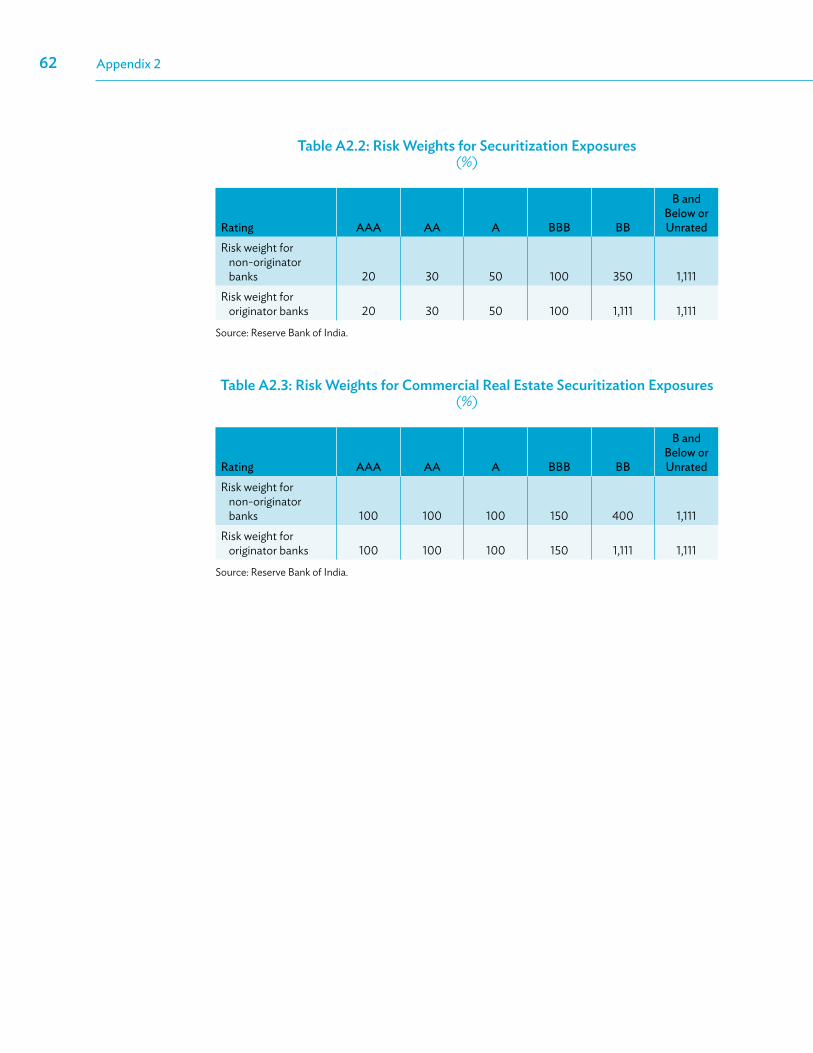
Appendix 262
Table A2.2: risk Weights for Securitization Exposures(%)
Rating AAA AA A BBB BB
B and Below or Unrated
Risk weight for non-originator banks 20 30 50 100 350 1,111
Risk weight for originator banks 20 30 50 100 1,111 1,111
Source: Reserve Bank of India.
Table A2.3: risk Weights for commercial real Estate Securitization Exposures(%)
Rating AAA AA A BBB BB
B and Below or Unrated
Risk weight for non-originator banks 100 100 100 150 400 1,111
Risk weight for originator banks 100 100 100 150 1,111 1,111
Source: Reserve Bank of India.

63
An overview of the regulations studied under this exercise is provided in Table A3.1.
Table A3.1: regulatory Framework Overview
Participant Regulatory Authority Regulations or GuidelinesOriginatorsBanks or nonbanking financial companies (NBFCs)
Reserve Bank of India (RBI) Guidelines on securitization transactions: section A on 7 May 2012, pursuant to paragraph 107 of the Monetary Policy Statement 2012–2013
InvestorsBanks RBI Master circular: Cash reserve ratio and
statutory liquidity ratio, 2014Insurance funds Insurance Regulatory
Development Authority (IRDA)
Insurance Regulatory and Development (Investment) (Fifth Amendment) Regulations, 2013 (Part III, Section 4)
Mutual funds Securities and Exchange Board of India (SEBI)
SEBI (Mutual Funds) Regulation, 1996
Pension funds Private pension funds: IRDA
Employee provident fund: Employees’ Provident Fund Organisation
National pension system: Pension Funds Regulatory and Development Authority (PFRDA)
Private pension funds: Insurance Regulatory and Development (Investment) (Fifth Amendment) Regulations, 2013 (part III, section 4)
Employee provident fund: Ministry of Labour and Employment
National pension system: PFRDA
Alternative investment funds (venture capital funds, private equity funds, infrastructure funds, etc.)
SEBI SEBI (Alternative Investment Funds) Regulation, 2012
Infrastructure debt funds (IDFs)
IDF (NBFC): RBI
IDF (mutual funds): SEBI
IDF (NBFC): Infrastructure debt fund, nonbanking financial companies (Reserve Bank) directions, 2011
IDF (MF): SEBI (Mutual Funds) Regulation, 1996
Source: CRISIL.
Appendix 3Detailed Analysis of the Regulatory Framework
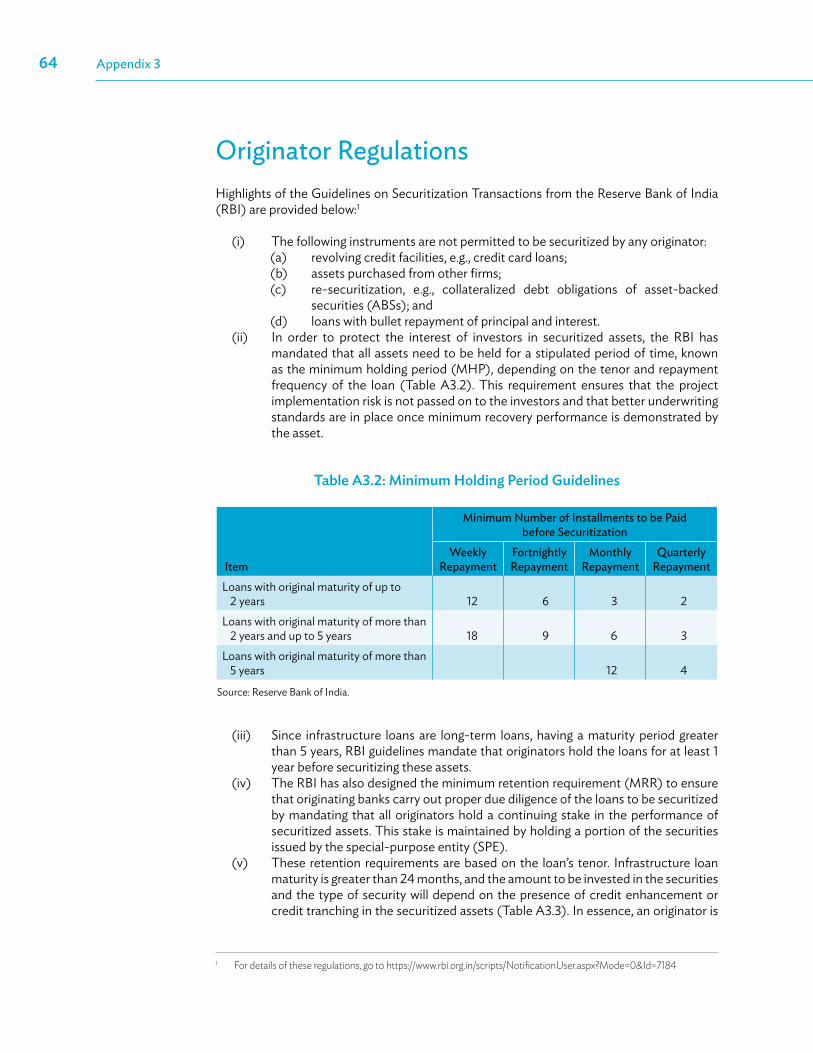
Appendix 364
Originator RegulationsHighlights of the Guidelines on Securitization Transactions from the Reserve Bank of India (RBI) are provided below:1
(i) The following instruments are not permitted to be securitized by any originator:(a) revolving credit facilities, e.g., credit card loans;(b) assets purchased from other firms; (c) re-securitization, e.g., collateralized debt obligations of asset-backed
securities (ABSs); and(d) loans with bullet repayment of principal and interest.
(ii) In order to protect the interest of investors in securitized assets, the RBI has mandated that all assets need to be held for a stipulated period of time, known as the minimum holding period (MHP), depending on the tenor and repayment frequency of the loan (Table A3.2). This requirement ensures that the project implementation risk is not passed on to the investors and that better underwriting standards are in place once minimum recovery performance is demonstrated by the asset.
Table A3.2: Minimum Holding Period Guidelines
Item
Minimum Number of Installments to be Paid before Securitization
Weekly Repayment
Fortnightly Repayment
Monthly Repayment
Quarterly Repayment
Loans with original maturity of up to 2 years 12 6 3 2
Loans with original maturity of more than 2 years and up to 5 years 18 9 6 3
Loans with original maturity of more than 5 years 12 4
Source: Reserve Bank of India.
(iii) Since infrastructure loans are long-term loans, having a maturity period greater than 5 years, RBI guidelines mandate that originators hold the loans for at least 1 year before securitizing these assets.
(iv) The RBI has also designed the minimum retention requirement (MRR) to ensure that originating banks carry out proper due diligence of the loans to be securitized by mandating that all originators hold a continuing stake in the performance of securitized assets. This stake is maintained by holding a portion of the securities issued by the special-purpose entity (SPE).
(v) These retention requirements are based on the loan’s tenor. Infrastructure loan maturity is greater than 24 months, and the amount to be invested in the securities and the type of security will depend on the presence of credit enhancement or credit tranching in the securitized assets (Table A3.3). In essence, an originator is
1 For details of these regulations, go to https://www.rbi.org.in/scripts/NotificationUser.aspx?Mode=0&Id=7184

Appendix 3 65
mandated to retain 10% of the book value of any infrastructure loan, by investing in securities of the SPE.
Table A3.3: Minimum retention requirement for Infrastructure Loans
Loan Feature Portion of Special-Purpose Entity (SPE) Securities to Be Held by the Originator
No credit tranching; no credit enhancement
10% of the book value of the loan
Credit enhancement only If the credit enhancement provided is less than 10% of the book value of the loan, the difference needs to be invested in the SPE
Credit tranching only 5% of the book value of the loan to be invested in equity tranche and the balance (10%, investment in equity tranche) to be invested in other tranches on a pari passu basis
Credit enhancement and credit tranching If credit enhancement is equal to or greater than 10% of the book value of the loan, no further investment needed
If enhancement is greater than 5% but less than 10%, the balance in securities on the SPE on a pari passu basis
If enhancement is less than 5%, then investment in equity tranche to the extent of the difference (5%, credit enhancement value) and remaining up to 10% of the book value in other tranches of the SPE
Source: Reserve Bank of India.
(vi) Originators are not permitted to invest over 20% of the book value of loans securitized in the SPE. If the exposure of the bank exceeds 20%, the investment will have the maximum risk weight allotted under Basel III norms. This exposure limit includes any credit enhancements or liquidity support provided by the originator.
(vii) The implications of an originator not meeting these guidelines, particularly the MHP and MRRs, are twofold:(a) The securitized assets will be treated as if they were not securitized and
originators will have to hold adequate capital against these assets, based on risk weights assigned by the RBI.
(b) These assets cannot be invested in by other banks or nonbanking financial companies, as only those assets for which appropriate disclosures have been made are permitted investments for banks and nonbanking financial companies.

Appendix 366
Investor RegulationsBanksScheduled commercial banks (SCBs) in India are expected to satisfy the cash reserve ratio and statutory liquidity ratio requirements set by the RBI.
The cash reserve ratio regulation requires all SCBs to hold 4% of their net demand and term liabilities in cash with the RBI.
The statutory liquidity ratio regulation requires all SCBs to hold 21.5% of their net demand and term liabilities in instruments approved by the RBI, and is satisfied largely through government securities holdings.
For investment in securitized assets, there are no specific regulations for banks at present. The RBI mandates that banks can invest only in securitized assets of other originators that have satisfied the MRR and MHP requirements.
Insurance FundsTo encourage investments in the infrastructure sector, the Insurance Regulatory Development Authority has incorporated three clauses:2
(i) Life insurers are mandated to invest at least 15% of the total funds in the housing and infrastructure sector combined. ABSs with underlying housing or infrastructure assets are permitted instruments in this category, subject to a cap of 10% of the investment assets.
(ii) General insurers are mandated to invest at least 10% of the total fund in the infrastructure sector alone. ABSs with underlying housing or infrastructure assets are permitted instruments in this category, subject to a cap of 5% of the investment assets.
(iii) The cap on the exposure an insurance fund can have to a single company in the sector has been increased from 10% (for all sectors) to 20% of the total funds under management.
Mutual Funds
While the Securities and Exchange Board of India (SEBI) has provided a list of approved investments in which a mutual fund can invest, limits for each investment instrument are not regulated by the SEBI. All mutual funds are permitted to decide their investment proportion on the basis of the fund objective.
Asset-backed and mortgage-backed securities have been approved by the SEBI as investment instruments.3
2 For detailed guidelines and individual instrument limits, see Appendix 4 of this publication.3 For a detailed list of instruments and other guidelines, see Appendix 4 of this publication.

Appendix 3 67
Mutual funds that take the form of infrastructure debt funds are mandated to invest at least 90% of their total funds in the infrastructure sector, via debt or securitized instruments.
Pension FundsFor private fund houses, the Insurance Regulatory Development Authority mandates that a minimum 40% of the fund corpus needs to be invested in government securities, of which at least 20% should be invested in central government securities alone. The balance can be invested in approved investments as specified by the regulation, subject to exposure norms.
The employee pension scheme is mandated to invest all proceeds from the government in the public account of the Government of India. For the balance of contributions from employers and employees, the scheme can invest on the basis of the investment pattern outlined by the Ministry of Labour and Employment (Table A3.4).
Table A3.4: Ministry of Labour and Employment—Investment regulations, 2013
InstrumentPercentage of
Funds
Central government securitiesSecurities guaranteed by the central government or state governmentUnits of dedicated mutual funds investing in government securities onlya
Minimum 45%Maximum 50%
(i) Debt securities with maturities of not less than 3 years issued by corporate bodies, banks, and public financial institutions; provided that at least 75% of the investment in this category is made in instruments having an investment-grade rating from at least one credit rating agency.
(ii) Term deposit receipts of minimum 1-year duration issued by scheduled commercial banks (SCBs), provided that the SCB meets the following conditions:(a) maintaining profitability for the preceding 3 years;(b) maintaining a minimum capital to risk-weighted assets ratio of 9%; (c) having net nonperforming assets of not more than 2% of net advances;
and(d) having a minimum net worth of not less than Rs2 billion
(v) Rupee bonds having an outstanding maturity of at least 3 years issued by the International Bank for Reconstruction and Development, the International Finance Corporation, and the Asian Development Bank.
Minimum 35%Maximum 45%
Money market instruments, including units of money market mutual funds Maximum 5%
Equity and equity-related instruments, including exchange-traded derivatives and index funds
Minimum 5%Maximum 15%
Asset-backed securities, units of real estate, and infrastructure investment trusts Maximum 5%a Maximum 5% of the fund can be invested in such mutual funds.Source: Ministry of Labour and Employment.
Turnover ratio (value of securities traded in the year / average value of the portfolio at the start of the year and the end of the year) should not exceed 2.

Appendix 368
The Employees’ Provident Scheme was not permitted to invest in securitized products and other derivative instruments until April 2015. Now, after the implementation of the new investment pattern, the Employees’ Provident Scheme can invest up to 5% of the investment funds in ABSs.
For the National Pension System, the Pension Funds Regulatory and Development Authority allows investments in securitized debt instruments of up to 5% of the total fund, under asset class C (fixed-income instruments).
Alternative Investment FundsUnder category I funds, only infrastructure funds are permitted to invest in listed securitized instruments, and no limits for the same are specified in the regulation. Other funds in this category—venture capital funds, small and medium-sized enterprise funds, and social venture funds—may not be invested in securitized instruments.
For category II and category III funds, no specific regulation bars these funds from investing in securitized assets. However, category II funds are permitted to invest only in the securities of unlisted companies. No such regulation exists for category III funds.

69
Insurance Funds: Insurance Regulatory Development Authority (Investment) Regulations, 2016
Table A4.1: comparative Summary of Investment Guidelines
Type of Investment Percentage of Funds
for Life InsurersPercentage of Funds for General Insurers
Percentage of Funds for ULIPs
Central government securities Minimum 25% Minimum 20% Minimum 25%Central and state government and other approved securities
Minimum 50% (including central
government securities)
Minimum 30% (including central
government securities)Approved investments Maximum 50% Maximum 70% Minimum 75%Other investments Maximum 15% Maximum 15% Maximum 15%Investments in housing Minimum 15% Minimum 15%Investments in infrastructure Minimum 15% Minimum 15%
ULIP = unit-linked investment plan.Source: Insurance Regulatory Development Authority.
Regulation 3: Approved Investments
“3.(a) No insurer shall invest or keep invested any part of its Controlled Fund, as defined under Sec. 27A/Assets as defined under Sec. 27(2) of the Act, read together with Sec27E of the Act, otherwise than in approved securities, as per Section 2(3) of Insurance Act, 1938, as amended from time to time and in any of the following approved investments, namely:
1. debentures secured by a first charge on any immovable property, plant, or equipment of any company that has paid interest in full;
2. debentures secured by a first charge on any immovable property, plant, or equipment of any company where either the book value or the market value, whichever is less, of such property, plant, or equipment is over thrice the value in the case of life insurers, and more than twice the value in the case of general insurers, of such debentures;
3. first debentures secured by a floating charge on all its assets of any company that has paid dividends on its ordinary shares;
Appendix 4Regulatory Framework Highlights

Appendix 470
4. preference shares of any company which has paid dividends on its equity shares for at least two consecutive years immediately preceding;
5. equity shares of any listed company on which not less than ten percent dividends have been paid for at least two consecutive years immediately preceding;
6. immovable property situated in India, provided that the property is free of all encumbrances;
7. loans on policies of life insurance within their surrender values issued by him or by an insurer whose business he has acquired and in respect of which business he has assumed liability;
8. fixed deposits with banks included for the time being in the Second Schedule to the Reserve Bank of India Act, 1934 (2 of 1934); and
9. such other investments as the Authority may, by notification in the Official Gazette, declare to be Approved Investments.
(b) In addition, the following investments shall be deemed as approved investments:
1. All rated debentures (including bonds) and other rated and secured debt instruments as per note appended to Regulations 4 to 9. Equity shares, preference shares, and debt instruments issued by All‑India Financial Institutions recognized as such by the Reserve Bank of India ‑ investments shall be made in terms of investment policy guidelines, benchmarks, and exposure norms and limits approved by the Board of Directors of the insurer.
2. Bonds or debentures issued by companies, rated not less than “AA” or its equivalent, and A1 or equivalent ratings for short‑term bonds, debentures, certificates of deposit, and commercial papers by a credit rating agency, registered under [Securities and Exchange Board of India (SEBI)] (Credit Rating Agencies) Regulations, 1999.
3. Subject to norms and limits approved by the Board of Directors of the insurer’s deposits (including fixed deposits as per Regulation 3[a][10]) with banks (e.g., in current account, call deposits, notice deposits, certificate of deposits, etc.) included for the time being in the Second Schedule to Reserve Bank of India Act, 1934 (2 of 1934), and deposits with primary dealers duly recognized by the Reserve Bank of India as such.
4. Collaterized Borrowing and Lending Obligations (CBLO) created by the Clearing Corporation of India and recognized by the Reserve Bank of India, and exposure to Gilt, G‑Sec, and liquid mutual fund forming part of approved investments as per Mutual Fund Guidelines issued under these regulations, and money market instruments or investments.
5. Asset‑backed securities with underlying housing loans or having infrastructure assets as underlying, as defined under “infrastructure facility” in Regulation 2(h) as amended from time to time.
6. Commercial paper issued by All‑India Financial Institutions recognized as such by the Reserve Bank of India, [and] having a credit rating of “A1” from a credit rating agency registered under SEBI (Credit Rating Agencies) Regulations, 1999.
7. Money market instruments as defined in Regulation 2(j) of this Regulation, subject to provisions of approved investments.”

Appendix 4 71
Regulation 5: Regulation of Investments—Life Insurer“5. Without prejudice to Sections 10(2AA), 27 or 27A of the Act and any provisions of these
Regulations, every insurer carrying on the business of life insurance, shall invest and at all times keep invested its Investment Assets as defined in Regulation 4 (a) (other than funds relating to Pension & General Annuity and Group Business and unit reserves of all categories of Unit Linked Business) in the following manner:”
Table A4.2: Insurance regulatory and Development Authority regulations—Life Insurance Business in India
Type of InvestmentPercentage to Funds as under Regulation 4(a)
(i) Central government securities Not less than 25%
(ii) Central government securities, state government securities, or other approved securities
Not less than 50%(including central
government securities)
(iii) Approved investments as specified in Regulation 3(a) and 3(b), and other investments specified in section 27A(2) and schedule I of these regulations (all taken together), subject to exposure and prudential norms specified in Regulation 9
(iv) Other investments specified in section 27A(2), subject to exposure and prudential norms specified in Regulation 9
Not exceeding 50%
Not exceeding15%
(v) Investment in housing and infrastructure by way of subscription or purchase of:
A. Investment in housing
a. Bonds or debentures of the [Housing and Urban Development Corporation (HUDCO)] and National Housing Bank;
b. Bonds or debentures of housing finance companies either duly accredited by the National Housing Bank, for house‑building activities, or duly guaranteed by government, or carrying current rating of not less than “AA” by a credit rating agency registered under Securities and Exchange Board of India (SEBI) (Credit Rating Agencies) Regulations, 1999;
c. Asset‑backed securities with underlying housing loans, satisfying the norms specified in the guidelines issued under these regulations from time to time.
B. Investment in infrastructure
(Explanation: Subscription or purchase of bonds or debentures, equity, and asset‑backed securities with underlying infrastructure assets would qualify for the purpose of this requirement).
“Infrastructure facility” shall have the meaning given in Regulation 2(h) as amended from time to time.
Note: Investments made under category (i) and (ii) above may be regarded as investments in housing and infrastructure, provided that the respective governments issue such a security specifically to meet the needs of any of the sectors specified as “infrastructure facility.”
Total investment in housing and infrastructure
(investment in categories (i), (ii), (iii) and (iv)
above) taken together shall not be less than 15% of the fund under
Regulation 4(a)
Source: Insurance Regulatory Development Authority (Investment) Regulations, 2016.

Appendix 472
Regulation 8: Regulation of Investments—General Insurer Including an Insurer Carrying on Business of Re-insurance or Health Insurance“8. Without prejudice to Sections 10(2AA), 27, or 27B of the Act and any provisions of these
regulations, an insurer carrying on the business of general insurance including an insurer carrying on business of re‑insurance or health insurance shall invest and at all times keep invested its investment assets in the manner set out below:”
Table A4.3: Insurance regulatory and Development Authority regulations—General Insurance Business in India
Type of InvestmentPercentage of
Investment Assets
(i) Central government securities Not less than 20%
(ii) Central government securities, state government securities or other approved securities
Not less than 30%(including (i) above)
(iii) Approved investments as specified in Regulation 3(a), (b) and other investments as specified in Section 27A(2) and Schedule II to these Regulations, (all taken together) subject to exposure or prudential norms as specified in Regulation 9
(iv) Other investments as specified in Section 27A(2), subject to exposure or prudential norms as specified in Regulation 9
Not exceeding 70%
Not more than 15%
(v) [Investment in] housing and loans to state government for housing and firefighting equipment, by way of subscription or purchase of:
A. Investments in housing
a. Bonds or debentures issued by the Housing and Urban Development Corporation (HUDCO) and the National Housing Bank;
b. Bonds or debentures of housing finance companies either duly accredited by the National Housing Bank, for house‑building activities, or duly guaranteed by the government, or carrying current rating of not less than “AA” by a credit rating agency registered under Securities and Exchange Board of India (SEBI) (Credit Rating Agencies) Regulations, 1999; or
c. Asset‑backed securities with underlying housing loans, satisfying the norms specified in the guidelines issued under these regulations from time to time.
B. Investment in infrastructure
(Explanation: Subscription or purchase of bonds or debentures, equity, and asset‑backed securities with underlying infrastructure assets would qualify for the purpose of this requirement).
“Infrastructure facility” shall have the meaning given in Regulation 2(h) as amended from time to time.
Note: Investments made under categories (i) and (ii) above may be considered as investments in housing or infrastructure, as the case may be, provided the respective governments issue such a security specifically to meet the needs of any of the sectors specified as “infrastructure facility.”
Total investment in housing and infrastructure
(investment in categories (i), (ii), (iii) and (iv)
above) taken together shall not be less than 15% of the investment assets.
Source: Insurance Regulatory Development Authority (Investments) Regulations, 2016.

Appendix 4 73
Regulation 9: Exposure or Prudential Norms“9. The maximum exposure limit for a single “investee” company (equity, debt, and other
investments taken together) from all investment assets under point (A.1.a, A.1.b, A.1.c all taken together), or (A.2), (A.3) and (A.4) mentioned above, shall not exceed the lower of the following:
(i) an amount of 10% of investment assets as under Regulation 2(i)(1), Regulation 2(i)(2) excluding fair‑value change of investment assets under Regulation 4(a), 4(b) and Regulation 2(i);
(ii) an aggregate amount calculated under points (a) and (b) of the following table.
Table A4.4: Exposure Norms for Insurance companies
Type of Investment(1)
Limit for “Investee” Company(2)
Limit for the Entire Group of the Investee
Company(3)
Limit for Industry Sector to Which Investee Company Belongs
(4)a. Investment in (i) equity,(ii) preference shares,(iii) convertible
debentures
10%* of outstanding equity shares (face value) and preference shares and convertible debentures
or
10% of the amount under point A.1.(a) or A.1.(b) or A.1.(c) (segregated fund) above considered separately in the case of Life insurers / amount under A.2 or A.3 or A.4 in the case of general insurer including an insurer carrying on business of reinsurance or health insurance
whichever is lower
Not more than 15% of the amount under point A.1.(a) or A.1.(b) or A.1.(c) or A.2 or A.3 or A.4
Exposure to investments made in companies belonging to promoter group shall be made as per point 7 under notes to Regulation 9
Investment by the insurer in any industrial sector should not exceed 15% of the amount under point A.1.(a) or A.1.(b) or A.1.(c) or A.2 or A.3 or A.4
Note: Industrial sector shall be classified in the lines of National Industrial Classification (All Economic Activities) ‑ 2008 [NIC] for all sectors, except the infrastructure sector. Exposure shall be calculated at division level from A to R. For financial and insurance activities, sector exposure shall be at section level.
Exposure to “infrastructure” investments are subject to Note: 1, 2, 3, and 4 mentioned below
b. Investment in debt or loans and any other permitted investments as per Act or Regulation other than item “a” above.
10%* of the paid‑up share capital, free reserves (excluding revaluation reserve), and debentures or bonds of the “investee” company
or
10% of the amount under point A.1.(a) or A.1.(b) or A.1.(c) (segregated fund) above considered separately in the case of life insurers / amount under A.2 or A.3 or A.4 in the case of general insurer / reinsurer/ health insurer
whichever is lower.
* In the case of insurers having investment assets within the meaning of Regulation 2(i)(1) and Regulation 2(i)(2) of the undermentioned size, the (*) marked limit in the above table for investment in equity, preference shares, convertible debentures, debt, loans, or any other permitted investment under the regulations, shall stand substituted as under:
continued on next page

Appendix 474
Investment AssetsLimit for “Investee” Company
Equity DebtRs2,500 trillion or more 15% of outstanding equity shares
(face value) and preference shares and convertible debentures
15% of paid‑up share capital, free reserves (excluding revaluation reserve) and debentures or bonds
Rs500 trillion but less than Rs2,500 trillion
12% of outstanding equity shares (face value) and preference shares and convertible debentures
12% of paid‑up share capital, free reserves (excluding revaluation reserve), and debentures or bonds
Less than Rs500 trillion 10% of outstanding equity shares (face value) and preference shares and convertible debentures
10% of paid‑up share capital, free reserves (excluding revaluation reserve), and debentures or bonds
Source: Insurance Regulatory Development Authority.
Note:1. Industry sector norms shall not apply to investments made in the “infrastructure facility”
sector as defined under Regulation 2(h) of this regulation as amended from time to time. [National Industrial Classification (NIC)] shall not apply to investments made in “infrastructure facility.”
2. Investments in Infrastructure Debt Fund (IDF) backed by central government as approved by the authority, on a case‑to‑case basis, shall be reckoned for investments in infrastructure.
3. Exposure to a public limited “infrastructure investee company” will be:
i. 20% of outstanding equity shares (face value) in case of equity (or) ii. 20% of outstanding equity plus free reserves (excluding revaluation reserve) plus
debentures or bonds taken together, in the case of debt (or) iii. amount under Regulation 9(B)(i), whichever is lower. iv. The 20% mentioned above, can be further increased by an additional 5%, in case of
debt instruments alone, with the prior approval of [the] Board of Insurer.v. The outstanding tenure of debt instruments, beyond the exposure prescribed in the
above table in this Regulation, in an “infrastructure investee company,” should not be less than 5 years at the time of investment.
vi. In case of equity investment, dividend track record as per these regulations, in the case of primary issuance of a wholly owned subsidiary of a Corporate or PSU shall apply to the holding company.
vii. All investments made in an “infrastructure investee company” shall be subject to group or promoter group exposure norms.
4. An insurer can, at the time of investing, subject to group or promoter group exposure norms, invest a maximum of 20% of the project cost (as decided by a competent body) of a public limited special‑purpose vehicle (SPV) engaged in infrastructure sector (or) amount under Regulation 10(B)(i), whichever is lower, as part of approved investments provided that:
i. such investment is in debt;ii. the parent company guarantees the entire debt extended and the interest
payment of SPV;
Table A4.4 continued

Appendix 4 75
iii. the principal or interest, if in default and if not paid within 90 days of the due date, such debt shall be classified under other investments;
iv. the latest instrument of the parent company or company (ies) has (have) a rating of not less than “AA”;
v. such guarantee of the parent company or company (ies) should not exceed 20% of the net worth of the parent company (ies) including the given existing guarantees, if any, given; [and]
vi. the net worth of the parent company or company (ies), if unlisted, shall not be less than Rs5 trillion, or where the parent company or company (ies) is listed on stock exchanges having nationwide terminals, the net worth shall not be less than Rs2.5 trillion.
[The] investment committee should at least, on a half‑yearly periodicity, evaluate the risk of such investments and take necessary corrective actions where the parent company (ies) is floating more than one SPV.
5. Investment in securitized assets such as [Mortgaged Backed Securities (MBS) or Asset‑Backed Securities (ABS) or Security receipts (SR)] both under approved and other investment categories, shall not exceed 10% of investment assets in [the] case of life companies and 5% of investment asset in the case of general companies. Approved investment in MBSs or ABSs with underlying housing or infrastructure assets shall not exceed 10% of investment assets in the case of life companies, and not more than 5% of investment assets in the case of general companies. Any MBSs or ABSs with underlying housing or infrastructure assets, if downgraded below “AAA” or equivalent, shall be reclassified as other investments.
6. Investment property within the meaning of Accounting Standards, and covered under Regulation 3(a)(6) shall not exceed, at the time of investment, 5% of (a) investment assets in the case of a general insurer; and (b) 5% of investment assets of life funds in the case of life insurer. Immovable property, held as “investment property” shall not be for “self‑use.” Immovable property, for self‑use, shall be purchased only out of shareholders funds, and shall comply with circular or guidelines issued.
7. Subject to [the] exposure limits mentioned in the table above [Table A4.4], an insurer shall not have investments of more than 5% in aggregate of its investment assets in all companies belonging to the promoters’ group. Investment made in all companies belonging to the promoters’ group shall not be made by way of private placement or in unlisted instruments (equity, debt, certificates of deposit, and fixed deposits held in a scheduled commercial bank), except for companies formed by insurers under Note 12 to Regulation 9.
8. The exposure limit for financial and insurance activities (as per section K of NIC classification – 2008, as amended from time to time) shall stand at 25% of investment assets for all insurers. Investment in housing finance companies and infrastructure finance companies (except investment in bonds or debentures of HUDCO, NHB and only bonds issued by housing finance companies having a rating of not less than AAA, and investment in debt, equity in dedicated infrastructure financing entities forming part of the infrastructure sector) shall form part of exposure to financial and insurance activities (as per Section K of NIC classification – 2008).

Appendix 476
9. Where an investment is partly in paid‑up shares, the uncalled liability on such shares shall be added to the amount invested for the purpose of computing exposure norms.
10. Notwithstanding anything contained in Regulation 9(B), where new shares are issued to the existing shareholders by a company, the existing shares of which are covered by Regulation 3(a)(5) and the insurer is already a shareholder, the insurer may subscribe to such new shares, provided that the proportion of new shares subscribed by him does not exceed the proportion which the paid‑up amount on the shares held by him immediately before such subscription bears to the total paid‑up capital of the company at the time of such subscription.
11. Investment in fixed deposit and certificate of deposit of a scheduled bank, in case of life insurers, would be deemed as exposure to financial and insurance activities (as per Section K of NIC classification – 2008). No investment in deposits including [fixed deposits (FDs)] and certificates of deposit in financial institutions falling under promoter group shall be made. Investment in FDs shall not exceed either 3% of controlled fund or not more than 5% of respective fund size [Pension and General Annuity Fund and unit linked fund(s) at SFIN level], whichever is lower, in the case of life insurers and 15% of investment assets as per Regulation 2(i)(2) in the case of general insurers, including insurers carrying on business of re‑insurance or health insurance.
Note: Fixed deposits are permitted under this Regulation kept as ASBA (application supported by blocked amount) deposit, including FDs with banks falling under the promoter group of the insurer, or otherwise, shall be excluded in computation of limits mentioned above. FDs of banks under promoter group, earmarked for complying with ASBA requirement, will be part of exposure to promoter group.
12. An insurer shall not, out of the controlled fund or assets, invest or keep invested in the shares or debentures of any one company more than the exposure prescribed in Regulation 9 above, provided that nothing in this regulation shall apply to any investment made with the previous approval of the board of the authority by an insurer, being a company with a view to forming a subsidiary company carrying on insurance or reinsurance business.
13. The investee company debt exposure, in housing finance companies, rated not less than AA+, shall be up to 20% of paid‑up share capital, free reserves (excluding revaluation reserve) and debentures or bonds (including CPs) or amount under Reulations 9(B)(i), whichever is lower. The 2% limit mentioned herein can be further increased by an additional 5% with the prior approval of [the] board of insurer. All exposure norms applicable to group, promoter group shall be applicable to all investments made in a housing finance company.”

Appendix 4 77
Pension Funds: Pension Funds Regulatory and Development Authority Regulations for the National Pension Scheme, 2015
Table A4.5: National Pension System Models
Model Description Investment ChoicesAll-citizens model
Indian citizens from 18 to 60 years of age, including nonresidents, are eligible
Two approaches to investment:(i) Active choice: Individual funds (asset class E,
asset class C, and asset class G ) Subscriber will have the option to decide as to how his or her National Pension Scheme (NPS) wealth is to be invested in the following three asset classes:(a) Asset class E: Investments in predominantly
equity instruments (b) Asset class C: Investments in fixed income
instruments, other than government securities
(c) Asset class G: Investments in government securities
(ii) Auto choice (Lifecycle fund): The fraction of funds invested across the three asset classes will be determined by a predefined portfolio.
Government sector model
For employees of central government, state governments, central and state autonomous bodies
Funds managed by pension fund managers (PFMs) appointed by the Pension Funds Regulatory and Development Authority (PFRDA). Currently, the PFMs invest funds on the basis of investment guidelines set by PFRDA.
Corporate model
For employees of private and public limited companies, cooperatives, partnership firms, and public sector firms
Corporates have the flexibility to provide investment scheme preference (pension funds or pension funds) and investment choice, either at subscriber level or centrally at corporate level for all its subscribers
For asset allocation, either the corporate or the subscriber can choose between an active choice and an auto choice, similar to the “all-citizens” model
Source: Pension Fund Regulatory and Development Authority.

Appendix 478
Table A4.6: Investment Guidelines for the All-citizens Model
Asset Class InstrumentG Government securities and related investments
(a) Central government securities(b) Securities guaranteed by the central or state governments (subject to maximum
10% of the total portfolio of government securities)(c) Units of mutual funds investing only in government securities (subject to
maximum 5% of the total portfolio of government securities)C Debt instruments and related investments
(a) Listed debt securities issued by corporates, banks, and public financial institutions
(b) Basel III tier 1 bonds issued by scheduled commercial banks (SCBs) under Reserve Bank of India (RBI) guidelines (subject to maximum of 2% of the total fund and an exposure limit of 20% for each bank)
(c) Term deposit receipts with a maturity of more than 1 year issued by SCBs(d) Rupee bonds of at least 3 years’ maturity issued by the International Bank for
Reconstruction and Development, the International Finance Corporation, and the Asian Development Bank
(e) Units of debt mutual funds regulated by the Securities and Exchange Board of India (SEBI)
(f) Listed debt securities with minimum rating of “AA” or equivalent of companies in development or operation and maintenance of infrastructure, or in development, construction, or financing of low-cost housing
(g) Securities issued by Indian Railways and its subsidiaries
Miscellaneous investments (up to 5% of the fund)(a) Mortgage-backed securities(b) Units of real estate investment trusts (c) Asset-backed securities(d) Units of infrastructure investment trustsThese instruments must have a minimum rating of “AA” or equivalent from at least
two rating agenciesE Equities and related investments
(a) Equity shares of corporates listed on the Bombay Stock Exchange (BSE) or the National Stock Exchange (NSE), having:(i) market capitalization of not less than Rs50 trillion; and(ii) Derivatives with underlying shares being traded on either the BSE or the
NSE(b) Unit of mutual funds regulated by SEBI, with at least 65% of their investment in
equity shares of corporates listed on the BSE or the NSE(c) Exchange-traded funds (ETFs) that replicate the portfolio of either the BSE
Sensex index or the NSE Nifty 50 index(d) ETFs issued by SEBI specifically for disinvestment of shareholding of the
Government of India in corporates(e) Exchange-traded derivatives with the sole purpose of hedging (subject to a
maximum of 5%) E/C/G Money market instruments (not exceeding a limit of 5% of the scheme corpus on
a temperate basis only)(a) Money market instruments: commercial papers and certificates of deposits (b) Units of money market mutual funds regulated by SEBI(c) Term deposit receipts of up to 1 year duration issued by SCBs
Source: Pension Fund Regulatory and Development Authority.

Appendix 4 79
Table A4.7: Investment Guidelines for the Government Sector and the corporate Model
Instrument Percentage of FundsGovernment securities and related investments(i) Central government securities(ii) Securities guaranteed by the central or state governments (subject to
maximum 10% of the total portfolio of the government securities)(iii) Units of mutual funds investing only in government securities (subject
to maximum 5% of the total portfolio of the government securities)
Maximum 50%
Debt instruments and related investments(i) Listed debt securities issued by corporates, banks, and public financial
institutions(ii) Basel tier 1 bonds issued by scheduled commercial banks (SCBs)
under Reserve Bank of India (RBI) guidelines (subject to maximum of 2% of the total fund)
(iii) Term deposit receipts issued by SCBs(iv) Rupee bonds issued by the International Bank for Reconstruction and
Development, the International Finance Corporation, and the Asian Development Bank
(v) Units of debt mutual funds regulated by the Securities and Exchange Board of India (SEBI)
(vi) Listed debt securities with a minimum rating of “AA” or equivalent of companies in development or operation and maintenance of infrastructure, or in development, construction, or finance of low-cost housing
(vii) Securities issued by Indian Railways and its subsidiaries
Maximum 45%
Short-term debt instruments and related investments(i) Money market instruments – commercial papers and certificates of
deposits (ii) Units of money market mutual funds regulated by SEBI(iii) Term deposit receipts of up to one year issued by SCBs
Maximum 5%
Equities and related investments(i) Equity shares of corporates listed on the Bombay Stock Exchange
(BSE) or the National Stock Exchange (NSE)(ii) Unit of mutual funds regulated by SEBI, which have minimum 65% of
their investment in equity shares of corporates listed on the BSE or the NSE
(iii) Exchange-traded funds (ETFs) that replicate the portfolio of either BSE Sensex or NSE Nifty 50
(iv) ETFs issued by SEBI specifically for disinvestment of shareholding of the Government of India in corporates
(v) Exchange-traded derivatives with the sole purpose of hedging (subject to maximum of 5%)
Maximum 15%
Asset-backed, trust structured, and miscellaneous investments(i) Mortgage-backed securities(ii) Units of real estate investment trusts(iii) Asset-backed securities(iv) Units of infrastructure investment trustsThese instruments are mandated to have a minimum rating of “AA” or equivalent from at least two rating agencies.
Maximum 5%
Source: Pension Fund Regulatory and Development Authority.

Appendix 480
Mutual Funds: Securities and Exchange Board of India (Mutual Funds) (Amendment) Regulations
Chapter VI: Investment Objectives and Valuation Policies“43.(1) Subject to other provisions of these regulations, a mutual fund may invest moneys [sic]
collected under any of its schemes only in–
(a) securities;(b) money market instruments;(c) privately placed debentures;(d) securitized debt instruments, which are either asset‑ or mortgage‑backed securities;(e) gold or gold‑related instruments [; or](f) real estate assets as defined in Clause (a) of Regulation 49A [;or](g) infrastructure debt instrument and assets as specified in Clause (1) of Regulation
49L
(2) Any investment made under Sub‑regulation (1) will be in accordance with the investment objective of the relevant mutual fund scheme.
(3) Moneys [sic] collected under any money market scheme of a mutual fund shall be invested only in money market instruments.
(4) Moneys [sic] collected under any gold exchange traded fund scheme will be invested only in gold or gold‑related instruments, in accordance with Sub‑regulation (5) of Regulation 44.
(5) Moneys [sic] collected under a real estate mutual fund scheme will be invested in accordance with Regulation 49E.”
Chapter VI-(B): Infrastructure Debt Fund Schemes
Definitions
“49L. For the purposes of this Chapter, unless the context requires otherwise:
(1) “Infrastructure debt fund scheme” means a mutual fund scheme that invests primarily (minimum 90% of scheme assets) in debt securities or securitized debt instruments of infrastructure companies, infrastructure capital companies, infrastructure projects, or special‑purpose vehicles which are created for the purpose of facilitating or promoting investment in infrastructure, and other permissible assets in accordance with these regulations or bank loans in respect of completed and revenue‑generating projects of infrastructure companies or projects or special‑purpose vehicles.
(2) “Infrastructure” includes sectors as specified by guidelines issued by the board or as notified by the Ministry of Finance from time to time.

Appendix 4 81
(3) “Strategic investor” means:
(i) an infrastructure finance company registered with the Reserve Bank of India [RBI] as a nonbanking financial company;
(ii) a scheduled commercial bank (SCB);(iii) an international multilateral financial institution;(iv) a systemically important nonbanking financial company registered with [the RBI];
or(v) foreign institutional investors registered with the board, subject to their applicable
investment limits, which are long‑term investors in terms of the norms specified by SEBI.”
Permissible Investments
“49P. (1) Every infrastructure debt fund scheme shall invest at least 90% of the net assets of the scheme in debt securities or securitized debt instruments of infrastructure companies or projects or special‑purpose vehicles whic are created for the purpose of facilitating or promoting investment in infrastructure or bank loans in respect of completed and revenue‑generating projects of infrastructure companies or special‑purpose vehicles [:]
Provided that the funds received on account of repayment of principal, whether by way of prepayment or otherwise, with respect to the underlying assets of the scheme, shall be invested as specified in this sub‑regulation:
Provided further that if the investments specified in this sub‑regulation are not available, such funds may be invested in bonds of public financial institutions and infrastructure finance companies.
(2) Subject to Sub‑regulation (1), every infrastructure debt fund scheme may invest the balance amount in equity shares, convertibles, including mezzanine financing instruments of companies engaged in infrastructure, infrastructure development projects, whether listed on a recognized stock exchange in India or not; or money market instruments and bank deposits.
(3) The investment restrictions will be applicable on the lifecycle of the infrastructure debt fund scheme, and shall be reckoned with reference to the total amount raised by the infrastructure debt fund scheme.
(4) No mutual fund shall, under all its infrastructure debt fund schemes, invest more than 30% of its net assets in the debt securities or assets of any single infrastructure company or project or special‑purpose vehicle that are created for the purpose of facilitating or promoting investment in infrastructure or bank loans in respect of completed and revenue‑generating projects of any single infrastructure company or project or special‑purpose vehicle.
(5) An infrastructure debt scheme shall not invest more than 30% of the net asset of the scheme in debt instruments or assets of any single infrastructure company or project or special‑purpose vehicle that are created for the purpose of facilitating or promoting investment in infrastructure or bank loans in respect of completed and revenue generating projects of any single infrastructure company or project or special‑purpose vehicle.

Appendix 482
(5A) The overall investment by an infrastructure debt fund scheme in debt instruments or assets of infrastructure companies or projects or special‑purpose vehicles, which are created for the purpose of facilitating or promoting investment in infrastructure or bank loans in respect of completed and revenue‑generating projects of infrastructure companies or projects or special‑purpose vehicles, which are rated below investment grade or are unrated, shall not exceed 30% of the net assets of the scheme:
Provided that the overall investment limit may increase up to 50% of the net asset of the scheme with the prior approval of the trustees and the board of the asset management company.
(6) No infrastructure debt fund scheme shall invest in –
(i) any unlisted security of the sponsor or its associate or group company;(ii) any listed security issued by way of preferential allotment by the sponsor or its
associate or group company;(iii) any listed security of the sponsor or its associate or group company or bank
loan in respect of completed and revenue‑generating projects of infrastructure companies or special‑purpose vehicles of the sponsor or its associate or group companies, in excess of 25% of the net assets of the scheme, subject to approval of [the] trustees and full disclosures to investors of the investments made within the aforesaid limits; or
(iv) any asset or securities owned by the sponsor or asset management company or their associates in excess of 30% of the net asset of the scheme, provided that:(a) such investment is in assets or securities not below investment grade;(b) the sponsor or its associates retains at least 30% of the assets or securities
in which the investment is made by the scheme till the assets or securities are held in the scheme’s portfolio; and
(c) approval for such investment is granted by the trustees and full disclosures are made to the investors regarding such investment.”

83
Appendix 5Accounting Framework for Securitization
Accounting frameworks in India are set out by the Institute of Chartered Accountants of India (ICAI) and adopted by the central government through the Companies Act (1956)
and the Companies Act (2013).
At present, companies in India follow the accounting standards set out by the ICAI, based on India’s Generally Accepted Accounting Principles (GAAP). The Ministry of Corporate Affairs, through a notification in February 2015, issued the Companies (Indian Accounting Standards) Rules, 2015, which lays down a roadmap for companies, other than insurance companies, banks, and nonbanking financial companies (NBFCs), for the implementation of Indian Accounting Standards (IND AS) converged with the International Financial Reporting Standards (IFRSs). However, banks, NBFCs, and insurance companies that are subsidiaries, joint ventures, or associates of a parent company covered by the notification, will have to report IND AS-adjusted numbers for the parent company to prepare an IND AS-compliant consolidated account.
Table A5.1: road Map for Implementation of Indian Accounting Standards
Item Phase I Phase IIVoluntary adoption
Year of adoption 2016–2017 2017–2018 2015–2016 onward
Covered CompaniesListed companies All companies with net
worth greater than Rs5 trillion
All companies listed or in the process of being listed All companies can
voluntarily adopt Indian Accounting Standards
Unlisted companies All companies with net worth greater than Rs5 trillion
All companies with net worth greater than Rs25 trillion
Group companies Holding, subsidiary, joint venture, or associate companies of above companies
Source: Institute of Chartered Accountants of India.
In accounting for transactions in securitization, two baseline rules are set by the accounting standards:
(i) conditions under which consolidation of financial statements of the special-purpose entity (SPE) or trust which holds the assets and the originator is required; and

Appendix 584
(ii) sale of assets for accounting purposes, leading to de-recognition of the asset from the balance sheet of the originator.
Accounting Standard 30, set by ICAI for securitization transactions, was issued in 2007 and came into force in 2011. Prior to Accounting Standard 30, there were no clear guidelines on how securitization transactions were to be accounted for, except for a guidance note issued by ICAI in 2003. Post 2016, securitization accounting guidelines of IND AS 39 converged with IFRS IAS 39 will be applied, based on the road map laid out by the Ministry of Corporate Affairs.
Table A5.2: comparison of Accounting Standards for Securitization
Item
Institute of Chartered Accountants of India (ICAI) guidance note
Accounting Standard 30
Indian Accounting Standard 39
Implementation 2003–2011 2011 onward 2016 onward, based on the road map laid out by the Ministry of Corporate Affairs (MCA)
Principle Surrender of control approach, similar to Financial Accounting Standards Board Accounting Standards Codification (ASC) 860
No continuing involvement of the originator, similar to International Financial Reporting Standard (IFRS) International Accounting Standard (IAS) 39
No continuing involvement of the originator, similar to IFRS IAS 39
ProcedureConsolidation Based on the principle
of control of majority voting rights
Based on the principle of control of majority voting rights
Based on the principle of control of majority voting rights, and the principle of variable rights
De-recognition An asset is de-recognized only if a true sale at lawa occurs and the originator loses control of the asset
An asset is de-recognized if substantial risk and reward associated with the asset are transferred by the originator, and the originator has no control over the asset
An asset is de-recognized if substantial risk and reward associated with the asset are transferred by the originator, and the originator has no control over the asset
a Refer to Appendix 5D.Source: Institute of Chartered Accountants of India.
A. Accounting Standard
Consolidation of Financial StatementsThe accounting standards for consolidation are laid out in Accounting Standard 21 (Consolidated Financial Statements), and dictate that if an entity (the parent company)

Appendix 5 85
holds more than half of the voting shares of an enterprise, or controls the composition of the board of directors or the governing body, it controls the enterprise (the subsidiary). Such a parent firm must consolidate the financial statements of all its subsidiaries with that of the parent.
Thus, for a firm to achieve de-recognition of securitized assets and realize the true benefits of securitization, it is imperative that the trust to whom these assets are sold to is independent of the control the firm.
De-recognition of Securitized AssetsFor the de-recognition of assets the principles are applied to an asset or a group of assets entirely, except when:
(i) part of the asset monetized comprises specifically identifiable cash flows, such as interest or principal; or
(ii) part of the asset monetized comprises a full proportionate share of cash flows.
For a firm to de-recognize a securitized asset, a transfer of the asset should take place, following which it must evaluate the extent to which it retains the risk and reward of ownership of the asset, based on comparison of the exposure of the firm to the variability in the returns and the timing of the returns of the asset pre- and post-securitization.
Figure A5: Accounting Framework for Securitization
Consolidate all subsidiaries (including any SPVs)
Has the originator transferred the rights to receivethe cash flows from the transferred asset?
Yes De-recognizethe asset
De-recognizethe asset
De-recognizethe asset
Continue torecognize the asset
Continue torecognize the asset
Yes
Yes
Yes
Yes
Yes
No
NoNo
No
No
Has the originator assumed any obligation to pay the cash flowsfrom the transferred assets
Has the orginator transferred substantially all the risksand rewards of the assets
Has the originator retained substantially all the risksand rewards of the asset?
Has the entity retained control of the asset?
Continue to recognize the asset to the extentof the involvement of the originator
SPV = special-purpose vehicle.Source: CRISIL.

Appendix 586
Accounting for Servicing of AssetIn a securitization transaction, it is common to have a servicing contract under which the servicer (in India it is generally the originator) undertakes to service the securitized assets over the term of the securitization transaction in lieu of a fee. In such a case, the originator must recognize servicing the asset or liability arising out of the servicing contract. If the fee received adequately compensates the originator for the servicing, a servicing asset should be recognized upfront. If not, a servicing liability is assumed by the originator upfront. However, Accounting Standard 30 does not provide detailed guidelines on the valuation of the servicing assets or liabilities in the subsequent financial periods.
Accounting for Profit or Loss on a Securitization TransactionOnce the de-recognition criteria is met in transfer of assets, the profit or loss incurred in the transaction must be accounted for in the profit and loss statement of the originator.
However, Reserve Bank of India (RBI) guidelines issued on the Transfer of Assets through Securitization and Direct Assignment of Cash Flows dictate that the profit received from a securitization transaction by a scheduled commercial bank (SCB) or an NBFC is to be held in the accounting head “Cash profit on loan transfer transactions pending recognition” to be maintained on an individual transaction basis. The amortization of this cash profit every year will be done on the basis of a prescribed formula:
Profit to be amortized = Max {L, [(X*(Y/Z))], [(X/n)]}
where:
X = Amount of unamortized cash profit lying in the account “Cash profit on loan transfer transactions pending recognition” at the beginning of the year
Y = Amount of principal amortized during the year
Z = Amount of unamortized principal at the beginning of the year
L = Loss (marked to market losses incurred on the portfolio + specific provisions, if any, made against exposure to the particular securitization transaction + direct write-off) excluding loss incurred on credit enhancing interest only strip
n = Residual maturity of the securitization transaction
Banks should also hold capital against securitization exposures in terms of the RBI guidelines without taking into account balance in the “Cash profit on loan transfer transactions pending recognition” account.
For securitization transactions wherein a part of the asset is retained by the originating bank, such as the interest strip or the principle strip, an on-balance-sheet asset is created for the same. However, banks are mandated not to recognize unrealized gains or losses from such transactions in the profit and loss account, and instead should be held under an accounting head “Unrealized gain on loan transfer transactions.” Thus, for such assets, gain or loss can only be accounted on actual basis, not accrual basis.
Appendix 5 87
B. Indian Accounting Standards Consolidation of Financial StatementsIND AS 27 (Consolidated and Separate Financial Statements) dictates that if a special-purpose entity (SPE) is a subsidiary of the originator, or if the originator holds a variable interest in the SPE, then the consolidation of the financial statements must be done by the originator.
In variable interest, the originator may not be the majority holder of the voting rights in the SPE, but may materially control the activities of the SPE in order to obtain economic benefits.
De-recognition of Securitized AssetsIdentical to Accounting Standard 30
C. Accounting Standards for InvestorsAs securitization transaction are capital market transactions, no specific accounting guidelines exist for investors holding securitized assets.
D. Accounting Standard 30 (Financial Instruments: Recognition and Measurement)
Recognition and De-recognition
Initial Recognition
“14. An entity should recognize a financial asset or a financial liability on its balance sheet when, and only when, the entity becomes a party to the contractual provisions of the instrument. (See paragraphs 38–42 with respect to regular way purchases of financial assets).
De‑recognition of a Financial Asset
15. Before evaluating whether and to what extent de‑recognition is appropriate under paragraphs 16–22, an entity determines whether those paragraphs should be applied to a part of a financial asset (or a part of a group of similar financial assets) or a financial asset (or a group of similar financial assets) in its entirety, as follows:
(a) Paragraphs 16–22 are applied to a part of a financial asset (or a part of a group of similar financial assets) if, and only if, the part being considered for de‑recognition meets one of the following three conditions:

Appendix 588
(i) The part comprises only specifically identified cash flows from a financial asset (or a group of similar financial assets). For example, when an entity enters into an interest rate strip whereby the counterparty obtains the right to the interest cash flows, but not the principal cash flows from a debt instrument, paragraphs 16–22 are applied to the interest cash flows.
(ii) The part comprises only a fully proportionate (pro rata) share of the cash flow from a financial asset (or a group of similar financial assets). For example, when an entity enters into an arrangement whereby the counterparty obtains rights to 90% share of all cash flows of a debt instrument, paragraphs 16–22 are applied to 90% of those cash flows. If there is more than one counterparty, each counterparty is not required to have a proportionate share of the cash flows, provided that the transferring entity has a fully proportionate share.
(iii) The part comprises only a fully proportionate (pro rata) share of specifically identified cash flows from a financial asset (or a group of similar financial assets). For example, when an entity enters into an arrangement whereby the counterparty obtains the rights to 90% share of interest cash flow from a financial asset, paragraphs 16–22 are applied to 90% of that interest cash flow. If there is more than one counterparty, each counterparty is not required to have a proportionate share of the specifically identified cash flow, provided that the transferring entity has a fully proportionate share.
(b) In all other cases, paragraphs 16–22 are applied to the financial asset in its entirety (or to the group of similar financial assets in their entirety). For example, when an entity transfers (i) the rights to the first or the last 90% of cash collections from a financial asset (or a group of financial assets), or (ii) the rights to 90% of the cash flow from a group of receivables, but provides a guarantee to compensate the buyer for any credit losses up to 8% of the principal amount of the receivables, paragraphs 16–22 are applied to the financial asset (or a group of similar financial assets) in its entirety.
In paragraphs 16–26, the term “financial asset” refers to either a part of a financial asset (or a part of a group of similar financial assets) as identified in (a) above or, otherwise, a financial asset (or a group of similar financial assets) in its entirety.
16. An entity should de‑recognize a financial asset when:
(a) the contractual rights to the cash flow from the financial asset expire; or(b) it transfers the financial asset as set out in paragraphs 17 and 18, and the transfer
qualifies for de‑recognition in accordance with paragraph 19. (See paragraphs 38–42 for regular way sales of financial assets).
17. An entity transfers a financial asset if it either:
(a) transfers the contractual rights to receive the cash flows of the financial asset; or(b) retains the contractual rights to receive the cash flow of the financial asset, but
assumes a contractual obligation to pay the cash flow to one or more recipients in an arrangement that meets conditions in paragraph 18.
18. When an entity retains the contractual rights to receive cash flows of a financial asset (original asset), but assumes a contractual obligation to pay those cash flows to one or

Appendix 5 89
more entities (eventual recipients), the entity treats the transaction as a transfer of a financial asset if, and only if, all of the following three conditions are met.
(a) The entity has no obligation to pay amounts to the eventual recipients unless it collects equivalent amounts from the original asset. Short‑term advances by the entity to the eventual recipients with the right of full recovery of the amount lent plus accrued interest at market rates do not violate this condition.
(b) The entity is prohibited by the terms of the transfer contract from selling or pledging the original asset other than as security to the eventual recipients for the obligation to pay them cash flow.
(c) The entity has an obligation to remit any cash flow it collects on behalf of the eventual recipients, without material delay. In addition, the entity is not entitled to reinvest such cash flows, except for investments in cash or cash equivalents (as defined in Accounting Standard 3, Cash Flow Statements) during the short settlement period from the collection date to the date of required remittance to the eventual recipients, and interest earned on such investments is passed to the eventual recipients.
19. When an entity transfers a financial asset (see paragraph 17), it should evaluate the extent to which it retains the risk and reward of ownership of the financial asset. In this case:
(a) If the entity transfers substantially all the risk and reward of ownership of the financial asset, the entity should de‑recognize the financial asset and recognize separately as assets or liabilities any rights and obligations created or retained in the transfer.
(b) If the entity retains substantially all the risk and reward of ownership of the financial asset, the entity should continue to recognize the financial asset.
(c) If the entity neither transfers nor retains substantially all the risks and rewards of ownership of the financial asset, the entity should determine whether it has retained control of the financial asset. In this case:(i) If the entity has not retained control, it should de‑recognize the financial
asset and recognize separately as assets or liabilities any rights and obligations created or retained in the transfer.
(ii) If the entity has retained control, it should continue to recognize the financial asset to the extent of its continuing involvement in the financial asset (see paragraph 30).
20. The transfer of risk and reward (see paragraph 19) is evaluated by comparing the entity’s exposure before and after the transfer, with the variability in the amounts and timing of the net cash flow of the transferred asset. An entity has retained substantially all the risks and rewards of ownership of a financial asset if its exposure to the variability in the present value of the future net cash flow from the financial asset does not change significantly as a result of the transfer (e.g., because the entity has sold a financial asset subject to an agreement to buy it back at a fixed price or the sale price plus a lender’s return). An entity has transferred substantially all the risks and rewards of ownership of a financial asset if its exposure to such variability is no longer significant in relation to the total variability in the present value of the future net cash flow associated with the financial asset (e.g., because the entity has sold a financial asset subject only to an option to buy it back at its fair value at the time of repurchase or has transferred a fully proportionate share of the cash flows from a larger financial asset in an arrangement, such as a loan sub‑participation, that meets the conditions in paragraph 18).

Appendix 590
21. Often it will be obvious whether the entity has transferred or retained substantially all risks and rewards of ownership and there will be no need to perform any computation. In other cases, it will be necessary to compute and compare the entity’s exposure to the variability in the present value of future net cash flow before and after the transfer. The computation and comparison is made using as [sic] the discount rate an appropriate current market interest rate. All reasonably possible variability in net cash flow is considered, with greater weight being given to those outcomes that are more likely to occur.
22. Whether the entity has retained control (see paragraph 19(c)) of the transferred asset depends on the transferee’s ability to sell the asset. If the transferee has the ability to sell the asset in its entirety to an unrelated party and is able to exercise that ability unilaterally and without needing to impose additional restrictions on the transfer, the entity has not retained control. In all other cases, the entity has retained control.
23. In consolidated financial statements, paragraphs 15–22 and Appendix A paragraphs A57 ‑ A75 are applied at a consolidated level. Hence, an entity first consolidates all subsidiaries in accordance with AS 21 and then applies paragraphs 15–22 and Appendix A paragraphs A57 ‑ A75 to the resulting group.
Transfers That Qualify for De‑recognition (see paragraph 19(a) and (c)(i))
24. If an entity transfers a financial asset in a transfer that qualifies for de‑recognition in its entirety and retains the right to service the financial asset for a fee it should recognize either a servicing asset or a servicing liability for that servicing contract. If the fee to be received is not expected to compensate the entity adequately for the servicing, a servicing liability for the servicing obligation should be recognized at its fair value. If the fee to be received is expected to be more than adequate compensation for the servicing, a servicing asset should be recognized for the servicing at an amount determined on the basis of an allocation of the carrying amount of the larger financial asset in accordance with paragraph 27.
25. If, as a result of a transfer, a financial asset is de‑recognized in its entirety, but the transfer results in the entity obtaining a new financial asset or assuming a new financial liability, or a servicing liability, the entity should recognize the new financial asset, financial liability, or servicing liability at fair value.
26. On de‑recognition of a financial asset in its entirety, the difference between:
(a) the carrying amount; and(b) the sum of (i) the consideration received (including any new asset obtained less
any new liability assumed) and (ii) any cumulative gain or loss that had been recognized directly in an equity account, say, Investment Revaluation Reserve Account (see paragraph 61(b))
should be recognized in the statement of profit and loss.
27. If the transferred asset is part of a larger financial asset, (e.g., when an entity transfers interest cash flows that are part of a debt instrument, see paragraph 15(a)), and the part transferred qualifies for de‑recognition in its entirety, the previous carrying amount of the larger financial asset should be allocated between the part that continues to be recognized and the part that is de‑recognized, based on the relative fair values of those

Appendix 5 91
parts on the date of the transfer. For this purpose, a retained servicing asset should be treated as a part that continues to be recognized. The difference between:
(i) the carrying amount allocated to the part de‑recognized; and(ii) the sum of (i) the consideration received for the part de‑recognized (including
any new asset obtained less any new liability assumed), and (ii) any cumulative gain or loss allocated to it that had been recognized directly in the equity account (see paragraph 61(b))
should be recognized in the statement of profit and loss. A cumulative gain or loss that had been recognized in the equity account is allocated between the part that continues to be recognized and the part that is de‑recognized, based on the relative fair values of those parts.
28. When an entity allocates the previous carrying amount of a larger financial asset between the part that continues to be recognized and the part that is de‑recognized, the fair value of the part that continues to be recognized needs to be determined. When the entity has a history of selling parts similar to the part that continues to be recognized or other market transactions exist for such parts, recent prices of actual transactions provide the best estimate of its fair value. When there are no price quotes or recent market transactions to support the fair value of the part that continues to be recognized, the best estimate of the fair value is the difference between the fair value of the larger financial asset as a whole and the consideration received from the transferee for the part that is de‑recognized.
Transfers That Do Not Qualify for De‑recognition (see paragraph 19(b))
29. If a transfer does not result in de‑recognition because the entity has retained substantially all the risks and rewards of ownership of the transferred asset, the entity should continue to recognize the transferred asset in its entirety and should recognize a financial liability for the consideration received. In subsequent periods, the entity should recognize any income on the transferred asset and any expense incurred on the financial liability.
Continuing Involvement in Transferred Assets (see paragraph 19(c)(ii))
30. If an entity neither transfers nor retains substantially all the risk and reward of ownership of a transferred asset, but retains control of the transferred asset, the entity continues to recognize the transferred asset to the extent of its continuing involvement. The extent of the entity’s continuing involvement in the transferred asset is the extent to which it is exposed to changes in the value of the transferred asset. For example:
(a) When the entity’s continuing involvement takes the form of guaranteeing the transferred asset, the extent of the entity’s continuing involvement is the lower of (i) the carrying amount of the asset, and (ii) the maximum amount of the consideration received that the entity could be required to repay (guarantee amount).
(b) When the entity’s continuing involvement takes the form of a written or purchased option (or both) on the transferred asset, the extent of the entity’s continuing involvement is the amount of the transferred asset that the entity may repurchase. However, in case of a written put option on an asset that is measured at fair value, the extent of the entity’s continuing involvement is limited to the lower of the fair value of the transferred asset and the option exercise price (see paragraph A71).

Appendix 592
(c) When the entity’s continuing involvement takes the form of a cash‑settled option or similar provision on the transferred asset, the extent of the entity’s continuing involvement is measured in the same way as that which results from noncash settled options as set out in (b) above.
31. When an entity continues to recognize an asset to the extent of its continuing involvement, the entity also recognizes an associated liability. Despite the other measurement requirements in this Standard, the transferred asset and the associated liability are measured on a basis that reflects the rights and obligations that the entity has retained. The associated liability is measured in such a way that the net carrying amount of the transferred asset and the associated liability is
(a) the amortized cost of the rights and obligations retained by the entity, if the transferred asset is measured at amortized cost; or
(b) equal to the fair value of the rights and obligations retained by the entity when measured on a stand‑alone basis, if the transferred asset is measured at fair value.
32. The entity should continue to recognize any income arising on the transferred asset to the extent of its continuing involvement, and should recognize any expense incurred on the associated liability.
33. For the purpose of subsequent measurement, recognized changes in the fair value of the transferred asset and the associated liability are accounted for consistently with each other in accordance with paragraph 61, and should not be offset.
34. If an entity continues to be involved only in a part of a financial asset (e.g., when an entity retains an option to repurchase part of a transferred asset, or retains a residual interest that does not result in the retention of substantially all the risks and rewards of ownership and the entity retains control), the entity allocates the previous carrying amount of the financial asset between the part it continues to recognize under continuing involvement, and the part it no longer recognizes on the basis of the relative fair values of those parts on the date of the transfer. For this purpose, the requirements of paragraph 28 apply. The difference between:
(a) the carrying amount allocated to the part that is no longer recognized; and(b) the sum of (i) the consideration received for the part no longer recognized and
(ii) any cumulative gain or loss allocated to it that had been recognized directly in the appropriate equity account (see paragraph 61(b))
should be recognized in the statement of profit and loss. A cumulative gain or loss that was recognized in the equity account is allocated between the part that continues to be recognized and the part that is no longer recognized on the basis of the relative fair values of those parts.
35. If the transferred asset is measured at amortized cost, the option in this Standard to designate a financial liability at fair value through profit or loss is not applicable to the associated liability.

Appendix 5 93
All Transfers
36. If a transferred asset continues to be recognized, the asset and the associated liability should not be offset. Similarly, the entity should not offset any income arising from the transferred asset with any expense incurred on the associated liability (see Accounting Standard 31, Financial Instruments: Presentation, paragraph 72).
37. If a transferor provides noncash collateral (such as debt or equity instruments) to the transferee, the accounting for the collateral by the transferor and the transferee depends on whether the transferee has the right to sell or re‑pledge the collateral, and on whether the transferor has defaulted. The transferor and transferee should account for the collateral as follows:
(a) If the transferee has the right by contract or custom to sell or re‑pledge the collateral, then the transferor should reclassify that asset in its balance sheet (e.g., as a loaned asset, pledged equity instrument, or repurchase receivable) separately from other assets.
(b) If the transferee sells collateral pledged to it, it should recognize the proceeds from the sale and a liability measured at fair value for its obligation to return the collateral.
(c) If the transferor defaults under the terms of the contract, and is no longer entitled to redeem the collateral, it should de‑recognize the collateral, and the transferee should recognize the collateral as its asset initially measured at fair value or, if it has already sold the collateral, de‑recognize its obligation to return the collateral.”

94
Table A6.1: Interest rate and credit Enhancement Assumptions
Interest Rate
Bank base rate 9.30% AAA yield 8.30% Spread 0.75%
Treasury interest rate 7.00% Average pool yield 11.19%
Excess interest spread 2.14%
External Credit Enhancement
Guarantee 12% Corpus (Rs billion) 3.03 Recovery rate 60%Cash collateral
Number of installments 0.25
Cash collateral (Rs billion) 0.32 Guarantee fee 1%
Source: CRISIL.
Table A6.2: Amortization Profile Assumptions (Rs billion)
YearItem 1 2 3 4 5 6 7 8 9 10 11Principal
repayments 1.27 2.07 2.36 2.79 3.28 3.69 3.38 3.19 2.51 1.45 0.49Interest
payments 2.17 1.99 1.77 1.52 1.22 0.89 0.58 0.30 0.07 0.00 0.00Total pass-
through certificate payments 3.44 4.05 4.13 4.31 4.50 4.58 3.96 3.49 2.58 1.45 0.49
Source: CRISIL.
The cumulative default rate for a specified period is the number of defaults among rated entities expressed as a percentage of the total number of rated entities whose ratings were outstanding throughout the period. Cumulative default rate can be calculated at each rating level, and over several periods.
Appendix 6Detailed Assumptions for Value Analysis

Appendix 6 95
For instance, a 5-year cumulative default rate for 2006–2010 can be calculated as the ratio of total defaults at the end of 2010 to the total number of instruments rated during the period. Only those instruments whose ratings are outstanding during the entire period are included in the calculation (referred to as the static pool). For example, if an instrument had an outstanding rating on 1 January 2006, but it was withdrawn in 2008, the instrument will not be included in the calculation. In the case of the “AA” category default rate for 2006–2010, the static pool is chosen considering the rating of “AA” at the start of the period (1 January 2006). The number of defaulted instruments in the static pool during the period determines the default rating for the “AA” category.
The average cumulative default rates are published for the whole range of rated instruments and also for each specific rating category. The average cumulative default rate for a period is the simple mean of the default rates calculated over a period of time, e.g., in the case of a 5-year default rate, an average of default rates over 2000–2005, 2001–2006, 2003–2007, and so on, is calculated.
The average cumulative default rate overrides any aberration due to economic conditions, i.e., if the annual default rates during 2008 and 2009 are higher than those in other years.
Table A6.3 gives the average cumulative rates for 1981–2015.

Appendix 696
Tabl
e A
6.3:
S&
P G
loba
l’s c
umul
ativ
e D
efau
lt ra
tes
Glo
bal C
orpo
rate
Ave
rage
Cum
ulat
ive
Def
ault
Rate
s by R
atin
g M
odifi
er (1
981–
2015
): S&
P G
loba
lS&
P Ra
ting
CRIS
IL
Ratin
g1
23
45
67
89
1011
1213
1415
AA
A
0.00
0.03
0.14
0.25
0.35
0.47
0.52
0.61
0.67
0.73
0.76
0.79
0.82
0.89
0.96
AA
+
0.00
0.06
0.06
0.11
0.17
0.23
0.29
0.35
0.41
0.47
0.54
0.61
0.68
0.75
0.82
AA
0.
020.
040.
090.
230.
380.
500.
640.
750.
850.
961.0
51.1
11.2
31.3
01.3
8A
A–
0.
030.
100.
210.
300.
380.
490.
570.
620.
690.
750.
820.
890.
920.
971.0
3A
+A
AA
0.06
0.12
0.25
0.40
0.52
0.62
0.75
0.89
1.04
1.21
1.36
1.53
1.73
1.96
2.14
AA
A+
0.07
0.18
0.28
0.42
0.57
0.77
0.97
1.16
1.38
1.63
1.84
2.00
2.14
2.22
2.41
A–
AA
0.09
0.22
0.36
0.49
0.68
0.87
1.14
1.34
1.50
1.64
1.78
1.93
2.07
2.21
2.33
BBB+
AA
–0.
150.
410.
700.
981.2
61.5
91.8
42.
112.
412.
713.
003.
203.
466.
804.
19BB
BA
+0.
230.
560.
851.2
61.6
72.
082.
462.
833.
233.
634.
074.
474.
794.
925.
16BB
B–A
0.36
1.06
1.83
2.67
3.44
4.13
4.76
5.35
5.84
6.32
6.87
7.32
7.75
8.37
8.84
BB+
A–
0.49
1.38
2.48
3.53
4.51
5.49
6.31
6.91
7.65
8.35
8.83
9.41
9.96
10.4
111
.03
BBBB
B+0.
762.
254.
256.
017.6
89.
0110
.22
11.2
012
.1212
.91
13.6
914
.37
14.7
014
.93
15.2
7BB
–BB
B1.2
23.
706.
178.
5010
.52
12.4
914
.1415
.73
17.0
318
.1719
.04
19.6
920
.39
21.0
921
.68
B+BB
B–2.
516.
6410
.54
13.7
616
.1518
.03
19.74
21.2
322
.61
23.8
724
.85
25.6
126
.34
27.0
027
.60
BBB
–5.
5911
.77
16.4
019
.42
21.6
123
.67
25.0
826
.08
26.9
027
.72
28.4
229
.05
29.6
330
.1930
.85
B–B
8.74
16.3
621
.49
25.0
127
.82
29.8
231
.46
32.5
133
.1833
.76
34.5
635
.1735
.44
35.7
536
.10CC
C/C
C27
.22
36.4
141
.59
44.6
446
.99
47.8
448
.79
49.5
950
.48
51.12
51.6
152
.24
53.0
853
.7453
.74A
ll Ra
ted
1.5
93.
124.
445.
516.
407.1
67.8
08.
358.
859.
329.
7210
.05
10.3
610
.64
10.9
2
Sour
ce: S
&P
Glo
bal, C
RISI
L

97
Table A7: Base-case Outcomes
YearItem 1 2 3 4 5 6 7 8 9 10 11 TotalTotal pass-through
certificate defaults 0.00 0.00 0.00 0.00 0.00 1.00 0.57 0.47 0.45 0.38 0.00 2.87Principal defaults 0.00 0.00 0.00 0.00 0.00 0.85 0.46 0.40 0.42 0.38 0.00 2.51Interest defaults 0.00 0.00 0.00 0.00 0.00 0.15 0.11 0.07 0.03 0.00 0.00 0.36Recovery 0.00 0.00 0.00 0.00 0.00 0.60 0.34 0.28 0.27 0.23 0.00 1.72Absorbed by excess
interest spread 0.00 0.00 0.00 0.00 0.00 0.06 0.04 0.03 0.01 0.00 0.00 0.14Absorbed by cash
collateral 0.00 0.00 0.00 0.00 0.00 0.32 0.00 0.00 0.00 0.00 0.00 0.32Balance cash collateral 0.32 0.32 0.32 0.32 0.32 0.00 0.00 0.00 0.00 0.00 0.00Guarantee outflows 0.00 0.00 0.00 0.00 0.00 0.02 0.19 0.16 0.17 0.15 0.00 0.69Balance guarantee fund 3.03 3.03 3.03 3.03 3.03 3.01 2.83 2.67 2.50 2.35 2.35Interest income for cash
collateral 0.02 0.02 0.02 0.02 0.02 0.01 0.00 0.00 0.00 0.00 0.00 0.11Guarantee fees and
legal expenses 0.03 0.03 0.03 0.03 0.03 0.03 0.03 0.03 0.02 0.02 0.02 0.31
Source: CRISIL.
Appendix 7Base-Case Outcomes: Detailed

98
About the Authors
Jennifer romero-Torres is a senior finance specialist (Energy) in the Asian Development Bank’s East Asia Regional Department. She has worked on major investment projects, technical assistance and knowledge management related to infrastructure financing, financial and capital markets development in South Asia, and more recently in East Asia focusing on energy sector. Prior to ADB, she has also worked on corporate and structured finance, institutional banking, credit, and management consultancy for major international investment banks and global advisory firms. Jennifer is a national of
Australia. She holds postgraduate degrees, including a Master of Applied Finance from the University of Melbourne, Australia.
Sameer Bhatia is the president of CRISIL Infrastructure Advisory, a division of CRISIL Risk & Infrastructure Solutions (CRIS), which is a fully owned subsidiary of CRISIL. CRISIL Infrastructure Advisory is one of the leaders in the areas of infrastructure policy, development, and transaction advisory services. Sameer has more than 20 years of consulting experience across business strategy, corporate and competitive strategy, project feasibility, new market entry, and process and operations improvement. He has domain expertise across a range of sectors including energy and resources (oil and
gas, power, and mining), transportation and logistics, real estate and special economic zones, and industrial manufacturing and services. Sameer has handled more than 250 consulting engagements across these sectors, as a partner or engagement leader, or both. He also has a postgraduate diploma in business administration from the Symbiosis Institute of Business Management (Pune) and a degree in electrical engineering from Veermata Jijabai Technological Institute, Mumbai.
Sudip Sural is a senior director (infrastructure and public finance) at CRISIL Infrastructure Advisory. Sudip has over 21 years of experience in credit rating, commercial lending, and analytical research. He has handled sectors such as infrastructure, industrial, and consumer. In his previous role as senior director for CRISIL Ratings, Sudip headed the corporate and infrastructure ratings group. Before joining CRISIL in 2005, he was part of a start-up team at Fitch Ratings in India, before moving to Genpact as assistant vice president at the Analytics Centre of Excellence. Sudip set up the
commercial credit analytics division to support GE Capital businesses. He holds a master’s degree in business administration and is a mathematics graduate of the University of Delhi.

SECURITIZATION IN INDIAManaging Capital Constraints and Creating Liquidity to Fund Infrastructure Assets
India needs to spend close to Rs43 trillion (about $646 billion) on infrastructure through to 2022. Such a staggering requirement cannot be met though traditional sources such as public sector bank loans. India must immediately explore and quickly ramp up financing from alternative investment sources. This report provides an overview of infrastructure financing in India, sheds light on the challenges faced by the country’s banking sector, suggests an optimal mechanism for securitizing the infrastructure assets of public sector banks, and outlines a range of scenarios and factors that must be in place for this mechanism to be successfully realized.
About the Asian Development Bank
ADB’s vision is an Asia and Pacific region free of poverty. Its mission is to help its developing member countries reduce poverty and improve the quality of life of their people. Despite the region’s many successes, it remains home to a large share of the world’s poor. ADB is committed to reducing poverty through inclusive economic growth, environmentally sustainable growth, and regional integration.
Based in Manila, ADB is owned by 67 members, including 48 from the region. Its main instruments for helping its developing member countries are policy dialogue, loans, equity investments, guarantees, grants, and technical assistance.
SECURITIZATION IN INDIA MANAgINg CApITAl CONSTRAINTS AND CREATINg lIqUIDITy TO FUND INFRASTRUCTURE ASSETS
AsiAn Development BAnk6 ADB Avenue, Mandaluyong City1550 Metro Manila, Philippineswww.adb.org
ASIAN DEVELOPMENT BANK
Securitization covers.indd 1 11/8/17 6:15 PM