securitisation data report q3:2009 - sifma · several originators launching tender offers on...
TRANSCRIPT

esf
Prepared in partnership with
Securitisation Data ReportQ3:2009
click here for
downloadable data

Market Highlights and Commentary .................... 1
1. Issuance
1.1. European Historical Issuance ......................................... 3 1.2. US Historical Issuance ................................................... 3 1.3. European Issuance by Collateral .................................... 3 1.4. US Issuance by Collateral .............................................. 3 1.6. Issuance by Collateral Type and Country of Collateral .. 4 1.7. European Issuance by Rating ......................................... 5 1.8. US Issuance by Rating ................................................... 5 1.9. Securitisation Issuance by Deal Size .............................. 5
2. Balances Outstanding
2.1. European Outstandings by Collateral ............................. 6 2.2. US Outstandings by Collateral ....................................... 6 2.3. Outstandings by Country of Collateral ........................... 7 2.4. European Outstandings by Moody’s Ratings ................. 8 2.5. US Outstandings by Moody’s Ratings ........................... 8 2.6. Outstandings by Country and Collateral......................... 9
3. Credit Quality – Rating Changes
Upgrades/Downgrades by Country ....................................... 10 3.1. Fitch Ratings ............................................................. 10 3.2. Moody’s Investors Service ........................................ 10 3.3. Standard & Poor’s ..................................................... 10
Upgrades/Downgrades by Collateral ..................................... 11 3.4. Fitch Ratings – Europe .............................................. 11 3.5. Moody’s Investors Service – Europe ........................ 11 3.6. Standard & Poor’s – Europe ...................................... 11 3.7. Fitch Ratings – US .................................................... 11 3.8. Moody’s Investors Service – US ............................... 11 3.9. Standard & Poor’s – US ............................................ 11
4. CMBS Spreads
4.1. European 3-5 Yr AAA CMBS Spreads .......................... 12 4.2. European 3-5 Yr BBB CMBS Spreads ........................... 12 4.3. US 3 & 5 Yr AAA CMBS Spreads ................................ 12 4.4. US 3 & 5 Yr BBB CMBS Spreads ................................. 12
5. RMBS Spreads
5.1. European 3-5 Yr AAA RMBS Spreads .......................... 13 5.2. European 3-5 Yr BBB RMBS Spreads ........................... 13 5.3. UK 3-5 Yr AAA RMBS Spreads ................................... 13 5.4. UK 3-5 Yr BBB RMBS Spreads .................................... 13
6. ABS Spreads
6.1. European 1-4 Yr AAA ABS Spreads ............................. 14 6.2. European 1-4 Yr BBB ABS Spreads .............................. 14 6.3. US 3 Yr AAA ABS Spreads ........................................... 14 6.4. US 3 Yr BBB ABS Spreads ........................................... 14
7. RMBS Prices
7.1. European 3-5 Yr AAA RMBS Prices ............................. 15 7.2. European 3-5 Yr BBB RMBS Prices ............................. 15 7.3. UK 3-5 Yr AAA RMBS Prices ...................................... 15 7.4. UK 3-5 Yr BBB RMBS Prices ....................................... 15
8. CMBS and ABS Prices
8.1. Pan-European 3-5 Yr AAA CMBS Prices ...................... 16 8.2. Pan-European 3-5 Yr BBB CMBS Prices ...................... 16 8.3. Pan-European 1-4 Yr AAA ABS Prices ......................... 16 8.4. Pan-European 1-4 Yr BBB ABS Prices ......................... 16
9. Indices Data
9.1. Securitised Index Option Adjusted Spreads ....................17 9.2. ABX.HE and CMBX Spreads .........................................17
10. Total Return Benchmark Data
10.1. European Total Return RMBS AAA .............................18 10.2. European Total Return RMBS BBB .............................18 10.3. European ABS & CMBS Total Return AAA ................18 10.4. European ABS & CMBS Total Return BBB .................18
11. Asset-Backed Commercial Paper 11.1. European ABCP Historical Issuance .............................19 11.2. European ABCP Issuance by Nationality of Issuer .......19 11.3. European ABCP Issuance by Programme Type ............19 11.5. European ABCP Outstandings by Programme Type .....20 11.6. US ABCP Outstandings by Programme Type ...............20 11.7. ABCP Outstandings Assets Split by Country ................20 11.8. US AA ABCP to AA Non-financial CP Spread ............20
12. Global Comparative Data
12.1. Global Securitisation Issuance ......................................21 12.2. Global Corporate Bond Issuance ...................................21 12.3. Global Government Bond Issuance ...............................21
Annex ..................................................................... 22
Disclaimer .............................................................. 26

1
AFME / ESF SECURITISATION DATA REPORT
Q3 2009
2009 Q3: Positive Signals from Public Placements in the Primary Market
Market Environment Economic Conditions • According to Eurostat, European unemployment rates
continue to worsen. The euro area (EA16) seasonally adjusted unemployment rate reached 9.7% in September 2009 from 9.4% recorded in June 2009; the same statistic for EU 27 was 9.2% in September 2009, compared to 8.9% in June 2009.
• While residential housing prices have stabilised or even risen slightly from recent lows, commercial real estate remains particularly vulnerable; Fitch Ratings assessed the asset performance of both UK and pan-European commercial mortgage-backed securities (CMBS) as “declining”, stating worsening operating conditions on property portfolios due to “escalating vacancy rates and costs.”
• According to Eurostat, GDP increased by 0.4% in the euro area and by 0.2% in the EU27 during the third quarter of 2009 compared with the previous quarter; seasonally adjusted GDP decreased by 4.1% in the euro area and by 4.3% in the EU27 in the third quarter of 2009 compared to the same period in 2008.
Term Issuance and Outstanding Volumes • Although the primary market remained predominantly
closed, tightening spreads and improved investor sentiment allowed several deals to go public towards the end of the third quarter. Securities that were publicly or privately placed (including social housing and utility securitisations) totalled 5.4 percent of all issuance in the third quarter, with the remainder issuance retained by originators.
• Notable deals placed in the public market during September were: Tesco Finance 2 (CMBS), Permanent Master Trust Issuer 2009-1 (RMBS), and Volkswagen Car Lease 11 (ABS), revealing investors’ appetite for securitisation products across asset classes. Other deals were also placed in October.
Spread and Price Changes • Secondary market spreads of European securitisation
continued the path of overall tightening throughout the third quarter, according to Markit data.
• Notable in third quarter was the buyback trend, with several originators launching tender offers on outstanding securitisation bonds. However, this trend has moderated somewhat during the course of the quarter due to tightening spreads and markedly improved investor sentiment.
Credit Quality & Lending • The ECB bank lending survey in October confirmed a
further decline in the number of banks reporting a tightening of credit standards, marking the second quarter of 2009 to be the “turning point” from previous periods. As markets have normalised and/or stabilised, some relief has been afforded to banks in the third quarter. However, significant headwinds remain. Rising unemployment, falling house prices, and relatively tight credit continue to exacerbate asset quality. The trend of downgrades continued in the third quarter, albeit at a slightly less frenetic pace from before, with CDO classes continuing to remain hardest hit. Towards the end of the third quarter, rating agencies turned their attention to CMBS and began issuing downgrades.
• The ECB published in September the results of the first survey on the access to finance of small and medium-sized enterprises (SMEs) in the Euro area. The survey provided data on financing conditions for SMEs in comparison with those for large firms in the first half of 2009. Evidence suggested that SMEs were more strongly affected by the economic downturn in the period compared to large firms, the most pressing problems being finding customers and accessing finance (especially for smaller SMEs). SMEs largely rely on banks to obtain external financing, and a significant proportion of SMEs, especially the smaller ones, reported reduced banks’ willingness to provide a loan. Overall the survey shows deterioration, on balance, in the availability of external financing in the first half of 2009. Due to these factors unique to SMEs, SME CDOs in particular remain vulnerable to downgrade, given the lack of funding flexibility and exposure to general economic conditions.
ABCP Trends • According to Dealogic, European ABCP issuance
experienced a slight decline in the third quarter to EUR 38.8 billion, from EUR 39.9 billion issued in the second quarter.
• Due to the changes regarding securitisation in the Basel II framework in July 2009, and, in particular, the impact to conduit sponsors, Fitch Ratings expects certain ABCP conduits to wind down or restructure due to higher capital charges. Overall, the new framework is expected to markedly impact the ABCP market.
• The Bank of England announced details for the purchase of ABCP under the Secured Commercial Purchase Facility, launching operations on 3 August. The Facility offers to buy securities backed by assets such as trade receivables consistent with the Asset

2
AFME / ESF SECURITISATION DATA REPORT
Q3 2009
Purchase Facility’s aim to purchase high-quality assets of broadly investment grade. The purpose of the Facility is to help improve the function of the private market by standing ready to make primary market purchases and by acting as a backstop for secondary market investors. Further details regarding the operation of the Facility, its length, eligible programmes, eligible securities, eligible counterparties and criteria have been specified. This facility has not been tapped for use by the quarter end.
Major Regulatory, Legislative and Policy Initiatives • In July, the Bank of International Settlements (BIS)
published revisions to the Basel II framework mandating higher capital charges for securitisation and re-securitisation positions in the banking as well as the trading books.
• In July, the European Commission (EC) published the legislative proposal for next round of Capital Requirements Directive amendments (“CRD3”) including issues such as re-securitisation, self-guaranteed positions and disclosures under Pillar III.
• Moreover, in July the EC published a consultation for further amendments to the Capital Requirements Directive (c.d. “CRD4”) dealing with dynamic provisioning and national options and discretions; the consultation closed at the beginning of September.
• In September, the International Organization of Securities Commissions (IOSCO) issued a consultation on post-trade reporting for securitisation transactions for comments in November. During the summer the Committee of European Securities Regulators (CESR) issued a feedback statement on a similar consultation recommending that the EC introduces a post-trade reporting regime for “standardised” securitisation trades. Over the course of 2010 the EC will consider amendments in the context of the Markets in Financial Instruments Directive (MiFID) for trade reporting across various asset classes.
• In the United States, the Term Asset-Backed Securities Lending Facility (TALF) granted USD 17.8 billion in financing in certain asset-backed securities (ABS) asset classes in the third quarter. TALF expanded to both new and legacy CMBS beginning third quarter, and although no new CMBS was financed in third quarter, USD 4.4 billion was granted to finance legacy CMBS positions.
• In the year to date ending 30 September, no new CMBS was issued in the United States (although the $400 million issuance of Developers Diversified Realty in November has changed this situation). In light of these developments and the continued economic fragility, on 17 August the Federal Reserve extended
TALF to March 2010 for new ABS and legacy CMBS, and to June 2010 for new CMBS.
Other Relevant Publications and Research • Early in October, the International Monetary Fund
published an update to their Global Financial Stability Report, adding a chapter on securitisation (“Chapter II: Restarting Securitization Markets: Policy Proposals and Pitfalls”) and providing an overview of global policy initiatives. The article reviews the rise and fall of securitisation markets, and analyses the policy initiatives aimed at restarting these markets on a sounder basis. It recommends coordination between different regulations, specifically accounting standards, capital requirements and retention schemes; moreover, it warns that the interaction between different proposals could inadvertently hamper securitisation by increasing its costs for originators.

3
AFME / ESF SECURITISATION DATA REPORT
Q3 2009
€ BILLIONS1234567
1.1. European Historical Issuance 1.2. US Historical Issuance Q1 Q2 Q3 Q4 TOTAL2 TOTAL1,2
2000 14.1 16.4 21.4 26.3 78.2 2000 1,088.0
2001 20.5 43.2 22.7 66.2 152.6 2001 2,308.4
2002 24.3 42.6 35.7 55.1 157.7 2002 2,592.7
2003 43.3 51.9 39.7 82.4 217.3 2003 2,914.5
2004 55.8 59.0 53.2 75.5 243.5 2004 1,956.6
2005 47.8 94.4 41.5 143.3 327.0 2005 2,650.6
2006 69.0 114.3 112.8 184.9 481.0 2006 2,455.8
2007 128.7 152.0 98.3 74.7 453.7 2007 2,147.1
2008 40.0 169.6 134.1 367.6 711.3 2008 933.6
2009 123.2 81.2 114.7 319.2 2009YTD7 1,084.2
1.3. European Issuance by Collateral 2009:Q1 2009:Q2 2009:Q3 2009:Q4 TOTAL2 2008:Q1 2008:Q2 2008:Q3 2008:Q4 TOTAL2
ABS3 17.5 10.4 11.1 39.0 10.1 12.7 11.6 38.6 73.0
CDO4 40.5 16.9 18.6 76.0 2.0 10.2 14.0 21.9 48.1
CMBS 8.9 0.5 6.0 15.5 0.7 0.7 3.4 0.1 4.9
RMBS 56.2 53.4 79.0 188.7 27.2 146.0 105.0 307.1 585.3
Total2 123.2 81.2 114.7 319.2 40.0 169.6 134.1 367.6 711.3
1.4. US Issuance by Collateral
2009:Q1 2009:Q2 2009:Q3 2009:Q4 TOTAL1,2 2008:Q1 2008:Q2 2008:Q3 2008:Q4 TOTAL1,2
ABS5 12.2 38.4 32.8 83.4 32.6 40.0 14.2 1.9 88.7
CDO6 0.1 1.0 0.0 1.1 12.4 15.0 9.1 3.6 40.1
Agency MBS 259.3 419.7 310.1 989.1 204.9 239.8 181.0 153.3 779.0
Non-Agency CMBS 0.0 0.2 0.0 0.2 3.5 4.8 0.1 0.0 8.4
Non-Agency RMBS 1.0 7.1 2.3 10.4 7.6 8.7 0.9 0.1 17.4
Total1,2 272.7 466.3 345.2 1,084.2 261.0 308.3 205.4 158.9 933.6 Source: Bloomberg, JP Morgan, Merrill Lynch, RBS, Thomson Reuters, Unicredit, SIFMA
1 All volumes are denominated in euro. The US volumes were converted from dollar to euro based on the $/€ exchange rates as of quarter-end. 2 Numbers may not add due to independent rounding. Historical or prior period numbers are revised to reflect changes in classification, refined selection methodology, or information submitted to our data source after the prior period cut-off dates.
3 European ABS issuance includes auto, credit card, leases, loans, receivables and other. 4 European CDO issuance numbers only include euro-denominated issuance regardless of the country of collateral. A substantial percentage of CDOs are backed by multi-jurisdictional collateral. Historical CDO issuance totals have been revised due to periodic updates of the sector.
5 US ABS issuance includes auto, credit card, home equity, student loan, equipment leases, manufactured housing, and other. Historical ABS issuance totals have been revised due to periodic updates of the sector.
6 US CDO issuance numbers only include US-denominated issuance regardless of the country of collateral and may include European transactions which are denominated in US dollars. Historical CDO issuance totals have been revised due to periodic updates of the sector.
7 US issuance is as of 30 September 2009.

4
AFME / ESF SECURITISATION DATA REPORT
Q3 2009
€ BILLIONS1
1.5. Issuance by Country of Collateral 2009:Q1 2009:Q2 2009:Q3 2009:Q4 TOTAL2 2008:Q1 2008:Q2 2008:Q3 2008:Q4 TOTAL2
Belgium 5.3 8.2 13.6 15.1 19.7 34.9
Finland 7.5 7.5
France 4.4 0.6 5.0 3.5 10.8 14.2
Germany 14.6 3.9 5.2 23.7 3.8 1.3 3.3 41.7 50.1
Greece 9.7 5.9 6.4 22.0 1.0 0.8 3.7 7.2 12.7
Iceland 0.2 0.2
Ireland 3.0 2.4 5.3 10.8 2.5 14.0 4.6 19.6 40.7
Italy 13.9 8.8 28.7 51.5 5.9 15.2 17.1 44.0 82.2
Netherlands 12.0 21.4 0.9 34.3 2.8 10.0 9.6 50.1 72.6
Portugal 8.0 1.6 1.0 10.6 2.0 2.6 3.5 6.7 14.8
Russia 0.5 0.4 0.9
Spain 22.7 18.6 10.1 51.3 9.8 22.7 9.1 39.1 80.7
UK 16.2 2.8 47.0 65.9 8.8 73.8 79.6 109.7 271.9
Multinational7 17.8 3.2 9.5 30.5 2.9 10.1 3.4 11.4 27.8
European Total2 123.2 81.2 114.7 319.2 40.0 169.6 134.1 367.6 711.3
US Total1,2 272.7 466.3 345.2 1,084.2 261.0 308.3 205.4 158.9 933.6
1.6. Issuance by Collateral Type and Country of Collateral234567 2009:Q3
ABS3 CDO4 CMBS RMBS TOTAL2
France 0.6 0.6
Germany 4.0 1.2 5.2
Greece 1.2 5.2 6.4
Ireland 5.3 5.3
Italy 0.4 28.3 28.7
Netherlands 0.9 0.9
Portugal 0.9 0.1 1.0
Spain 1.7 3.9 4.5 10.1
UK 1.0 6.0 39.9 47.0
Multinational7 1.2 8.3 9.5
European Total2 11.1 18.6 6.0 79.0 114.7
ABS5 CDO6
AGENCY
MBS
NON-
AGENCY
CMBS
NON-
AGENCY
RMBS TOTAL1,2
US Total1,2 32.8 0.0 310.1 0.0 2.3 345.2 Source: Bloomberg, JP Morgan, Merrill Lynch, RBS, Thomson Reuters, Unicredit, SIFMA
1 All volumes are denominated in euro. The US volumes were converted from dollar to euro based on the $/€ exchange rates as of quarter-end. 2 Numbers may not add due to independent rounding. Historical or prior period numbers are revised to reflect changes in classification, refined selection methodology, or information submitted to our data source after the prior period cut-off dates.
3 European ABS issuance includes auto, credit card, leases, loans, receivables and other. 4 European CDO issuance numbers only include euro-denominated issuance regardless of the country of collateral. A substantial percentage of CDOs are backed by multi-jurisdictional collateral. Historical CDO issuance totals have been revised due to periodic updates of the sector.
5 US ABS issuance includes auto, credit card, home equity, student loan, equipment leases, manufactured housing, and other. Historical ABS issuance totals have been revised due to periodic updates of the sector.
6 US CDO issuance numbers only include US-denominated issuance regardless of the country of collateral and may include European transactions which are denominated in US dollars. Historical CDO issuance totals have been revised due to periodic updates of the sector.
7 Multinational includes all deals, including CDOs, in which assets are originated from a variety of jurisdictions, or from countries whose total amounts are too small to display.

5
AFME / ESF SECURITISATION DATA REPORT
Q3 2009
€ BILLIONS12
1.7. European Issuance by Rating3 2009:Q1 2009:Q2 2009:Q3 2009:Q4 TOTAL2 2008:Q1 2008:Q2 2008:Q3 2008:Q4 TOTAL2
AAA 68.2 66.6 92.6 227.4 27.8 145.2 115.2 266.5 554.7
AA 8.5 2.0 1.2 11.7 3.5 2.4 1.4 21.4 28.7
A 21.5 2.7 3.0 27.2 0.9 3.2 7.1 46.9 58.1
BBB & Below 4.5 2.4 3.8 10.7 1.1 4.1 2.4 3.6 11.2
Not Rated 20.6 7.5 14.0 42.1 6.7 14.7 8.0 29.1 58.5
European Total2 123.2 81.2 114.7 319.2 40.0 169.6 134.1 367.6 711.3
1.8. US Issuance by Rating4 2009:Q1 2009:Q2 2009:Q3 2009:Q4 TOTAL1,2 2008:Q1 2008:Q2 2008:Q3 2008:Q4 TOTAL1,2
AAA 8.1 29.7 27.9 65.7 39.0 46.2 16.2 2.5 103.9
AA 0.1 0.1 0.5 1.9 1.1 0.4 4.0
A 0.0 0.0 0.6 0.6 0.8 1.9 1.1 0.5 4.4
BBB & Below 0.6 0.0 0.6 0.7 1.3 0.8 0.0 2.8
Not Rated 4.7 16.9 6.6 28.1 15.1 17.2 5.0 2.1 39.5
Agency MBS 259.3 419.7 310.1 989.1 204.9 239.8 181.0 153.3 779.0
US Total1,2 272.7 466.3 345.2 1084.2 261.0 308.3 205.4 158.9 933.6 Source: Bloomberg, JP Morgan, Merrill Lynch, RBS, Thomson Reuters, Unicredit, SIFMA
1 All volumes are denominated in euro. The US volumes were converted from dollar to euro based on the $/€ exchange rates as of quarter-end. 2 Numbers may not add due to independent rounding. Historical or prior period numbers are revised to reflect changes in classification, refined selection methodology, or information submitted to our data source after the prior period cut-off dates.
3 European CDO issuance numbers only include euro-denominated issuance regardless of the country of collateral. A substantial percentage of CDOs are backed by multi-jurisdictional collateral. Historical CDO issuance totals have been revised due to periodic updates of the sector.
4 US CDO issuance numbers only include US-denominated issuance regardless of the country of collateral and may include European transactions which are denominated in US dollars. Historical CDO issuance totals have been revised due to periodic updates of the sector.
1.9. Securitisation Issuance by Deal Size1 2009:Q223
# of Issues € Billions # of Issues € Billions
Less than 0.1 Billion 6% 0% 0% 0%
0.1-1.0 Billion 49% 13% 29% 25%
More than 1.0 Billion 45% 86% 5% 18%
Agency MBS 0% 0% 61% 56%
Total3 100% 100% 100% 100%
INCLUDING RETAINED DEALS2
EUROPE US
2009:Q3
# of Issues € Billions # of Issues € Billions # of Issues € Billions # of Issues € Billions
Less than 0.1 Billion 0% 0% 5% 0% 0% 0% 5% 0%
0.1-1.0 Billion 83% 36% 19% 9% 48% 11% 19% 10%
More than 1.0 Billion 17% 64% 14% 27% 52% 89% 15% 30%
Agency MBS 0% 0% 61% 63% 0% 0% 61% 61%
Total3 100% 100% 100% 100% 100% 100% 100% 100%
EUROPE US
INCLUDING RETAINED DEALS2EXCLUDING RETAINED DEALS2
EUROPE US
Source: Dealogic
1 The European data includes all asset classes – ABS, CMBS, RMBS and euro-denominated CDOs. US data includes ABS, non-agency CMBS and RMBS, and US dollar-denominated CDOs. US agency MBS, which includes agency CMBS and RMBS, is shown separately. All data except for CDOs is included based on the country of collateral.
2 Dealogic provides data for retained deals based on available market information, sourcing further details from a wide base of syndicate desks wherever possible. Further statistics on retained deals are added based on intelligence from other market participants.
3 Percentages may not sum to 100% due to independent rounding. Historical or prior period numbers are revised to reflect changes in classification, refined selection methodology, or information submitted to our data source after the prior period cut-off dates.

6
AFME / ESF SECURITISATION DATA REPORT
Q3 2009
€ BILLIONS123456
2.1. European Outstandings by Collateral 2009:Q1 2009:Q2 2009:Q3 2009:Q4 2008:Q1 2008:Q2 2008:Q3 2008:Q4
ABS2 194.0 196.9 196.2 177.9 183.8 176.1 192.0
CDO3 315.1 319.9 328.9 254.2 272.6 284.0 297.9
CMBS 148.0 146.0 143.1 141.5 141.5 139.2 138.4
RMBS 1,088.6 1,108.7 1,154.6 660.1 789.2 848.4 1,069.8
WBS4 37.9 38.0 37.2 39.8 39.8 39.7 39.5
Total5 1,783.6 1,809.6 1,860.0 1,273.5 1,426.9 1,487.5 1,737.5
2.2. US Outstandings by Collateral 2009:Q1 2009:Q2 2009:Q3 2009:Q4 2008:Q1 2008:Q2 2008:Q3 2008:Q4
ABS6 1,961.2 1,805.4 1,697.0 1,705.6 1,828.9 1,982.8 1,911.9
Agency MBS 3,843.8 3,828.4 3,763.0 3,002.6 3,105.5 3,534.9 3,631.8
Non-Agency RMBS 936.5 841.0 769.8 912.2 862.4 931.6 917.3
Non-Agency CMBS 610.7 569.2 539.5 416.9 413.1 406.2 450.3
Total1,5 7,352.2 7,044.1 6,769.3 6,037.3 6,209.9 6,855.6 6,911.4 Sources: Bloomberg (US & Europe), Fannie Mae (US), Federal Reserve (US), Freddie Mac (US), Ginnie Mae (US),
Loan Performance (US), Thomson Reuters (US), SIFMA Estimates (US & Europe)
1 All volumes are denominated in euro. The US volumes were converted from dollar to euro based on the $/€ exchange rates as of quarter-end. 2 European ABS outstanding collateral types include auto loans, credit cards, loans (consumer and student), and other. 3 Includes euro-denominated CDOs issued after July 2007, regardless of country of collateral, and prior to this, only CDOs confirmed by market participants with known European collateral. 4 Whole Business Securitisation: a securitisation in which the cashflows derive from the whole operating revenues generated by an entire business or segmented part of a larger business. 5 Numbers may not add due to independent rounding. Historical or prior period numbers are revised to reflect changes in classification, refined selection methodology, or information submitted to our data source after the prior period cut-off dates.
6 US ABS outstanding collateral types include auto loans, credit cards, loans (home equity, equipment and student loans), CDOs, and other. CDOs outstanding cannot be broken out within the ABS outstanding collateral type but represents dollar-denominated issues.

7
AFME / ESF SECURITISATION DATA REPORT
Q3 2009
€ BILLIONS1
2.3. Outstandings by Country of Collateral23 2007 - 2008
2008:Q1 2008:Q2 2008:Q3 2008:Q4 2007:Q1 2007:Q2 2007:Q3 2007:Q4
Austria 3.5 3.4 3.3 3.2 N/A N/A 3.6 3.6
Belgium 6.9 22.0 21.8 41.4 N/A N/A 7.3 7.1
Denmark 7.7 7.6 7.4 7.3 N/A N/A 6.8 6.1
France 24.9 27.9 27.2 26.9 N/A N/A 28.9 27.5
Germany 70.1 69.9 70.1 87.3 N/A N/A 74.1 69.6
Greece 9.2 9.9 14.1 21.2 N/A N/A 9.9 9.5
Ireland 18.4 33.2 32.3 48.8 N/A N/A 18.6 18.6
Italy 109.2 119.3 125.5 161.3 N/A N/A 117.6 112.0
Netherlands 143.2 158.3 152.2 202.5 N/A N/A 131.5 145.8
Portugal 26.1 27.3 29.4 35.2 N/A N/A 29.1 27.1
Russia 4.6 4.9 5.1 5.1 N/A N/A 3.3 2.8
Spain 174.6 194.4 198.4 229.2 N/A N/A 173.1 177.5
Sweden 0.9 0.9 0.9 0.7 N/A N/A 0.8 0.9
Turkey 3.1 3.1 3.1 2.9 N/A N/A 3.1 3.1
UK 456.5 513.3 565.1 615.5 N/A N/A 492.6 468.8
Other3 0.3 0.4 0.5 8.1 N/A N/A 0.5 0.3
Multinational 214.1 231.1 231.1 240.9 N/A N/A 223.0 213.3
European Total2 1,273.5 1,426.9 1,487.5 1,737.5 N/A N/A 1,323.8 1,293.5
US Total1 6,037.3 6,209.9 6,855.6 6,911.4 6,136.8 6,392.4 6,278.9 6,266.7 2009
2009:Q1 2009:Q2 2009:Q3 2009:Q4
Austria 3.1 3.0 2.9
Belgium 46.4 54.2 53.5
Denmark 7.0 6.5 6.3
Finland 6.8 6.4 6.0
France 26.1 29.7 28.6
Germany 85.0 83.4 88.2
Greece 30.6 36.3 42.5
Ireland 49.7 51.0 55.3
Italy 170.6 173.5 196.4
Netherlands 209.8 227.7 223.8
Portugal 40.6 41.1 42.0
Russia 4.6 4.8 4.5
Spain 242.6 250.6 247.9
Sweden 0.7 0.7 0.4
Turkey 2.7 2.6 2.5
UK 604.8 587.1 613.3
Other3 0.5 0.5 0.5
Multinational 251.8 250.5 245.3
European Total2 1,783.6 1,809.6 1,860.0
US Total1 7,352.2 7,044.1 6,769.3 Sources: Bloomberg (US & Europe), Fannie Mae (US), Federal Reserve (US), Freddie Mac (US), Ginnie Mae (US),
Loan Performance (US), Thomson Reuters (US), SIFMA Estimates (US & Europe)
1 All volumes are denominated in euro. The US volumes were converted from dollar to euro based on the $/€ exchange rates as of quarter-end. 2 Numbers may not add due to independent rounding. Historical or prior period numbers are revised to reflect changes in classification, refined selection methodology, or information submitted to our data source after the prior period cut-off dates.
3 Other includes countries with outstanding securities that are too small to be displayed, such as Georgia, Iceland, China, Ukraine, Switzerland, and Hungary.
8
AFME / ESF SECURITISATION DATA REPORT
Q3 2009
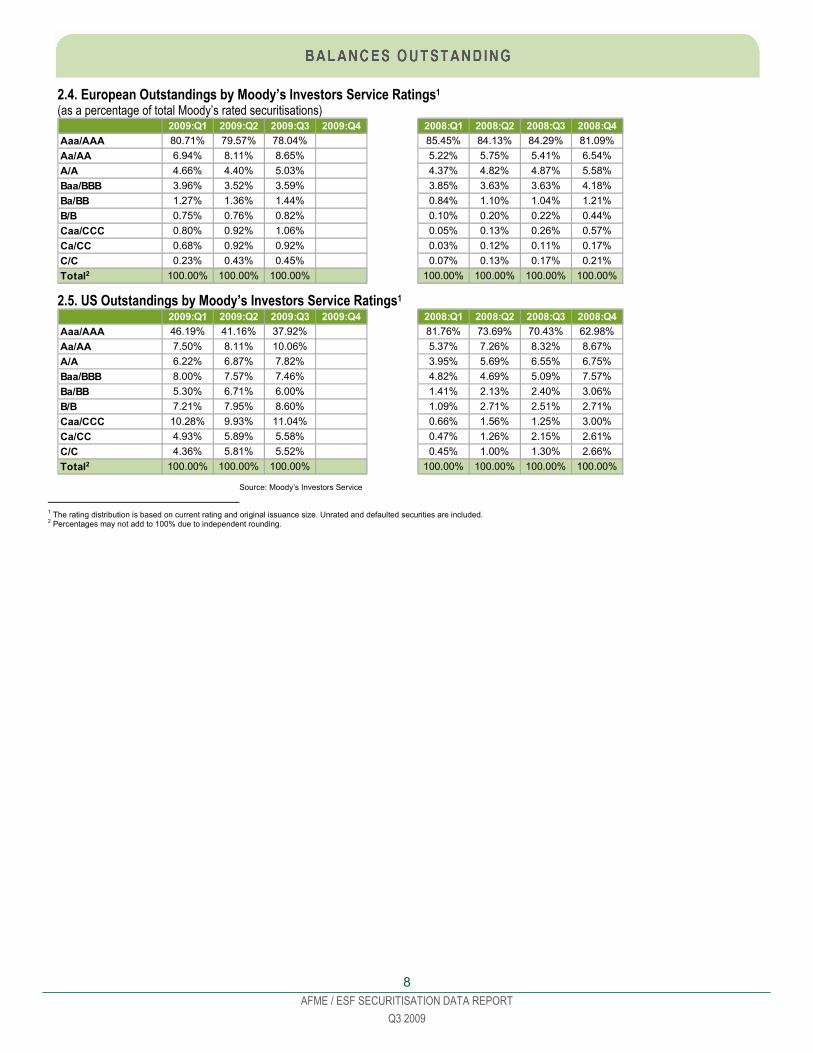
2.4. European Outstandings by Moody’s Investors Service Ratings12
(as a percentage of total Moody’s rated securitisations) 2009:Q1 2009:Q2 2009:Q3 2009:Q4 2008:Q1 2008:Q2 2008:Q3 2008:Q4
Aaa/AAA 80.71% 79.57% 78.04% 85.45% 84.13% 84.29% 81.09%
Aa/AA 6.94% 8.11% 8.65% 5.22% 5.75% 5.41% 6.54%
A/A 4.66% 4.40% 5.03% 4.37% 4.82% 4.87% 5.58%
Baa/BBB 3.96% 3.52% 3.59% 3.85% 3.63% 3.63% 4.18%
Ba/BB 1.27% 1.36% 1.44% 0.84% 1.10% 1.04% 1.21%
B/B 0.75% 0.76% 0.82% 0.10% 0.20% 0.22% 0.44%
Caa/CCC 0.80% 0.92% 1.06% 0.05% 0.13% 0.26% 0.57%
Ca/CC 0.68% 0.92% 0.92% 0.03% 0.12% 0.11% 0.17%
C/C 0.23% 0.43% 0.45% 0.07% 0.13% 0.17% 0.21%
Total2 100.00% 100.00% 100.00% 100.00% 100.00% 100.00% 100.00%
2.5. US Outstandings by Moody’s Investors Service Ratings1 2009:Q1 2009:Q2 2009:Q3 2009:Q4 2008:Q1 2008:Q2 2008:Q3 2008:Q4
Aaa/AAA 46.19% 41.16% 37.92% 81.76% 73.69% 70.43% 62.98%
Aa/AA 7.50% 8.11% 10.06% 5.37% 7.26% 8.32% 8.67%
A/A 6.22% 6.87% 7.82% 3.95% 5.69% 6.55% 6.75%
Baa/BBB 8.00% 7.57% 7.46% 4.82% 4.69% 5.09% 7.57%
Ba/BB 5.30% 6.71% 6.00% 1.41% 2.13% 2.40% 3.06%
B/B 7.21% 7.95% 8.60% 1.09% 2.71% 2.51% 2.71%
Caa/CCC 10.28% 9.93% 11.04% 0.66% 1.56% 1.25% 3.00%
Ca/CC 4.93% 5.89% 5.58% 0.47% 1.26% 2.15% 2.61%
C/C 4.36% 5.81% 5.52% 0.45% 1.00% 1.30% 2.66%
Total2 100.00% 100.00% 100.00% 100.00% 100.00% 100.00% 100.00% Source: Moody’s Investors Service
1 The rating distribution is based on current rating and original issuance size. Unrated and defaulted securities are included. 2 Percentages may not add to 100% due to independent rounding.

9
AFME / ESF SECURITISATION DATA REPORT
Q3 2009
€ BILLIONS12345678
2.6. Outstandings by Country and Collateral 2009:Q2
ABS2 CDO3 CMBS RMBS WBS4 TOTAL5
Austria 0.6 0.2 2.2 3.1
Belgium 0.2 0.0 0.1 53.8 46.4
Denmark 1.6 4.8 0.0 7.0
Finland 6.4 6.8
France 13.8 0.7 3.4 11.9 26.1
Germany 34.8 11.9 17.5 19.1 0.1 85.0
Greece 10.4 16.2 9.8 30.6
Ireland 3.2 1.4 46.4 49.7
Italy 53.5 10.2 3.7 103.7 2.4 170.6
Netherlands 5.4 10.3 7.5 204.5 209.8
Portugal 3.1 4.0 34.1 40.6
Russia 1.3 3.4 4.6
Spain 18.1 60.9 1.1 170.5 242.6
Sweden 0.1 0.6 0.7
Turkey 2.6 2.7
UK 42.7 3.1 71.2 435.2 34.9 604.8
Other8 0.1 0.2 0.0 0.2 0.0 0.5
Multinational6 8.6 194.3 39.9 6.9 0.7 251.8
European Total5 196.9 319.9 146.0 1108.7 38.0 1809.6
ABS7
AGENCY
MBS
NON-
AGENCY
RMBS
NON-
AGENCY
CMBS TOTAL1
US Total1 1,805.4 3,828.4 841.0 569.2 7,044.1 2009:Q3
ABS2 CDO3 CMBS RMBS WBS4 TOTAL5
Austria 0.5 0.2 2.2 2.9
Belgium 0.2 0.0 0.1 53.2 53.5
Denmark 1.6 4.7 6.3
Finland 6.0 6.0
France 13.6 0.6 3.4 11.0 28.6
Germany 39.3 13.0 17.4 18.3 0.1 88.2
Greece 11.6 21.4 9.5 42.5
Ireland 2.6 1.3 51.4 55.3
Italy 50.2 10.1 3.7 130.3 2.2 196.4
Netherlands 3.9 10.0 7.5 202.4 223.8
Portugal 3.7 3.8 34.5 42.0
Russia 1.1 3.3 4.5
Spain 18.7 61.0 1.0 167.1 247.9
Sweden 0.1 0.3 0.4
Turkey 2.5 2.5
UK 39.9 9.5 71.5 458.0 34.5 613.3
Other8 0.1 0.2 0.2 0.5
Multinational6 9.1 191.9 37.1 6.9 0.4 245.3
European Total5 196.2 328.9 143.1 1154.6 37.2 1860.0
ABS7
AGENCY
MBS
NON-
AGENCY
RMBS
NON-
AGENCY
CMBS TOTAL1
US Total1 1,697.0 3,763.0 769.8 539.5 6,769.3 Sources: Bloomberg (US & Europe), Fannie Mae (US), Federal Reserve (US), Freddie Mac (US), Ginnie Mae (US), JP Morgan (JPM) ,
Loan Performance (US), Thomson Reuters (US), SIFMA Estimates (US & Europe)
1 All volumes are denominated in euro. The US volumes were converted from dollar to euro based on the $/€ exchange rates as of quarter-end. 2 European ABS outstanding collateral types include auto loans, credit card, loans (consumer and student), and other. 3 Includes euro-denominated CDOs issued after July 2007, regardless of country of collateral, and prior to this, only CDOs confirmed by market participants with known European collateral. 4 Whole Business Securitisation: a securitisation in which the cashflows derive from the whole operating revenues generated by an entire business or segmented part of a larger business. 5 Numbers may not add due to independent rounding. Historical or prior period numbers are revised to reflect changes in classification, refined selection methodology, or information submitted to our data source after the prior period cut-off dates.
6 Multinational includes all deals in which assets originate from a variety of jurisdictions. This includes the majority of euro-denominated CDOs. 7 US ABS outstanding collateral types include auto loans, credit cards, loans (home equity, equipment and student loans), CDOs, and other. CDOs outstanding can not be broken out within the ABS outstanding collateral type but represents dollar-denominated issues.
8 Other includes countries with outstanding securities that are too small to be displayed, such as Georgia, Iceland, China, Ukraine, Switzerland, and Hungary.

10
AFME / ESF SECURITISATION DATA REPORT
Q3 2009
Upgrades/Downgrades by Country12 3.1. Fitch Ratings2
2009:Q1 2009:Q2 2009:Q3 2009:Q4 TOTAL 2008:Q1 2008:Q2 2008:Q3 2008:Q4 TOTAL
France 0/0 0/5 0/18 0/23 0/0 0/2 0/10 0/2 0/14
Germany 4/65 5/28 6/65 15/158 4/1 7/17 3/8 3/10 17/36
Italy 1/17 11/2 1/7 13/26 2/10 0/3 11/8 1/9 14/30
Netherlands 1/1 0/0 0/6 1/7 0/0 14/0 2/0 11/18 27/18
Spain 0/97 2/58 3/17 5/172 0/0 0/13 12/10 4/18 16/41
UK 4/123 5/149 2/125 11/397 22/40 8/8 27/190 26/656 83/894
Multinational2 3/354 4/340 11/62 18/756 8/10 4/116 8/0 7/15 27/141
European Total 13/657 27/582 23/300 63/1539 36/61 33/159 63/226 52/728 184/1174
US 48/4001 22/14566 20/21258 70/18567 335/4901 166/5769 123/6000 94/11005 718/27675 3.2. Moody’s Investors Service3
2009:Q1 2009:Q2 2009:Q3 2009:Q4 TOTAL 2008:Q1 2008:Q2 2008:Q3 2008:Q4 TOTAL
France 1/0 0/0 0/1 1/1 0/0 0/1 0/0 0/1 0/2
Germany 0/5 10/36 0/4 10/45 0/2 2/5 0/14 0/22 2/43
Italy 1/3 0/7 1/1 2/11 0/1 0/6 0/2 0/6 0/15
Netherlands 0/2 0/11 4/23 4/36 0/0 0/0 0/2 0/3 0/5
Spain 0/19 0/26 0/16 0/61 1/0 0/5 0/0 0/49 1/54
UK 5/80 0/65 1/121 6/266 10/7 6/82 0/13 0/109 16/211
Multinational3 4/1460 7/501 30/487 41/2448 11/247 59/556 8/328 1/1009 79/2140
European Total 11/1569 17/646 36/653 64/2868 22/257 67/655 8/359 1/1199 98/2470
US 110/33536 96/12115 213/6075 419/51726 111/4751 223/16563 413/9545 116/18706 863/49565 3.3. Standard & Poor’s
2009:Q1 2009:Q2 2009:Q3 2009:Q4 TOTAL 2008:Q1 2008:Q2 2008:Q3 2008:Q4 TOTAL
France 2/10 0/10 0/1 2/21 1/2 0/6 0/0 1/10 2/18
Germany 1/13 1/15 0/48 2/76 1/7 5/12 5/31 7/13 18/63
Italy 5/5 5/9 8/8 18/22 10/0 1/7 5/0 11/8 27/15
Netherlands 10/18 8/1 9/1 27/20 0/0 6/0 0/0 0/5 6/5
Spain 11/33 4/63 0/61 15/157 6/1 0/0 0/7 0/57 6/65
UK 23/253 3/252 3/232 29/737 6/52 32/107 19/74 8/263 65/496
Multinational3 19/891 24/971 10/840 53/2702 27/432 21/519 72/374 11/1557 131/2882
European Total 71/1223 45/1321 30/1191 146/3735 51/494 65/651 101/486 38/1913 255/3544
US 83/6196 105/7793 124/14253 312/28242 215/8904 106/4860 125/8842 136/7081 582/29687 Source: Fitch Ratings, Moody’s Investors Service, Standard & Poor’s
1 Each box contains two numbers: Upgrades followed by Downgrades. Because the three credit rating agencies track different securities and apply slightly different rating criteria, these numbers are not directly comparable.
2 Fitch’s “Multinational” classification includes cross-jurisdictional CMBS issues as well as the aggregated sum of rating actions in other EMEA countries, namely Austria, Belgium, Greece, Ireland, Portugal, and the Russian Federation. Fitch assigns CDO issues to the country in which the majority of the underlying assets are located.
3 “Multinational” for Standard & Poor’s and Moody’s ratings is defined as all issues with collateral located in multiple countries. All CDOs are also included in this category.

11
AFME / ESF SECURITISATION DATA REPORT
Q3 2009
Upgrades/Downgrades by Collateral1 3.4. Fitch Ratings – Europe23
2009:Q1 2009:Q2 2009:Q3 2009:Q4 TOTAL 2008:Q1 2008:Q2 2008:Q3 2008:Q4 TOTAL
Auto 2/7 4/0 0/8 6/15 1/0 0/0 0/0 3/6 4/6
Credit Card 0/0 0/9 0/0 0/9 0/0 0/0 0/0 0/9 0/9
Other ABS2 1/24 5/9 7/11 13/44 3/21 1/6 6/7 2/7 12/41
CDO 2/425 1/332 8/54 11/811 0/10 3/117 7/179 2/391 12/697
CMBS 3/111 3/142 3/90 9/343 5/12 8/4 3/24 3/35 19/75
RMBS (prime) 2/70 12/72 0/3 14/145 12/0 16/27 22/10 23/30 73/67
RMBS (non-conforming) 3/20 2/18 5/134 10/172 15/18 5/5 25/6 19/250 64/279
Total 13/657 27/582 23/300 63/1539 36/61 33/159 63/226 52/728 184/1174 3.5. Moody’s Investors Service – Europe
2009:Q1 2009:Q2 2009:Q3 2009:Q4 TOTAL 2008:Q1 2008:Q2 2008:Q3 2008:Q4 TOTAL
Auto 0/0 1/7 0/25 1/32 1/0 1/0 0/0 0/4 2/4
CDO 4/1453 7/487 30/477 41/2417 11/247 57/556 8/325 1/1006 77/2134
CMBS 3/13 0/88 2/82 5/183 2/0 9/34 0/7 0/36 11/77
Credit Card 0/0 0/1 0/0 0/1 3/0 0/0 0/0 0/22 3/22
RMBS (prime) 1/41 9/46 4/64 14/151 0/3 0/10 0/7 0/54 0/74
RMBS (non-conforming) 3/73 0/27 0/85 3/185 5/7 0/55 0/27 0/82 5/171
Total 11/1580 17/656 36/733 64/2969 22/257 67/655 8/366 1/1204 98/2482 3.6. Standard & Poor’s – Europe
2009:Q1 2009:Q2 2009:Q3 2009:Q4 TOTAL 2008:Q1 2008:Q2 2008:Q3 2008:Q4 TOTAL
Auto 1/4 2/2 0/4 3/10 4/0 0/0 4/0 4/10 12/10
CDO 12/939 25/1052 4/945 41/2936 25/475 16/550 68/387 12/1647 121/3059
CMBS 2/38 0/38 0/60 2/136 4/0 10/21 1/15 0/67 15/103
Credit Card 0/0 0/19 0/0 0/19 0/0 0/0 0/0 0/0 0/0
RMBS (prime) 23/10 12/54 16/43 51/107 7/2 6/0 16/35 10/51 39/88
RMBS (non-conforming) 21/150 1/78 2/60 24/288 0/1 25/4 0/28 4/90 29/123
Total 59/1141 40/1243 22/1112 121/3496 40/478 57/575 89/465 30/1865 216/3383 3.7. Fitch Ratings – US
2009:Q1 2009:Q2 2009:Q3 2009:Q4 TOTAL 2008:Q1 2008:Q2 2008:Q3 2008:Q4 TOTAL
Auto 8/4 0/16 12/0 20/20 8/34 6/26 13/0 9/4 36/64
Credit Card 7/0 4/7 0/4 11/11 0/3 0/1 0/18 1/0 1/22
Other ABS2 17/145 8/106 5/25 30/276 242/467 10/248 10/39 8/21 270/775
CDO 7/1291 8/1020 0/157 15/2468 0/155 18/486 8/771 2/293 28/1705
CMBS 9/392 2/274 0/1069 11/1735 69/39 132/69 67/78 29/287 297/473
RMBS (prime) 0/381 0/6490 0/7896 0/14767 11/100 0/26 2/1961 0/9 13/2096
RMBS (subprime) 0/1441 0/6056 3/2862 3/10359 0/3683 0/2939 0/30 0/4209 0/10861
Other RMBS3 0/347 0/597 0/9245 0/10189 5/420 0/1974 23/3103 45/6182 73/11679
Total 48/4001 22/14566 20/21258 90/39825 335/4901 166/5769 123/6000 94/11005 717/27675 3.8. Moody’s Investors Service – US
2009:Q1 2009:Q2 2009:Q3 2009:Q4 TOTAL 2008:Q1 2008:Q2 2008:Q3 2008:Q4 TOTAL
Auto 21/95 7/45 13/1 41/141 0/49 26/79 0/4 3/123 29/255
CDO 29/3913 3/1875 132/2112 164/7900 3/1637 2/3227 69/1326 17/2552 91/8742
CMBS 22/2774 39/531 15/259 76/3564 93/76 142/47 188/128 26/188 449/439
Credit Card 1/91 28/58 7/20 36/169 0/1 0/6 0/34 0/5 0/46
RMBS 37/26663 19/9606 46/3683 102/39952 15/2988 53/13204 156/8053 70/15838 294/40083
Total 110/33536 96/12115 213/6075 419/51726 111/4751 223/16563 413/9545 116/18706 863/49565 3.9. Standard & Poor’s – US
2009:Q1 2009:Q2 2009:Q3 2009:Q4 TOTAL 2008:Q1 2008:Q2 2008:Q3 2008:Q4 TOTAL
Auto 1/49 15/24 73/14 89/87 6/80 6/74 2/1 12/12 26/167
CDO 8/1457 13/2841 4/943 25/5241 40/3231 31/1655 62/2501 120/3035 253/10442
CMBS 16/381 2/620 12/1471 30/2472 84/54 35/216 55/571 15/103 189/944
Credit Card 56/29 74/24 35/9 165/62 0/0 0/1 0/19 0/0 0/20
RMBS (prime) 0/1602 1/2792 0/4725 1/9119 80/85 31/637 7/677 39/88 157/1478
RMBS (subprime) 2/2678 0/1492 0/7091 2/11261 6/5433 3/2320 0/5083 29/123 38/12959
Total 83/6196 105/7793 124/14253 312/28242 216/8883 106/4903 126/8852 215/3361 663/26010 Source: Fitch Ratings, Moody’s Investors Service, Standard & Poor’s
1 Each box contains two numbers: Upgrades followed by Downgrades. Because the three credit rating agencies track different securities and apply slightly different rating criteria, these numbers are not directly comparable.
2 May include student loans, equipment leases, home equity, and other. 3 May include other types of RMBS transactions such as ALT-A, reverse mortgages, government RMBS, etc.

12
AFME / ESF SECURITISATION DATA REPORT
Q3 2009
4.1. European 3-5 Yr AAA CMBS Spreads1 4.2. European 3-5 Yr BBB CMBS Spreads1
4.3. US 3 & 5 Yr AAA CMBS Spreads2 4.4. US 3 & 5 Yr BBB CMBS Spreads2
1 Markit provides independent composite spread levels which are calculated from dealer contributions and are subject to multiple cleaning algorithms. These levels are equivalent to the ‘discount margin’ which is defined as the effective spread to maturity of a floating rate security after discounting the yield value of a price other than par over the life of a security.
2 US CMBS spreads are quoted for fixed rate bonds as the spread to the yield on US Treasury Bonds with the same average life as the CMBS bond. Note: Gaps in data availability occur in some places and result in linebreaks for those data series.

13
AFME / ESF SECURITISATION DATA REPORT
Q3 2009
5.1. European 3-5 Yr AAA RMBS Spreads1 5.2. European 3-5 Yr BBB RMBS Spreads1,2,3
5.3. UK 3-5 Yr AAA RMBS Spreads1 5.4. UK 3-5 Yr BBB RMBS Spreads1
1 Markit provides independent composite spread levels which are calculated from dealer contributions and are subject to multiple cleaning algorithms. These levels are equivalent to the ‘discount margin’ which is defined as the effective spread to maturity of a floating rate security after discounting the yield value of a price other than par over the life of a security.
2 French 3-5 year BBB RMBS credit spreads are unavailable. 3 German BBB spreads are unavailable due to insufficient information at time of publication. Note: Gaps in data availability occur in some places and result in linebreaks for those data series.

14
AFME / ESF SECURITISATION DATA REPORT
Q3 2009
6.1. European 1-4 Yr AAA ABS Spreads1 6.2. European 1-4 Yr BBB ABS Spreads1
6.3. US 3 Yr AAA ABS Spreads 6.4. US 3 Yr BBB ABS Spreads2
1 Markit provides independent composite spread levels which are calculated from dealer contributions and are subject to multiple cleaning algorithms. These levels are equivalent to the ‘discount margin’ which is defined as the effective spread to maturity of a floating rate security after discounting the yield value of a price other than par over the life of a security.
2 US 3 Yr Auto ABS BBB spreads are not available. Note: Gaps in data availability occur in some places and result in linebreaks for those data series.

15
AFME / ESF SECURITISATION DATA REPORT
Q3 2009
7.1. European 3-5 Yr AAA RMBS Prices1,2 7.2. European 3-5 Yr BBB RMBS Prices1,3
1. Spanish AAA RMBS provided: IM Pastor 3, Fondo de Titulizacion
Hipotecaria, Class A, Series 3. ISIN# ES0347862007. EUR-denominated.
2. Dutch AAA RMBS provided: Saecure 5 B.V. Class A, Series 1. ISIN# XS0217032738. EUR-denominated.
3. Italian AAA RMBS provided: Vela Home S.r.l. 3, Class A, Series 3. ISIN# IT0003933998. EUR-denominated.
4. German AAA RMBS provided: Hallam Finance plc, Class A, Series 1. ISIN# XS0206470865. EUR-denominated.
5. French AAA RMBS provided: FCC Loggias Compartment 2003, Class A, Series 1. ISIN# FR0010029231. EUR-denominated.
1. Spanish BBB RMBS provided: Hipocat 8, Fondo de Titulizacion Activos, Class D, Series 1: ISIN# ES0345784047. EUR-denominated.
2. Dutch BBB RMBS provided: Dutch Mortgage Portfolio Loans IV B.V., Class C, Series 1. ISIN# XS0194097670. EUR-denominated.
3. Italian BBB RMBS provided: Intra Mortgage Finance 1 S.r.l., Class 1, Series 1. ISIN# IT0003406003. EUR-denominated.
Note: French and German 3-5 Yr BBB RMBS data are not available.
7.3. UK 3-5 Yr AAA RMBS Prices1,4 7.4. UK 3-5 Yr BBB RMBS Prices1
1. UK AAA prime RMBS provided: Permanent Financing (No. 9) PLC, Class
4A, Series 9. ISIN# XS0248264060. EUR-denominated.
2. UK AAA subprime RMBS provided: First Flexible No. 4 Plc, Class A, Series 1. ISIN# XS0132692384. GBP-denominated.
1. UK BBB prime RMBS provided: Permanent Financing (No. 5) PLC, Class C, Series 5. ISIN# XS0197070831. GBP-denominated.
2. UK BBB subprime RMBS provided: Leek Finance Number Sixteen Plc, Class Cc, Series 1. ISIN# XS0232829332. EUR-denominated.
1 Markit prices: Independent composite prices levels are calculated from dealer contributions which have been subject to multiple cleaning algorithms for one sample bond per sector and ratings category where possible. According to the rules we have agreed on previously, the security we have chosen receives the greatest number of contributions for a bond matching the criteria and must receive at least 3 individual contributions. We have included data from the start of 2007 to present.
2 A composite level of prices for Germany 3-5 year AAA RMBS could not be formed after 7 July 2008. 3 A composite level of prices for Italy 3-5 year BBB RMBS could not be formed for after 11 August 2008. 4 The jump on 06 January 2008 is due to a new addition to the underlying bond, which was then averaged. Note: Gaps in data availability occur in some places and result in linebreaks for those data series.

16
AFME / ESF SECURITISATION DATA REPORT
Q3 2009
8.1. Pan-European 3-5 Yr AAA CMBS Prices1 8.2. Pan-European 3-5 Yr BBB CMBS Prices1
Pan-European AAA CMBS provided: Opera Finance (Lakeside) Plc, Class A, Series 1. ISIN# XS0198555202. GBP-denominated.
Pan-European BBB CMBS provided: German Residential Asset Note Distributor Plc, Class D, Series 1. ISIN# XS0260143101. EUR-denominated.
8.3. Pan-European 1-4 Yr AAA ABS Prices1 8.4. Pan-European 1-4 Yr BBB ABS Prices1
1. Pan-European AAA Auto ABS provided: Driver Two GmbH, Class A,
Series 1. ISIN# XS0228171673. EUR-denominated.
2. Pan-European AAA Credit Card ABS provided: Arran Funding Limited 2005-B, Class A3, Series 2005-B. ISIN# XS0237919195. GBP-denominated.
1. Pan-European BBB Credit Card ABS provided: Arran Funding Limited 2005-B, Class C3, Series 2005-B. ISIN# XS0237922140. GBP-denominated.
Note: Pan-European 1-4 Yr BBB Auto ABS price data is not available.
1 Markit prices: Independent composite price levels are calculated from dealer contributions which have been subjected to multiple cleaning algorithms for one sample bond per sector and ratings category where possible. According to the rules we have agreed on previously, the security we have chosen receives the greatest number of contributions for a bond matching the criteria and must receive at least 3 individual contributions. We have included data from start of 2007 to present. Note: Gaps in data availability occur in some places and result in linebreaks for those data series.

17
AFME / ESF SECURITISATION DATA REPORT
Q3 2009
9.1. Securitised Index Option Adjusted Spreads 9.2. ABX.HE and CMBX Prices1
1 Due to pricing convention changes occurring on 20 April 2009, ABX.HE and CMBS spreads are no longer available. Note: Gaps in data availability occur in some places and result in linebreaks for those data series.

18
AFME / ESF SECURITISATION DATA REPORT
Q3 2009
10.1. European Total Return RMBS AAA 10.2. European Total Return RMBS BBB
10.3. European ABS & CMBS Total Return AAA 10.4. Europe ABS & CMBS Total Return BBB

19
AFME / ESF SECURITISATION DATA REPORT
Q3 2009
€ BILLIONS1
11.1. European ABCP Historical Issuance2 Q1 Q2 Q3 Q4 TOTAL2
2004 28.2 29.7 35.8 37.8 131.5
2005 44.9 52.4 51.2 46.6 195.1
2006 61.6 65.8 76.1 84.7 288.2
2007 111.0 108.5 100.9 129.9 450.2
2008 75.0 66.8 73.8 86.2 301.8
2009 46.3 39.9 38.8 125.1
11.2. European ABCP Issuance by Nationality of Issuer345 2009:Q1 2009:Q2 2009:Q3 2009:Q4 TOTAL2 2008:Q1 2008:Q2 2008:Q3 2008:Q4 TOTAL2
France 6.9 5.6 5.5 18.0 5.1 8.4 13.4 30.0 56.9
Germany 7.8 9.0 7.1 9.9 33.8
Ireland 31.4 26.1 25.6 83.1 34.8 32.5 28.7 24.3 120.3
Italy 0.0 0.0 0.0 0.0
Luxembourg 0.1 0.1 0.1 0.2 0.3 0.3 0.2 0.2 1.0
Netherlands 6.3 1.4 0.6 0.8 9.1
Spain 0.0 0.3 0.0 0.3
UK 7.9 7.8 7.6 23.4 20.7 15.4 23.8 20.9 80.8
Total2 46.3 39.9 38.8 125.1 75.0 66.8 73.8 86.2 301.8
11.3. European ABCP Issuance by Programme Type 2009:Q1 2009:Q2 2009:Q3 2009:Q4 TOTAL2 2008:Q1 2008:Q2 2008:Q3 2008:Q4 TOTAL2
SIVs 0.4 0.3 1.3 2.0 6.6 4.6 0.6 0.6 12.5
Single-Seller Conduits 0.1 0.1 0.1 0.2 0.5 0.3 0.2 0.2 1.2
Multi-Seller Conduits 30.8 30.5 28.4 89.8 41.5 46.4 54.7 68.7 211.3
Unspecified 15.0 9.1 9.1 33.1 26.4 15.5 18.3 16.6 76.9
Total2 46.3 39.9 38.8 125.1 75.0 66.8 73.8 86.2 301.8
11.4. ABCP Outstandings by Nationality of Issuer 2009:Q1 2009:Q2 2009:Q3 2009:Q4 2008:Q1 2008:Q2 2008:Q3 2008:Q4
France 1.5 2.1 1.4 2.3 2.3 3.0 1.6
Germany 3.7 3.3 4.0 3.0
Ireland 7.8 6.6 9.2 10.1 10.1 8.9 8.1
Italy 0.0 0.0 0.0
Luxembourg 0.0 0.0 0.0 0.1 0.1 0.1 0.1
Netherlands 0.8 0.6 0.3 0.2
UK 2.3 2.3 2.6 9.6 5.9 6.5 1.4
European Total2,4 11.6 11.0 13.1 26.7 22.3 22.7 14.3
US Total1,2 451.0 415.7 367.0 318.4 327.0 392.7 462.7 Source: Dealogic, Moody’s Investors Service
1 All volumes are denominated in euro. The US volumes were converted from dollar to euro based on the $/€ exchange rates as of quarter-end. 2 Numbers may not add due to independent rounding. Historical or prior period numbers are revised to reflect changes in classification, refined selection methodology, or information submitted to our data source after the prior period cut-off dates.
3 Dealogic provides the issuer’s nationality as the country in which the SPV is domiciled. This data does not represent the seller-servicers of the underlying assets or the bank conduits for ABCP deals. 4 Outstanding data is restricted to nationality of the issuer to determine the country of collateral. Dealogic provides the issuer’s nationality as the country in which the SPV is domiciled.

20
AFME / ESF SECURITISATION DATA REPORT
Q3 2009
€ BILLIONS1
11.5. European ABCP Outstandings by Programme Type 2009:Q1 2009:Q2 2009:Q3 2009:Q4 2008:Q1 2008:Q2 2008:Q3 2008:Q4
SIVs 0.1 0.1 0.1 1.9 1.0 0.6 0.5
Single-Seller 0.0 0.0 0.0 0.2 0.1 0.1 0.1
Multi-Seller 7.7 8.5 9.5 15.2 15.1 16.3 9.9
Unspecified 3.8 2.4 3.5 9.4 6.1 5.8 3.8
Total 11.6 11.0 13.1 26.7 22.3 22.7 14.3
11.6. US ABCP Outstandings by Programme Type234 2009:Q1 2009:Q2 2009:Q3 2009:Q4 2008:Q1 2008:Q2 2008:Q3 2008:Q4
Loan-Backed 1.8 1.5 1.2 1.9 2.0 2.2 2.2
SIVs
Single-Seller 58.5 49.5 40.6 34.3 38.8 47.0 54.2
Multi-Seller 356.1 337.6 308.6 257.2 256.6 304.1 369.4
Unspecified5 34.6 27.1 16.6 25.0 29.7 39.5 36.9
Total1,3 451.0 415.7 367.0 318.4 327.0 392.7 462.7 Source: Dealogic, Moody’s Investors Service
1 All volumes are denominated in euro. The US volumes were converted from dollar to euro based on the $/€ exchange rates as of quarter-end. 2 Based on US ABCP programmes rated by Moody’s NY office ABCP Program Index, regardless of market. Therefore, some euro-denominated ABCP may be included in this figure. 3 Includes arbitrage and hybrid programme types.
11.7. ABCP Outstanding Assets Split by Country123 11.8. US ABCP to AA Non-financial CP Spread
Country
United States 25.7%
Global2 16.1%
United Kingdom 14.5%
Netherlands 11.2%
Germany 7.0%
Europe3 5.7%
France 4.0%
Others 15.7%
Total 100.0% Source: Moody’s Investors Service
1 Percentages shown are as of July 2009; all EMEA ABCP programmes. 2 Refers to ABCP with assets originating from multiple countries, at least one of which is outside Europe. 3 Refers to ABCP with assets originating from multiple European countries.

21
AFME / ESF SECURITISATION DATA REPORT
Q3 2009
€ BILLIONS1
12.1. Global Securitisation Issuance2 2009:Q1 2009:Q2 2009:Q3 2009:Q4 TOTAL1 2008:Q1 2008:Q2 2008:Q3 2008:Q4 TOTAL1
US 36.5 103.5 97.6 237.7 74.4 83.0 39.8 9.3 206.5
Europe 5.5 5.2 6.1 16.8 10.2 8.1 5.9 21.6 45.8
Asia 9.2 9.1 10.7 29.0 7.6 8.5 7.4 7.7 31.1
Total1 51.2 117.8 114.4 283.4 92.2 99.6 53.1 38.6 283.4
12.2. Global Corporate Bond Issuance34 2009:Q1 2009:Q2 2009:Q3 2009:Q4 TOTAL1 2008:Q1 2008:Q2 2008:Q3 2008:Q4 TOTAL1
US 200.2 130.8 79.0 410.0 104.2 138.3 36.7 123.7 402.9
Europe 318.1 262.5 144.4 725.0 91.0 222.8 97.3 131.7 542.9
Asia 92.8 103.8 98.8 295.5 40.6 62.3 52.0 60.0 214.9
Total1 611.2 497.2 322.2 1430.5 235.8 423.4 186.0 315.5 1160.7
12.3. Global Government Bond Issuance4 2009:Q1 2009:Q2 2009:Q3 2009:Q4 TOTAL1 2008:Q1 2008:Q2 2008:Q3 2008:Q4 TOTAL1
US 189.8 173.1 100.2 463.1 178.7 146.7 68.6 52.9 446.9
Europe 189.4 145.5 93.1 428.0 84.9 83.4 39.3 41.4 249.0
Asia 31.1 26.8 25.1 83.0 16.2 17.7 17.2 26.8 77.9
Total1 410.3 345.4 218.4 974.1 279.8 247.9 125.1 121.1 773.8 Source: Dealogic
1 US and Asian volumes were converted to euro based on the average exchange rate of the currency of issue to euro over each given quarter. Historical or prior period numbers are revised to reflect changes in classification, refined selection methodology, or information submitted to our data source after the prior period cut-off dates.
2 Global securitisation issuance includes ABS & MBS, both public and private placements, but excludes any retained volumes. Asia numbers include Japan. 3 Global corporate bond issuance is for investment grade bonds, public placements only. Asia numbers include Japan. 4 Global government bond issuance includes all agency and non agency issuances and does not include supranationals. Asia numbers include Japan.
22
AFME / ESF SECURITISATION DATA REPORT
Q3 2009
Summary of the Methodologies Adopted for this Report
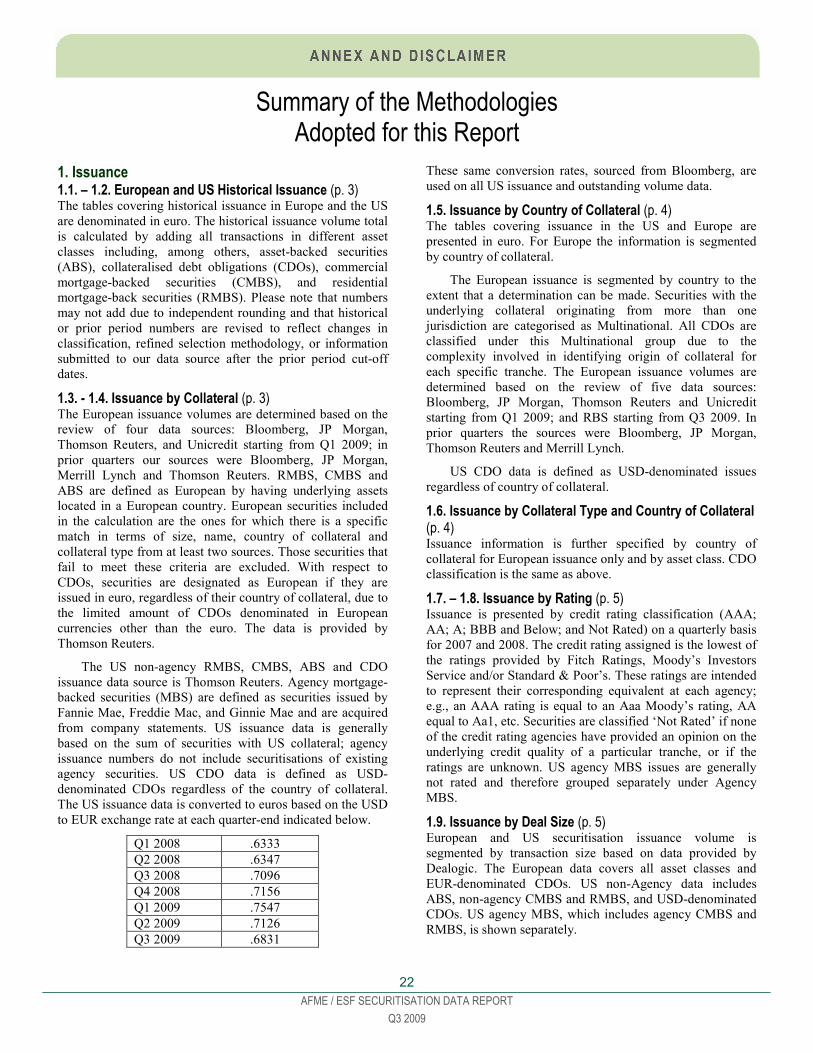
1. Issuance 1.1. – 1.2. European and US Historical Issuance (p. 3) The tables covering historical issuance in Europe and the US are denominated in euro. The historical issuance volume total is calculated by adding all transactions in different asset classes including, among others, asset-backed securities (ABS), collateralised debt obligations (CDOs), commercial mortgage-backed securities (CMBS), and residential mortgage-back securities (RMBS). Please note that numbers may not add due to independent rounding and that historical or prior period numbers are revised to reflect changes in classification, refined selection methodology, or information submitted to our data source after the prior period cut-off dates.
1.3. - 1.4. Issuance by Collateral (p. 3) The European issuance volumes are determined based on the review of four data sources: Bloomberg, JP Morgan, Thomson Reuters, and Unicredit starting from Q1 2009; in prior quarters our sources were Bloomberg, JP Morgan, Merrill Lynch and Thomson Reuters. RMBS, CMBS and ABS are defined as European by having underlying assets located in a European country. European securities included in the calculation are the ones for which there is a specific match in terms of size, name, country of collateral and collateral type from at least two sources. Those securities that fail to meet these criteria are excluded. With respect to CDOs, securities are designated as European if they are issued in euro, regardless of their country of collateral, due to the limited amount of CDOs denominated in European currencies other than the euro. The data is provided by Thomson Reuters.
The US non-agency RMBS, CMBS, ABS and CDO issuance data source is Thomson Reuters. Agency mortgage-backed securities (MBS) are defined as securities issued by Fannie Mae, Freddie Mac, and Ginnie Mae and are acquired from company statements. US issuance data is generally based on the sum of securities with US collateral; agency issuance numbers do not include securitisations of existing agency securities. US CDO data is defined as USD-denominated CDOs regardless of the country of collateral. The US issuance data is converted to euros based on the USD to EUR exchange rate at each quarter-end indicated below.
Q1 2008 .6333
Q2 2008 .6347
Q3 2008 .7096
Q4 2008 .7156
Q1 2009 .7547
Q2 2009 .7126
Q3 2009 .6831
These same conversion rates, sourced from Bloomberg, are used on all US issuance and outstanding volume data.
1.5. Issuance by Country of Collateral (p. 4) The tables covering issuance in the US and Europe are presented in euro. For Europe the information is segmented by country of collateral.
The European issuance is segmented by country to the extent that a determination can be made. Securities with the underlying collateral originating from more than one jurisdiction are categorised as Multinational. All CDOs are classified under this Multinational group due to the complexity involved in identifying origin of collateral for each specific tranche. The European issuance volumes are determined based on the review of five data sources: Bloomberg, JP Morgan, Thomson Reuters and Unicredit starting from Q1 2009; and RBS starting from Q3 2009. In prior quarters the sources were Bloomberg, JP Morgan, Thomson Reuters and Merrill Lynch.
US CDO data is defined as USD-denominated issues regardless of country of collateral.
1.6. Issuance by Collateral Type and Country of Collateral (p. 4) Issuance information is further specified by country of collateral for European issuance only and by asset class. CDO classification is the same as above.
1.7. – 1.8. Issuance by Rating (p. 5) Issuance is presented by credit rating classification (AAA; AA; A; BBB and Below; and Not Rated) on a quarterly basis for 2007 and 2008. The credit rating assigned is the lowest of the ratings provided by Fitch Ratings, Moody’s Investors Service and/or Standard & Poor’s. These ratings are intended to represent their corresponding equivalent at each agency; e.g., an AAA rating is equal to an Aaa Moody’s rating, AA equal to Aa1, etc. Securities are classified ‘Not Rated’ if none of the credit rating agencies have provided an opinion on the underlying credit quality of a particular tranche, or if the ratings are unknown. US agency MBS issues are generally not rated and therefore grouped separately under Agency MBS.
1.9. Issuance by Deal Size (p. 5) European and US securitisation issuance volume is segmented by transaction size based on data provided by Dealogic. The European data covers all asset classes and EUR-denominated CDOs. US non-Agency data includes ABS, non-agency CMBS and RMBS, and USD-denominated CDOs. US agency MBS, which includes agency CMBS and RMBS, is shown separately.

23
AFME / ESF SECURITISATION DATA REPORT
Q3 2009
All data, except for CDOs, is included according to the country of collateral. The number of issues refers to the number of deals, not the number of tranches within each deal.
Dealogic data for retained deals is based on available information from both European and US dealers’ syndicate desks. Further statistics on retained deals are added based on intelligence from other market participants such as regulatory bodies and newswires across Europe.
2. Balances Outstanding 2.1. – 2.2. Outstandings by Collateral (p. 6) The outstanding volumes are reported by asset class. Please note that subtotals may not add to totals due to independent rounding and that historical or prior period numbers are revised to reflect changes in classification, refined selection methodology, or information submitted to our data source after the prior period cut-off dates.
For Europe, balances outstanding are calculated by the principal balance outstanding on structured product transactions including public, private, rated, unrated, listed and unlisted securities derived from the Bloomberg database. Balances outstanding are determined by multiplying eligible securities by their pool factor for the quarter and sorted accordingly. Tranches that are non-EUR-denominated are converted to EUR by Bloomberg based on the exchange rate at the time of the pricing date (as specified by the lead manager/arranger), or, if missing, the issue date as specified in each security’s original offering documentation. Securities included in the calculations, except for some CDOs, have collateral originating from at least one European country to the extent that a determination can be made. However, for ABS and MBS securities with collateral originating from multiple countries, or where the origin of the underlying collateral is undefined, the following selection criteria will apply: securities will only be considered eligible as European if they are denominated in a European currency, as defined below, and the country of issuer (considered to be the country in which the issuing SPV is registered) falls within Europe. In certain limited cases, the Channel Islands and the Cayman Islands are considered eligible as European jurisdictions for ABS and MBS products if underlying collateral is derived from a variety of jurisdictions and the original currency of issue is EUR only.
For our selection criteria, European currencies include the euro (EUR) and all predecessor currencies, as well as the Turkish lira (TRY), the Danish kroner (DKK), the Swedish krona (SEK), the British pound (GBP), and the Russian ruble (RUB).
Furthermore, our selection criteria consider Europe to include all European Economic Area (EEA) countries and certain non-EEA countries located on the geographic European continent. We have included Turkey, Kazakhstan, Iceland, Georgia and the Russian Federation in these criteria.
For the CDO sector, only EUR-denominated issuance is included, regardless of the country of collateral, due to the
limited amount of CDOs denominated in European currencies other than the euro. However, the majority of US-issued, EUR-denominated CDOs with known non-European collateral have been excluded from consideration based on consultation with market participants at the time of the Q3 2007 Data Report production. Subsequent to this time, all EUR-denominated CDOs are included irrespective of the country of collateral, in order to maximise the consistency of the deal selection criteria for inclusion.
CDO information does not include the notional amount of transactions referenced to bespoke portfolios of credit default swaps, which are called “single tranche” or “synthetic arbitrage CDOs” which can be found at www.creditflux.com.
The US outstanding calculations are based on information derived from Bloomberg for ABS; agency balance statements for agency MBS; Loan Performance for non-agency RMBS; and Federal Reserve and JP Morgan for non-agency CMBS. Specific assumptions are developed for prepayment and amortisation frequency based on consultations with the US dealer community. The following asset classes are segmented: agency MBS, non-agency RMBS, non-agency CMBS, and ABS. The agency MBS figures include both RMBS and CMBS. The ABS classification for the US includes CDOs, which contains USD-denominated CDOs regardless of the country of collateral. Non-agency CMBS does not include multifamily housing, which is included among outstanding MBS numbers.
2.3. Outstandings by Country of Collateral (p. 7) The European outstanding volumes are segmented by country of collateral based on the above methodology. For our selection criteria, Europe is considered to include all European Economic Area (EEA) countries and certain non-EEA countries located on the geographic European continent. We have included Georgia, Iceland, Turkey, Kazakhstan and the Russian Federation in these criteria. In certain limited cases, the Channel Islands and the Cayman islands are considered eligible for ABS and MBS products if underlying collateral is derived from a variety of jurisdictions and the original currency of issue is EUR only. CDOs issued with collateral from non-European jurisdictions but issued in euro are included under the country category ‘Other’ for the purpose of determining outstanding balances by country. CDOs issued in EUR with either collateral from multiple jurisdictions or for which the underlying location of collateral is undefined are categorized under ‘Multinational’ for the purpose of determining outstanding balances by country. However, the majority of US-issued, EUR-denominated CDOs with known non-European collateral have been excluded from consideration based on consultation with market participants at the time of the Q4 2007 first Data Report production. Subsequent to this time, all EUR-denominated CDOs are included irrespective of the country of collateral, in order to maximise the consistency of the deal selection criteria for inclusion.

24
AFME / ESF SECURITISATION DATA REPORT
Q3 2009
The US outstandings include both agency and non-agency securities.
2.4. – 2.5. Outstandings by Moody’s Rating (p. 8) The percentage rating distribution for Europe and the US is based on Moody’s Investors Service data for balances outstanding. The data provides current ratings as of the end of the quarter. The data presented is based on original issuance volumes for European and US securities, and therefore does not reflect amortised balances. Information on current ratings by outstanding volumes is not currently available. Moody’s data has been converted to percentages based on the original issuance size to make it easily comparable with the outstanding volumes provided in this report. Defaulted and unrated issues are excluded from this data.
2.6. Outstandings by Country and Collateral (p. 9) Outstanding volumes are further specified by asset class and, for Europe only, by country of collateral. CDO selection criteria are the same as above.
3. Credit Quality – Rating Changes 3.1. – 3.3. Upgrades/Downgrades by Country (p. 10) These tables present the aggregate number of upgrades and downgrades for securitisation (including CDOs) by country of collateral for European deals and in total for US deals. The information is based on data provided by Fitch Ratings, Moody’s Investors Service and Standard & Poor’s. The upgrade number is shown first followed by the downgrade number. The upgrades and downgrades of each of credit rating agency is shown in separate tables and presented as the number of rating changes. Because the credit rating agencies track different securities and apply different credit rating methodologies, these numbers are not directly comparable.
According to Moody’s Investors Service, a security is classified as European or American based on if it is monitored out of Moody’s office in Europe or the US. More specifically, European securities are classified within a particular country if all of its assets are located within that country.
The Multinational category includes CDOs and all other cross-jurisdictional securitisations for both Moody’s Investors Service and Standard & Poor’s. The Fitch Ratings Multinational classification includes cross-jurisdictional CMBS as well as the aggregated sum of rating actions in other countries including Austria, Belgium, Greece, Ireland, Portugal and the Russian Federation. Fitch Ratings assigns CDO issues to the country in which the majority of the underlying assets are located.
3.4. – 3.9. Upgrades/Downgrades by Collateral (p. 11) These tables present aggregate upgrades and downgrades for securitisation and CDO issues by securitised product type for Europe and the US. The upgrade number is shown first followed by the downgrade number. The upgrades and downgrades of each agency are shown in separate tables and presented by number rating changes. For Fitch Ratings, the
category Other RMBS includes other categories of RMBS transactions such as ALT-A, reverse mortgage, government RMBS, etc. The category ‘Other ABS’ may include student loans and the whole business securitisations (WBS). For Moody’s Investors Service and Standard & Poor’s, the total number of European upgrades/downgrades reported by collateral type are not always comparable with the upgrades/downgrades presented by country because there may be securities that experience rating migrations that are backed by collateral originated from a country outside of those specified and will not be captured under the “Multinational” category.
4 - 6 Spreads 4.1. - 4.4. CMBS Spreads (p. 12) These graphs present credit spread data for European and US AAA and BBB 3-5 Yr CMBS. European 3-5 year AAA & BBB CMBS data is provided by Markit. Composite spread levels are calculated from dealer contributions which have been subjected to multiple cleaning algorithms. Spread levels are equivalent to the discount margin. The discount margin is defined as the effective spread to maturity of a floating rate security after discounting the yield value of a price other than par over the life of the security. The spread calculation is based on data provided by dealer trading desks.
US CMBS 3 and 5 year spreads are provided by Trepp LLC. US CMBS spreads are quoted as fixed rate bonds based on the yield of US treasury bonds with the same average life.
5.1. - 5.5. RMBS Spreads (p. 13) European RMBS credit spreads are provided for 3-5 year AAA and BBB securities based on data provided by Markit. European credit spreads cover Spain, Netherlands, Italy, Germany and France. The UK RMBS spreads are provided for both prime and non-conforming transactions. Markit spread calculations are based on data provided by dealer trading desks.
US subprime AAA home equity credit spreads are calculated over LIBOR and provided by Barclays Capital.
6.1. - 6.4. ABS Spreads (p. 14) European ABS credit spreads are provided for 1-4 year AAA and BBB securities based on data provided by Markit based on the same calculations described above.
US spreads reflect levels for AAA autos, AAA credit cards, and BBB credit cards; spreads are fixed against swaps and are provided by JP Morgan.
7 - 8 Prices 7.1. – 7.4. RMBS Prices (p. 15) These graphs represent price data for specific European and UK RMBS selected as benchmarks in the respective jurisdictions. The price calculations are provided by Markit and are based on data provided by dealer trading desks.

25
AFME / ESF SECURITISATION DATA REPORT
Q3 2009
8.1. - 8.4. CMBS and ABS Prices (p. 16) These graphs represent price data for specific pan-European CMBS and ABS selected as benchmarks in the respective jurisdictions. The price calculations provided by Markit and are based on data provided by dealer trading desks.
9.1. - 9.2. Indices Data (p. 17) The first graph presents daily spreads provided by Barclays Capital for Europe and US ABS indexes from a cross-section of securitised products.
The second graph presents daily prices provided by Markit for the benchmark AAA and BBB rated US ABX and CMBX derivative indices. The ABX (ABX.HE) is an index from reference obligations issued by twenty issuers of RMBS that meet the criteria specified in the ABX.HE Index Rules. The majority of the mortgages backing the security underlying must be first-liens. The index calculation is based on the Markit proprietary methodology calculating the contributed prices from dealers. The CMBX follows a similar methodology as an index for credit derivatives of US CMBS issues. The ABX and CMBX are widely followed benchmarks in the securitised marketplace for subprime RMBS and CMBS market sectors, respectively.
10 Total Return Benchmark Data 10.1. – 10.4. Total Return Data (p. 18) These graphs represent historical return composites generated by tracking the aggregate asset value on an underlying portfolio of single name bonds. Total Return data is provided by Markit and more information is available at http://www.markit.com/en/products/data/structured-finance/euro-abs-tra.page.
11. Asset-Backed Commercial Paper (ABCP) 11.1. – 11.2. ABCP Historical Issuance; ABCP Issuance by Nationality of Issuer (p. 19) Aggregate issuance data covers the period 2008 through 2009 for Europe and the US. European issuance is provided by Dealogic, which identifies the issuer’s nationality as the country in which the SPV is domiciled. These data do not represent the seller-servicers of the underlying assets or the bank conduits for the ABCP deals. The US data is provided by Moody’s Investors Service. The volumes are converted from dollar to euro based on the end-of-quarter exchange rate.
11.3. European ABCP Issuance by Programme Type (p. 19) ABCP data by programme type is provided by Dealogic and covers the period from 2008 through 2009 for Europe. The programme type classifications included are: SIVs, single-seller conduit, multi-seller conduit and ‘unspecified’.
11.4. ABCP Outstandings by Nationality of Issuer (p. 19) Outstanding quarterly data is provided from the first quarter of 2008 through 2009 for Europe and the US. The European outstanding is provided by country through the Dealogic database, and the US data is provided by Moody’s Investors
Service. Dealogic identifies the issuer’s nationality as the country in which the SPV is domiciled. The dollar volumes were converted to euro based on the end-of-quarter exchange rate.
11.5. – 11.6. ABCP Outstandings by Programme Type (p. 20) Outstanding quarterly data is provided from the first quarter of 2008 through 2009 for Europe and the US. The European data is provided by Dealogic and the US data is provided by Moody’s Investor Service. The volumes are converted from dollars to euro based on the end-of-quarter exchange rate. The programme type classifications included are: loan-backed, SIVs, single-seller conduit, multi-seller conduit and ‘unspecified’.
11.7. ABCP Outstanding Assets Split by Country (p. 20) Global outstanding ABCP assets percentages are presented by country as of June 2008. The information is provided by Moody’s Investors Service. The asset percentage represents the actual amount of assets funded via ABCP and other sources, not including cash and short-term investments. Therefore the asset percentage is not necessarily equal to the ABCP outstanding amount.
11.8. ABCP Spreads (p. 20) The US ABCP spread information is based on data collected and developed by the Federal Reserve. The spread is defined as the difference between AA ABCP and AA nonfinancial CP.
12. Global Comparative Data (p. 21) 12.1. - 12.3. Global Securitisation Issuance, Global Corporate Bond Issuance, Global Government Bond Issuance (p. 21) These statistics are provided by Dealogic and present issuance volumes for securitisation, corporate bonds and government bonds in Asia, the US and Europe. Securitisation and government bond figures represent gross issuance; corporate bond issuance is provided on a gross, not net, basis. All types of securitisation are included; CDOs are included based on the region of the currency in which they are denominated. The issuance volumes are provided quarterly for 2007 and 2008. These statistics do not correspond to the issuance numbers provided elsewhere in this report as different sources and selection methodologies are used to determine both the European and US securitisation issuance. In terms of geographical description, Europe represents the European, the Middle East and African (EMEA) countries while Asia includes the Pacific countries and Japan.
13. Commentary Sources (p. 1) European Central Bank, “Survey on the access to finance of small and medium-sized enterprises in the euro area”, September 2009, www.ecb.int
European Central Bank, “The Euro Area Bank Lending Survey”, October 2009, www.ecb.int
26
AFME / ESF SECURITISATION DATA REPORT
Q3 2009
Eurostat, Statistics, http://epp.eurostat.ec.europa.eu/portal/page/portal/eurostat/home
Federal Reserve Bank of New York, Markets, newyorkfed.org
Fitch Ratings, “ABCP Conduits and Basel II – An Update”, 19 October 2009, www.fitchratings.com
Fitch Ratings, “EMEA Structured Finance Sector Outlook – October 2009”, 26 October 2009, www.fitchratings.com
International Monetary Fund, “Global Financial Stability Report - Navigating the Financial Challenges Ahead”, October 2009, www.imf.org
Disclaimer The information and opinion commentary in this Securitisation Quarterly Report (Report) was prepared by the securitisation division of the Association for Financial Markets in Europe (AFME / ESF) and the Securities Industry and Financial Markets Association (SIFMA). AFME / ESF and SIFMA believe that the information in the Report, which has been obtained from multiple sources believed to be reliable, is reliable as of the date of publication. In no event, however, does either of AFME / ESF and SIFMA make any representation as to the accuracy or completeness of such information. AFME / ESF and SIFMA have no obligation to update, modify or amend the information in this Report or to otherwise notify readers if any information in the Report becomes outdated or inaccurate. AFME / ESF and SIFMA will make every effort to include updated information as it becomes available and in subsequent reports. As information is collected from multiple sources and estimates by the individual sources may differ from one another, estimates for similar types of data could vary within the Report.


AFME / ESF
Rick Watson, Managing Director
Marco Angheben, Director
Anna Zennaro, Associate www.afme.eu
SIFMA
Kyle Brandon, Managing Director, Research
Sharon Sung, Research Analyst www.sifma.org
www.afme.eu