section 6.3 confidence intervals for population proportions larson/farber 4th ed
TRANSCRIPT

Section 6.3
Confidence Intervals for Population Proportions
Larson/Farber 4th ed
Section 6.3 Objectives
• Find a point estimate for the population proportion• Construct a confidence interval for a population
proportion• Determine the minimum sample size required when
estimating a population proportion
Larson/Farber 4th ed

Point Estimate for Population p
Population Proportion• The probability of success in a single trial of a
binomial experiment. • Denoted by p
Point Estimate for p• The proportion of successes in a sample. • Denoted by
read as “p hat”
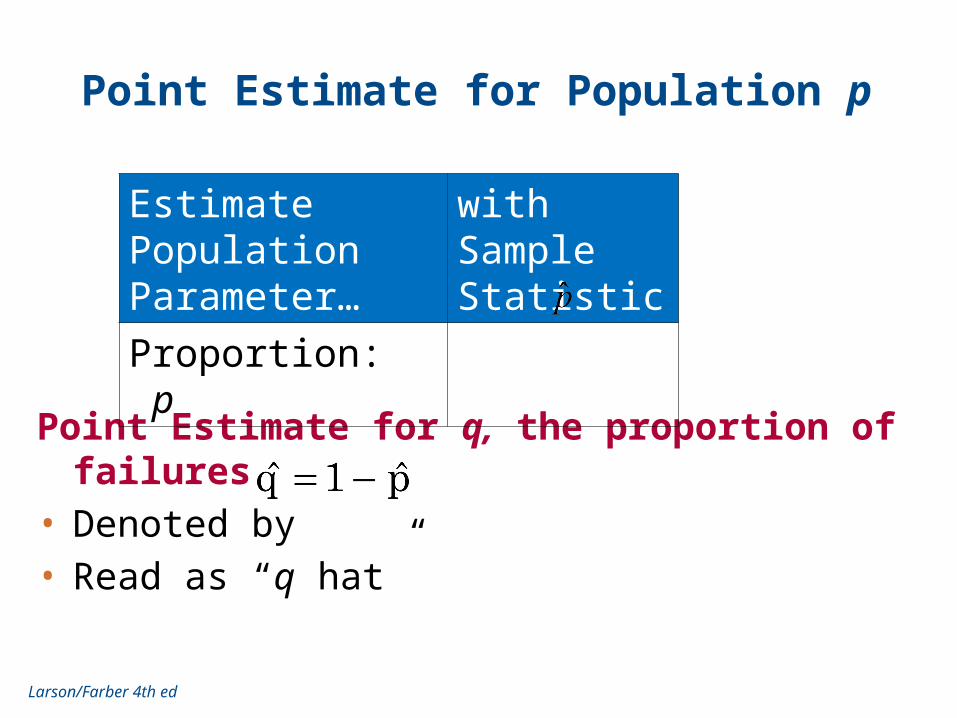
Point Estimate for Population p
Point Estimate for q, the proportion of failures • Denoted by • Read as “q hat”
Estimate Population Parameter…
with Sample Statistic
Proportion: p
Larson/Farber 4th ed

Example: Point Estimate for p
In a survey of 458 U.S. adults 224 said that they eat meat daily. Find a point estimate for the population proportion of U.S. adults who say they eat meat daily. (Adapted from Greenfield Online)
Solution: n = 458 and x = 224
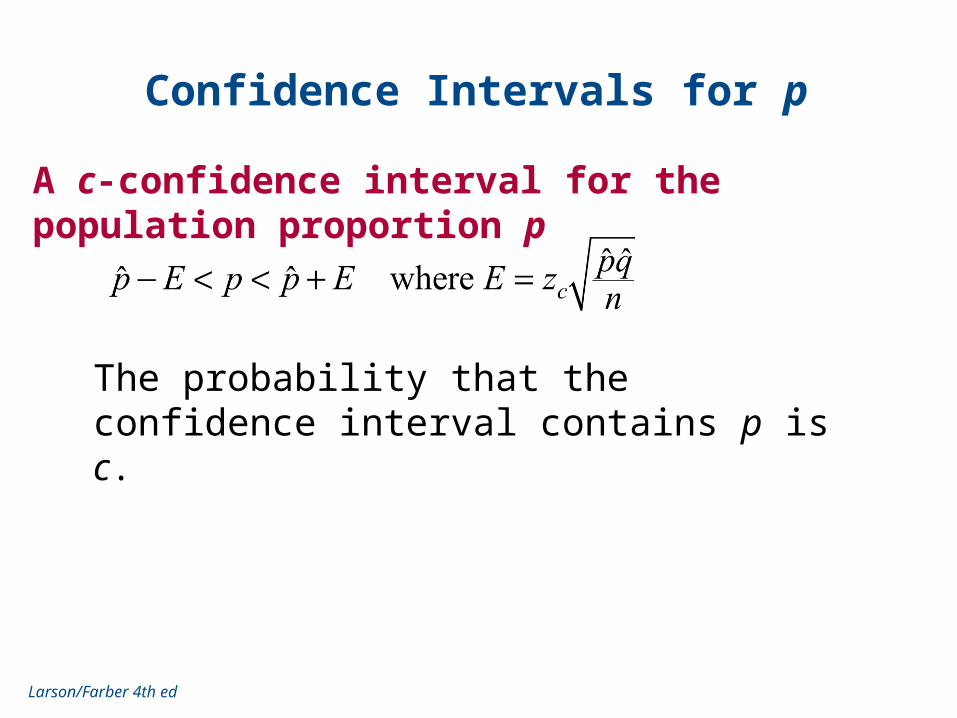
Confidence Intervals for p
A c-confidence interval for the population proportion p
Larson/Farber 4th ed
The probability that the confidence interval contains p is c.
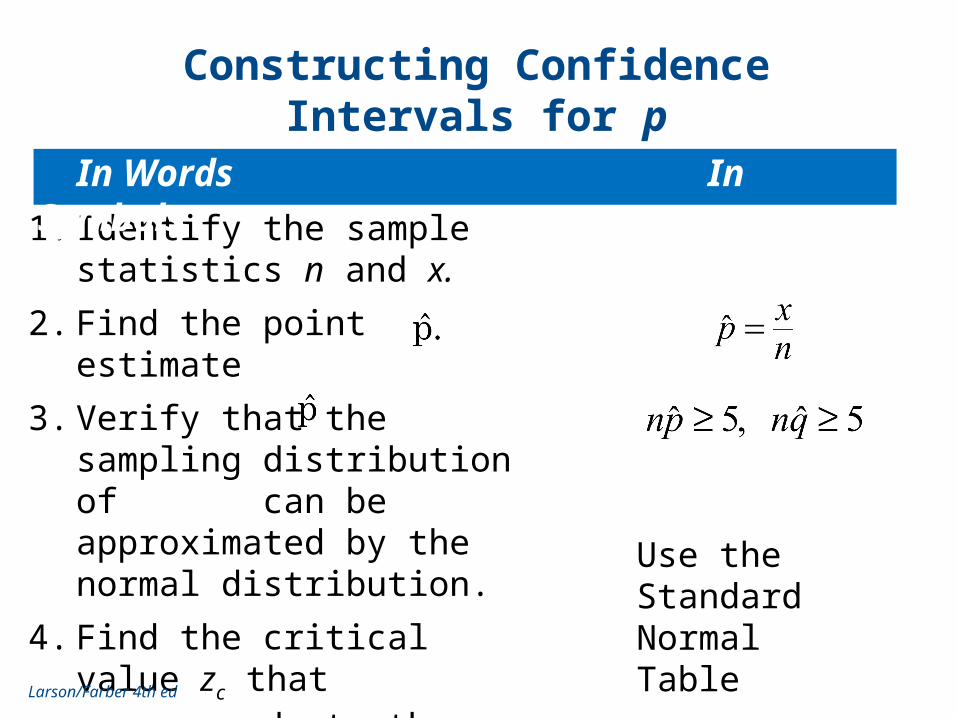
Constructing Confidence Intervals for p
1. Identify the sample statistics n and x.
2. Find the point estimate
3. Verify that the sampling distribution of can be approximated by the normal distribution.
4. Find the critical value zc that corresponds to the given level of confidence c.
Use the Standard Normal Table
Larson/Farber 4th ed
In Words In Symbols
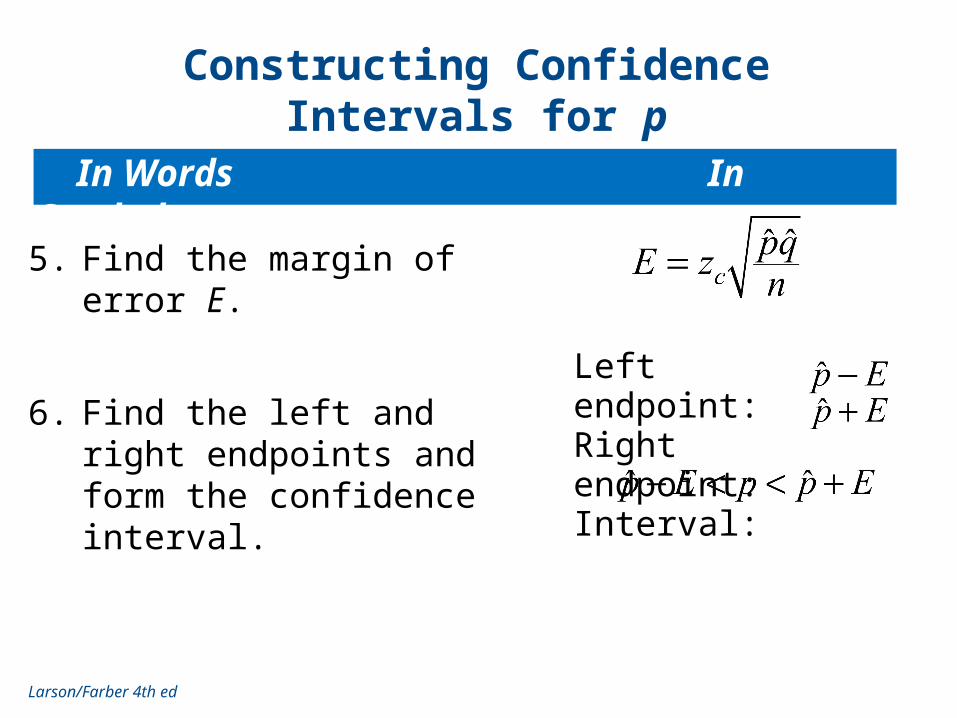
Constructing Confidence Intervals for p
5. Find the margin of error E.
6. Find the left and right endpoints and form the confidence interval.
Left endpoint: Right endpoint: Interval:
Larson/Farber 4th ed
In Words In Symbols
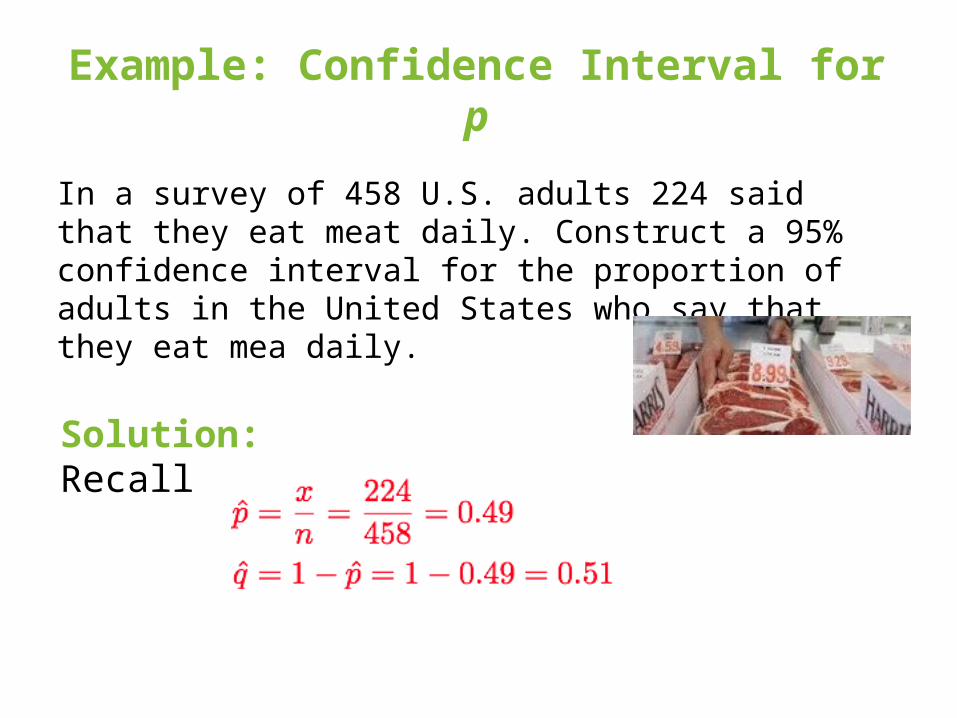
Example: Confidence Interval for p
In a survey of 458 U.S. adults 224 said that they eat meat daily. Construct a 95% confidence interval for the proportion of adults in the United States who say that they eat mea daily.
Solution: Recall

Solution: Confidence Interval for p
• Verify the sampling distribution of can be approximated by the normal distribution
• Margin of error:
Solution: Confidence Interval for p
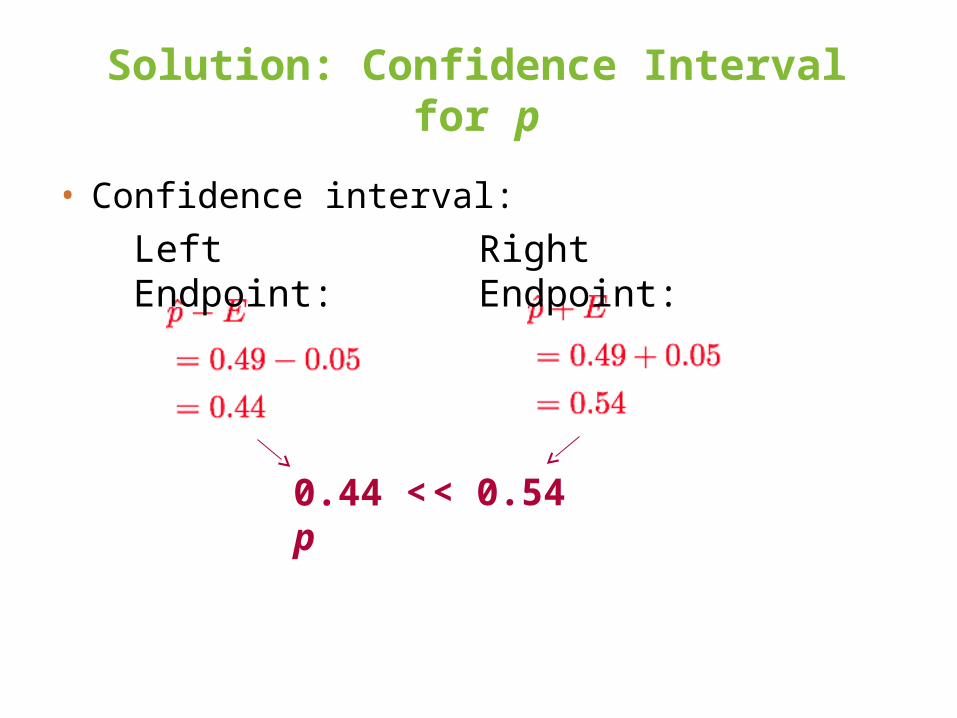
• Confidence interval:
Left Endpoint: Right Endpoint:
0.44 < p < 0.54
Solution: Confidence Interval for p
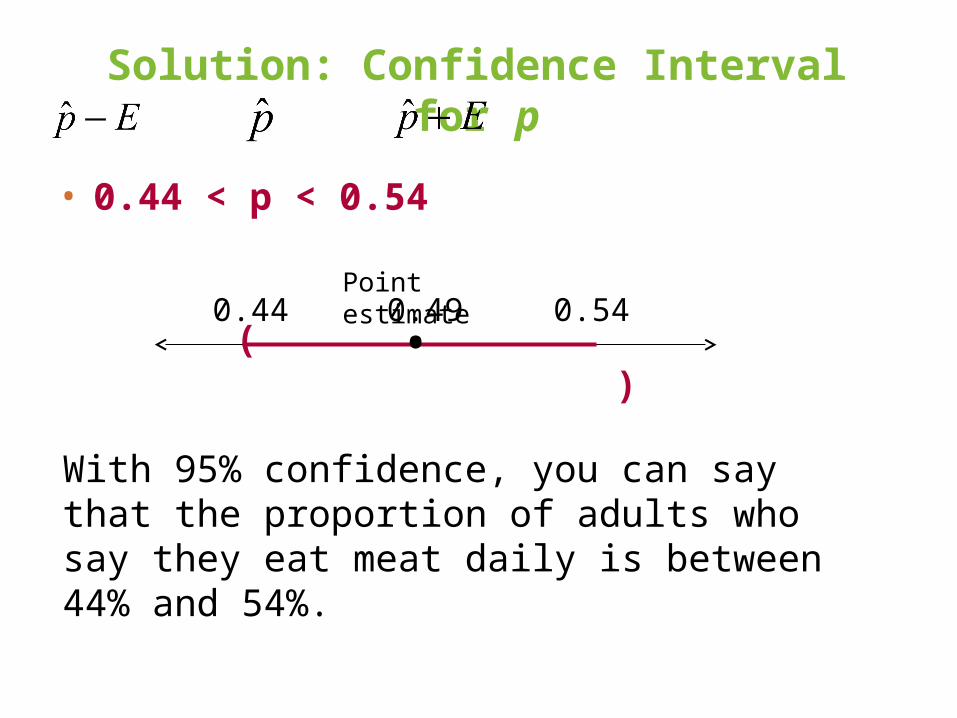
• 0.44 < p < 0.54
With 95% confidence, you can say that the proportion of adults who say they eat meat daily is between 44% and 54%.
( )• 0.490.44 0.54
Point estimate
Sample Size
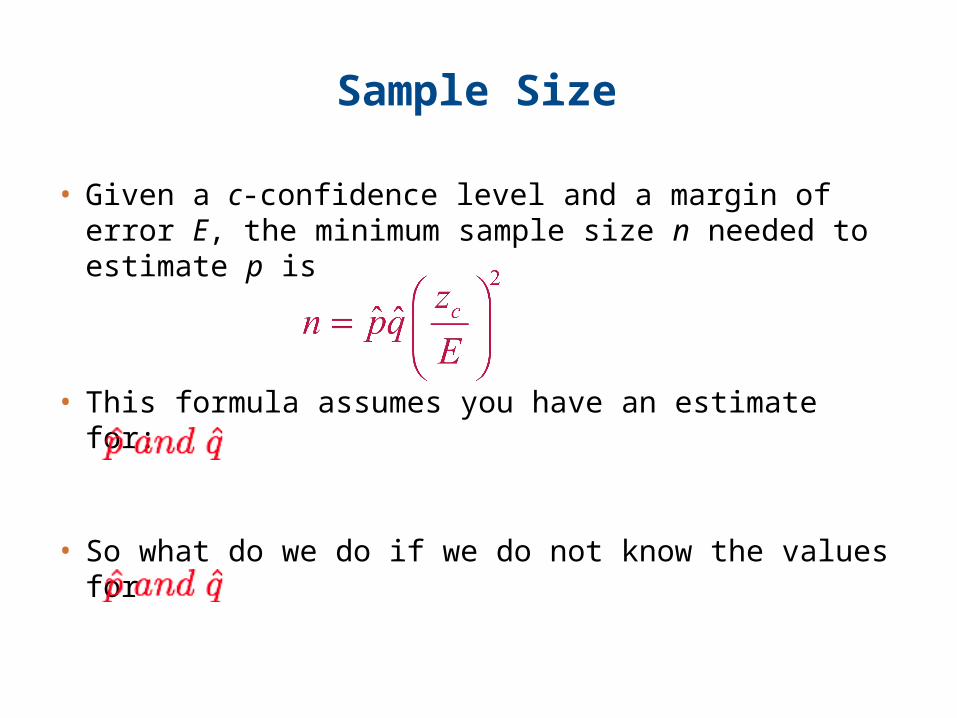
• Given a c-confidence level and a margin of error E, the minimum sample size n needed to estimate p is
• This formula assumes you have an estimate for:
• So what do we do if we do not know the values for
Sample Size
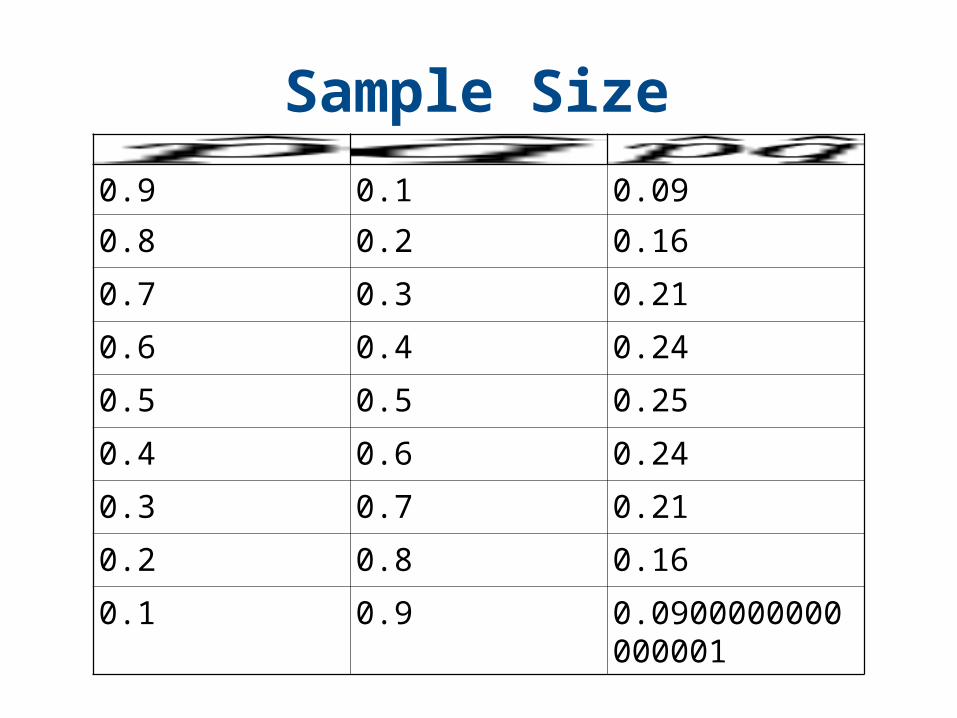
0.9 0.1 0.09
0.8 0.2 0.16
0.7 0.3 0.21
0.6 0.4 0.24
0.5 0.5 0.25
0.4 0.6 0.24
0.3 0.7 0.21
0.2 0.8 0.16
0.1 0.9 0.0900000000000001
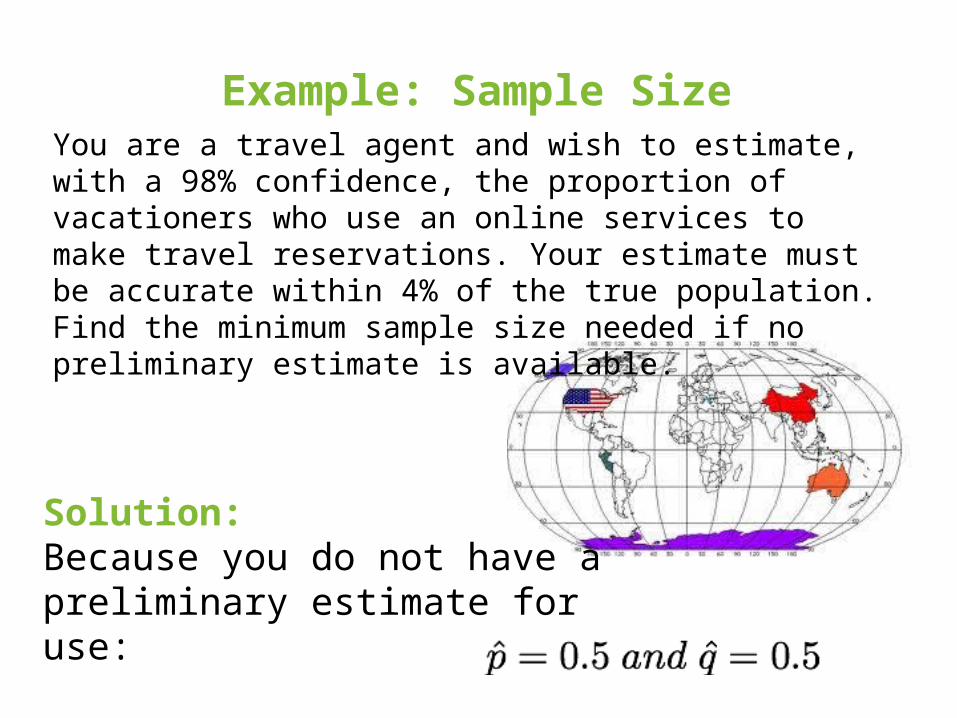
Example: Sample SizeYou are a travel agent and wish to estimate, with a 98% confidence, the proportion of vacationers who use an online services to make travel reservations. Your estimate must be accurate within 4% of the true population. Find the minimum sample size needed if no preliminary estimate is available.
Solution: Because you do not have a preliminary estimate for use:
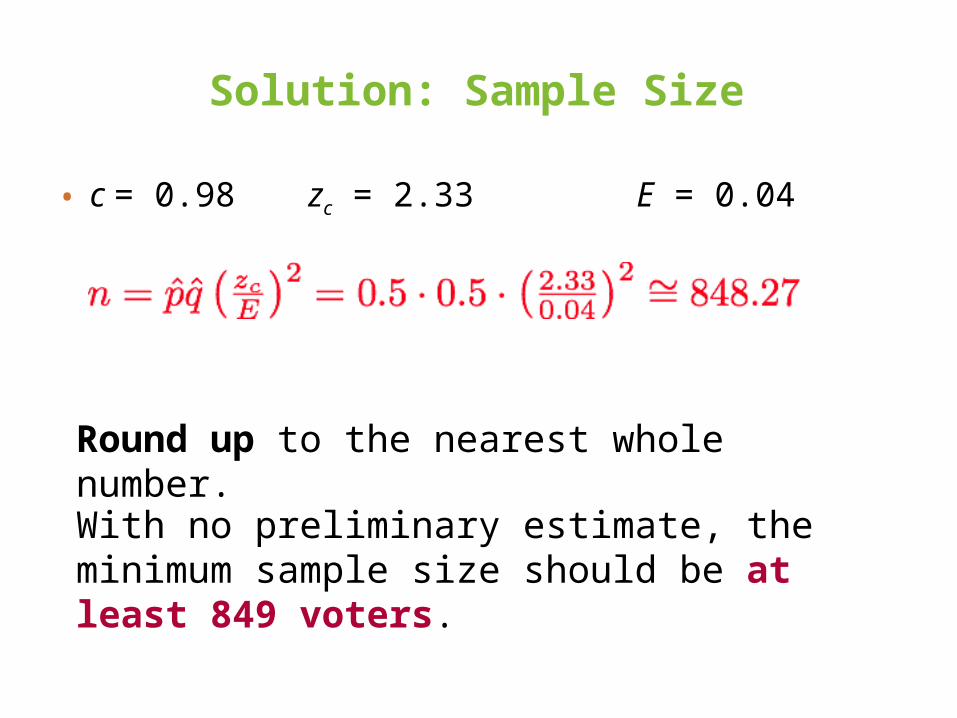
Solution: Sample Size
• c = 0.98 zc = 2.33 E = 0.04
Round up to the nearest whole number.
With no preliminary estimate, the minimum sample size should be at least 849 voters.
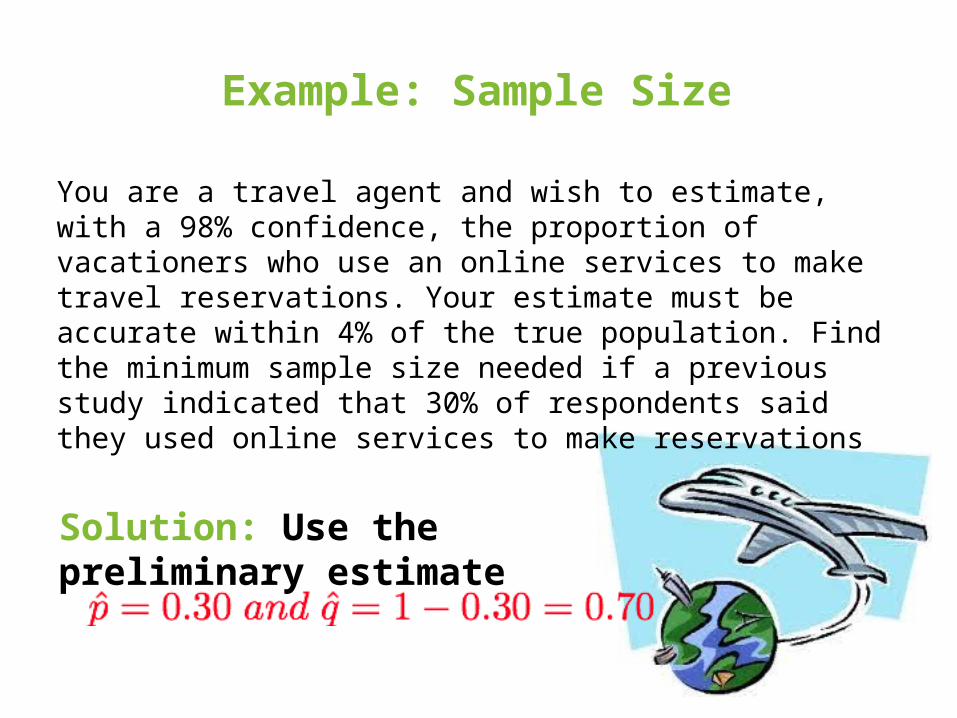
Example: Sample Size
You are a travel agent and wish to estimate, with a 98% confidence, the proportion of vacationers who use an online services to make travel reservations. Your estimate must be accurate within 4% of the true population. Find the minimum sample size needed if a previous study indicated that 30% of respondents said they used online services to make reservations
Solution: Use the preliminary estimate
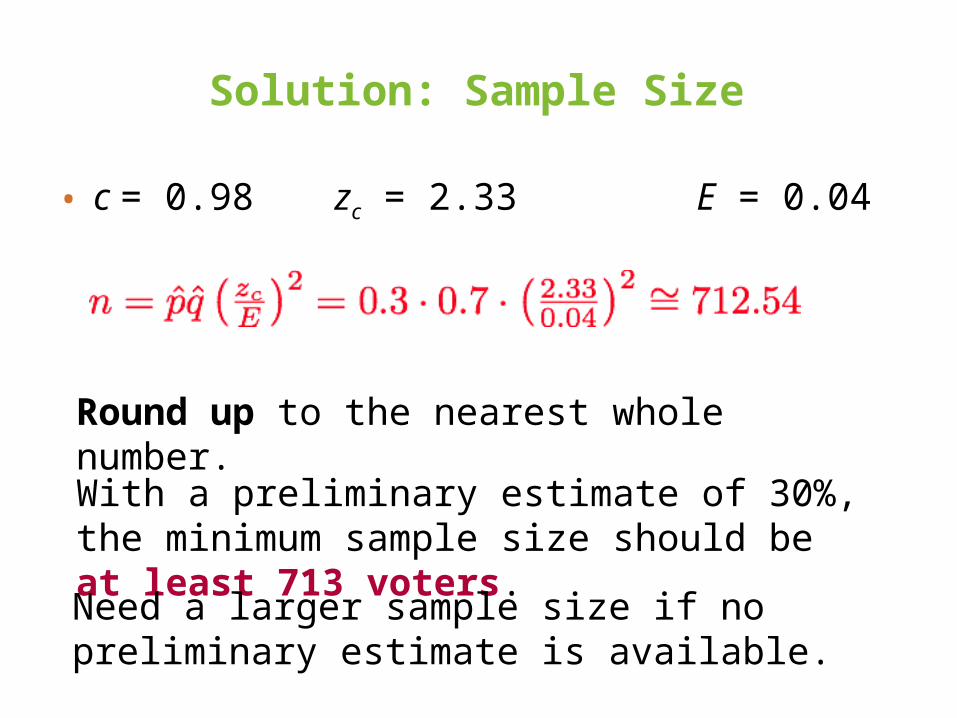
Solution: Sample Size
• c = 0.98 zc = 2.33 E = 0.04
Round up to the nearest whole number.
With a preliminary estimate of 30%, the minimum sample size should be at least 713 voters.
Need a larger sample size if no preliminary estimate is available.
Section 6.3 Summary
• Found a point estimate for the population proportion• Constructed a confidence interval for a population
proportion• Determined the minimum sample size required when
estimating a population proportion• HW 6.3: 1 - 27 EO