section 3.2 logarithmic functions & their graphs
TRANSCRIPT

SECTION 3 .2
Logarithmic Functions & Their Graphs

Log Functions & Their Graphs
In the previous section, we worked with exponential functions.
What did the graph of these functions look like?
xa (x) f xe (x) f 1 -x 2 (x) f

Log Functions & Their Graphs
Earlier in the year, we covered “inverse functions”
Do exponential functions have an inverse?
By looking at the graphs of exponential functions, we notice that every graph passes the horizontal line test.
Therefore, all exponential functions have an inverse

Log Functions & Their Graphs
The inverse of an exponential function with base a is called the logarithmic function with base a
For x > 0, a > 0 and a ≠ 1
ya a x ifonly and if x Log y
ya a x x Log y
Log Functions & Their Graphs
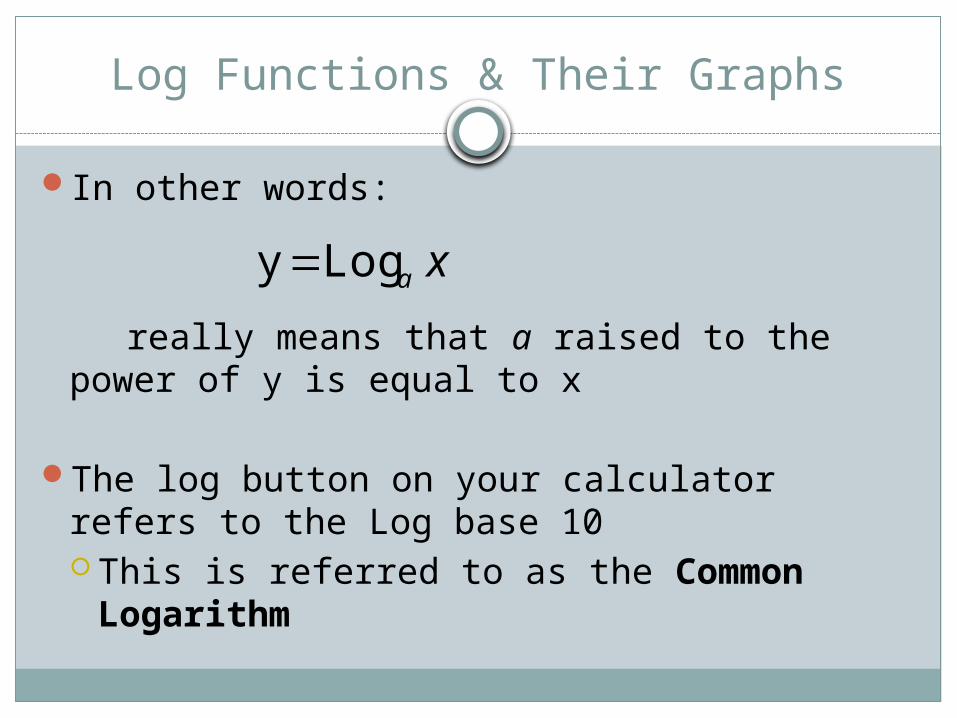
In other words:
really means that a raised to the power of y is equal to x
The log button on your calculator refers to the Log base 10 This is referred to as the Common Logarithm
xa Log y

Log Functions & Their Graphs
Another common logarithm is the Log base e
This is referred to as the Natural Logarithmic Function
This function is denoted:
xln y xLog y e
Log Functions & Their Graphs
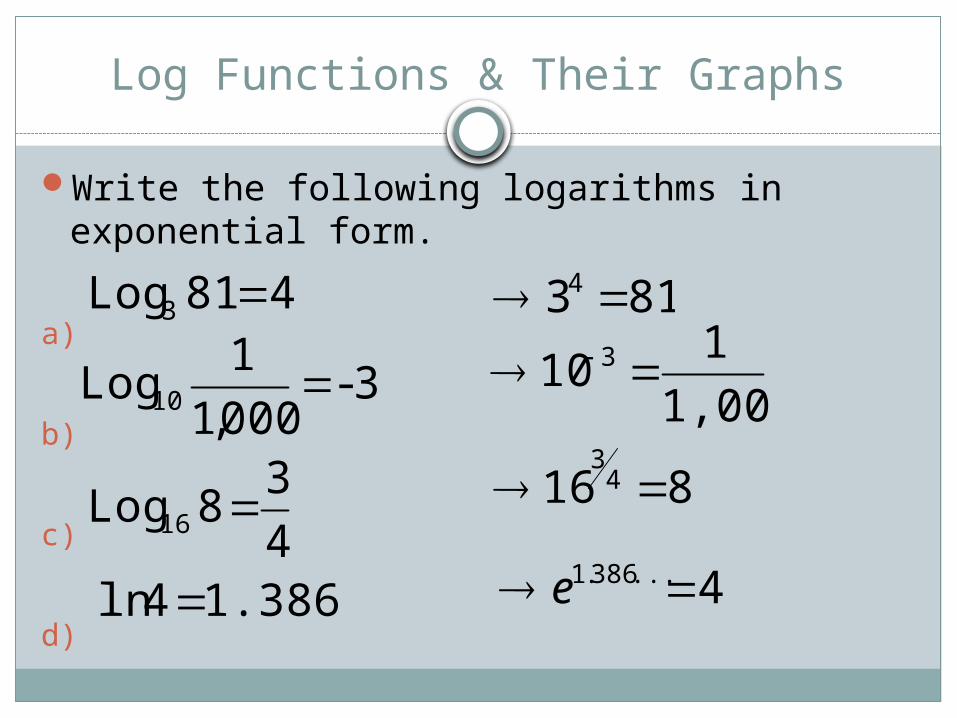
Write the following logarithms in exponential form.
a)
b)
c)
d)
4 81 Log3
3- 000,1
1 Log10
4
3 8 Log16
1.386... 4ln
81 3 4
1,000
1 10 3
8 16 43
4 ...386.1 e
Log Functions & Their Graphs
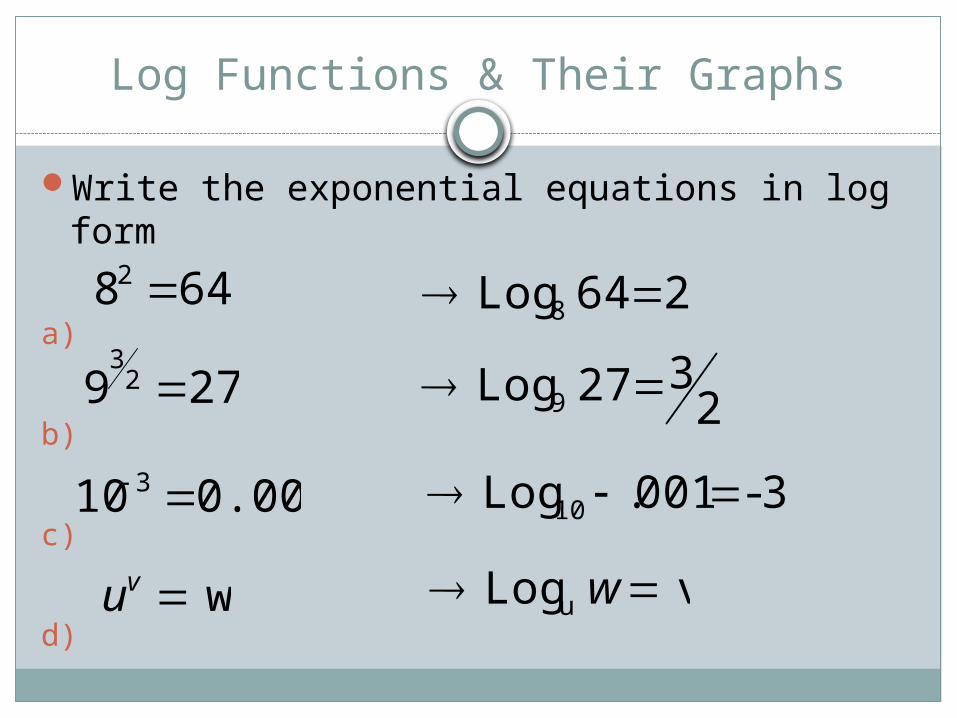
Write the exponential equations in log form
a)
b)
c)
d)
2 64 Log8
23 27 Log9
3- 001. Log10
v Logu w
64 82
27 9 23
0.001 10 3
wvu

Log Functions & Their Graphs
Now that we know the definition of a logarithmic function, we can start to evaluate basic logarithms.
What is this question asking?
2 raised to what power equals 8?
x 8 Log2 x = 32³= 8

Log Functions & Their Graphs
Evaluate the following logarithms:
a)
b)
c)
x 25 Log5
x 4 Log16
x 1 Log a
25 5x 2 x
4 16x 21 x
1 x a 0 x

Log Functions & Their Graphs
In conclusion, what does the following statement mean?
y z Log
“10 raised to the power of y is equal to z”
SECTION 3 .2
Logarithmic Functions & Their Graphs

Log Functions & Their Graphs
Yesterday, we went over the basic definition of logarithms.
Remember, they are truly defined as the inverse of an exponential function.
x Log y a x ya

Log Functions & Their Graphs
Evaluate the following logarithms:
1 Loga Log aa
Since a raised to the power of zero is equal to 1, 1 Loga = 0
Since a raised to the power of one is equal to a
= 1 Log aa
Log Functions & Their Graphs
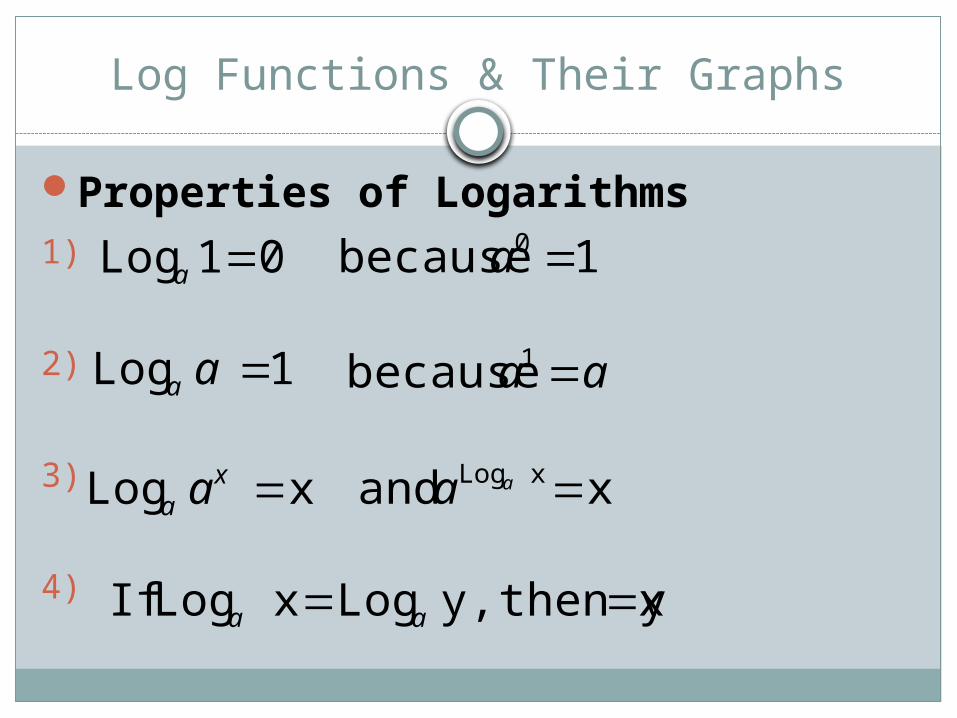
Properties of Logarithms1)
2)
3)
4)
0 1 Log a
1 Log aa
x Log xa a
y then x y, Log x Log If aa
1 because 0 a
aa 1 because
x and xLog aa

Log Functions & Their Graphs
Using these properties, we can simplify different logarithmic functions.
x5 5 Log
From our third property, we can evaluate this log function to be equal to x.
= x
Log Functions & Their Graphs
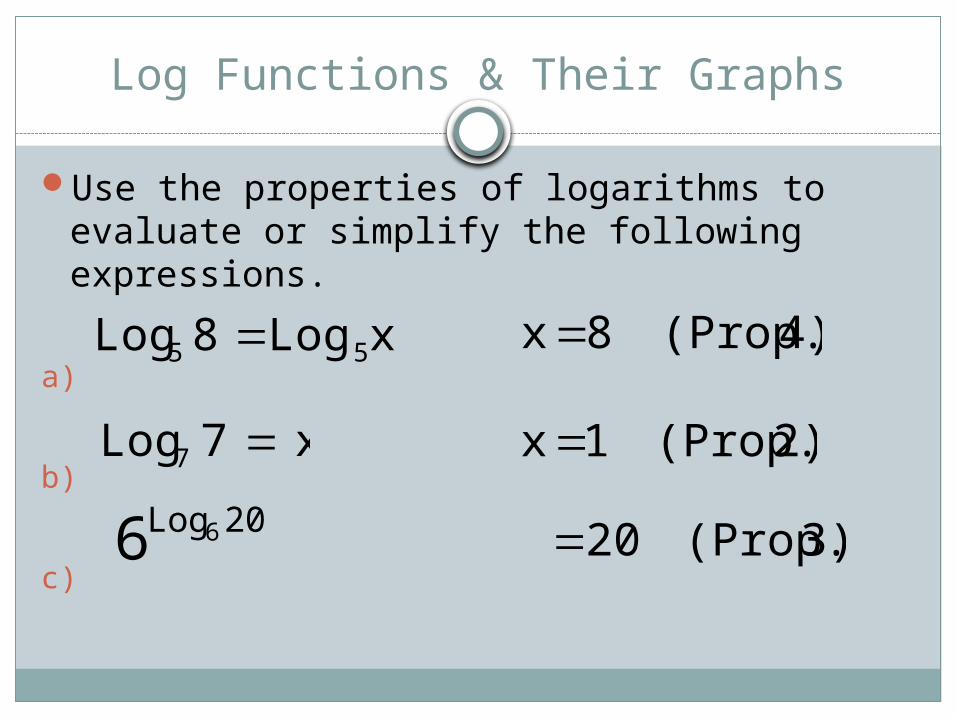
Use the properties of logarithms to evaluate or simplify the following expressions.
a)
b)
c)
x Log 8 Log 55
x 7 Log7
20Log66
4) (Prop. 8 x
2) (Prop. 1 x
3) (Prop. 20

Graphs of Log Functions
Fill in the following table and sketch the graph of the function f(x) for:
f(x) = x2 x-2-10123
x2
41
21
1248

Graphs of Log Functions
Remember that the function is actually the
inverse of the exponential function
To graph inverses, switch the x and y values
This is a reflection across the line y = x
xLog y ax y a

Graphs of Log Functions
Fill in the following table and sketch the graph of the function f(x) for:
xLog y 2
-2-10123
y
41
21
1248
xLog y 2

Graphs of Log Functions
The nature of this curve is typical of the curves of logarithmic functions.
They have one x-intercept and one vertical asymptote
Reflection of the exponential curve across the line y = x

Graphs of Log Functions
Basic characteristics of the log curves
a) Domain: (0, ∞)
b) Range: (- ∞, ∞)
c) x-intercept at (1, 0)
d) Increasing
e) 1-1 → the function has an inverse
f) y-axis is a vertical asymptote
g) Continuous

Graphs of Log Functions
Much like we had shifts in exponential curves, the log curves have shifts and reflections as well
Graphing will shift the curve 1 unit to the right
Graphing will shift the curve vertically up 2 units
1)-(x Log y a
xLog2 y a
Graphs of Log Functions
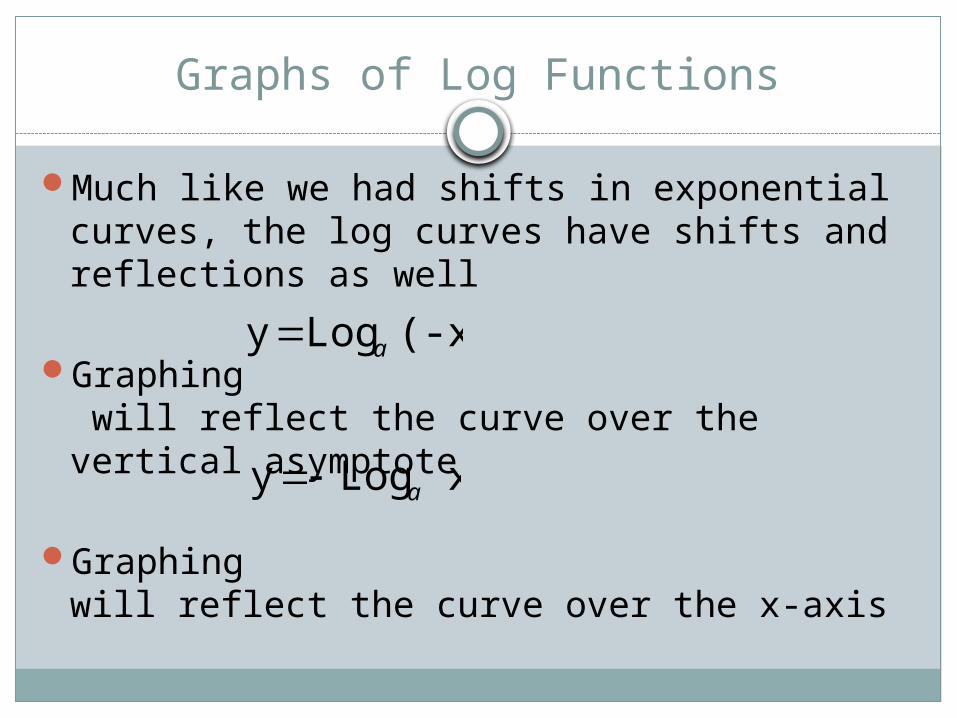
Much like we had shifts in exponential curves, the log curves have shifts and reflections as well
Graphing will reflect the curve over the vertical asymptote
Graphing will reflect the curve over the x-axis
(-x) Log y a
xLog y a
Graphs of Log Functions
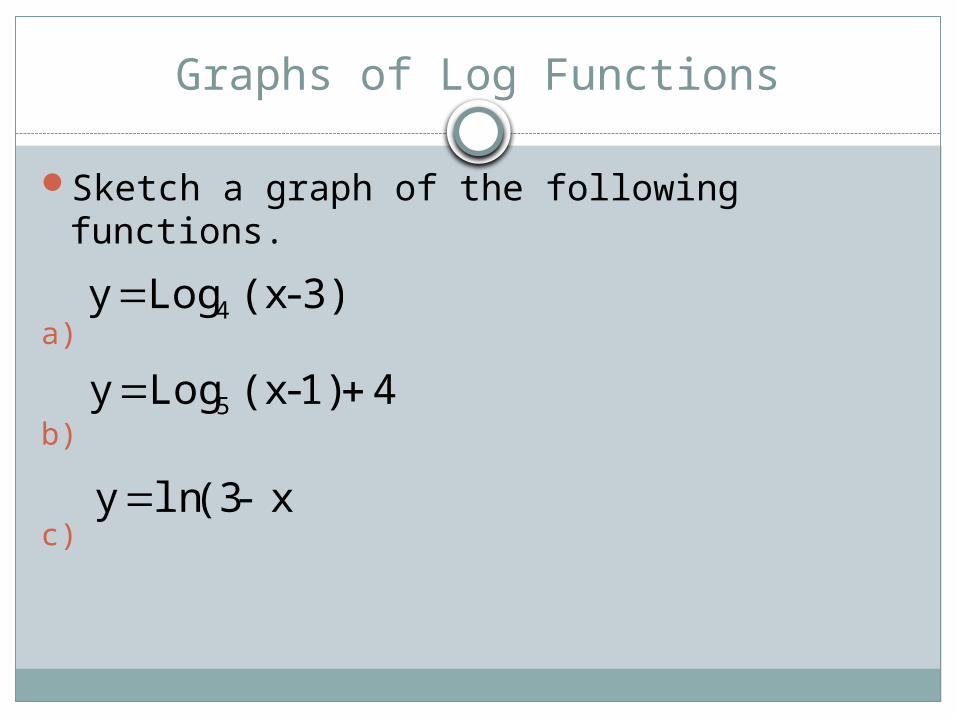
Sketch a graph of the following functions.
a)
b)
c)
3) -(x Log y 4
4 1) -(x Log y 5
x)- (3ln y

Graphs of Log Functions
3) -(x Log y 4
Domain: (3, ∞)
x-intercept:(4, 0)
Asymptote:x = 3
Graphs of Log Functions
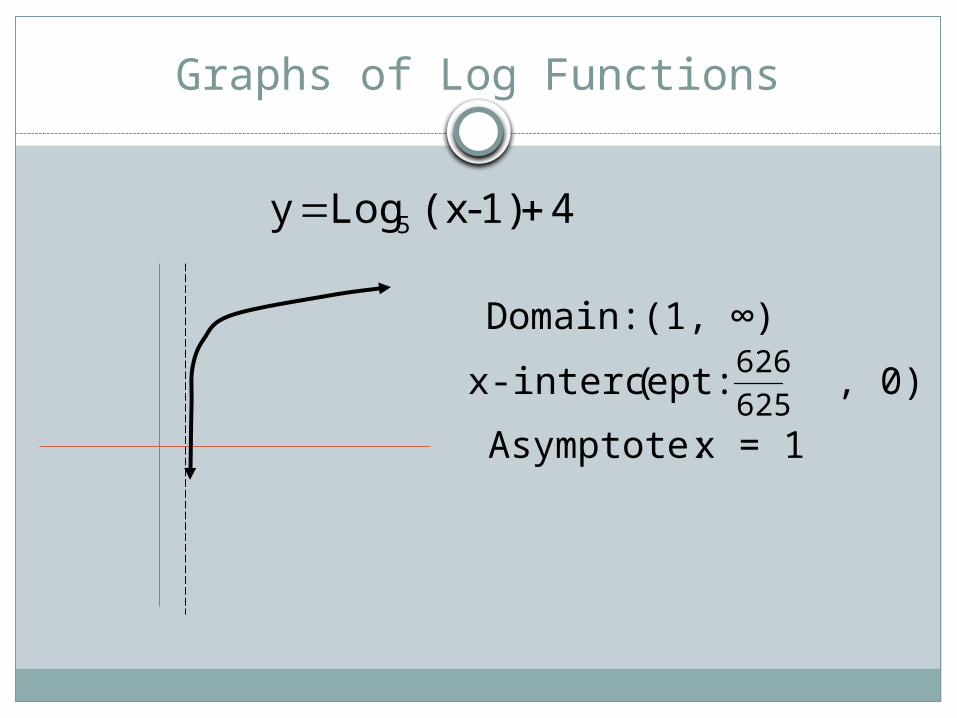
41) -(x Log y 5
Domain: (1, ∞)
x-intercept:( , 0)
Asymptote:x = 1625
626

Graphs of Log Functions
x)- (3ln y
Domain: (- ∞, 3)
x-intercept:(2, 0)
Asymptote:x = 3