secrets of intraday candlesticks for handouts - … nison’s candlecharts.com secrets of intraday...
TRANSCRIPT
1
Steve Nison’s Candlecharts.comSecrets of Intraday Candlesticks for Day and Swing Traders
With
Steve Nison, CMTPresident: Candlecharts.com
Legal Notice: This webcast and recording is © Candlecharts.com and may not be copied, retransmitted, nor distributed inany manner whatsoever, including, but not limited to, video or audio file sharing sites, online auction and classified sites,discussion forums nor any other means. Illegal redistribution of this content may result in criminal and/or civil fines,pursuant to applicable international copyright law. All rights reserved worldwide.
2
Steve Nison’s Candlecharts.comSecrets of Intraday Candlesticks for Day and Swing Traders
What you will learn:What you will learn:
Review of candlestick basics
Flexibility for intraday candles
Importance of daily levels
Getting extra early reversals
Finding “Hidden”support/resistance levels
Is the market overextended?
Successful test of key level?
Bonus session: Using NCSwith intraday charts for our“bouncing ball” trade set up
3
Steve Nison’s Candlecharts.comSecrets of Intraday Candlesticks for Day and Swing Traders
4
Steve Nison’s Candlecharts.comSecrets of Intraday Candlesticks for Day and Swing Traders
5
Steve Nison’s Candlecharts.comSecrets of Intraday Candlesticks for Day and Swing Traders
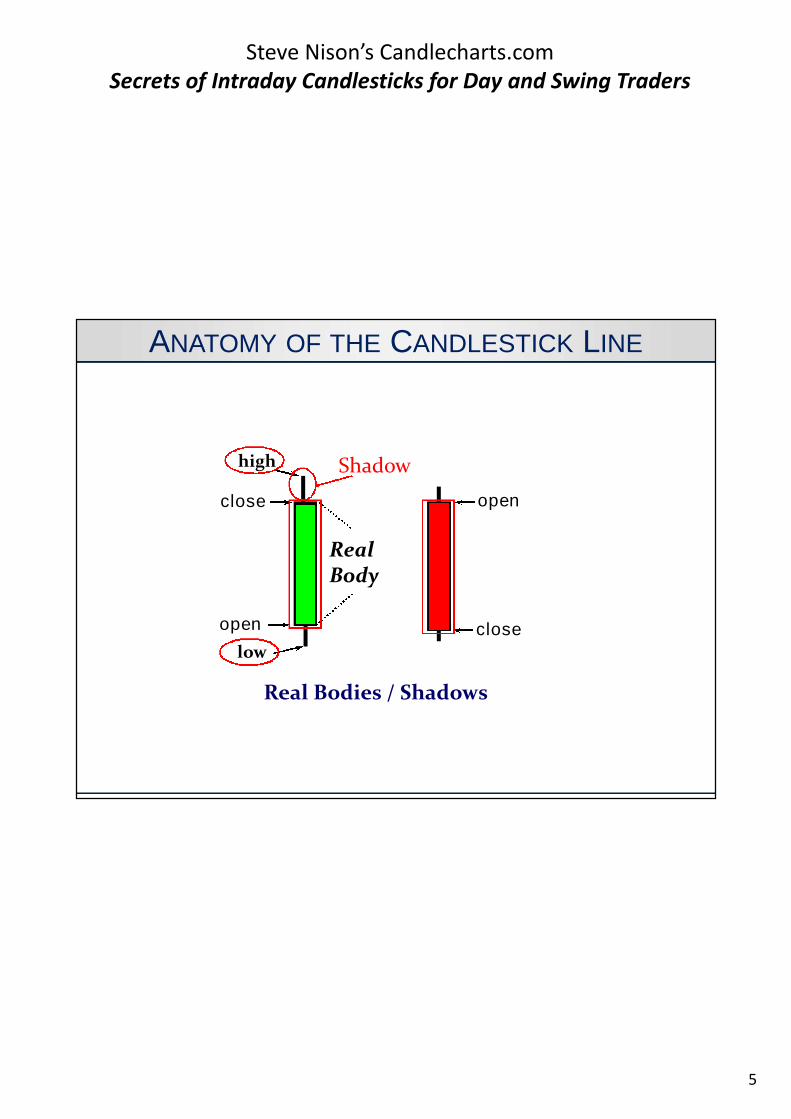
open close
open
RealBody
high
low
Real Bodies / Shadows
ANATOMY OF THE CANDLESTICK LINE
close
Shadow
6
Steve Nison’s Candlecharts.comSecrets of Intraday Candlesticks for Day and Swing Traders
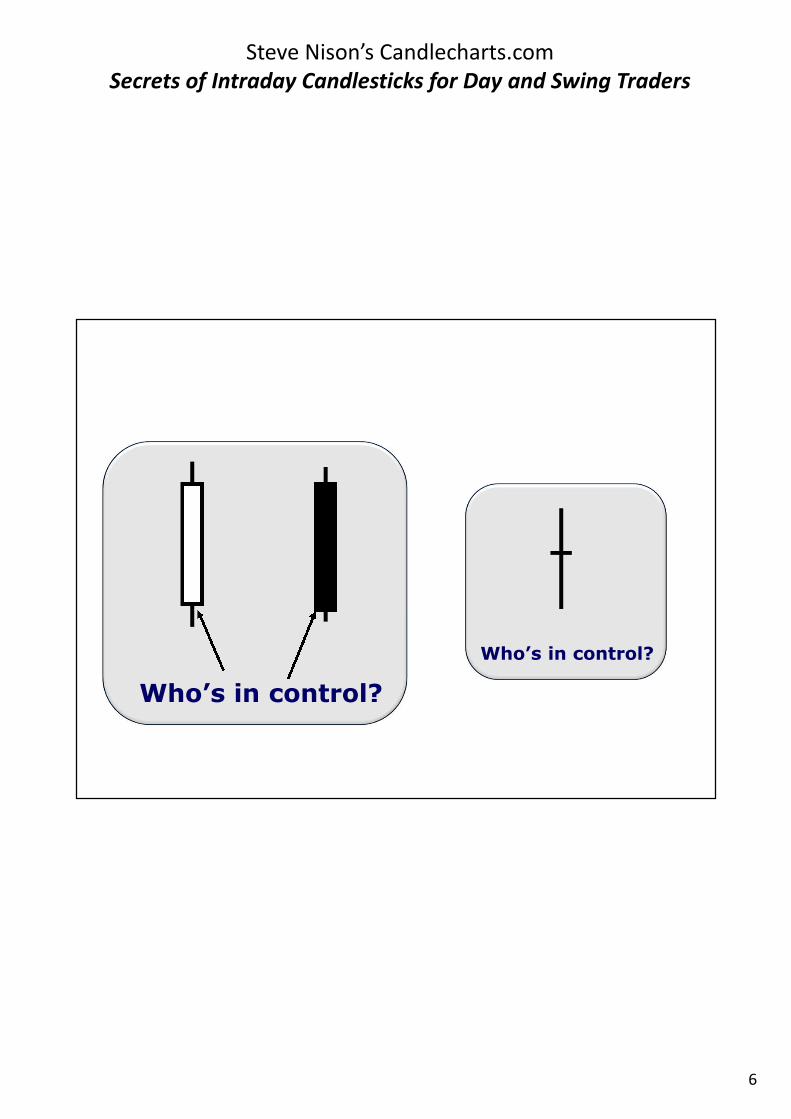
Who’s in control?
Who’s in control?
7
Steve Nison’s Candlecharts.comSecrets of Intraday Candlesticks for Day and Swing Traders
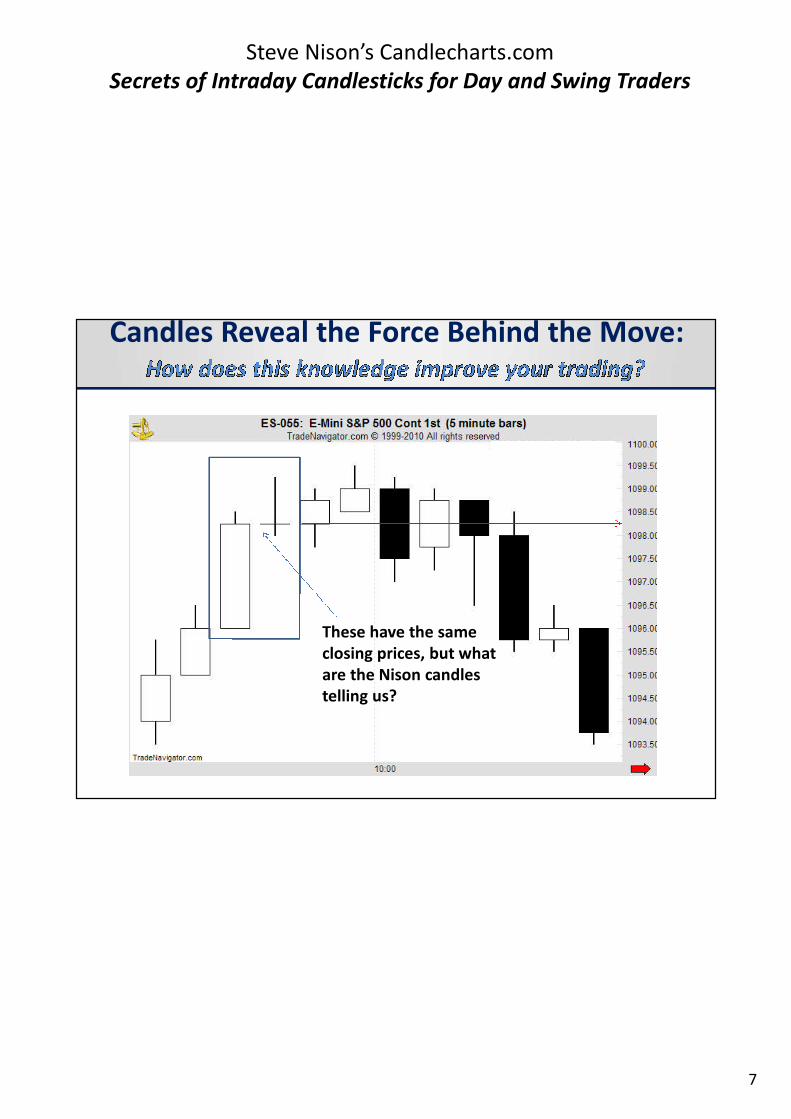
Candles Reveal the Force Behind the Move:
These have the sameclosing prices, but whatare the Nison candlestelling us?
8
Steve Nison’s Candlecharts.comSecrets of Intraday Candlesticks for Day and Swing Traders
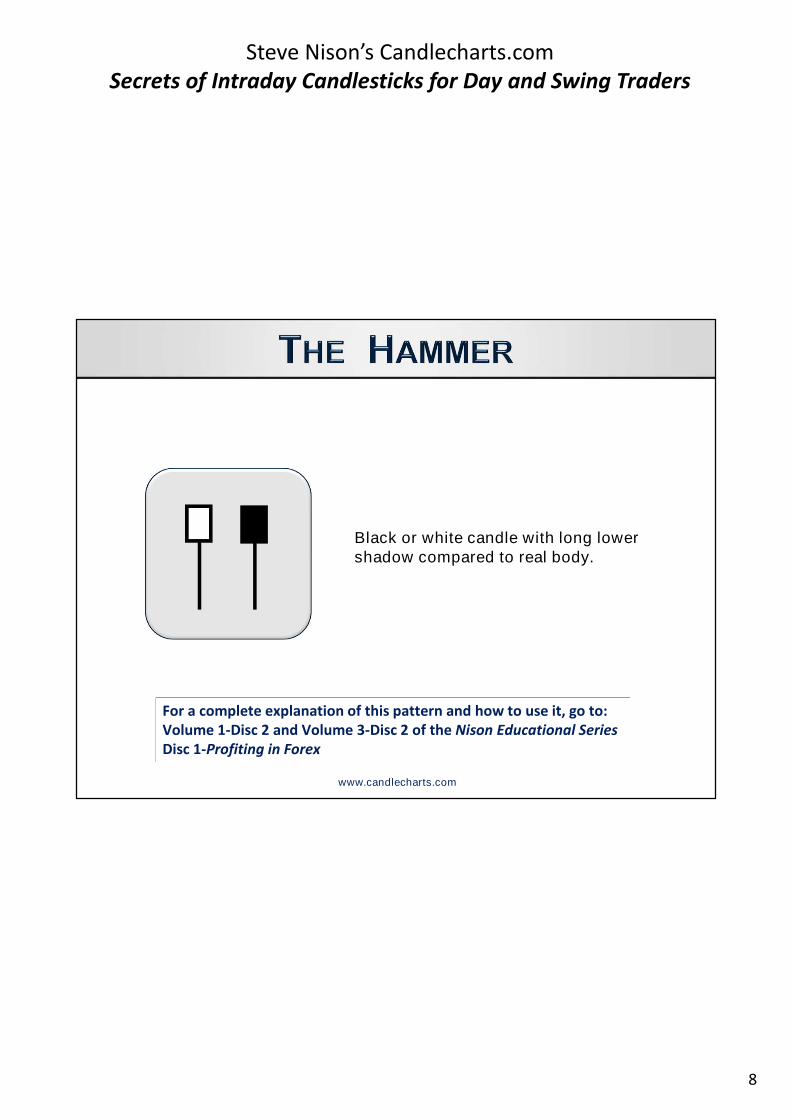
Black or white candle with long lowershadow compared to real body.
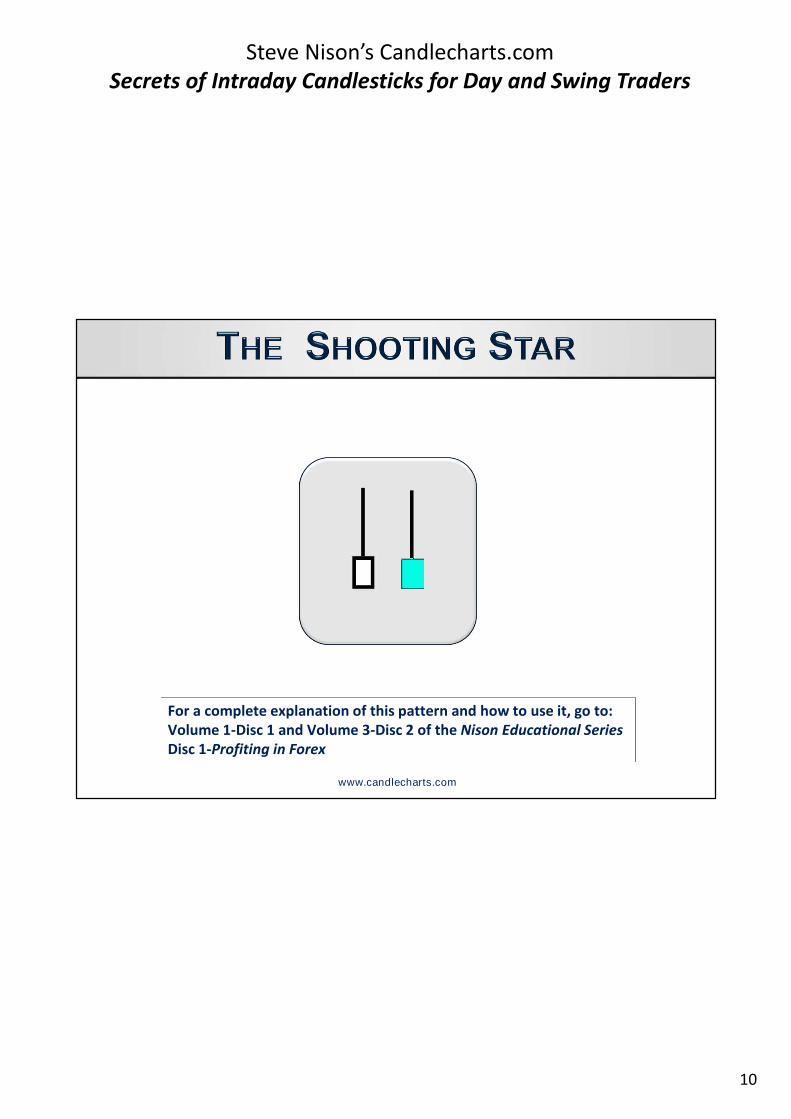
www.candlecharts.com
For a complete explanation of this pattern and how to use it, go to:Volume 1-Disc 2 and Volume 3-Disc 2 of the Nison Educational SeriesDisc 1-Profiting in Forex
9
Steve Nison’s Candlecharts.comSecrets of Intraday Candlesticks for Day and Swing Traders
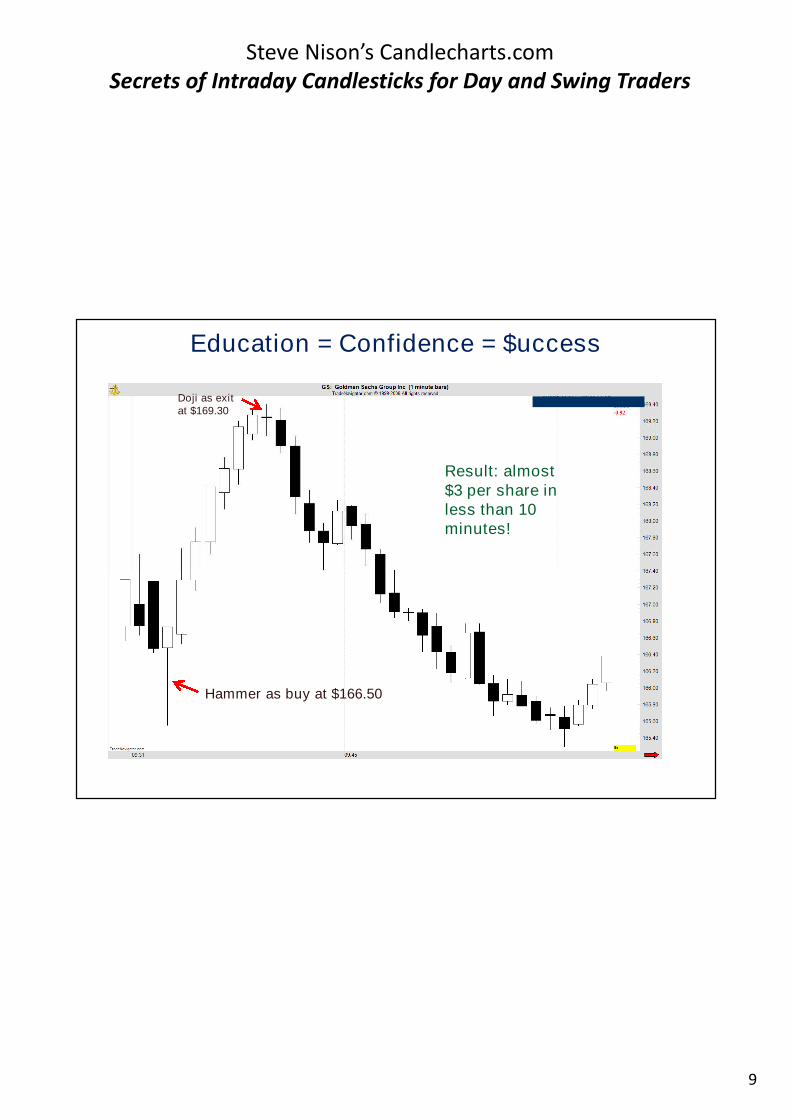
Hammer as buy at $166.50
Doji as exitat $169.30
Result: almost$3 per share inless than 10minutes!
Education = Confidence = $uccess
10
Steve Nison’s Candlecharts.comSecrets of Intraday Candlesticks for Day and Swing Traders
www.candlecharts.com
For a complete explanation of this pattern and how to use it, go to:Volume 1-Disc 1 and Volume 3-Disc 2 of the Nison Educational SeriesDisc 1-Profiting in Forex
11
Steve Nison’s Candlecharts.comSecrets of Intraday Candlesticks for Day and Swing Traders
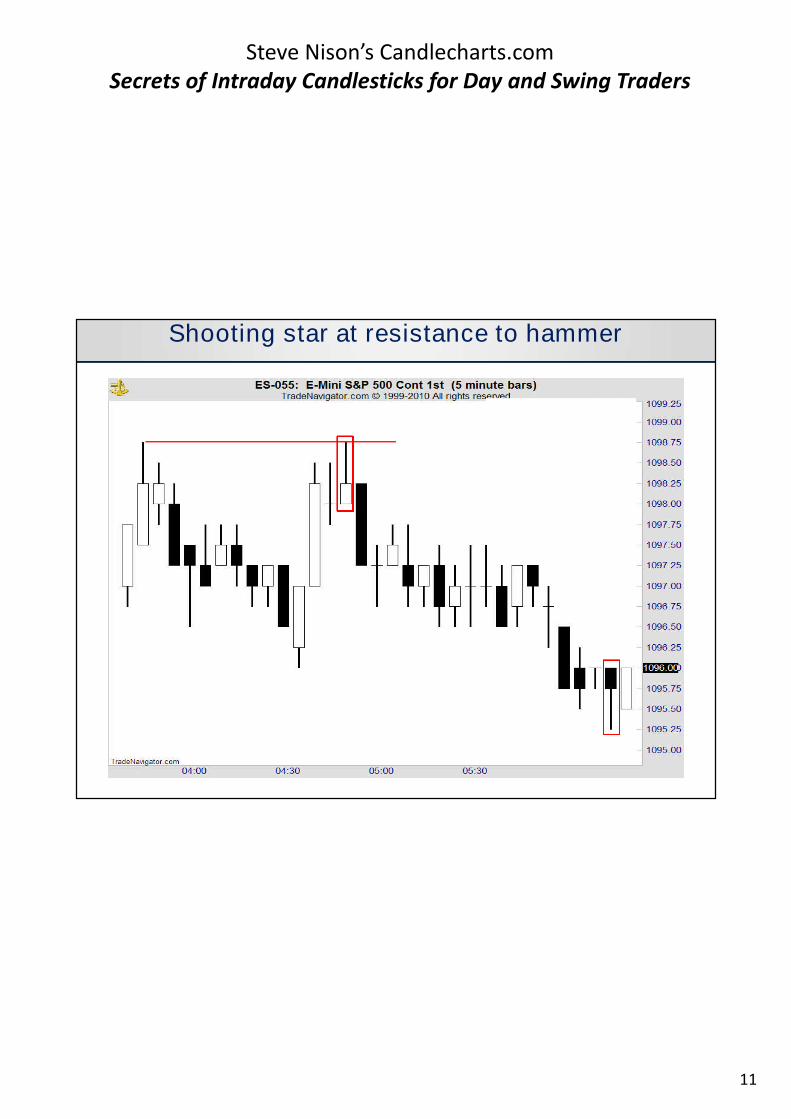
Shooting star at resistance to hammer
12
Steve Nison’s Candlecharts.comSecrets of Intraday Candlesticks for Day and Swing Traders
www.candlecharts.com
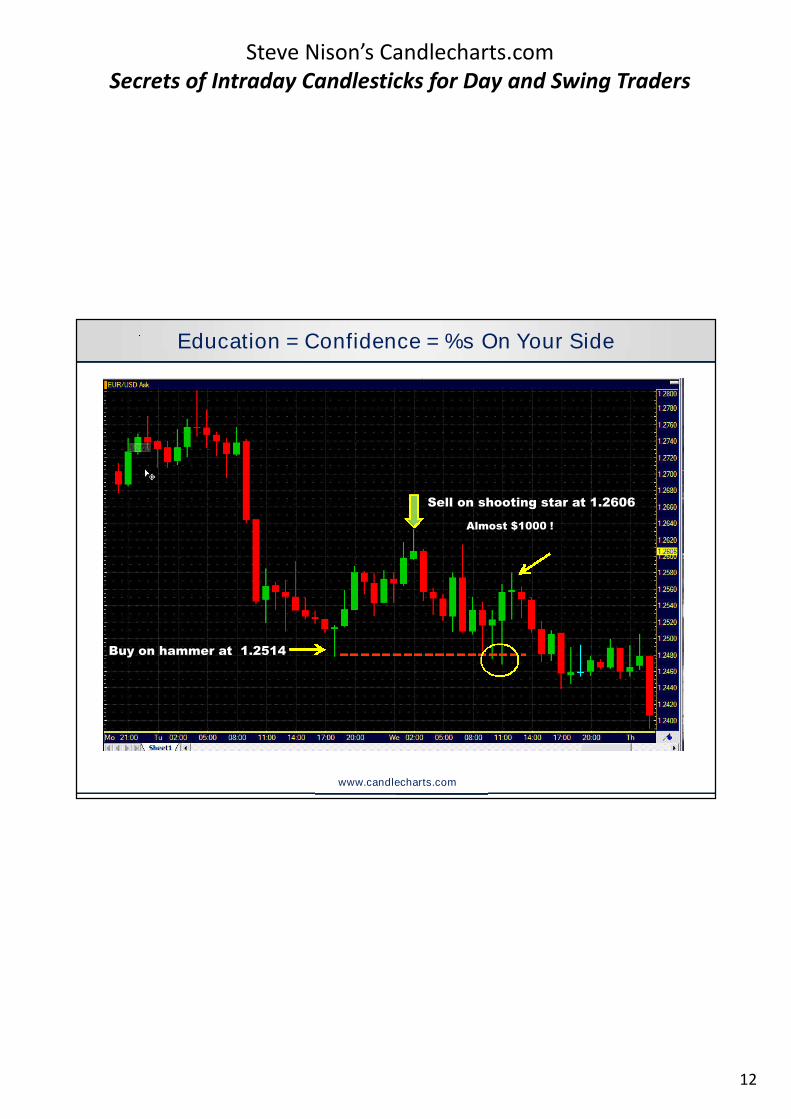
Education = Confidence = %s On Your Side
Buy on hammer at 1.2514
Sell on shooting star at 1.2606
Almost $1000 !
13
Steve Nison’s Candlecharts.comSecrets of Intraday Candlesticks for Day and Swing Traders
Intraday Candle Charts
Be more flexible withcandle patterns onintraday candle chartsthan with daily orweekly candles
Be more flexible withcandle patterns onintraday candle chartsthan with daily orweekly candles
www.candlecharts.com
14
Steve Nison’s Candlecharts.comSecrets of Intraday Candlesticks for Day and Swing Traders
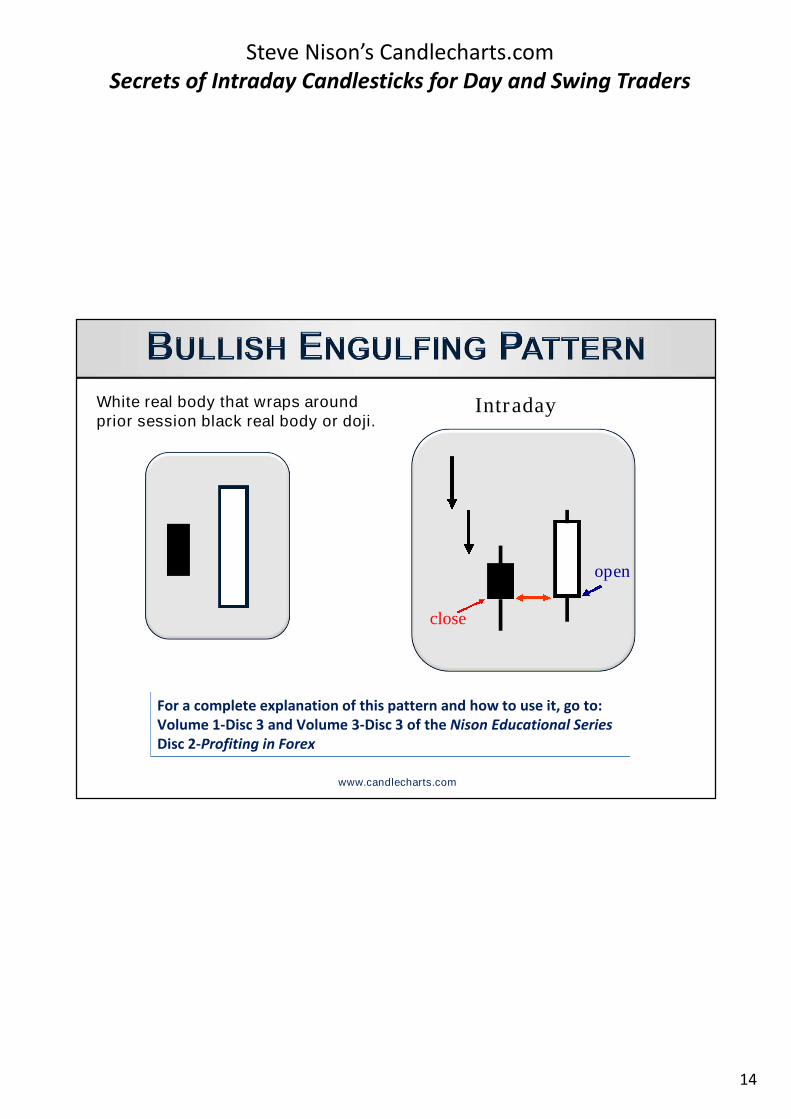
White real body that wraps aroundprior session black real body or doji.
www.candlecharts.com
For a complete explanation of this pattern and how to use it, go to:Volume 1-Disc 3 and Volume 3-Disc 3 of the Nison Educational SeriesDisc 2-Profiting in Forex
close
open
Intraday
15
Steve Nison’s Candlecharts.comSecrets of Intraday Candlesticks for Day and Swing Traders
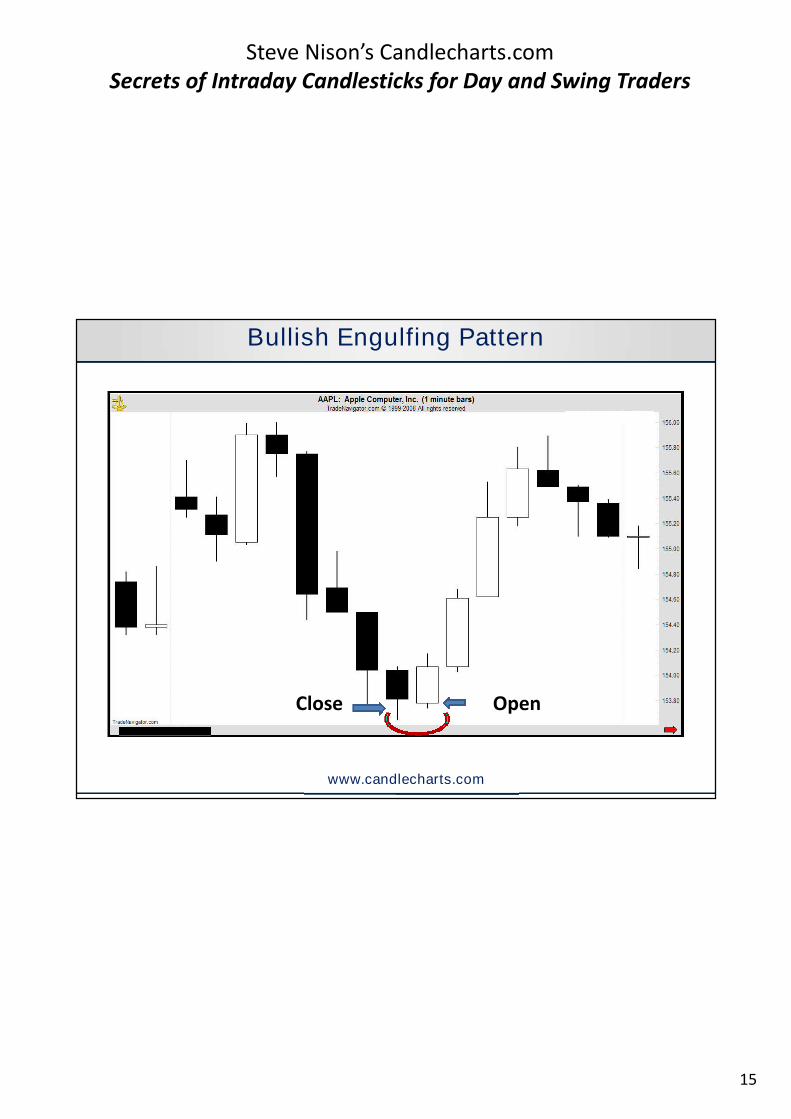
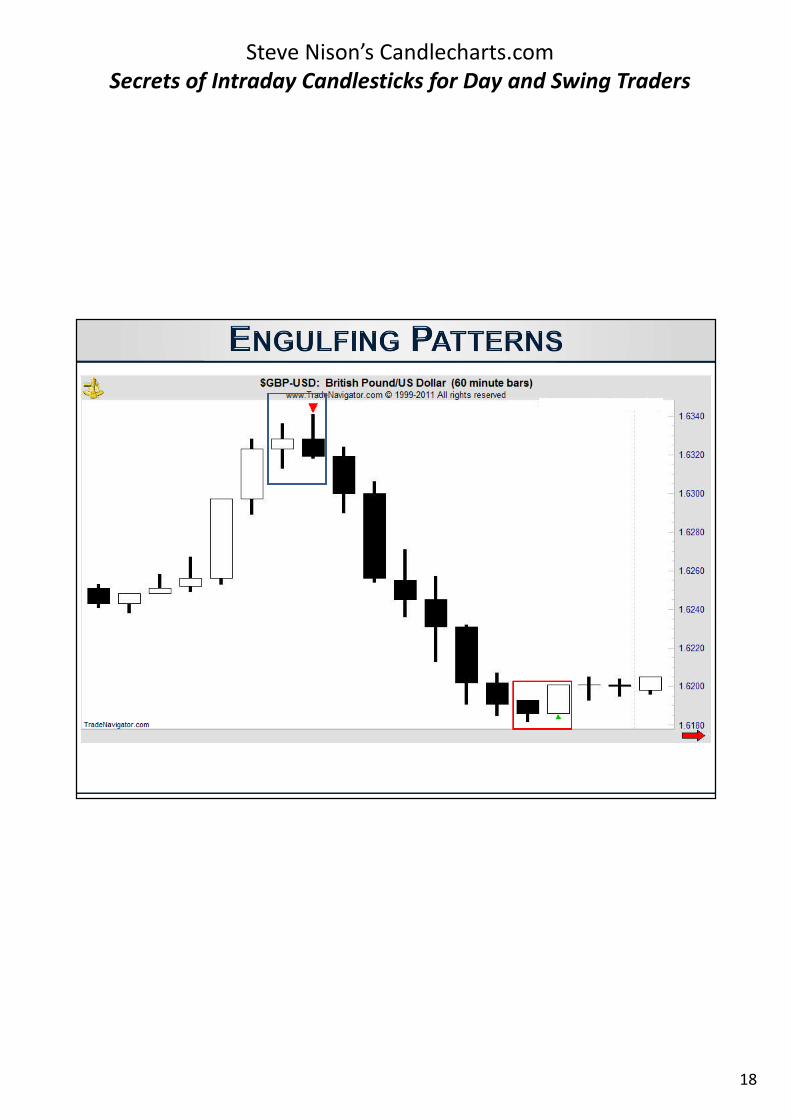
Bullish Engulfing Pattern
Close Open
www.candlecharts.com
16
Steve Nison’s Candlecharts.comSecrets of Intraday Candlesticks for Day and Swing Traders
www.candlecharts.com
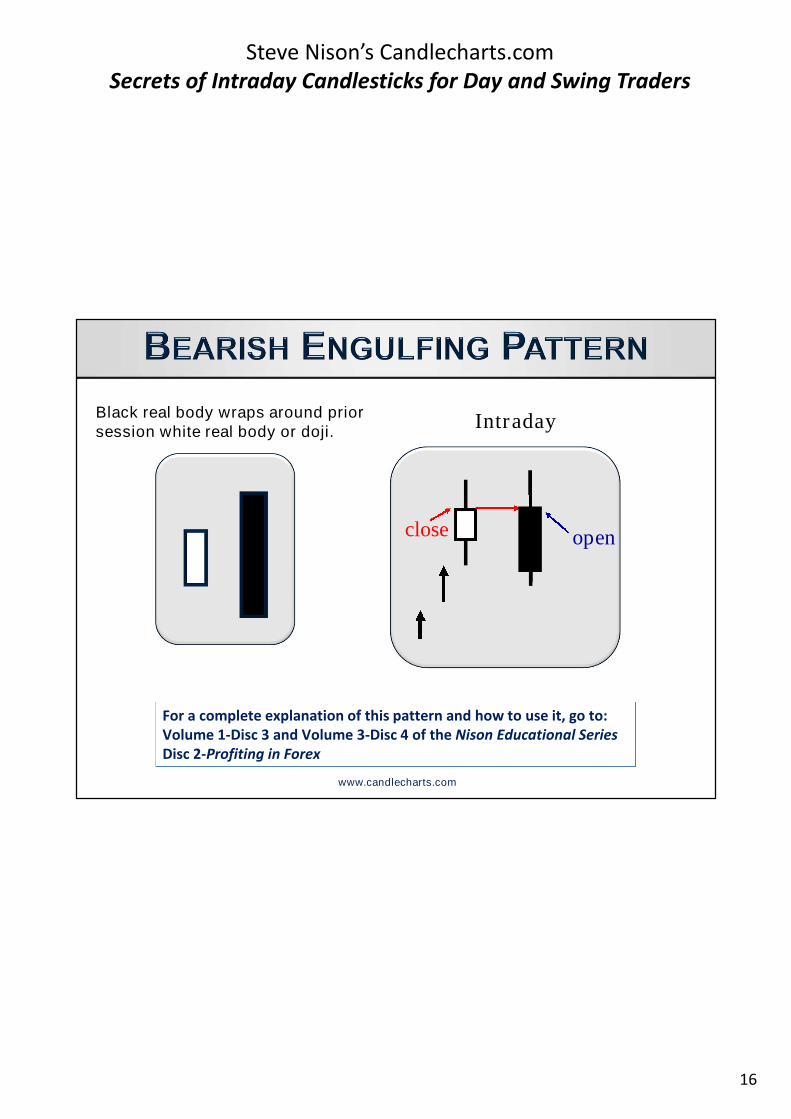
Black real body wraps around priorsession white real body or doji.
For a complete explanation of this pattern and how to use it, go to:Volume 1-Disc 3 and Volume 3-Disc 4 of the Nison Educational SeriesDisc 2-Profiting in Forex
close open
Intraday
17
Steve Nison’s Candlecharts.comSecrets of Intraday Candlesticks for Day and Swing Traders
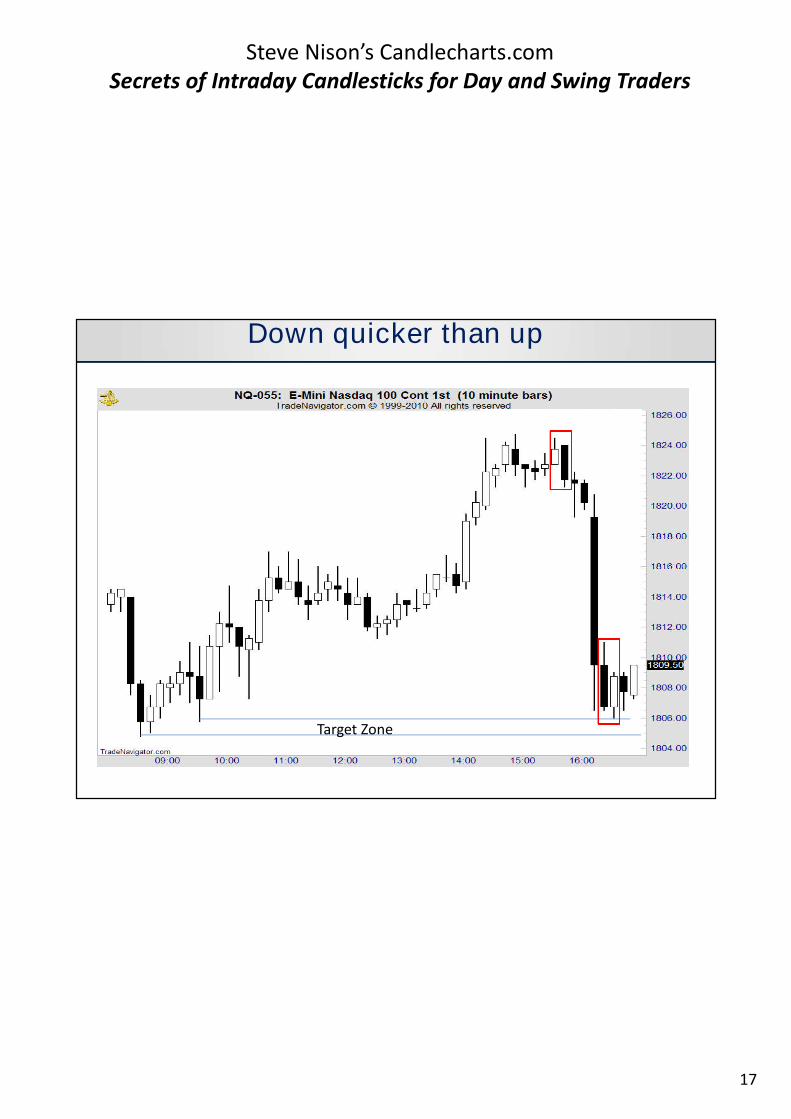
Down quicker than up
Target Zone
18
Steve Nison’s Candlecharts.comSecrets of Intraday Candlesticks for Day and Swing Traders
19
Steve Nison’s Candlecharts.comSecrets of Intraday Candlesticks for Day and Swing Traders
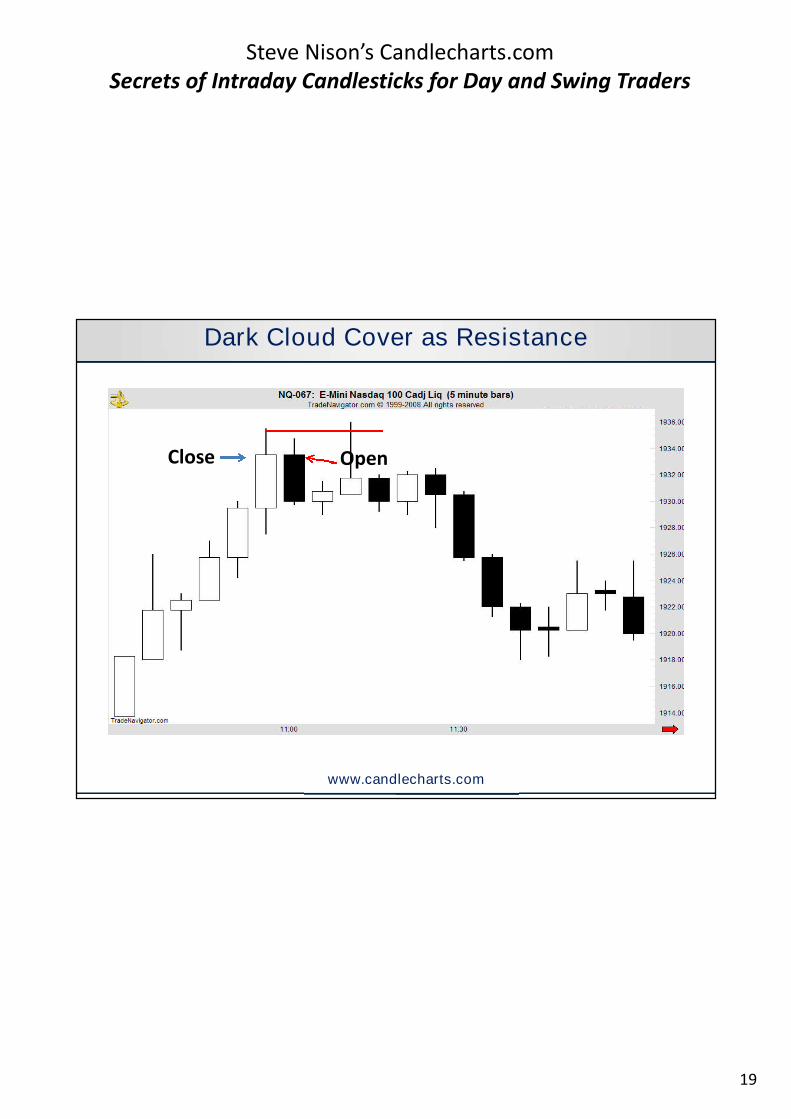
Dark Cloud Cover as Resistance
Close Open
www.candlecharts.com
20
Steve Nison’s Candlecharts.comSecrets of Intraday Candlesticks for Day and Swing Traders
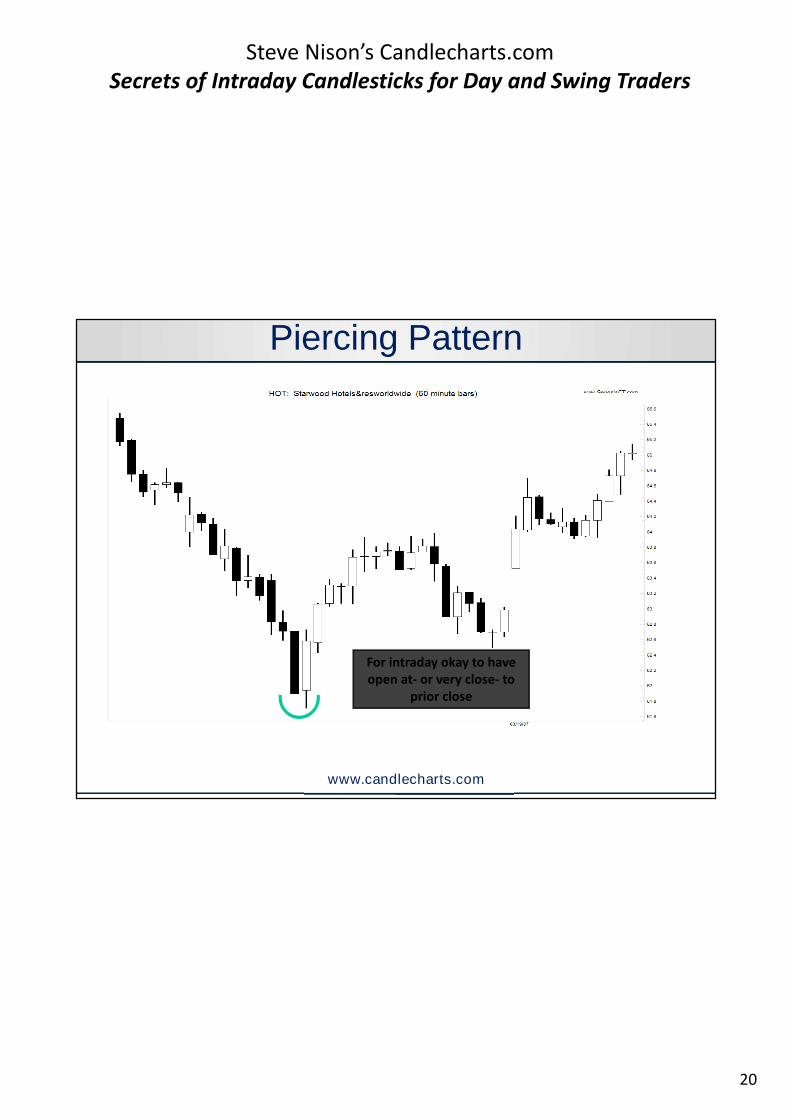
Piercing Pattern
For intraday okay to haveopen at- or very close- to
prior close
www.candlecharts.com
21
Steve Nison’s Candlecharts.comSecrets of Intraday Candlesticks for Day and Swing Traders
Secrets of IntradayCandle Charts
(for intraday traders):Monitoring Daily
Support/Resistance
Secrets of IntradayCandle Charts
(for intraday traders):Monitoring Daily
Support/Resistance
22
Steve Nison’s Candlecharts.comSecrets of Intraday Candlesticks for Day and Swing Traders
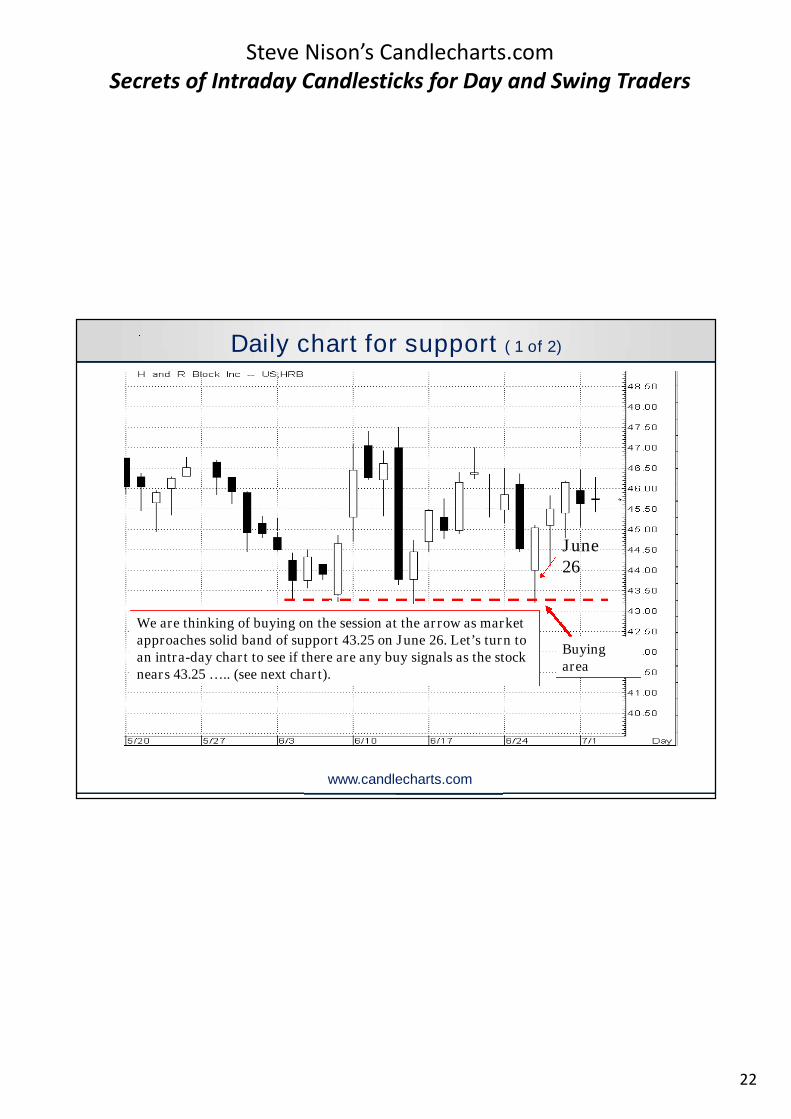
Daily chart for support ( 1 of 2)
We are thinking of buying on the session at the arrow as marketapproaches solid band of support 43.25 on June 26. Let’s turn toan intra-day chart to see if there are any buy signals as the stocknears 43.25 ….. (see next chart).
June26
Buyingarea
www.candlecharts.com
23
Steve Nison’s Candlecharts.comSecrets of Intraday Candlesticks for Day and Swing Traders
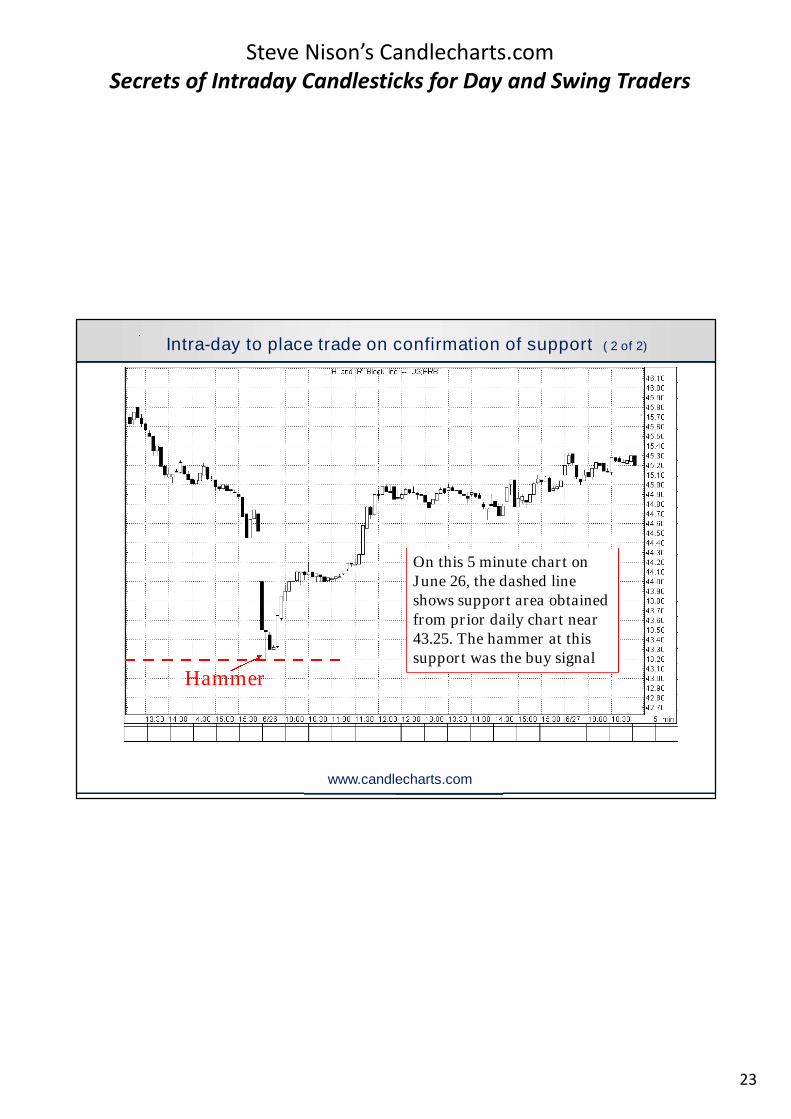
Intra-day to place trade on confirmation of support ( 2 of 2)
On this 5 minute chart onJune 26, the dashed lineshows support area obtainedfrom prior daily chart near43.25. The hammer at thissupport was the buy signal
Hammer
www.candlecharts.com
24
Steve Nison’s Candlecharts.comSecrets of Intraday Candlesticks for Day and Swing Traders
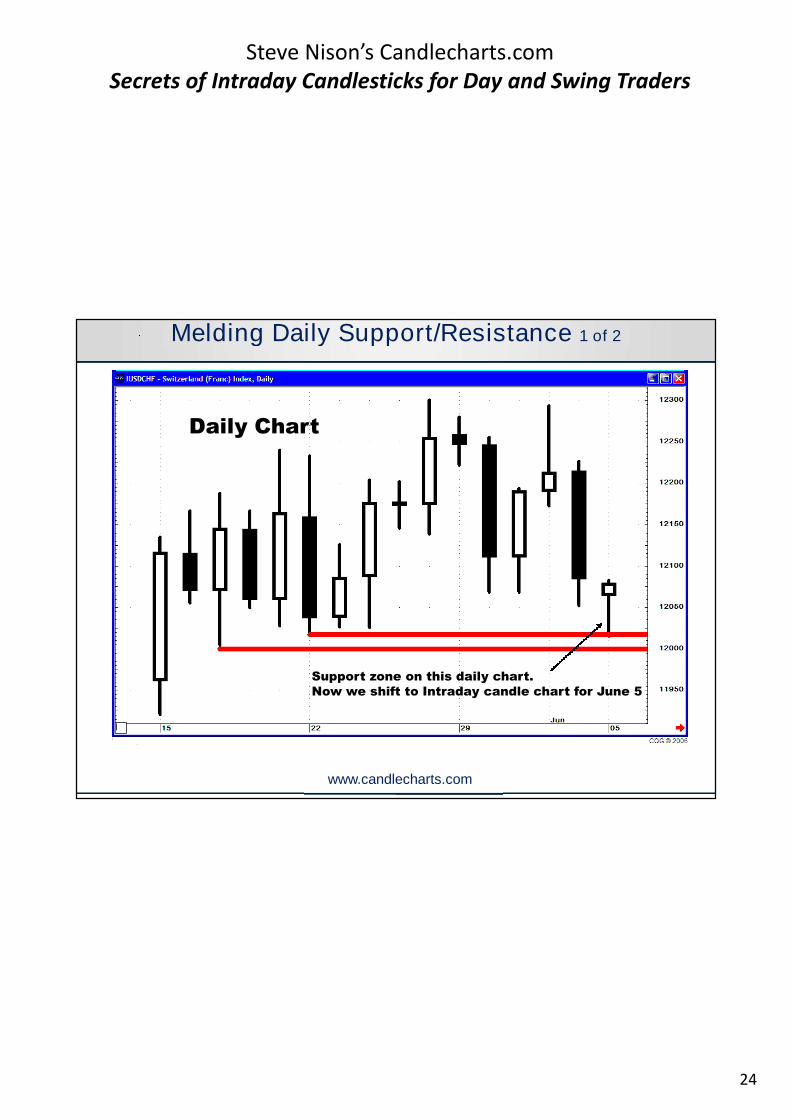
Melding Daily Support/Resistance 1 of 2
Support zone on this daily chart.Now we shift to Intraday candle chart for June 5
Daily Chart
www.candlecharts.com
25
Steve Nison’s Candlecharts.comSecrets of Intraday Candlesticks for Day and Swing Traders
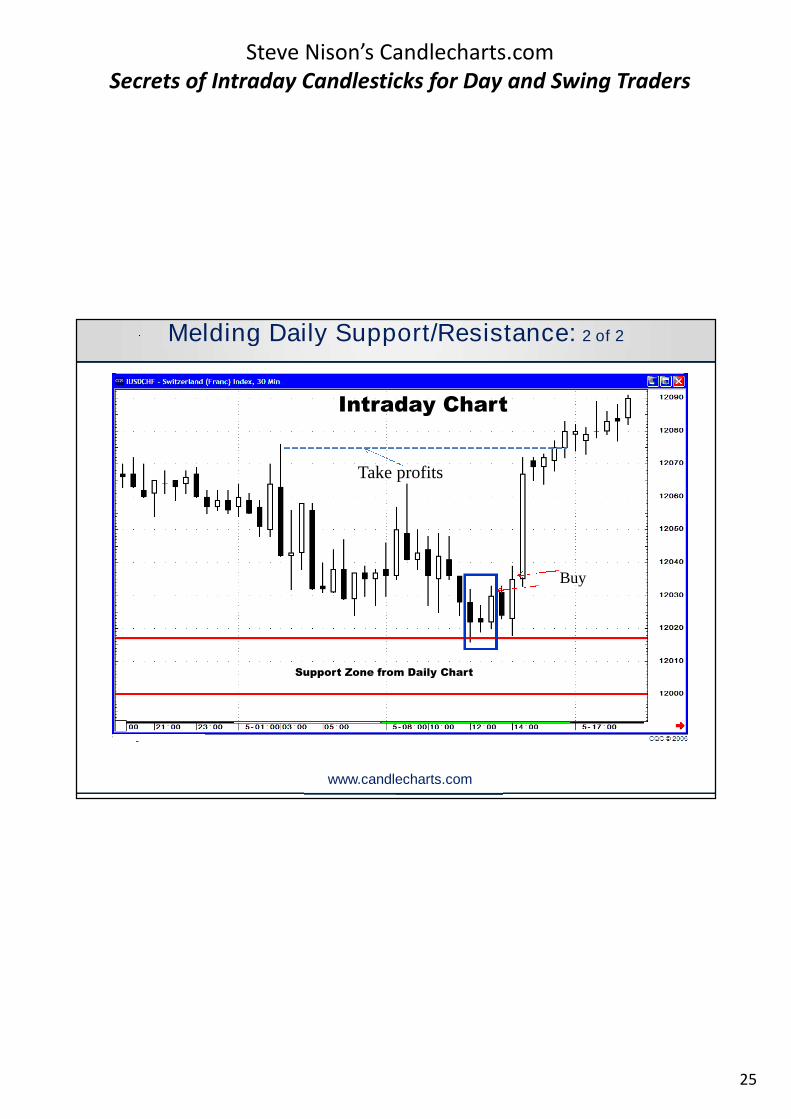
Intraday Chart
Support Zone from Daily Chart
Melding Daily Support/Resistance: 2 of 2
www.candlecharts.com
Buy
Take profits
26
Steve Nison’s Candlecharts.comSecrets of Intraday Candlesticks for Day and Swing Traders
Secrets of IntradayCandle Charts
(for Swing Traders):Finding the Extra Early
Reversal Areas
Secrets of IntradayCandle Charts
(for Swing Traders):Finding the Extra Early
Reversal Areas
27
Steve Nison’s Candlecharts.comSecrets of Intraday Candlesticks for Day and Swing Traders
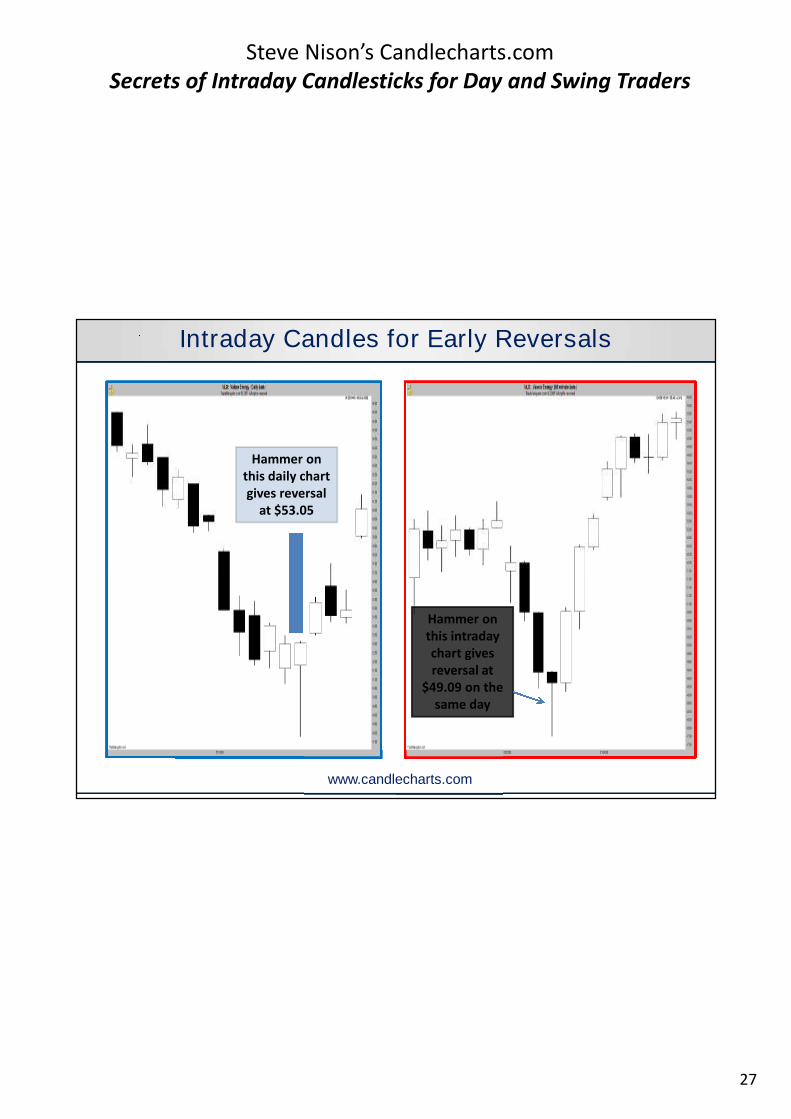
Intraday Candles for Early Reversals
Hammer onthis daily chartgives reversal
at $53.05
Hammer onthis intradaychart givesreversal at
$49.09 on thesame day
www.candlecharts.com
28
Steve Nison’s Candlecharts.comSecrets of Intraday Candlesticks for Day and Swing Traders
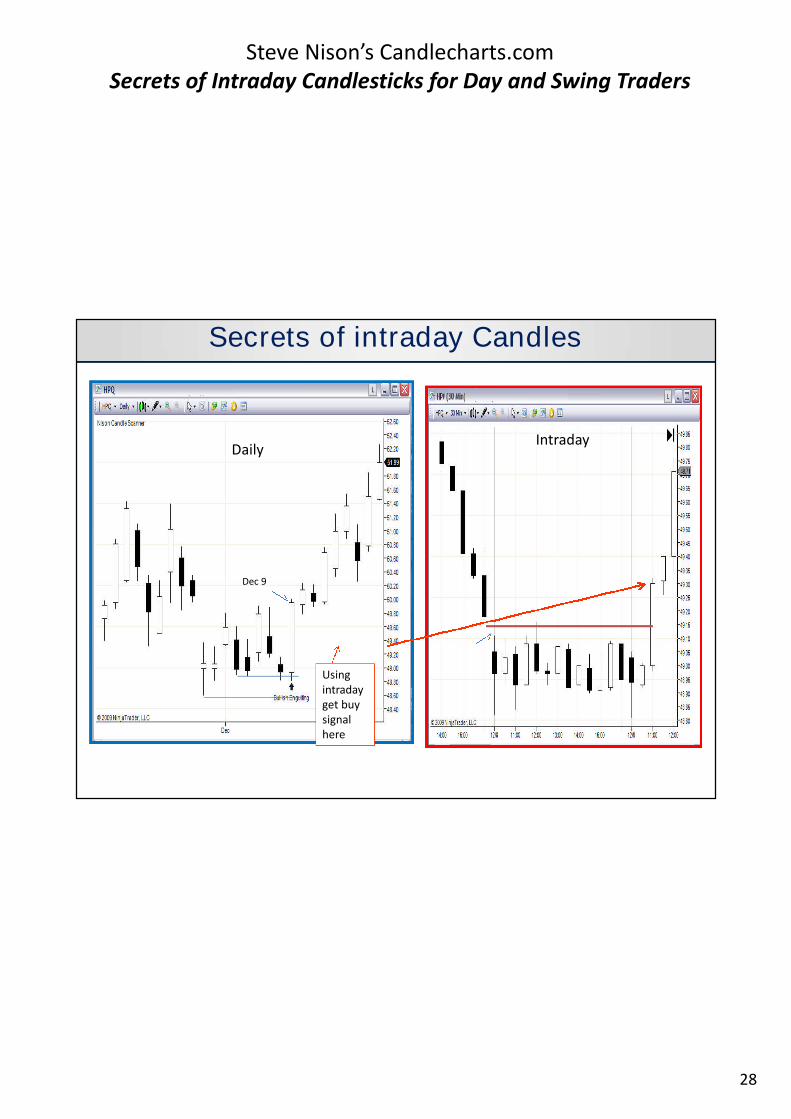
Dec 9
Secrets of intraday Candles
DailyIntraday
Usingintradayget buysignalhere
29
Steve Nison’s Candlecharts.comSecrets of Intraday Candlesticks for Day and Swing Traders
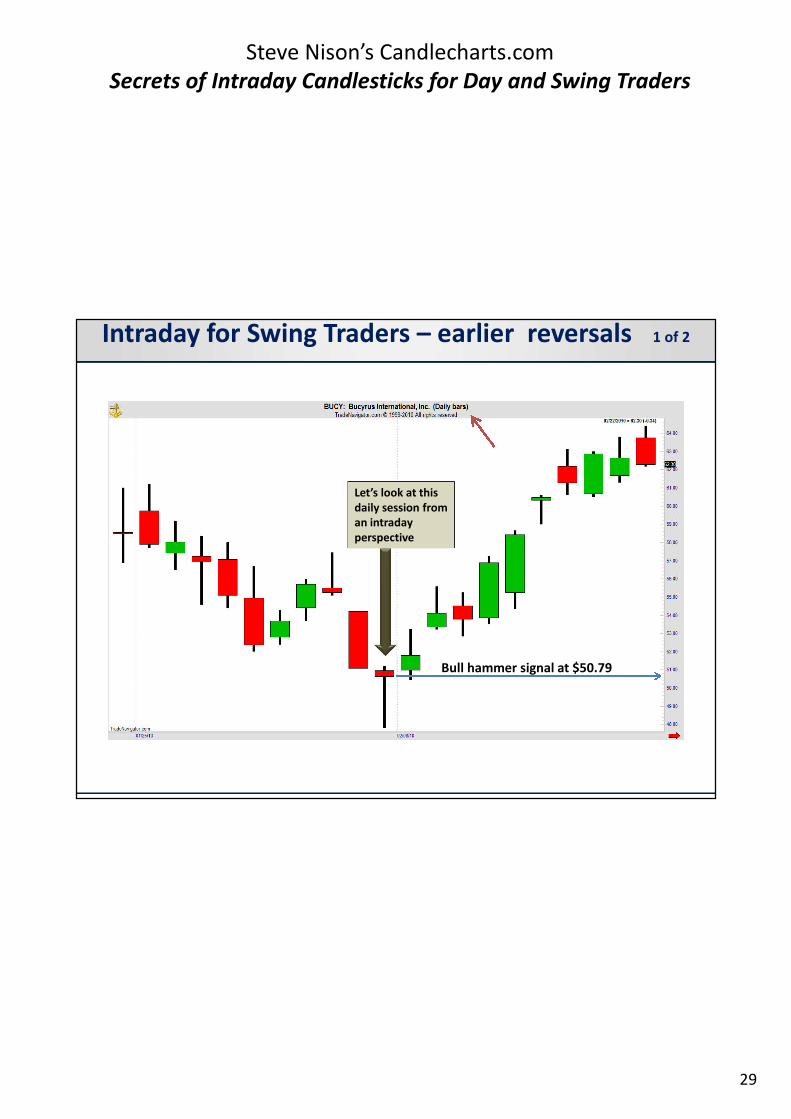
Bull hammer signal at $50.79
Intraday for Swing Traders – earlier reversals 1 of 2
Let’s look at thisdaily session froman intradayperspective
30
Steve Nison’s Candlecharts.comSecrets of Intraday Candlesticks for Day and Swing Traders
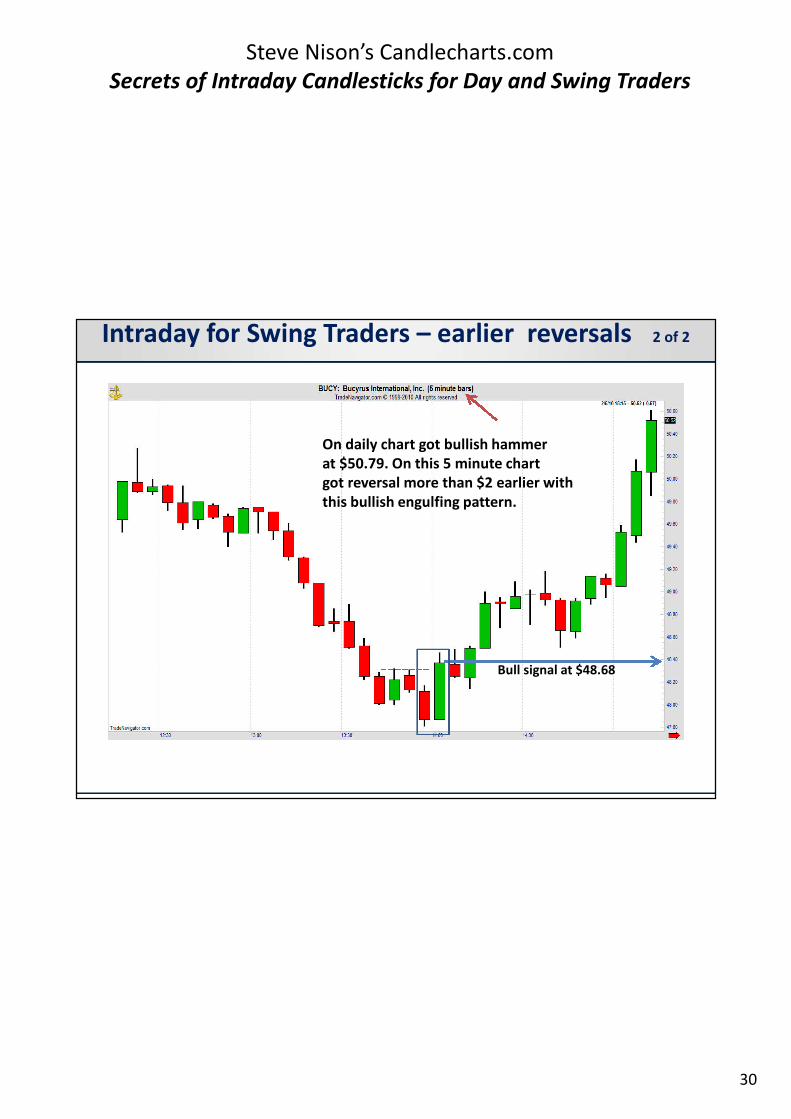
Bull signal at $48.68
On daily chart got bullish hammerat $50.79. On this 5 minute chartgot reversal more than $2 earlier withthis bullish engulfing pattern.
Intraday for Swing Traders – earlier reversals 2 of 2
31
Steve Nison’s Candlecharts.comSecrets of Intraday Candlesticks for Day and Swing Traders
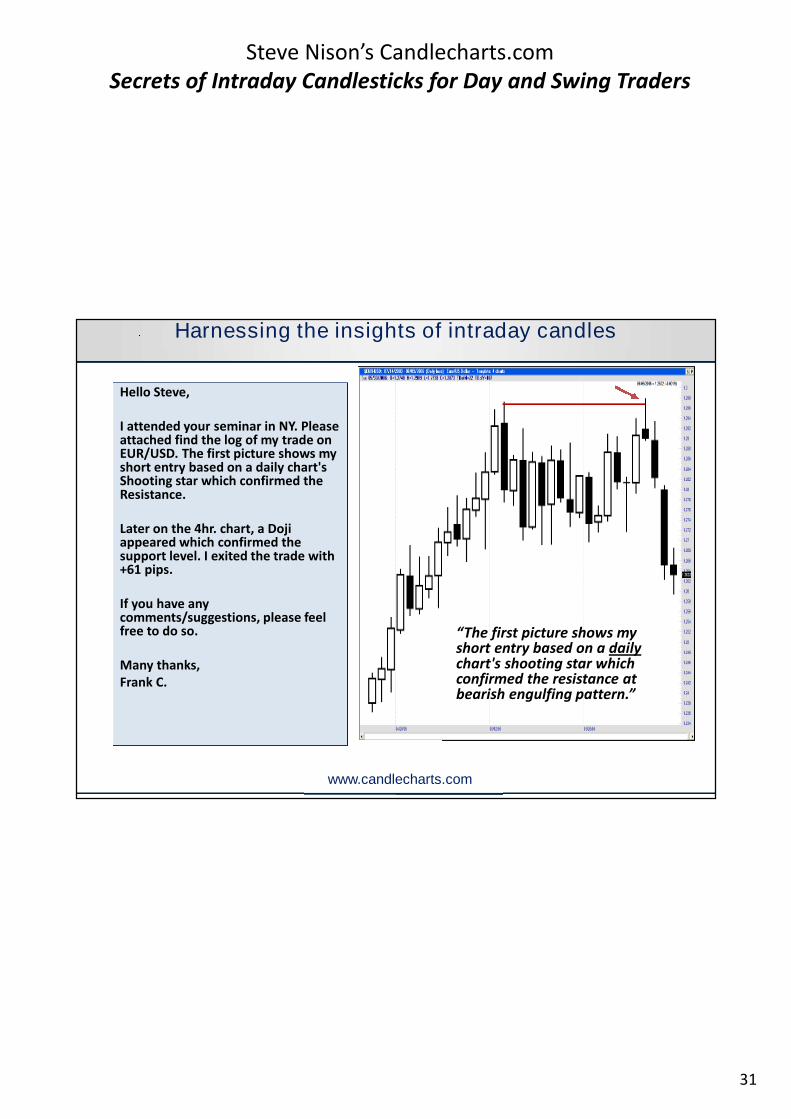
Hello Steve,Hello Steve,
I attended your seminar in NY. Pleaseattached find the log of my trade onEUR/USD. The first picture shows myshort entry based on a daily chart'sShooting star which confirmed theResistance.
Later on the 4hr. chart, a Dojiappeared which confirmed thesupport level. I exited the trade with+61 pips.
If you have anycomments/suggestions, please feelfree to do so.
Many thanks,Frank C.
“The first picture shows myshort entry based on a dailychart's shooting star whichconfirmed the resistance atbearish engulfing pattern.”
Harnessing the insights of intraday candles
www.candlecharts.com
32
Steve Nison’s Candlecharts.comSecrets of Intraday Candlesticks for Day and Swing Traders
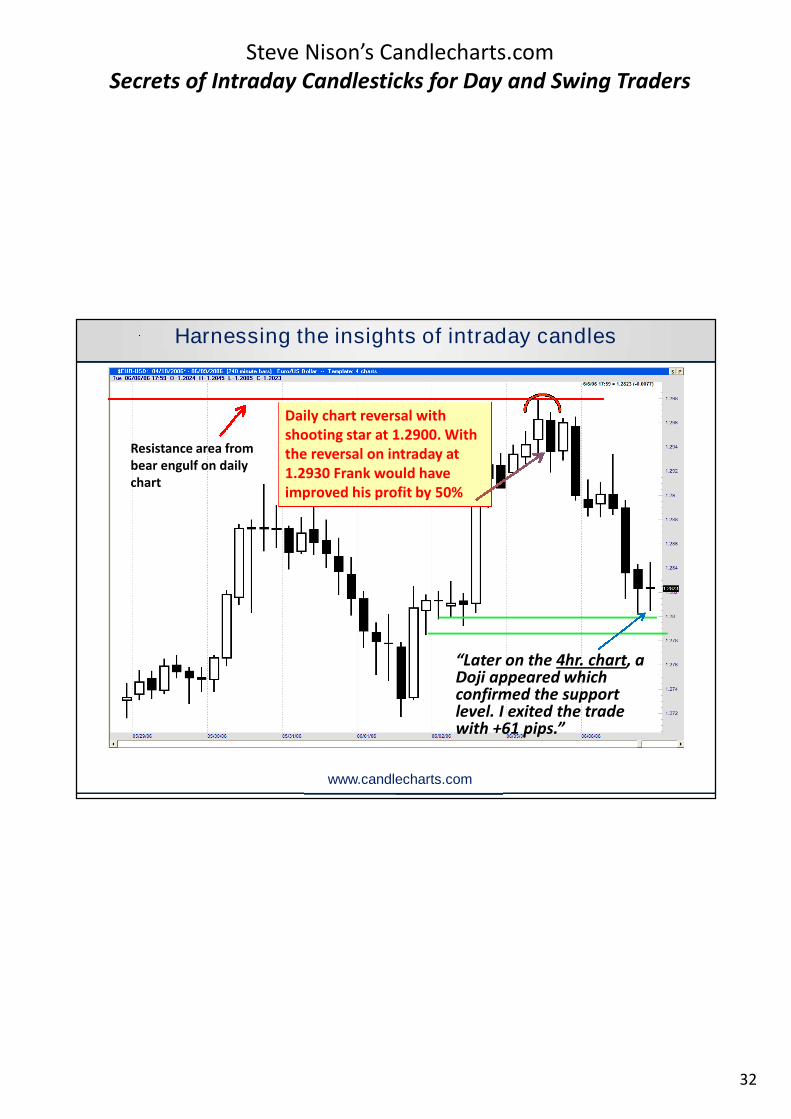
Harnessing the insights of intraday candles
“Later on the 4hr. chart, aDoji appeared whichconfirmed the supportlevel. I exited the tradewith +61 pips.”
Resistance area frombear engulf on dailychart
Daily chart reversal withshooting star at 1.2900. Withthe reversal on intraday at1.2930 Frank would haveimproved his profit by 50%
www.candlecharts.com
33
Steve Nison’s Candlecharts.comSecrets of Intraday Candlesticks for Day and Swing Traders
Secrets of IntradayCandle Charts
(for Swing Traders):Finding “Hidden”
Support/Resistance
Secrets of IntradayCandle Charts
(for Swing Traders):Finding “Hidden”
Support/Resistance

34
Steve Nison’s Candlecharts.comSecrets of Intraday Candlesticks for Day and Swing Traders
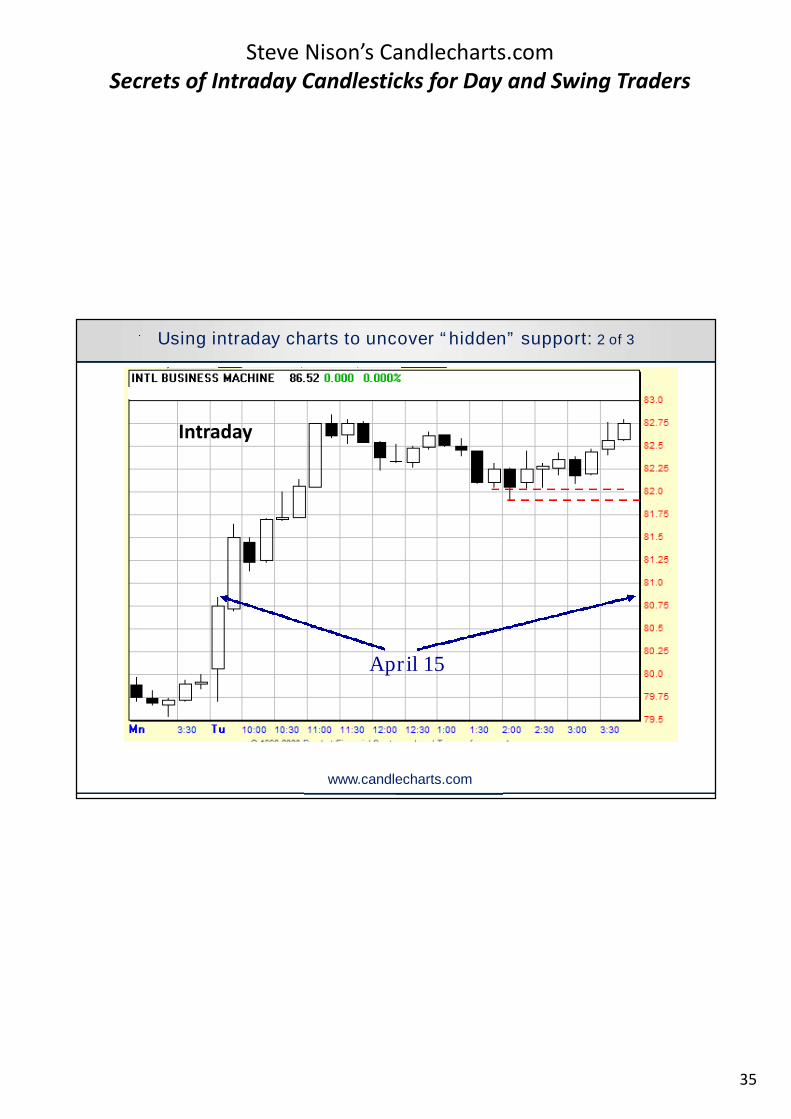
Using intraday charts to uncover “hidden” support: 1 of 3
DailyOn this daily chart where isfirst support after this tallwhite candle on April 15?Let’s go to the intraday….
www.candlecharts.com
35
Steve Nison’s Candlecharts.comSecrets of Intraday Candlesticks for Day and Swing Traders
April 15
Using intraday charts to uncover “hidden” support: 2 of 3
Intraday
www.candlecharts.com
36
Steve Nison’s Candlecharts.comSecrets of Intraday Candlesticks for Day and Swing Traders
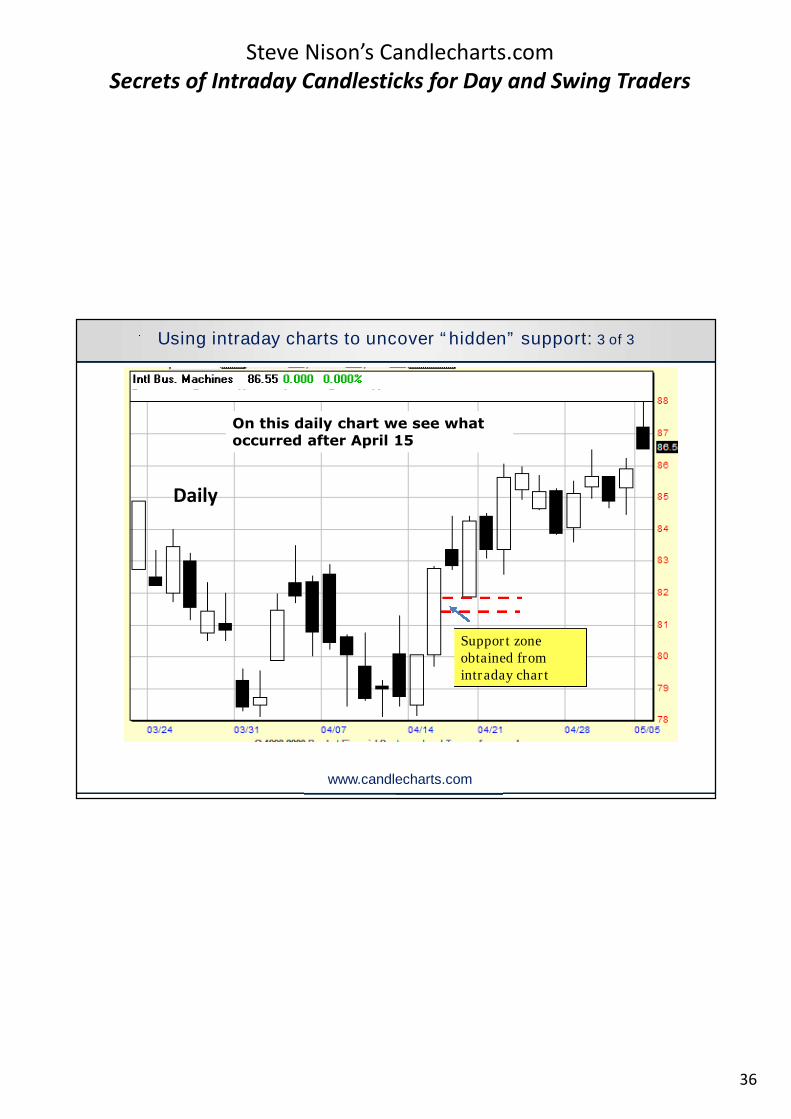
Support zoneobtained fromintraday chart
On this daily chart we see whatoccurred after April 15
Using intraday charts to uncover “hidden” support: 3 of 3
Daily
www.candlecharts.com
37
Steve Nison’s Candlecharts.comSecrets of Intraday Candlesticks for Day and Swing Traders
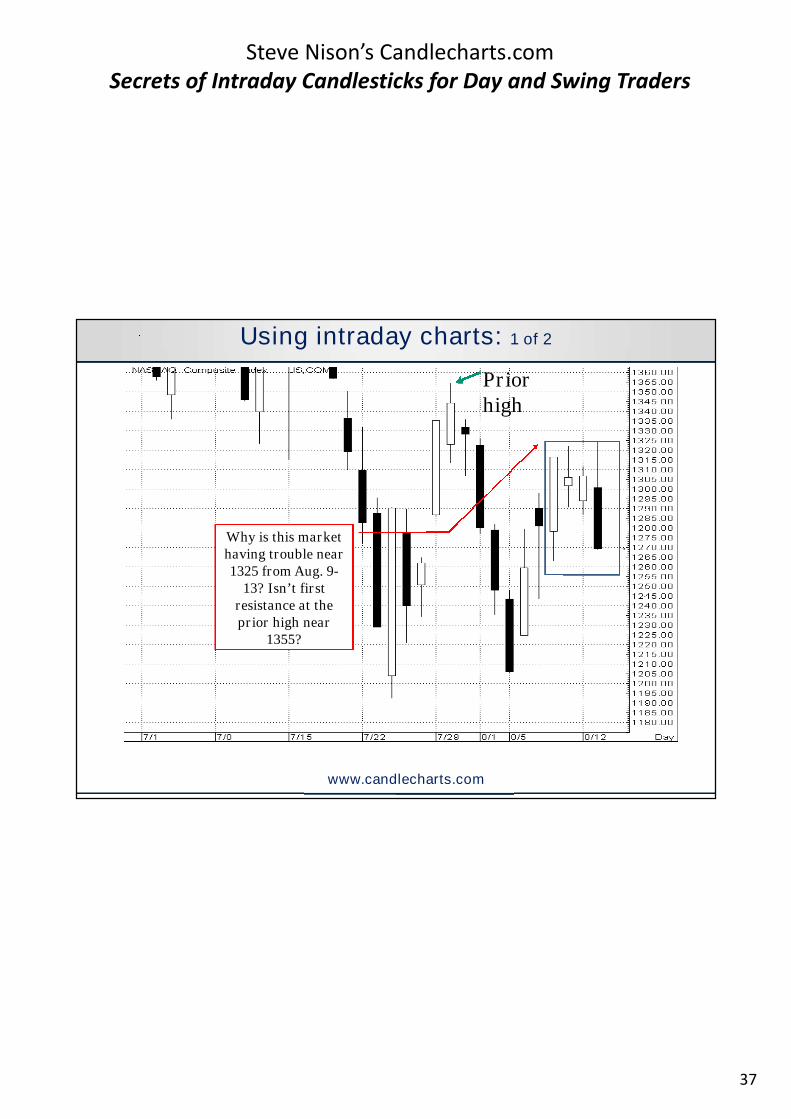
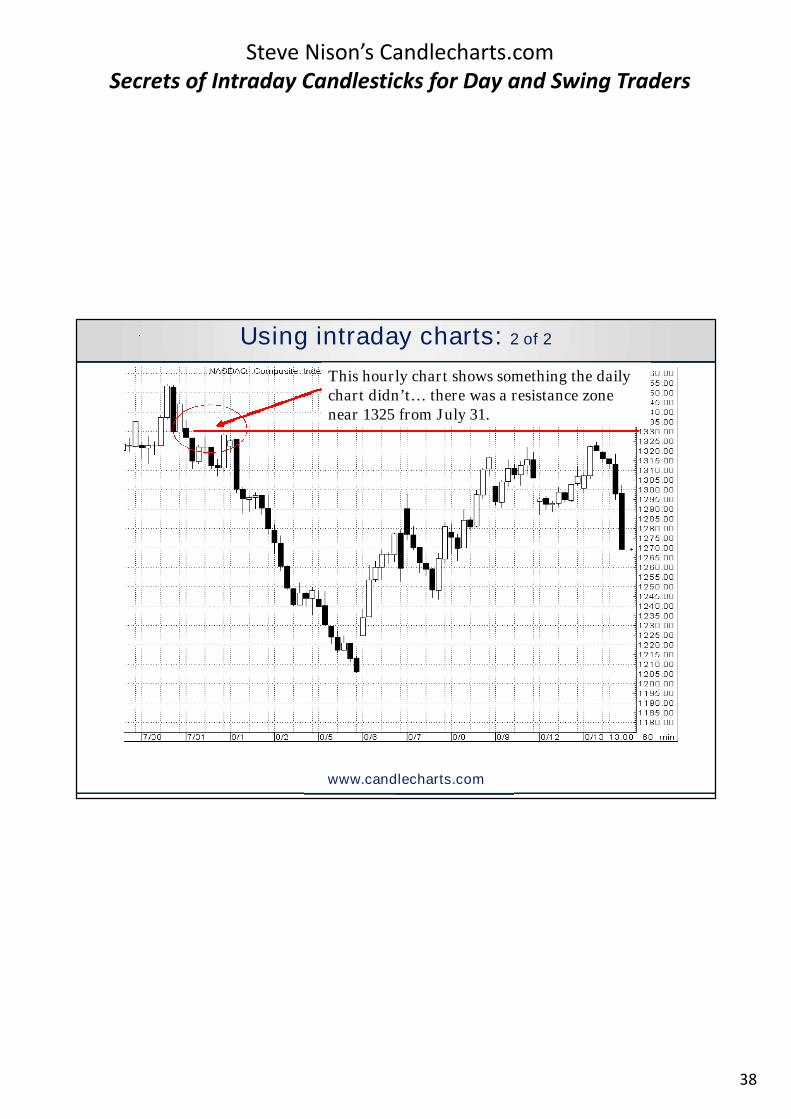
Using intraday charts: 1 of 2
Why is this markethaving trouble near1325 from Aug. 9-
13? Isn’t firstresistance at theprior high near
1355?
Priorhigh
www.candlecharts.com
38
Steve Nison’s Candlecharts.comSecrets of Intraday Candlesticks for Day and Swing Traders
This hourly chart shows something the dailychart didn’t… there was a resistance zonenear 1325 from July 31.
Using intraday charts: 2 of 2
www.candlecharts.com
39
Steve Nison’s Candlecharts.comSecrets of Intraday Candlesticks for Day and Swing Traders
40
Steve Nison’s Candlecharts.comSecrets of Intraday Candlesticks for Day and Swing Traders
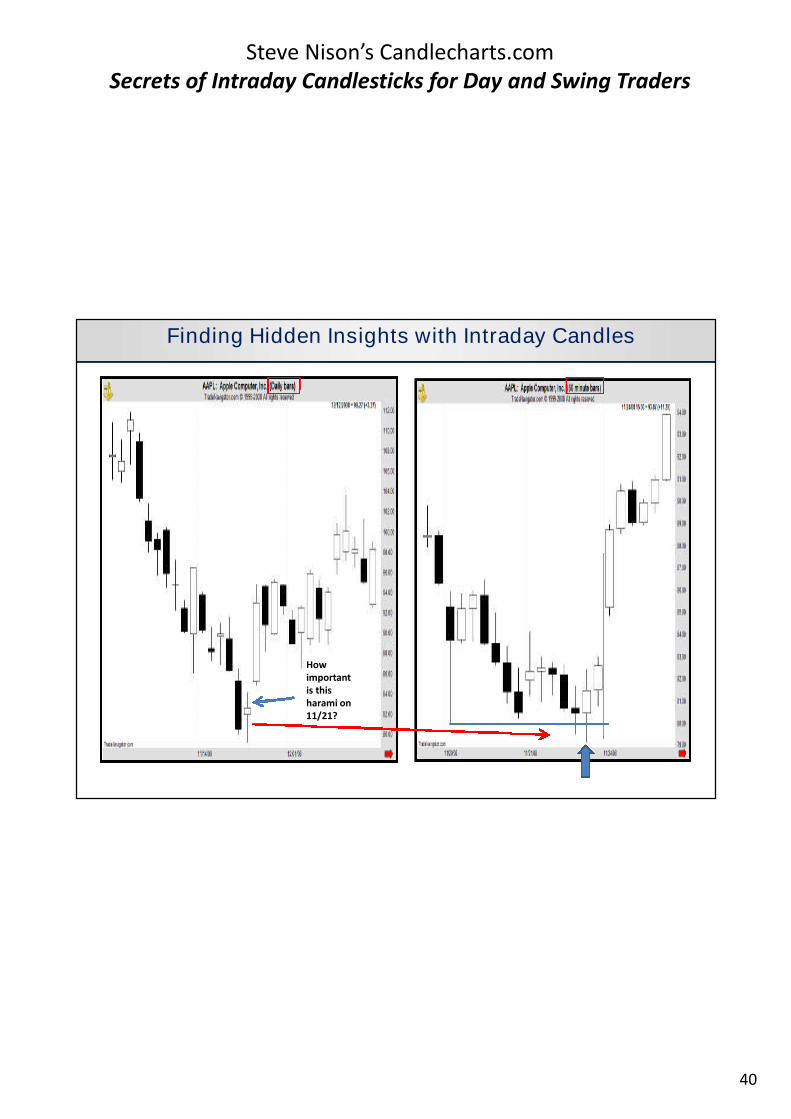
Howimportantis thisharami on11/21?
Finding Hidden Insights with Intraday Candles
41
Steve Nison’s Candlecharts.comSecrets of Intraday Candlesticks for Day and Swing Traders
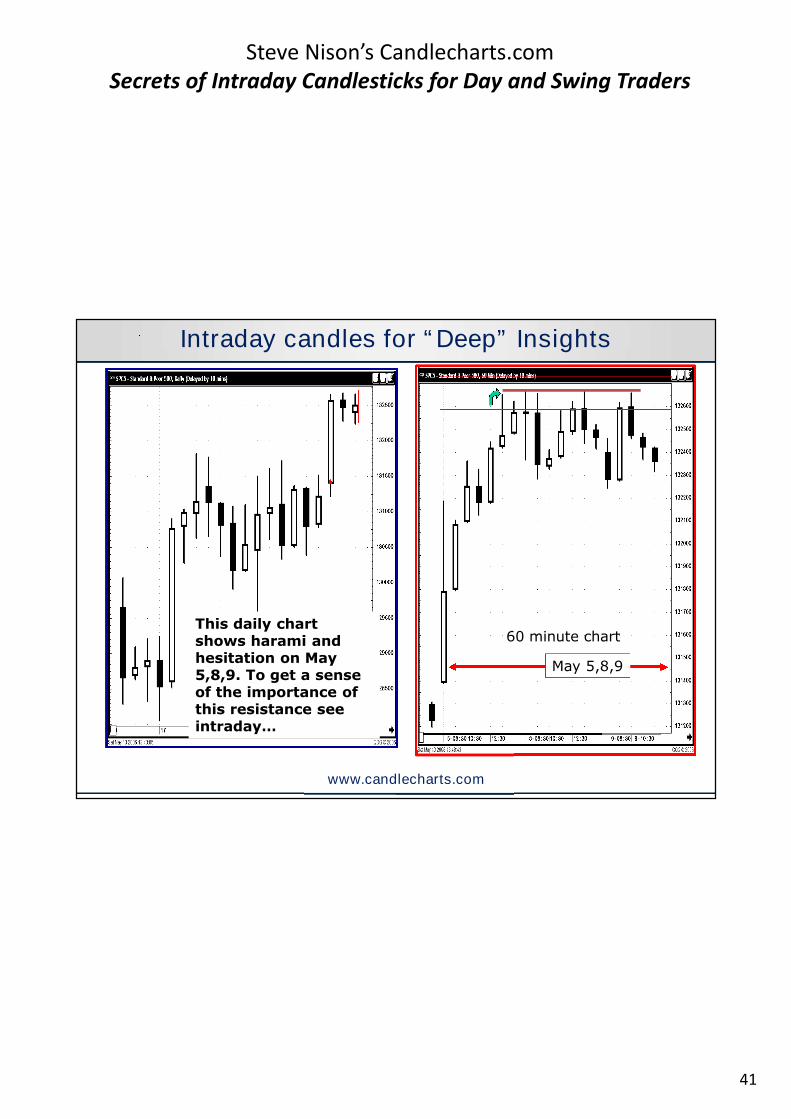
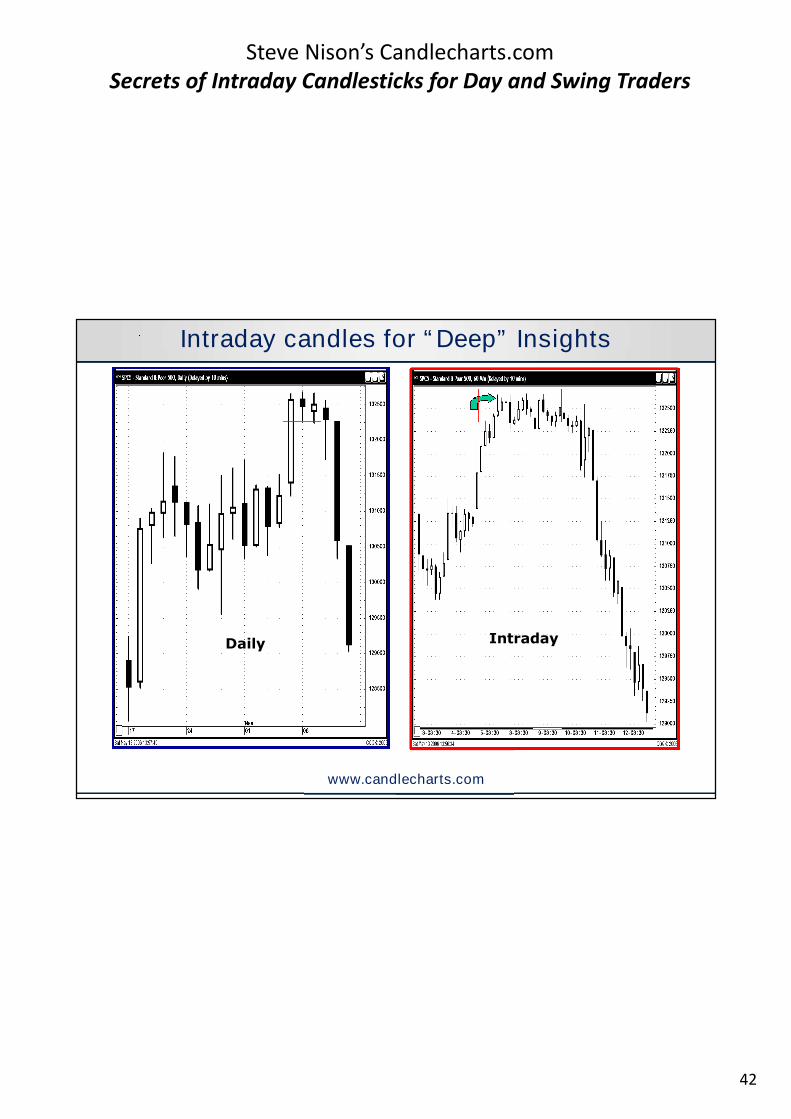
This daily chartshows harami andhesitation on May5,8,9. To get a senseof the importance ofthis resistance seeintraday…
May 5,8,9
60 minute chart
Intraday candles for “Deep” Insights
www.candlecharts.com
42
Steve Nison’s Candlecharts.comSecrets of Intraday Candlesticks for Day and Swing Traders
IntradayDaily
Intraday candles for “Deep” Insights
www.candlecharts.com

43
Steve Nison’s Candlecharts.comSecrets of Intraday Candlesticks for Day and Swing Traders
Secrets of IntradayCandle Charts
(for Swing Traders):Using Intraday Windows
Secrets of IntradayCandle Charts
(for Swing Traders):Using Intraday Windows
44
Steve Nison’s Candlecharts.comSecrets of Intraday Candlesticks for Day and Swing Traders
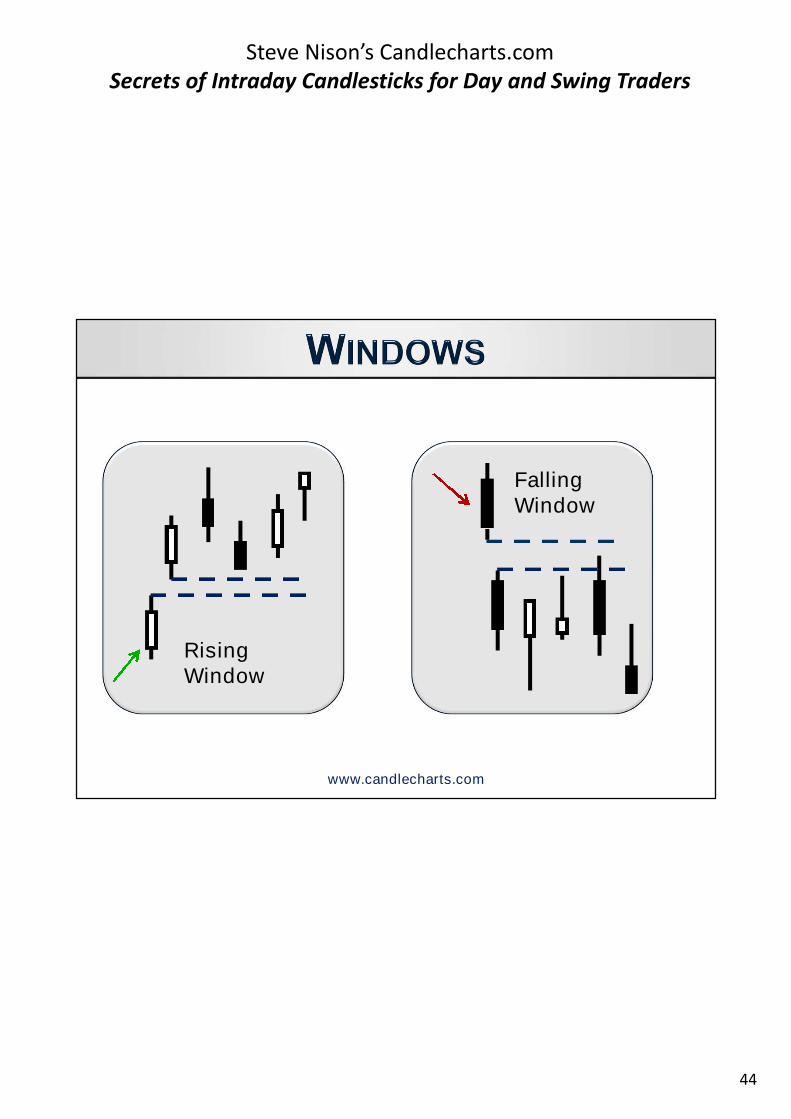
RisingWindow
FallingWindow
www.candlecharts.com
45
Steve Nison’s Candlecharts.comSecrets of Intraday Candlesticks for Day and Swing Traders
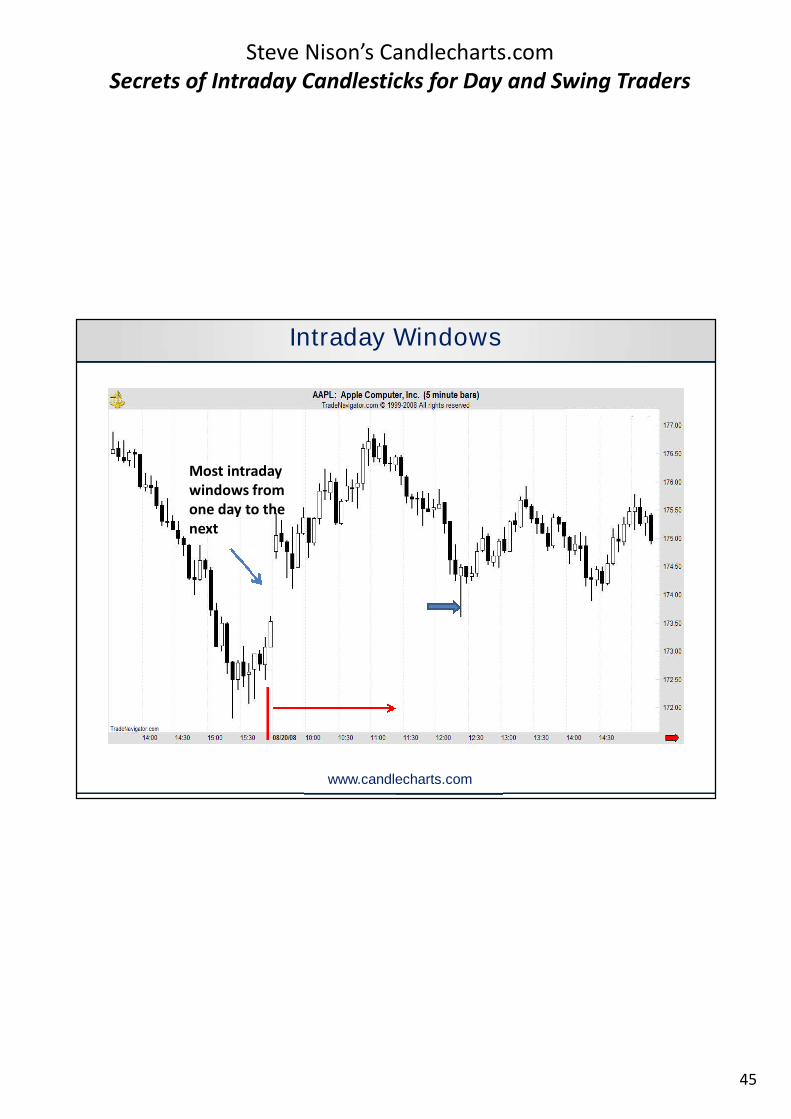
Intraday Windows
Most intradaywindows fromone day to thenext
www.candlecharts.com
46
Steve Nison’s Candlecharts.comSecrets of Intraday Candlesticks for Day and Swing Traders
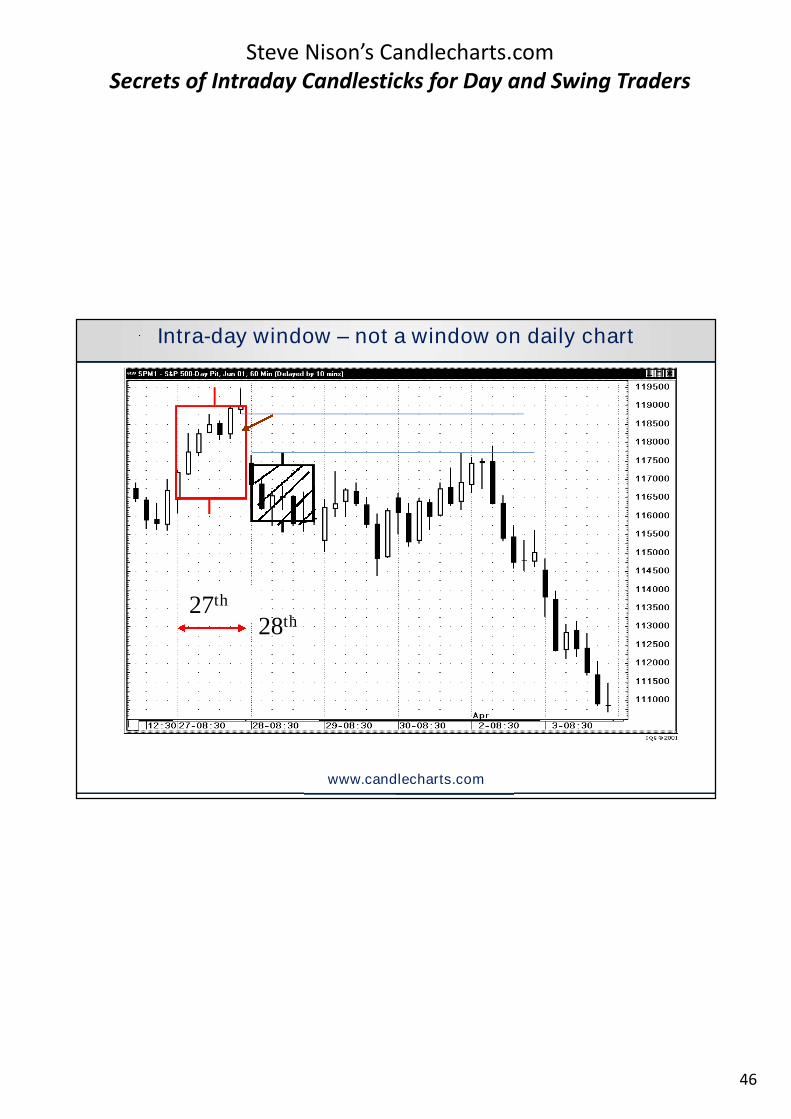
27th
28th
Intra-day window – not a window on daily chart
www.candlecharts.com
47
Steve Nison’s Candlecharts.comSecrets of Intraday Candlesticks for Day and Swing Traders
Secrets of IntradayCandle Charts
(for Swing Traders):Is the Market
Overextended?
Secrets of IntradayCandle Charts
(for Swing Traders):Is the Market
Overextended?
48
Steve Nison’s Candlecharts.comSecrets of Intraday Candlesticks for Day and Swing Traders
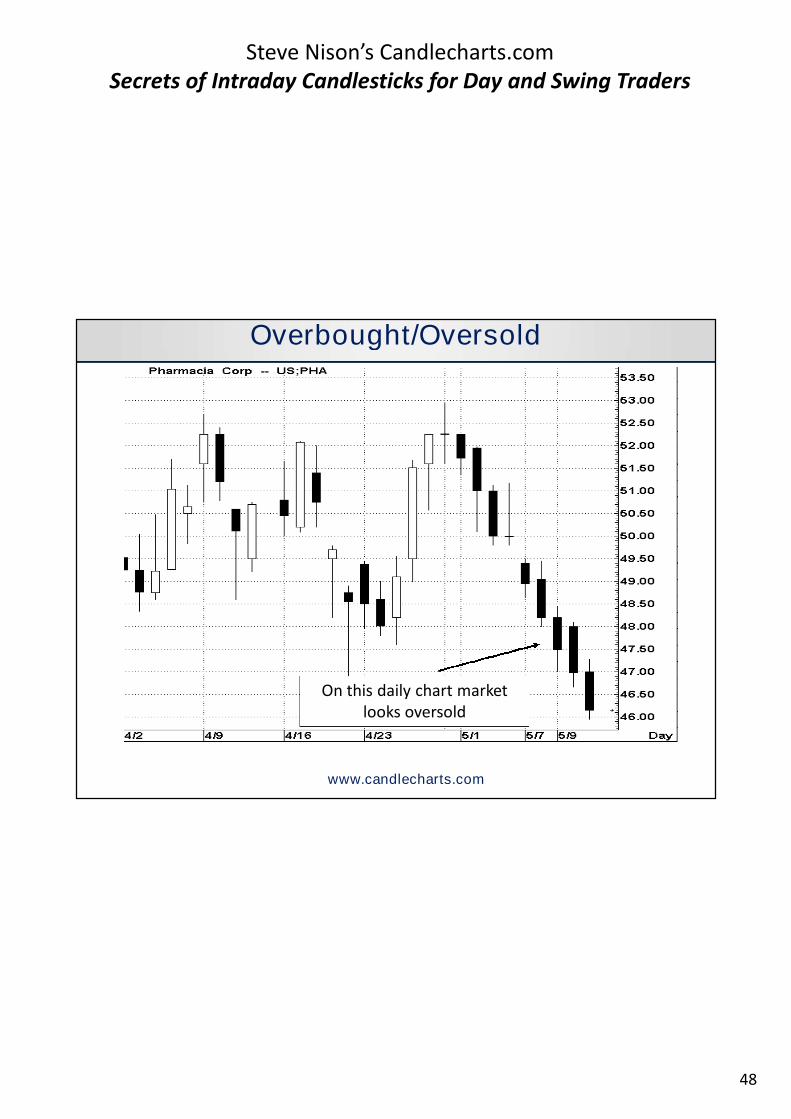
On this daily chart marketlooks oversold
Overbought/Oversold
www.candlecharts.com
49
Steve Nison’s Candlecharts.comSecrets of Intraday Candlesticks for Day and Swing Traders
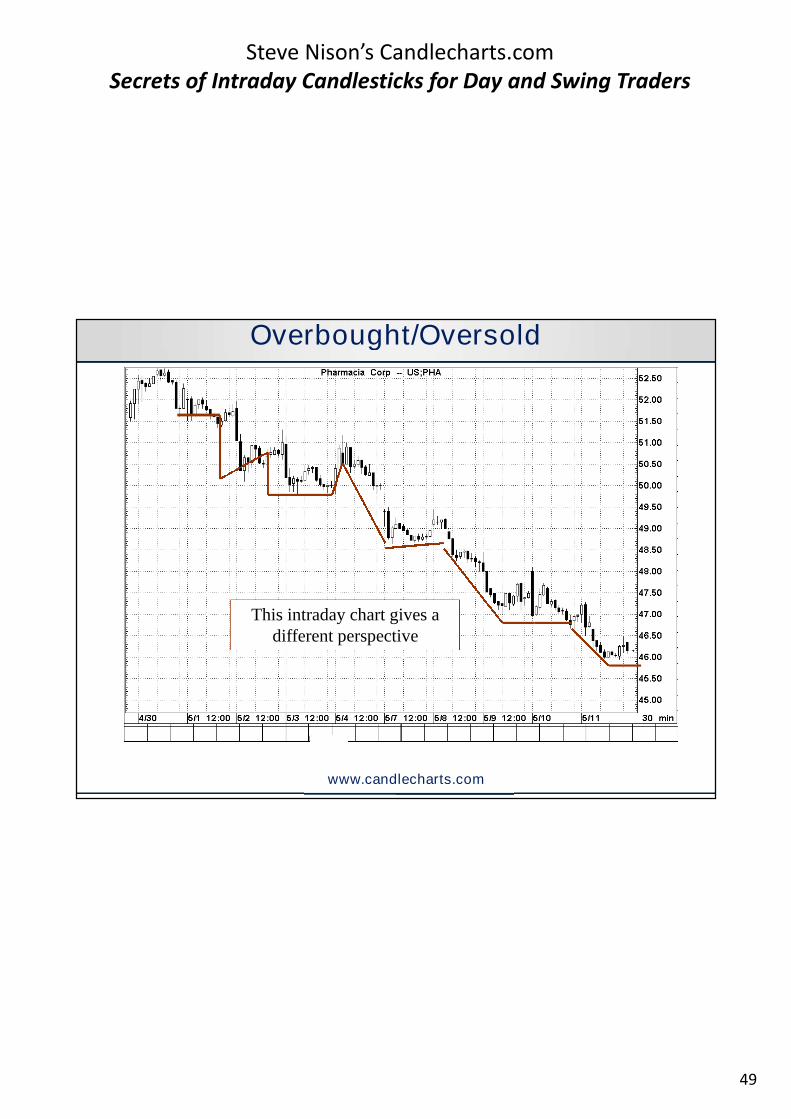
This intraday chart gives adifferent perspective
Overbought/Oversold
www.candlecharts.com
50
Steve Nison’s Candlecharts.comSecrets of Intraday Candlesticks for Day and Swing Traders
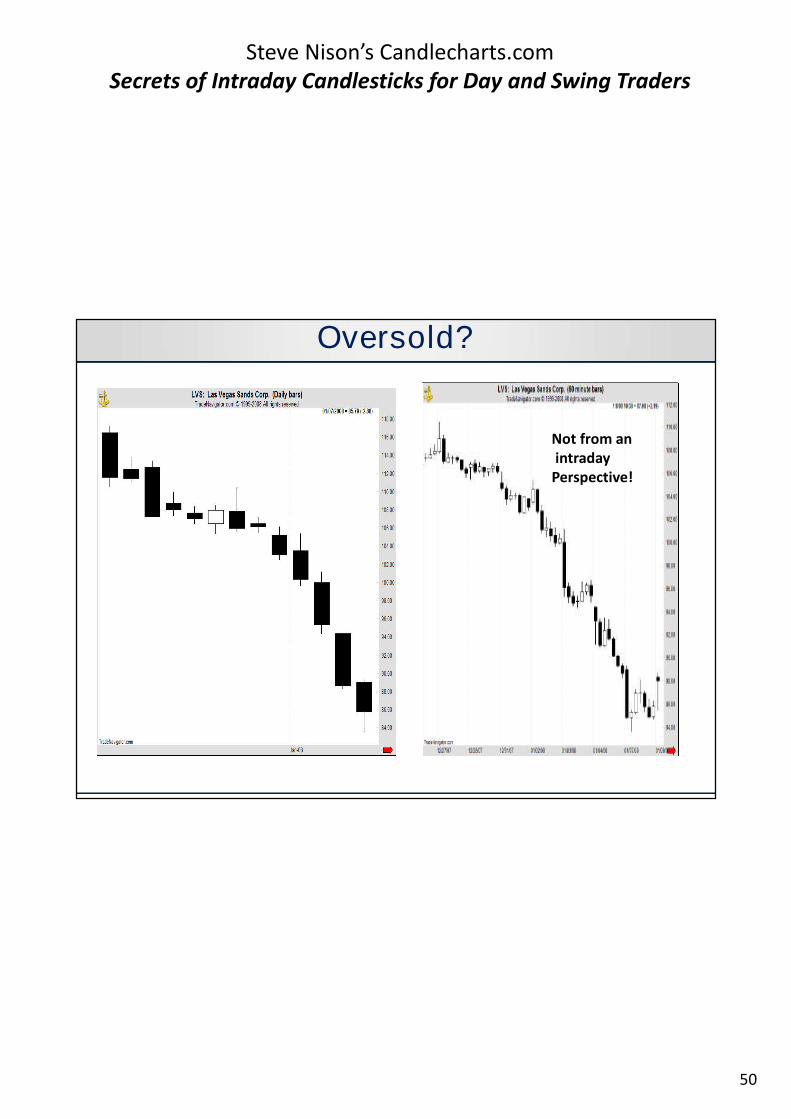
Oversold?
Not from anintraday
Perspective!
51
Steve Nison’s Candlecharts.comSecrets of Intraday Candlesticks for Day and Swing Traders
Secrets of IntradayCandle Charts
(for Swing Traders):Was There a Successful
Test ofSupport/Resistance?
Secrets of IntradayCandle Charts
(for Swing Traders):Was There a Successful
Test ofSupport/Resistance?
52
Steve Nison’s Candlecharts.comSecrets of Intraday Candlesticks for Day and Swing Traders
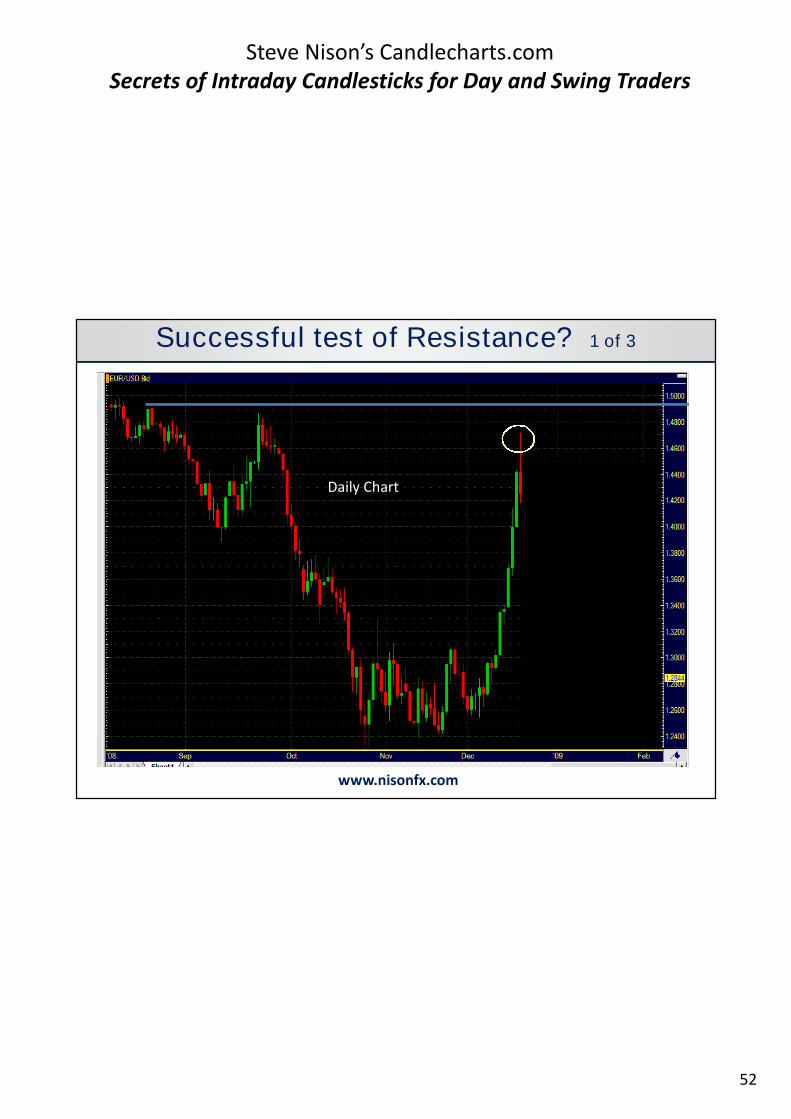
www.nisonfx.com
Successful test of Resistance? 1 of 3
Daily Chart
53
Steve Nison’s Candlecharts.comSecrets of Intraday Candlesticks for Day and Swing Traders
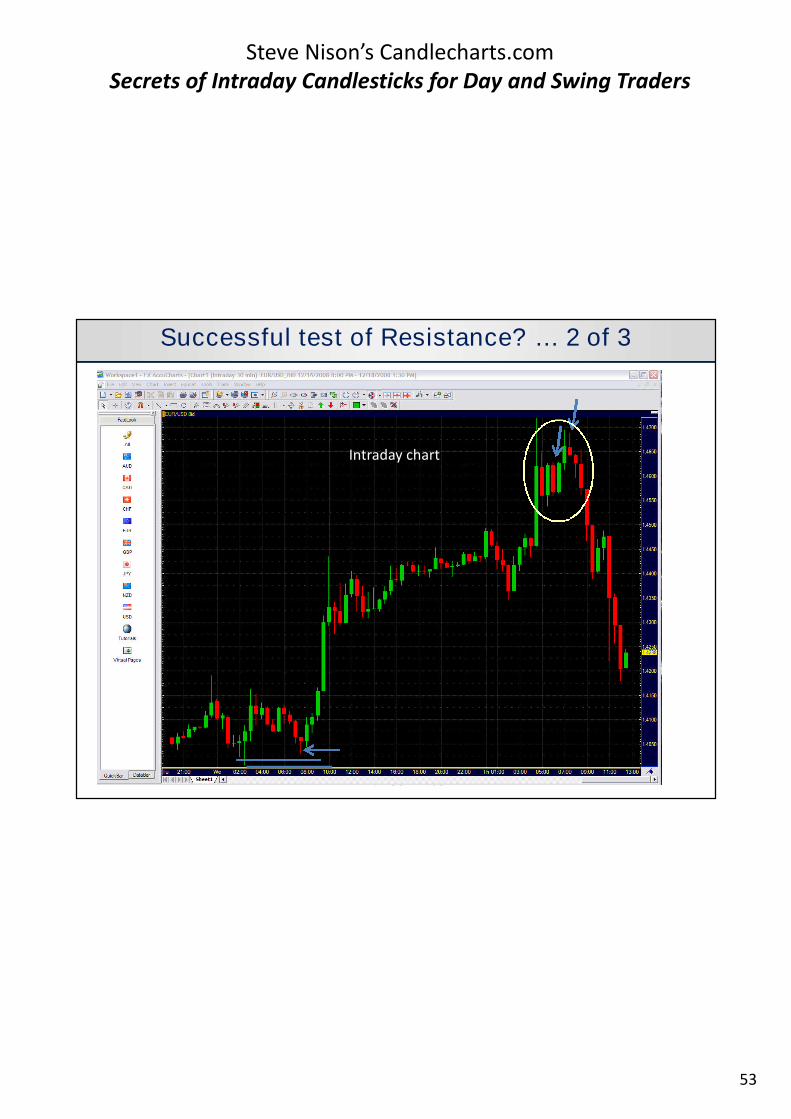
www.nisonfx.com
Successful test of Resistance? … 2 of 3
Intraday chart
54
Steve Nison’s Candlecharts.comSecrets of Intraday Candlesticks for Day and Swing Traders
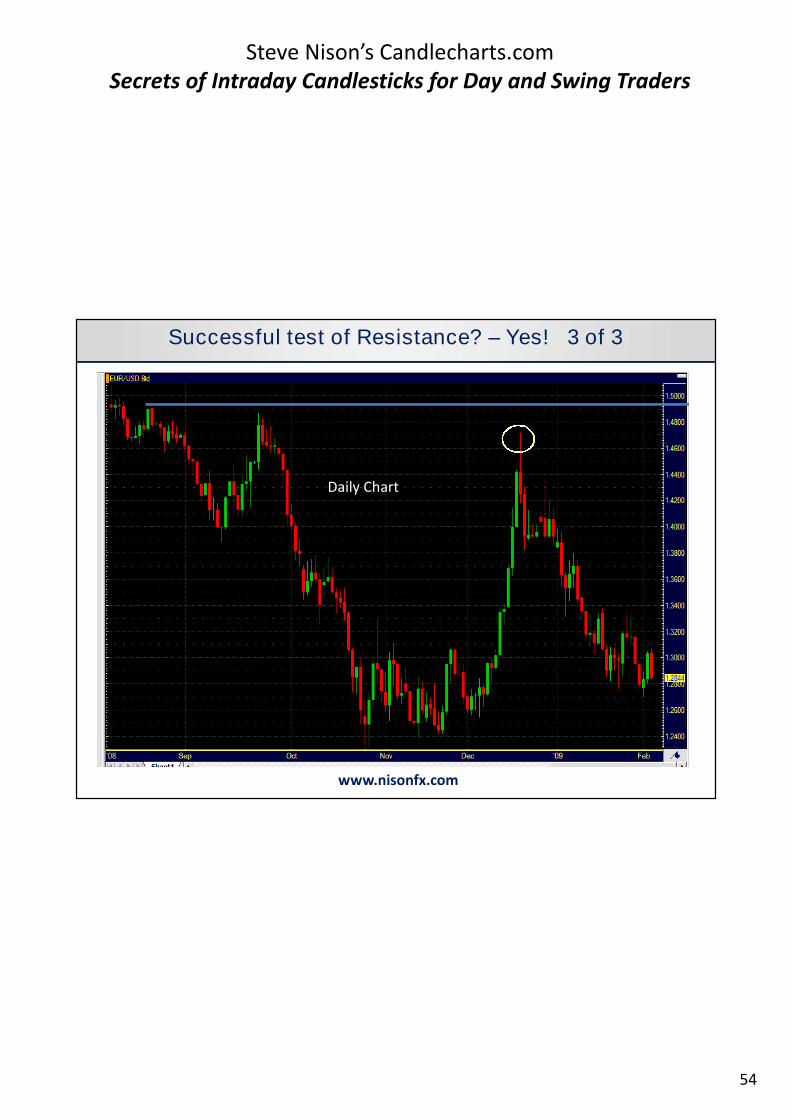
www.nisonfx.com
Successful test of Resistance? – Yes! 3 of 3
Daily Chart
55
Steve Nison’s Candlecharts.comSecrets of Intraday Candlesticks for Day and Swing Traders
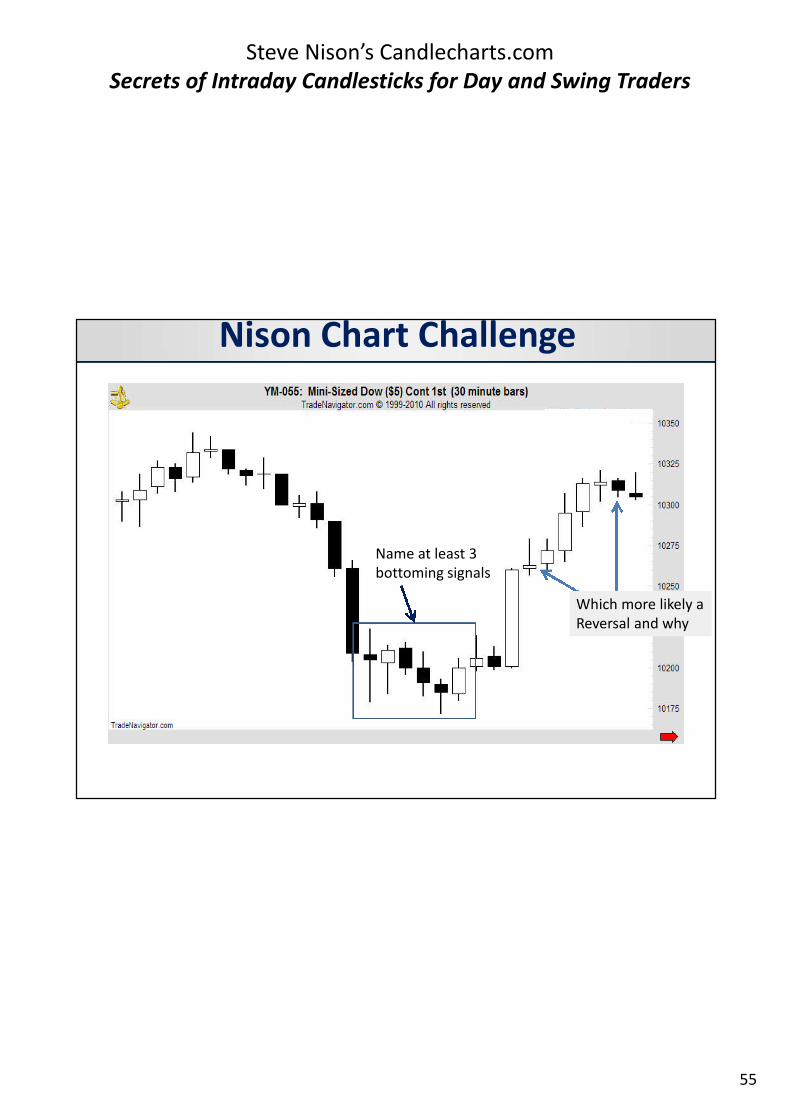
Which more likely aReversal and why
Nison Chart Challenge
Name at least 3bottoming signals
56
Steve Nison’s Candlecharts.comSecrets of Intraday Candlesticks for Day and Swing Traders
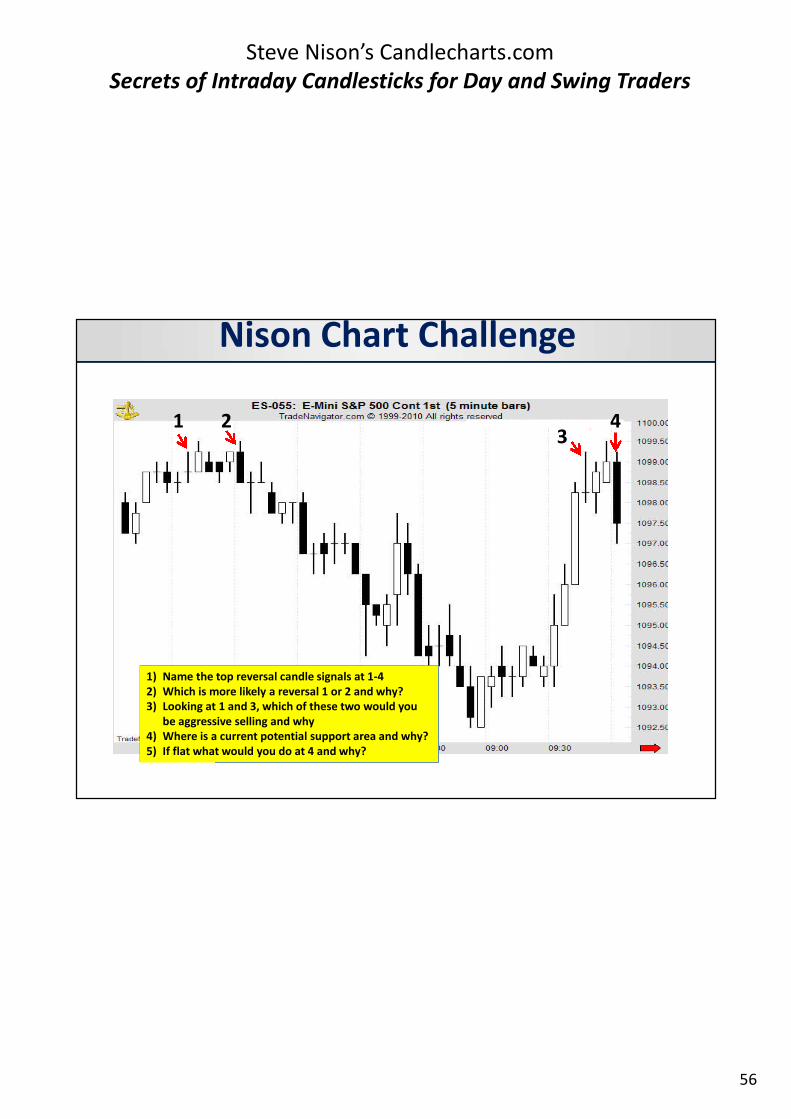
Nison Chart Challenge
1) Name the top reversal candle signals at 1-42) Which is more likely a reversal 1 or 2 and why?3) Looking at 1 and 3, which of these two would you
be aggressive selling and why4) Where is a current potential support area and why?5) If flat what would you do at 4 and why?
1 23
4
57
Steve Nison’s Candlecharts.comSecrets of Intraday Candlesticks for Day and Swing Traders
Bonus Session:Secret Trading Set Up Revealed

58
Steve Nison’s Candlecharts.comSecrets of Intraday Candlesticks for Day and Swing Traders
59
Steve Nison’s Candlecharts.comSecrets of Intraday Candlesticks for Day and Swing Traders
Is it a valid
Nison candlestick signal?
Is it a valid
Nison candlestick signal?
Boost Your Candle ConfidenceBoost Your Candle Confidence
60
Steve Nison’s Candlecharts.comSecrets of Intraday Candlesticks for Day and Swing Traders
1
2
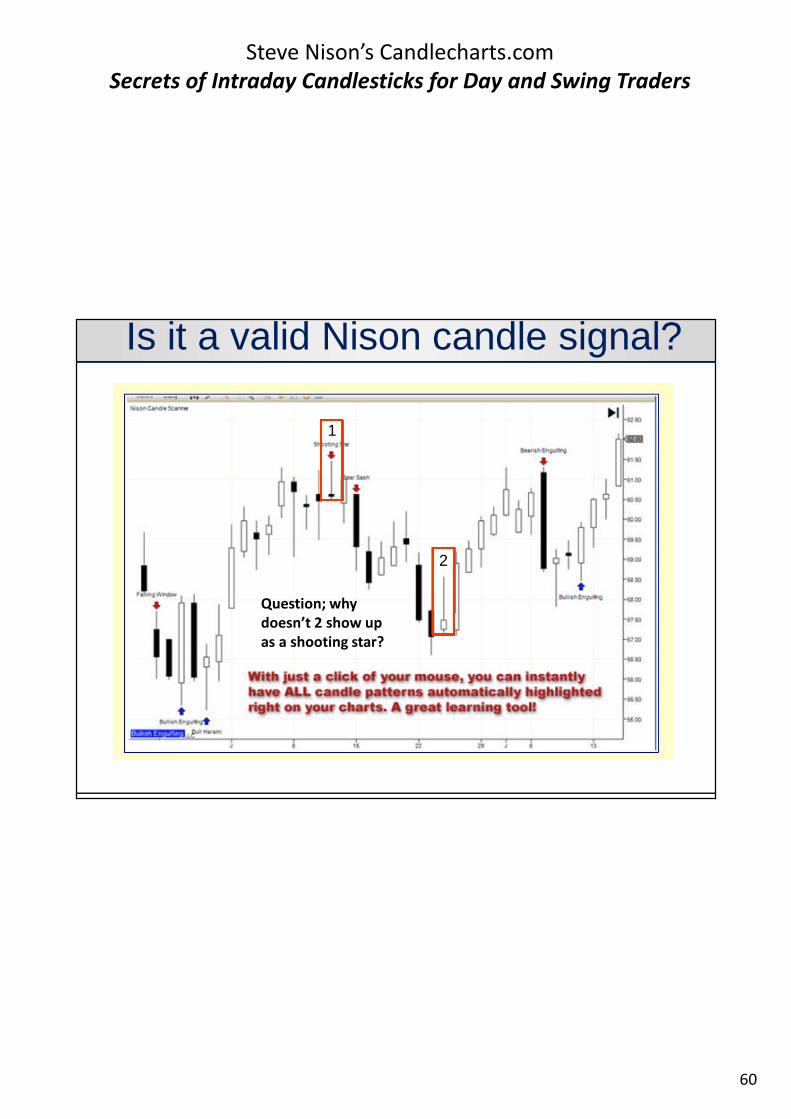
Question; whydoesn’t 2 show upas a shooting star?
Is it a valid Nison candle signal?
61
Steve Nison’s Candlecharts.comSecrets of Intraday Candlesticks for Day and Swing Traders
Get Entry/ExitSignals BeforeOther Traders
See Them!
Get Entry/ExitSignals BeforeOther Traders
See Them!
62
Steve Nison’s Candlecharts.comSecrets of Intraday Candlesticks for Day and Swing Traders
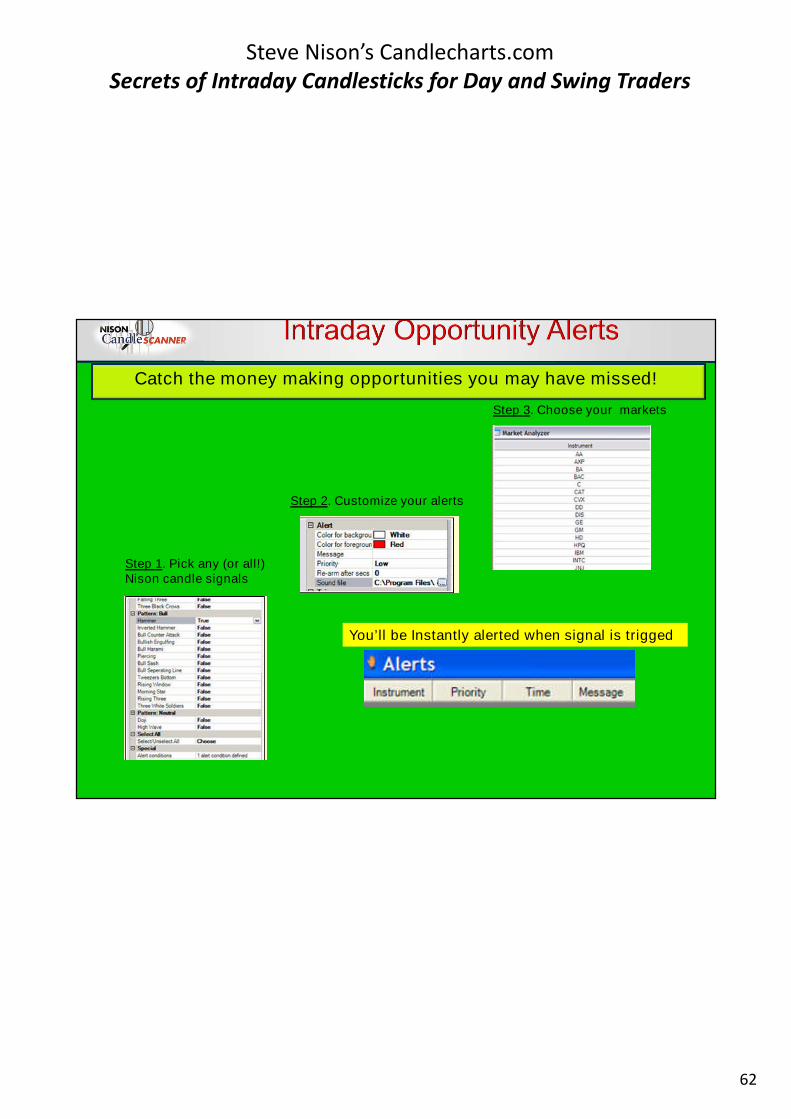
Step 1. Pick any (or all!)Nison candle signals
Step 2. Customize your alerts
Step 3. Choose your markets
You’ll be Instantly alerted when signal is trigged
Catch the money making opportunities you may have missed!
63
Steve Nison’s Candlecharts.comSecrets of Intraday Candlesticks for Day and Swing Traders
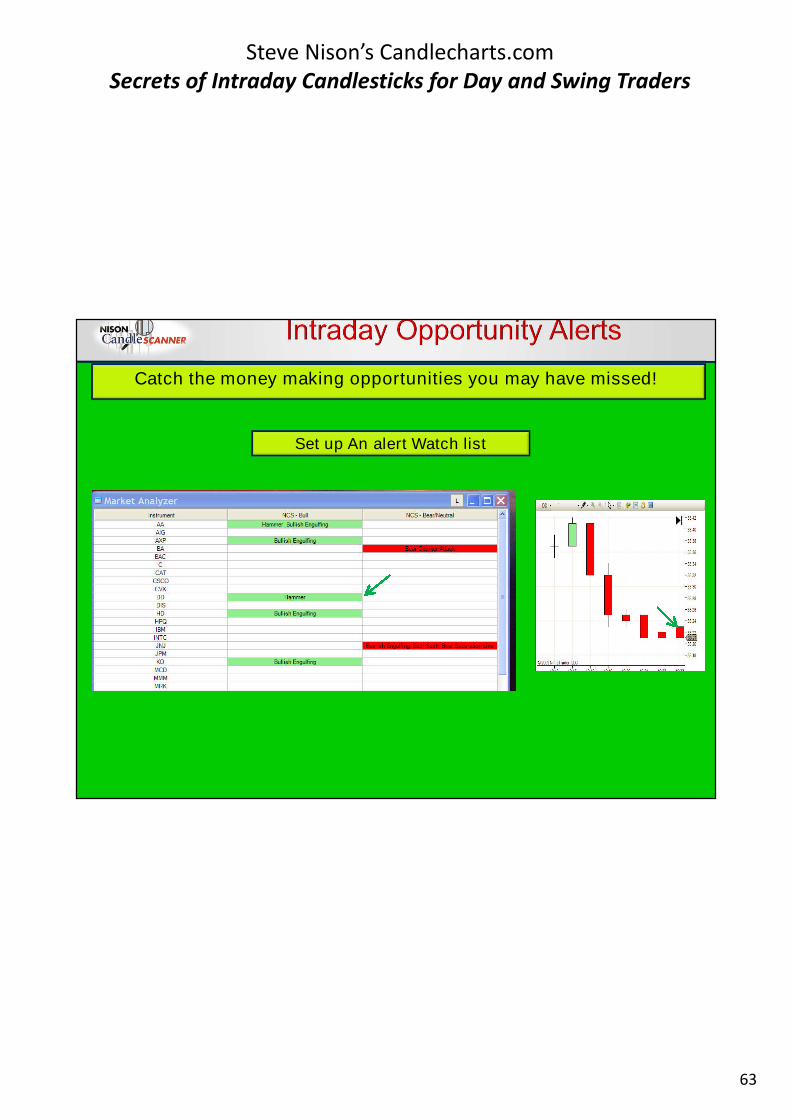
Catch the money making opportunities you may have missed!
Set up An alert Watch list
64
Steve Nison’s Candlecharts.comSecrets of Intraday Candlesticks for Day and Swing Traders
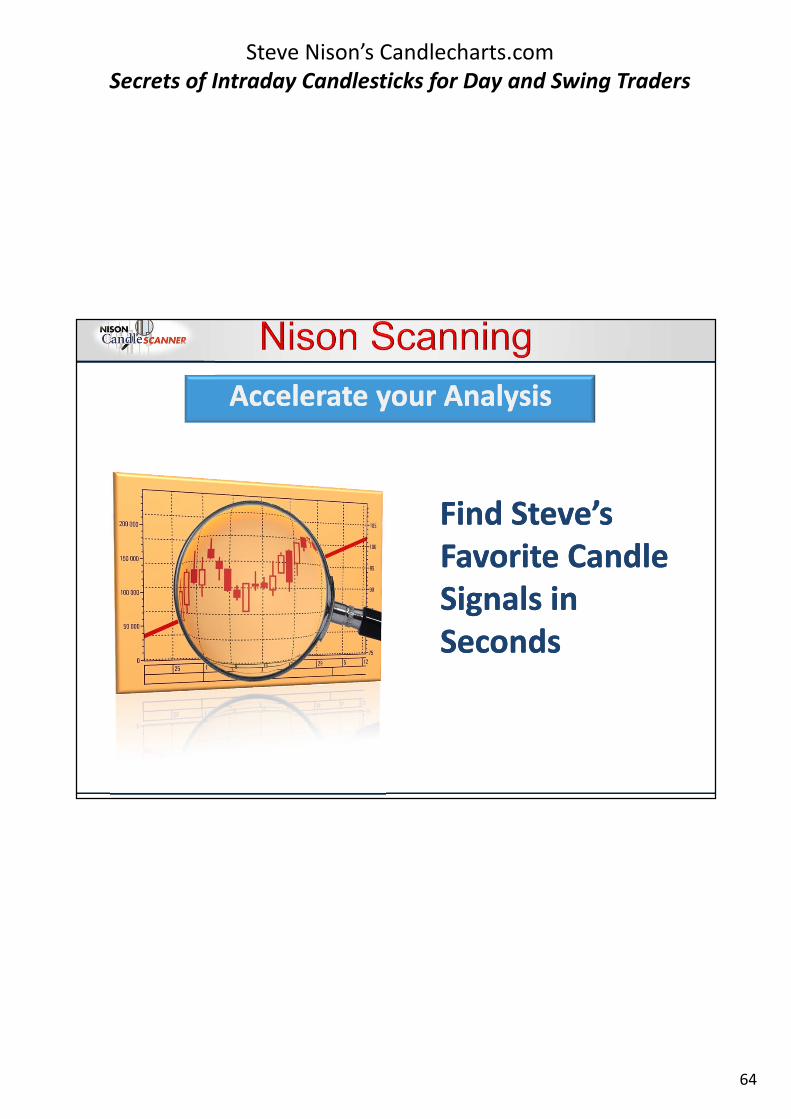
Find Steve’sFavorite CandleSignals inSeconds
Find Steve’sFavorite CandleSignals inSeconds
Accelerate your AnalysisAccelerate your Analysis
65
Steve Nison’s Candlecharts.comSecrets of Intraday Candlesticks for Day and Swing Traders
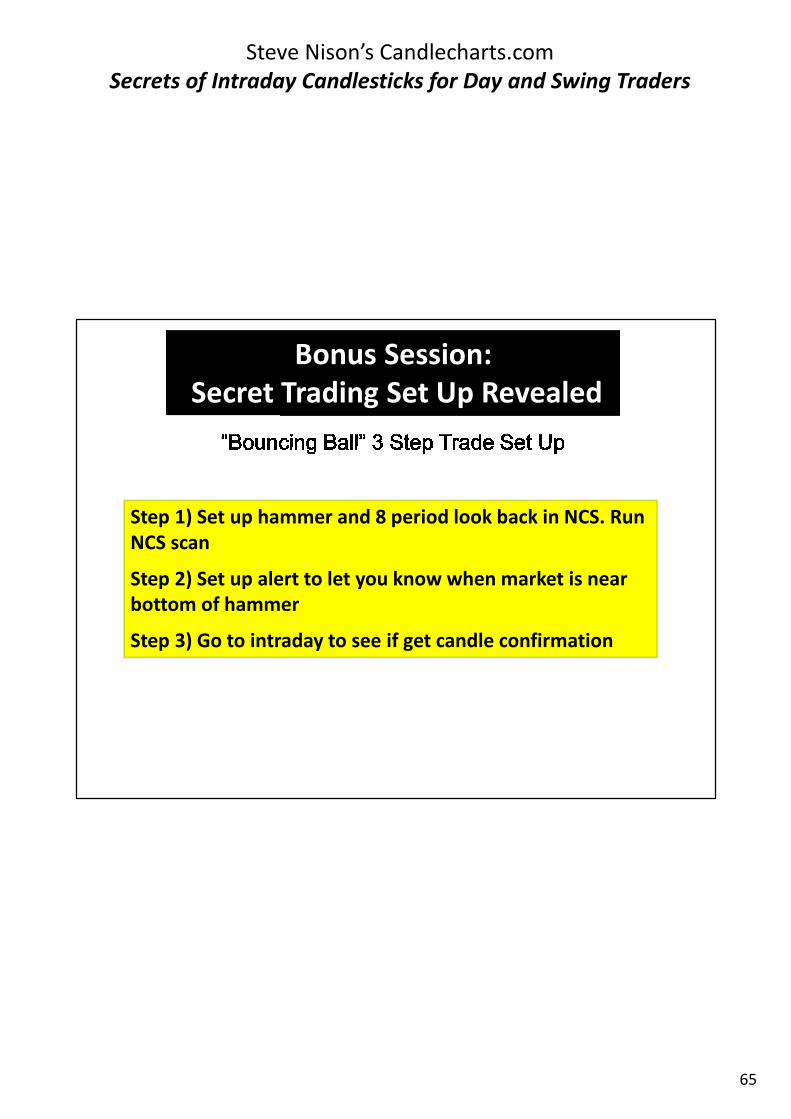
Bonus Session:Secret Trading Set Up Revealed
Step 1) Set up hammer and 8 period look back in NCS. RunNCS scan
Step 2) Set up alert to let you know when market is nearbottom of hammer
Step 3) Go to intraday to see if get candle confirmation
66
Steve Nison’s Candlecharts.comSecrets of Intraday Candlesticks for Day and Swing Traders
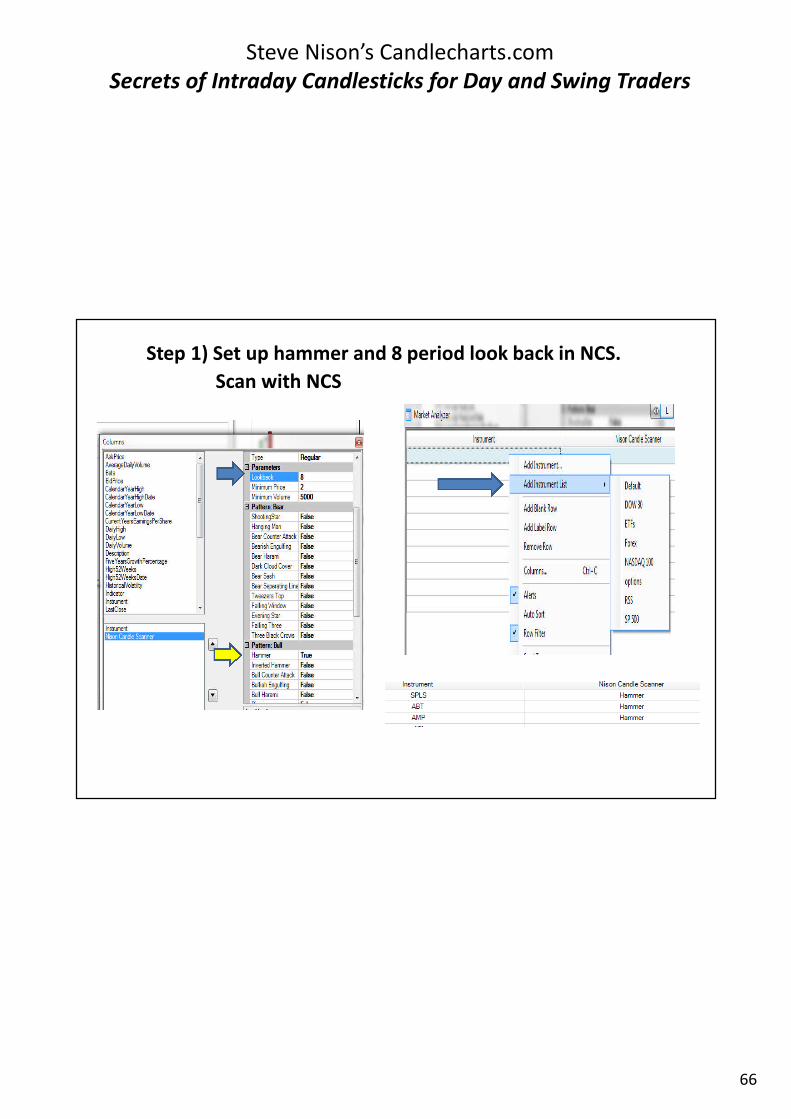
Step 1) Set up hammer and 8 period look back in NCS.
Scan with NCS
67
Steve Nison’s Candlecharts.comSecrets of Intraday Candlesticks for Day and Swing Traders
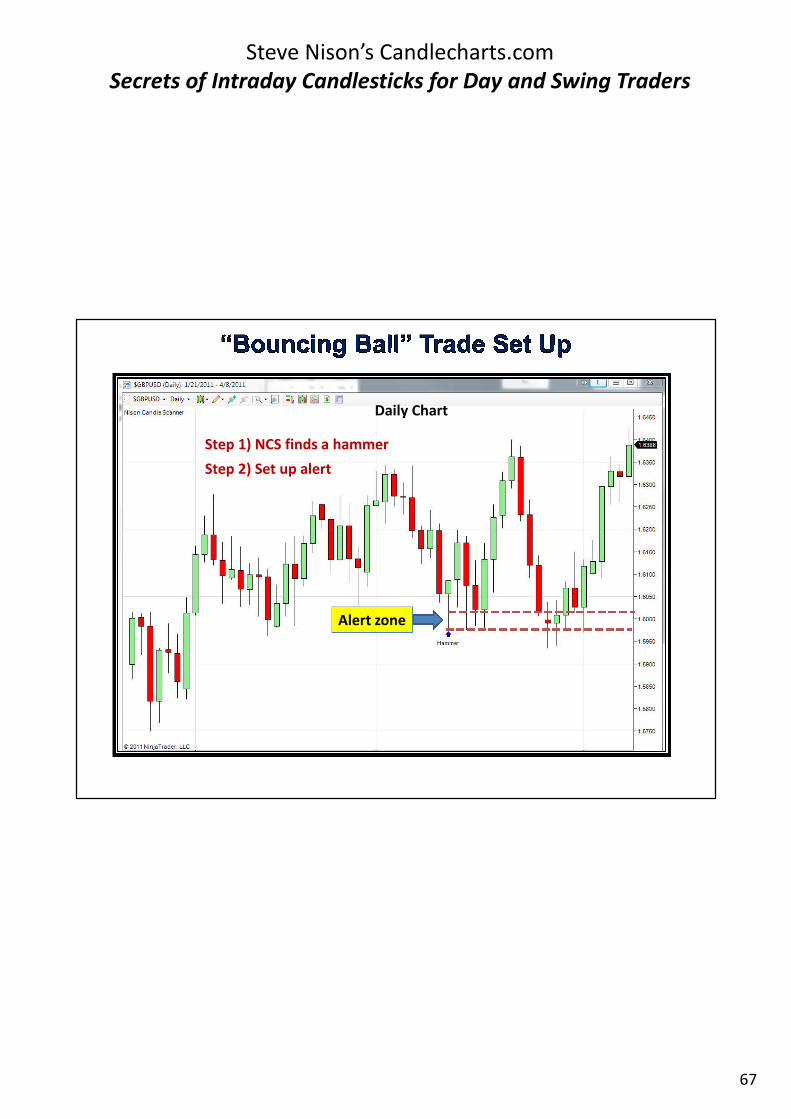
Alert zone
Step 1) NCS finds a hammer
Step 2) Set up alert
Daily Chart
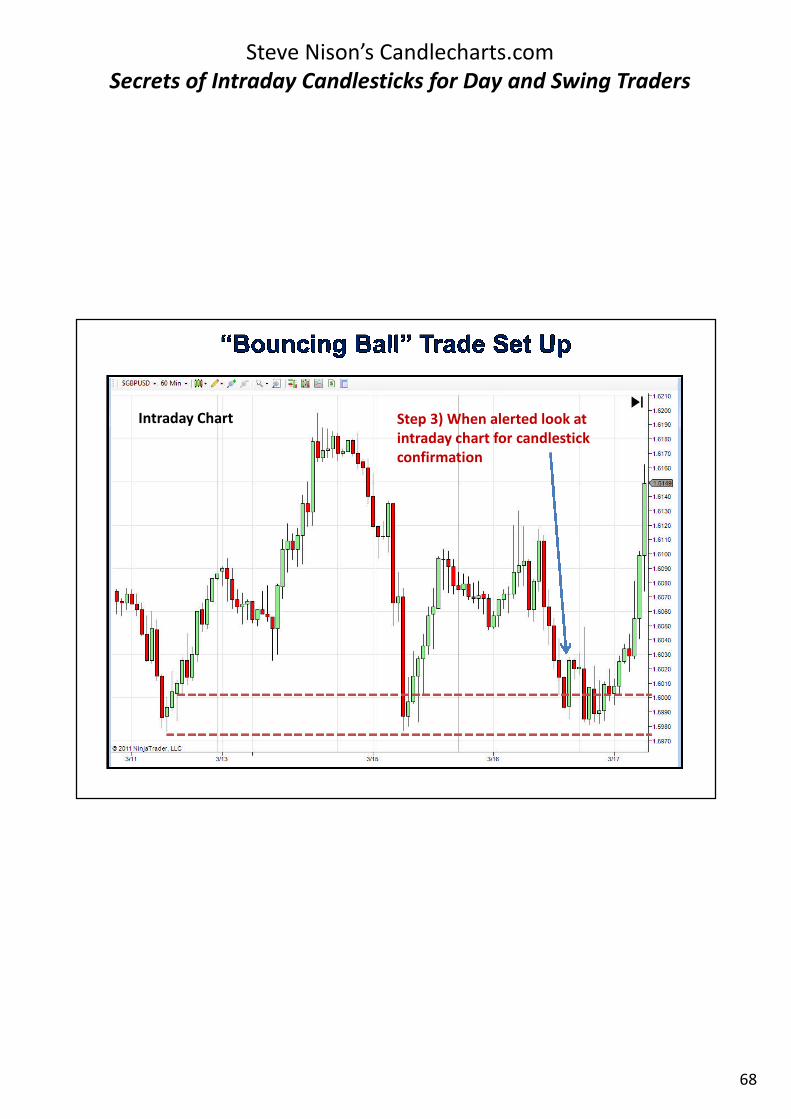
68
Steve Nison’s Candlecharts.comSecrets of Intraday Candlesticks for Day and Swing Traders
Step 3) When alerted look atintraday chart for candlestickconfirmation
Intraday Chart
69
Steve Nison’s Candlecharts.comSecrets of Intraday Candlesticks for Day and Swing Traders
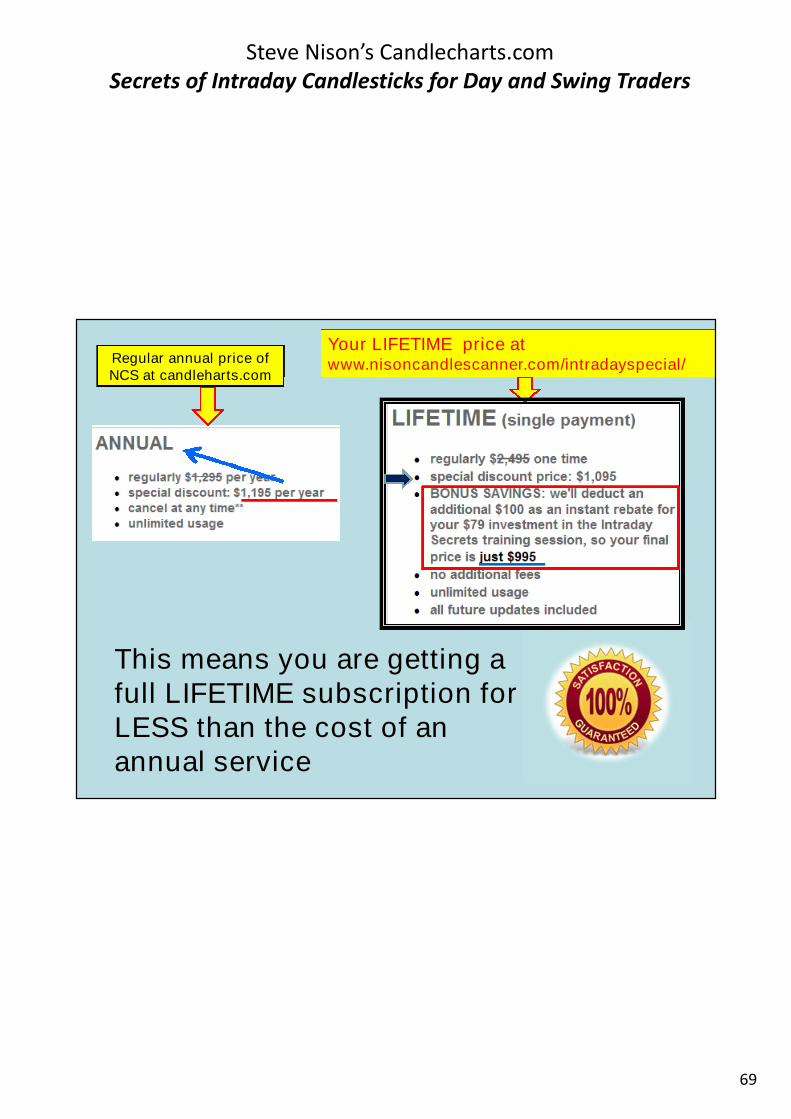
Regular annual price ofNCS at candleharts.com
Your LIFETIME price atwww.nisoncandlescanner.com/intradayspecial/
This means you are getting afull LIFETIME subscription forLESS than the cost of anannual service
70
Steve Nison’s Candlecharts.comSecrets of Intraday Candlesticks for Day and Swing Traders
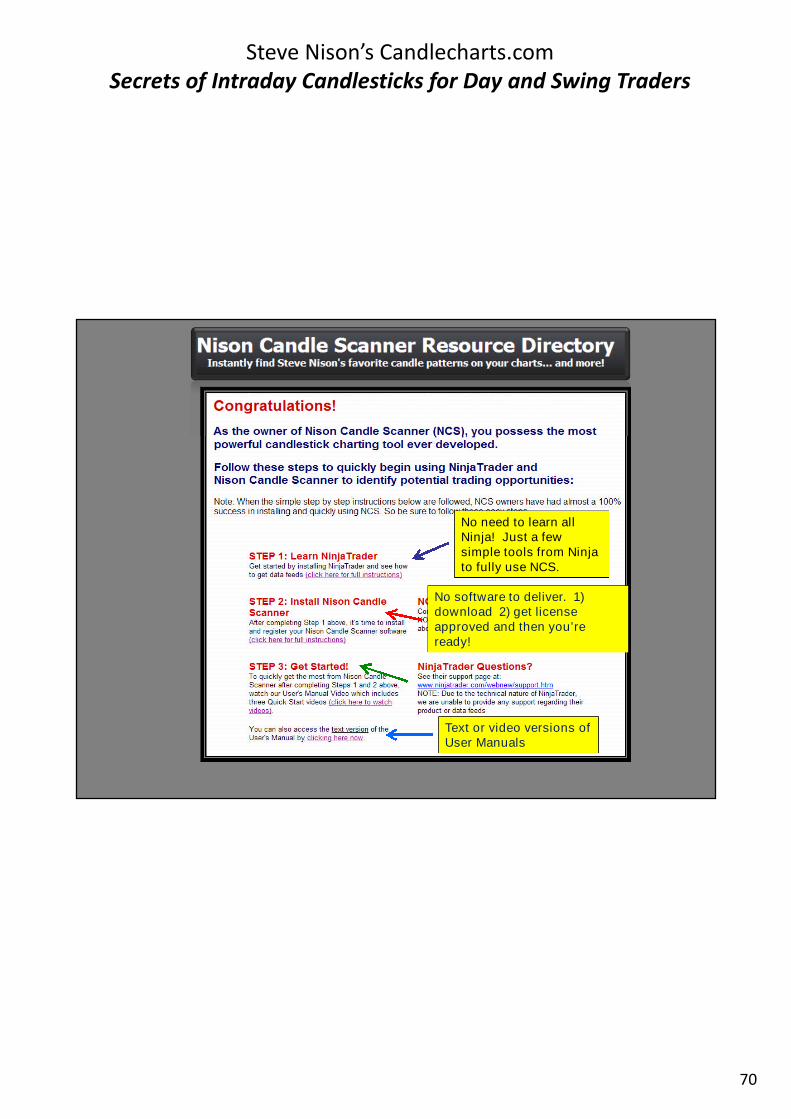
No need to learn allNinja! Just a fewsimple tools from Ninjato fully use NCS.
No software to deliver. 1)download 2) get licenseapproved and then you’reready!
Text or video versions ofUser Manuals

71
Steve Nison’s Candlecharts.comSecrets of Intraday Candlesticks for Day and Swing Traders
Intraday Secrets Seminar Extra Bonus
INSTANT Free Upgrade fromNCS to NCS PRO:Pro version includes theIntraday and FX ModulesA $1,490 value!
www.nisoncandlescanner.com/intradayspecial
72
Steve Nison’s Candlecharts.comSecrets of Intraday Candlesticks for Day and Swing Traders
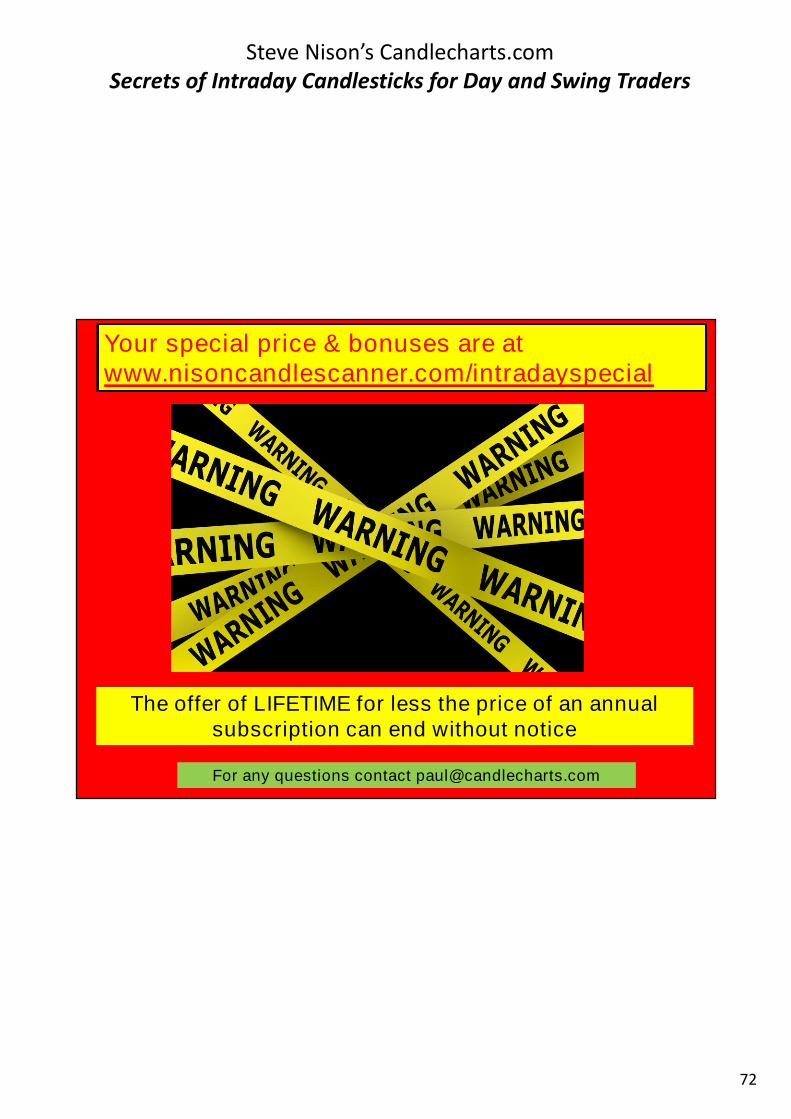
The offer of LIFETIME for less the price of an annualsubscription can end without notice
Your special price & bonuses are atwww.nisoncandlescanner.com/intradayspecial
For any questions contact [email protected]