second laboratory demonstration of us epa lc … lab... · second laboratory demonstration of us...
TRANSCRIPT

Second Laboratory
Demonstration of US EPA
LC-MS/MS Methods
Don Noot Noot Analytical Consulting Ltd.
Lethbridge, AB, Canada
Presented at 2015 WCTOW, Calgary AB

2
• Located in beautiful Cochrane, AB
• LC-QQQ, LC-QTOF and GC-QQQ
Analytical Testing
Consulting
• Method
Development
• Training
www.vogonlabs.ca
Vogon Laboratory Services

3
LC and GC-MS and MS/MS
Method Development
Training
Noot Analytical Consulting Ltd.
Quality Systems
QMS Manual & Document
Method Validation
www.nootac.ca

4
A mosquito was heard to complain
that a chemist had poisoned his brain.
The cause of his sorrow
was para-Dichloro-
diphenyltrichloroethane
Get your Geek on… 70’s style
US EPA Second Lab Demonstration
• Requires Initial Demonstration of Capability
• Low system background
• Precision
• Accuracy
• Detection Limits
• MRL (Min Reporting Limit)
• DL (Detection Limit)
• LCMRL (Lowest Concentration Min Reporting Level)
5
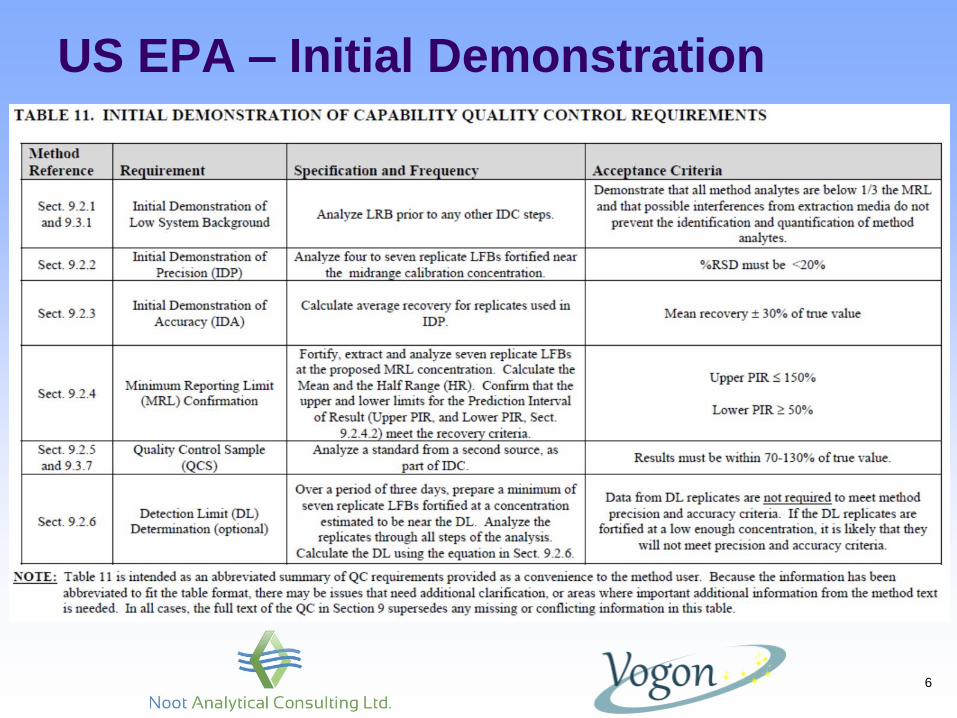
US EPA – Initial Demonstration
6
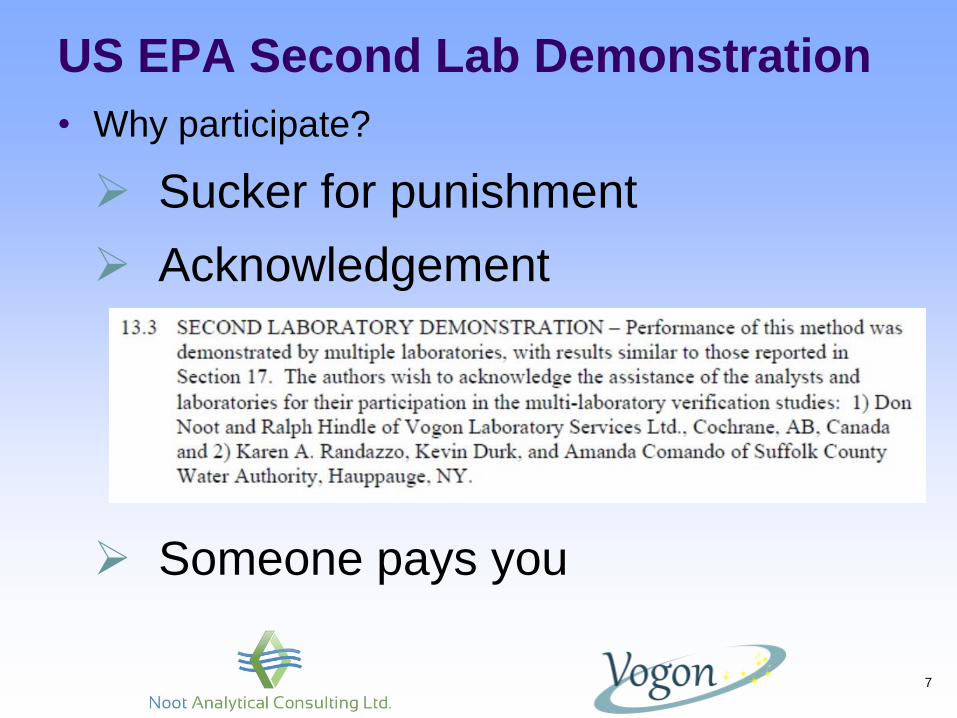
US EPA Second Lab Demonstration
• Why participate?
Sucker for punishment
Acknowledgement
Someone pays you
7
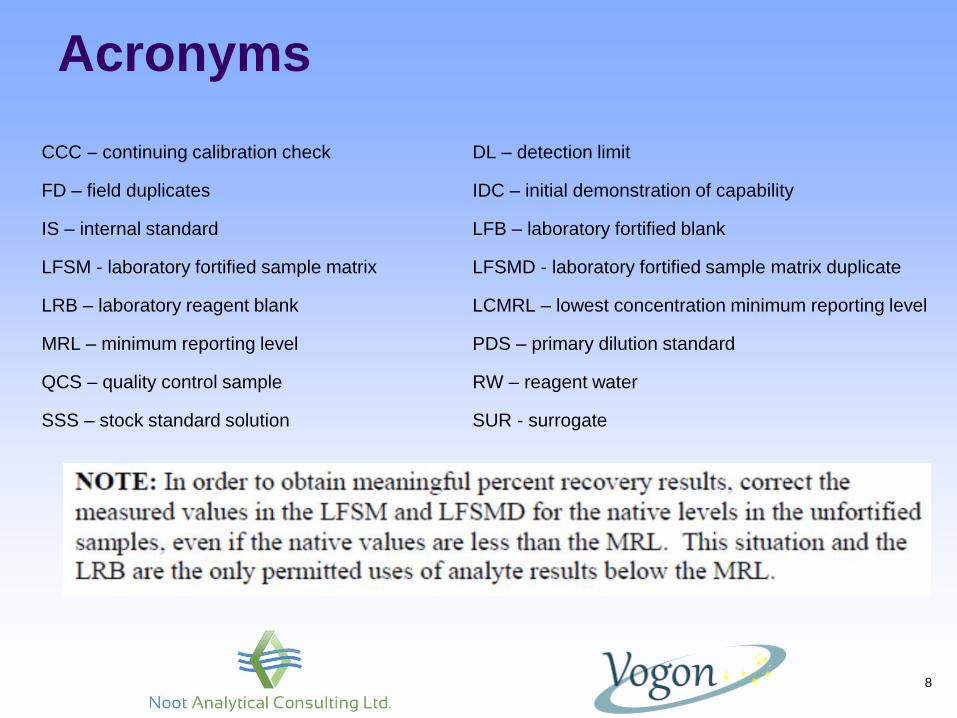
Acronyms
CCC – continuing calibration check DL – detection limit
FD – field duplicates IDC – initial demonstration of capability
IS – internal standard LFB – laboratory fortified blank
LFSM - laboratory fortified sample matrix LFSMD - laboratory fortified sample matrix duplicate
LRB – laboratory reagent blank LCMRL – lowest concentration minimum reporting level
MRL – minimum reporting level PDS – primary dilution standard
QCS – quality control sample RW – reagent water
SSS – stock standard solution SUR - surrogate
8
Accuracy and Precision
• For drinking water methods, typically
performed on fortified LFBs (Reagent
Water)
• Precision must have %RSD ≤ 20%
• Accuracy must be ± 20% of the true value
9
LCMRL Calculations
• Lowest Concentration Minimum Reporting Level
• LCMRL is defined as the lowest spiking
concentration at which recovery of between 50
and 150% is expected 99% of the time by a
single analyst
• Requires minimum of 4 replicates at each of 7
fortification levels in matrix (drinking water),
plus 4 LRBs
10
LCMRL Calculations
• Calculations are determined by entering values
in EPA-supplied LCMRL Calculator4,
• Takes into account both precision and accuracy
• When the LCMRL value is not bracketed by the
fortified sample levels, the calculator gives a
warning that an additional set of replicates will
be needed
11
Prediction Interval of Results
12
Precision at the DL
• EPA requirement: lower and upper PIR
• limits set to 50 and 150%, respectively
• seven replicates at the proposed MRL
• both recovery and standard deviation are used to
calculate the PIR
• as recovery deviates from 100%, the precision, (SD)
must decrease in order to pass (see next slide).
• in fact, at 100% recovery, the maximum SD is 12.6%.
• this includes the entire method… at the detection limit!
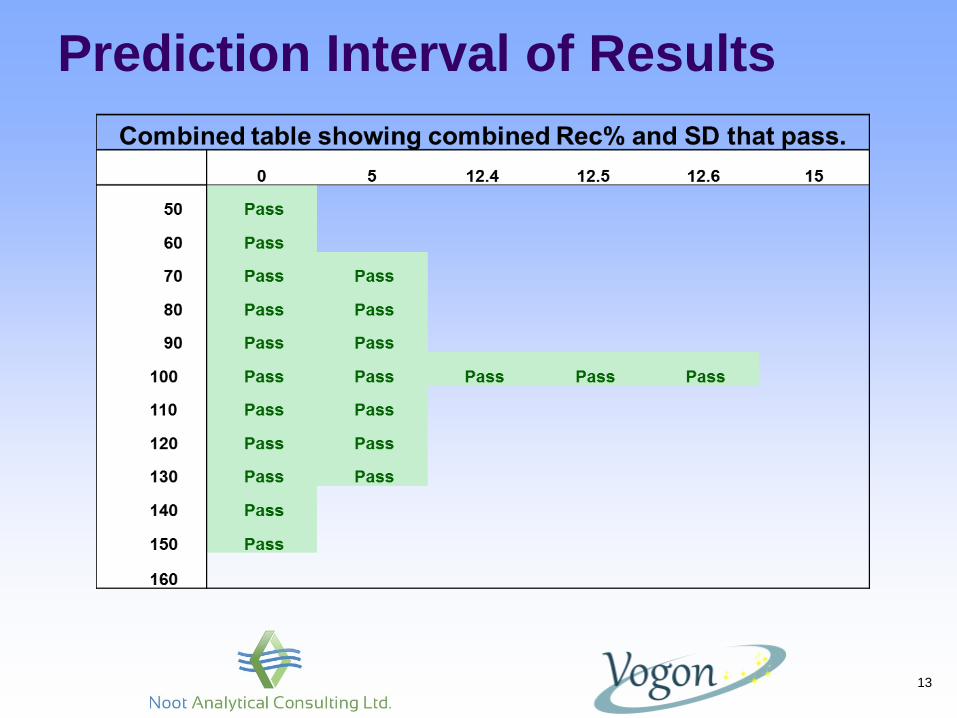
Prediction Interval of Results
13
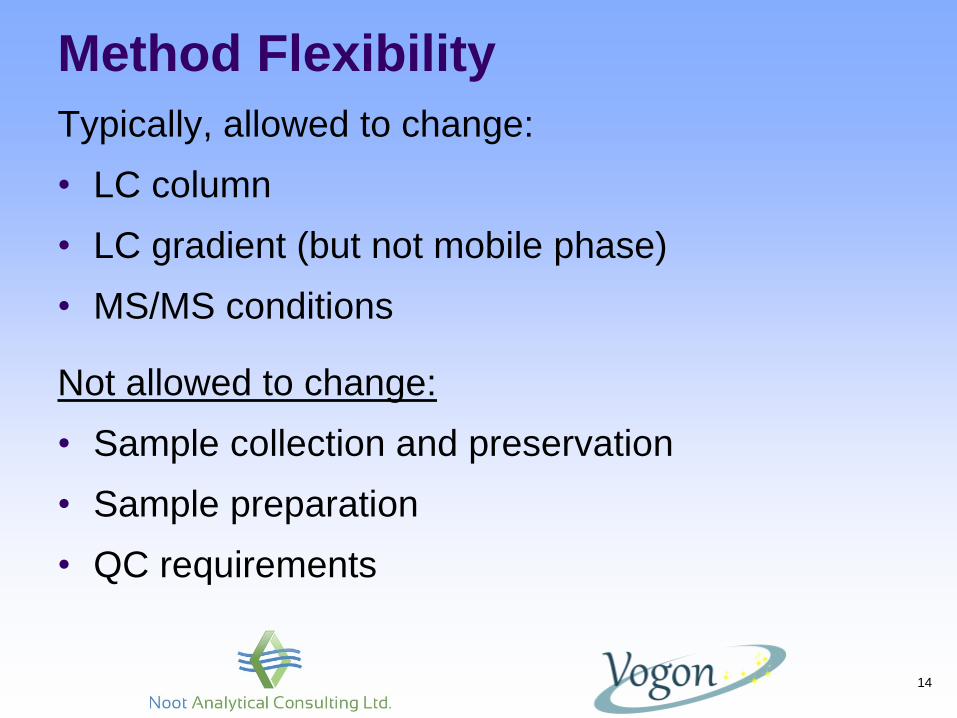
Method Flexibility
Typically, allowed to change:
• LC column
• LC gradient (but not mobile phase)
• MS/MS conditions
Not allowed to change:
• Sample collection and preservation
• Sample preparation
• QC requirements
14
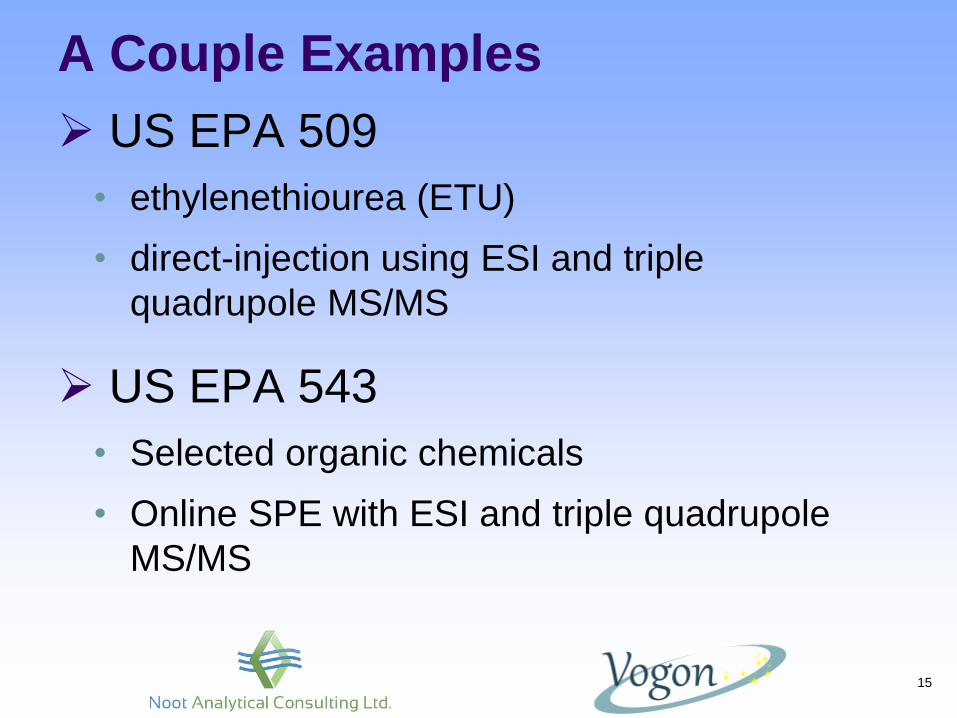
A Couple Examples
US EPA 509
• ethylenethiourea (ETU)
• direct-injection using ESI and triple
quadrupole MS/MS
US EPA 543
• Selected organic chemicals
• Online SPE with ESI and triple quadrupole
MS/MS
15
16
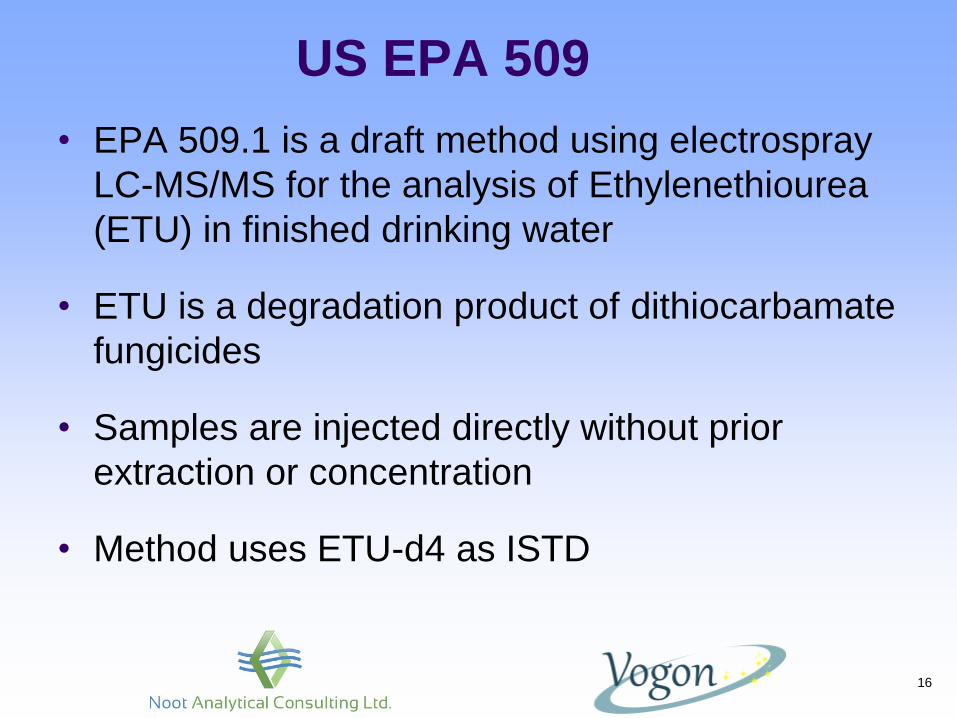
• EPA 509.1 is a draft method using electrospray
LC-MS/MS for the analysis of Ethylenethiourea
(ETU) in finished drinking water
• ETU is a degradation product of dithiocarbamate
fungicides
• Samples are injected directly without prior
extraction or concentration
• Method uses ETU-d4 as ISTD
US EPA 509
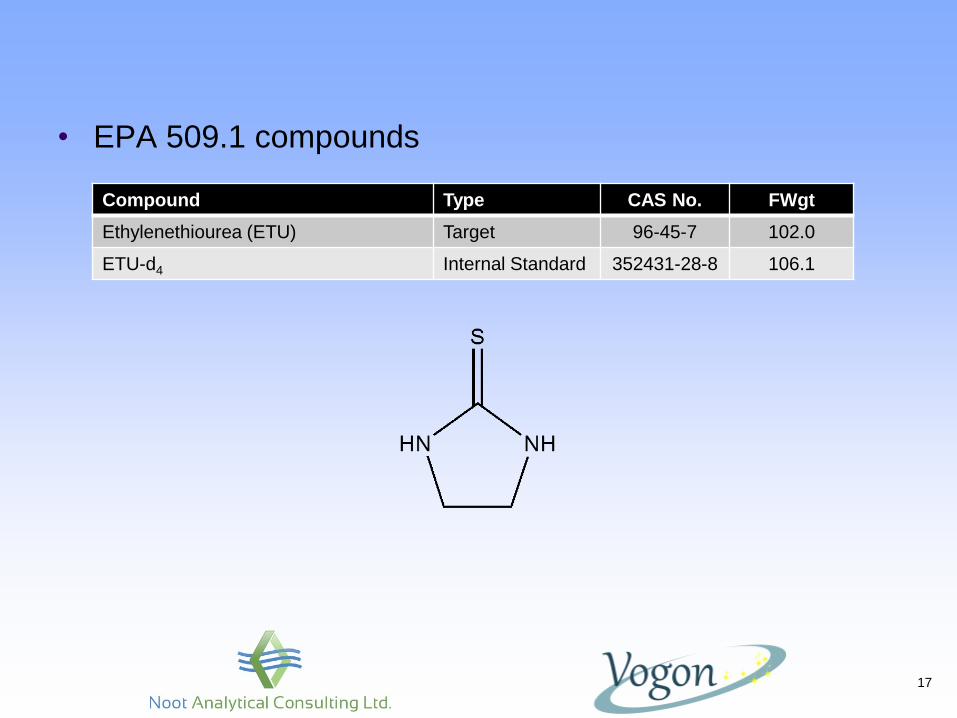
• EPA 509.1 compounds
17
Compound Type CAS No. FWgt
Ethylenethiourea (ETU) Target 96-45-7 102.0
ETU-d4 Internal Standard 352431-28-8 106.1
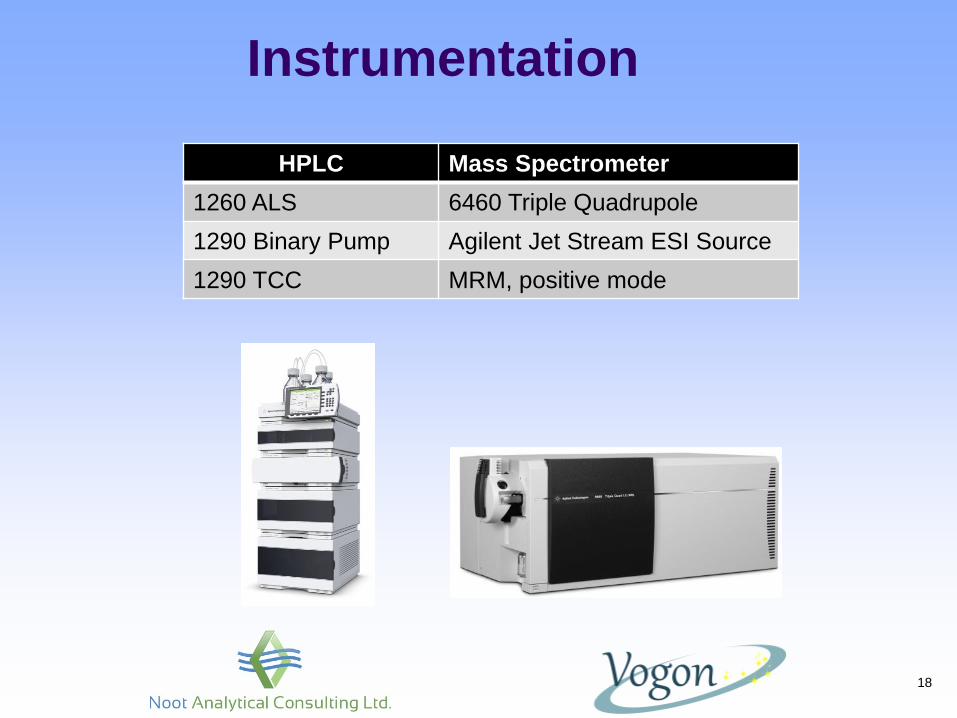
Instrumentation
18
HPLC Mass Spectrometer
1260 ALS 6460 Triple Quadrupole
1290 Binary Pump Agilent Jet Stream ESI Source
1290 TCC MRM, positive mode
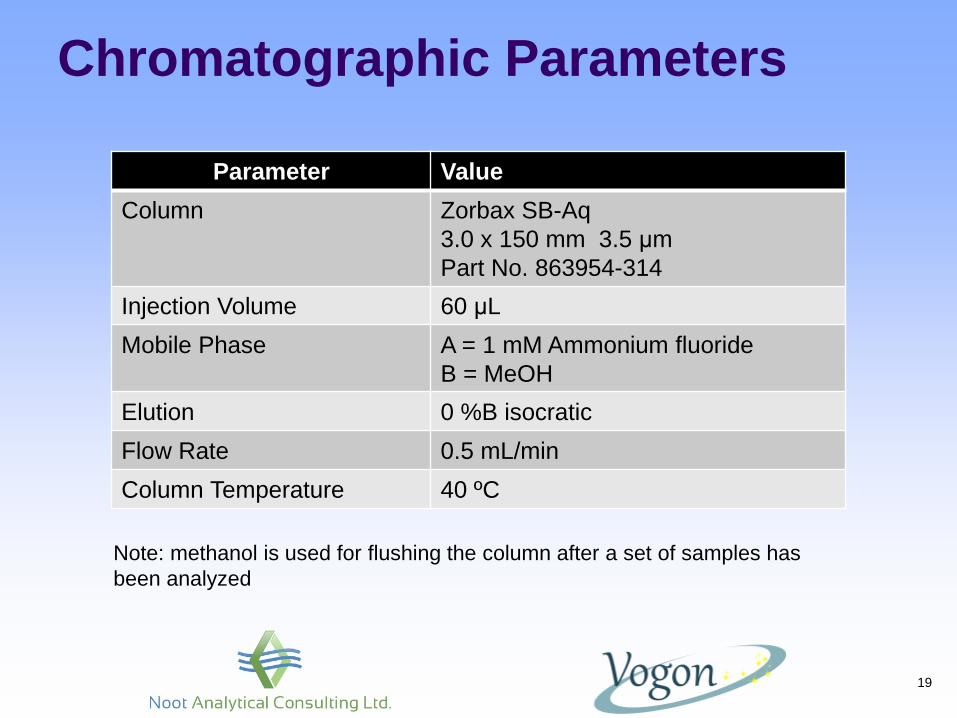
Chromatographic Parameters
19
Parameter Value
Column Zorbax SB-Aq
3.0 x 150 mm 3.5 μm
Part No. 863954-314
Injection Volume 60 μL
Mobile Phase A = 1 mM Ammonium fluoride
B = MeOH
Elution 0 %B isocratic
Flow Rate 0.5 mL/min
Column Temperature 40 ºC
Note: methanol is used for flushing the column after a set of samples has
been analyzed

MS Source Parameters
20
Parameter Value
Drying Gas Temp (ºC) 200
Drying Gas Flow (L/min) 4
Nebulizer (psi) 40
Sheath Gas Temp. (ºC) 380
Sheath Gas Flow (L/min) 12
Capillary Voltage (V) 2000
Nozzle Voltage (V) 0
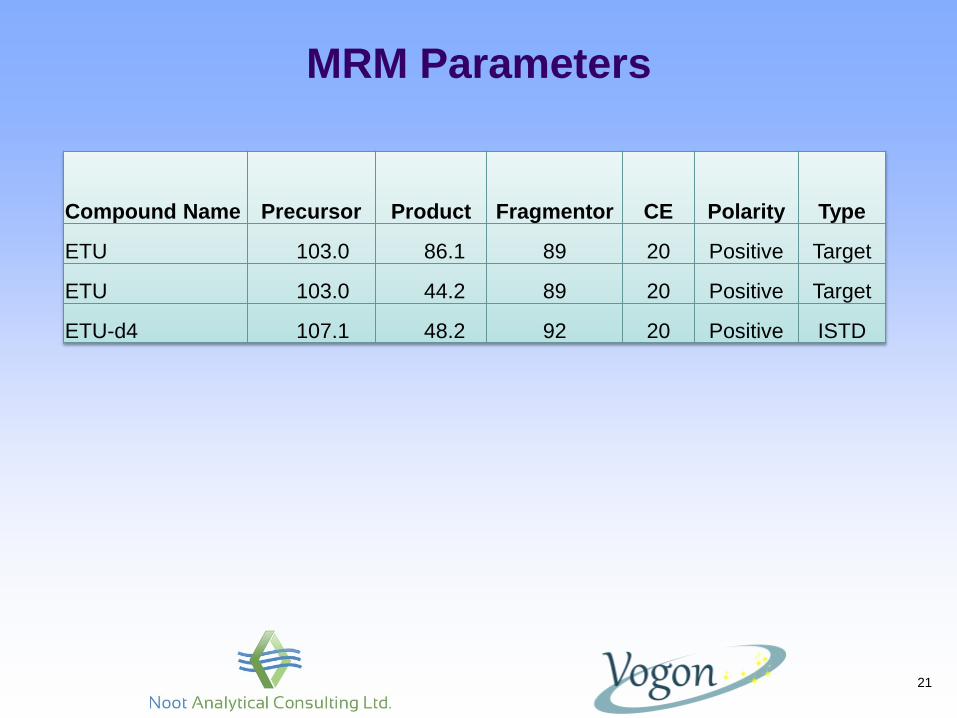
MRM Parameters
21
Compound Name Precursor Product Fragmentor CE Polarity Type
ETU 103.0 86.1 89 20 Positive Target
ETU 103.0 44.2 89 20 Positive Target
ETU-d4 107.1 48.2 92 20 Positive ISTD
22
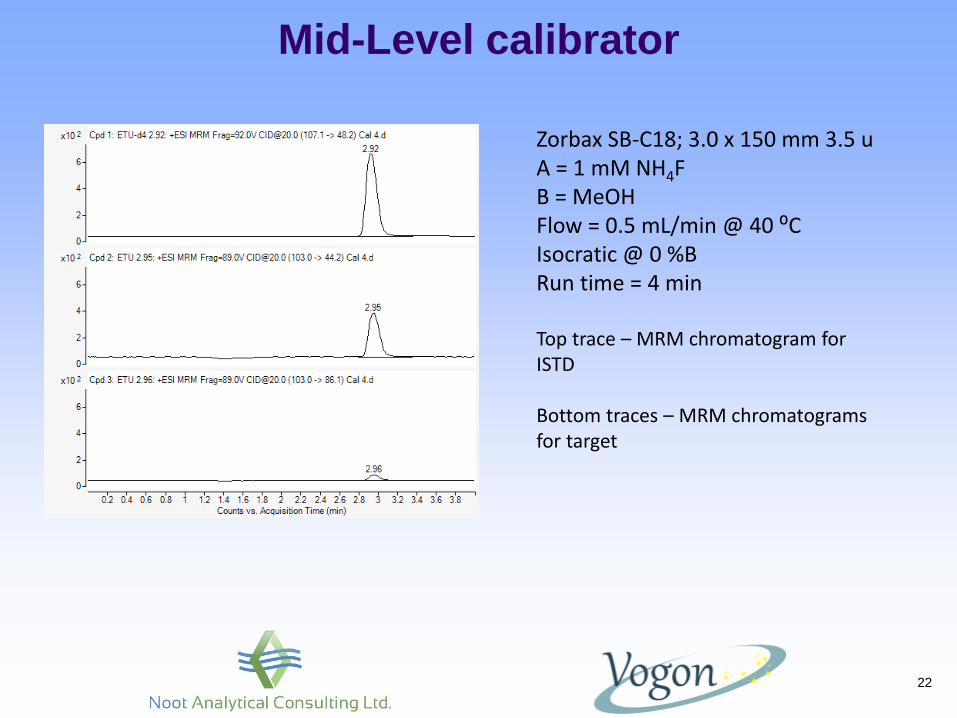
Mid-Level calibrator
Zorbax SB-C18; 3.0 x 150 mm 3.5 u A = 1 mM NH4F B = MeOH Flow = 0.5 mL/min @ 40 ⁰C Isocratic @ 0 %B Run time = 4 min Top trace – MRM chromatogram for ISTD Bottom traces – MRM chromatograms for target
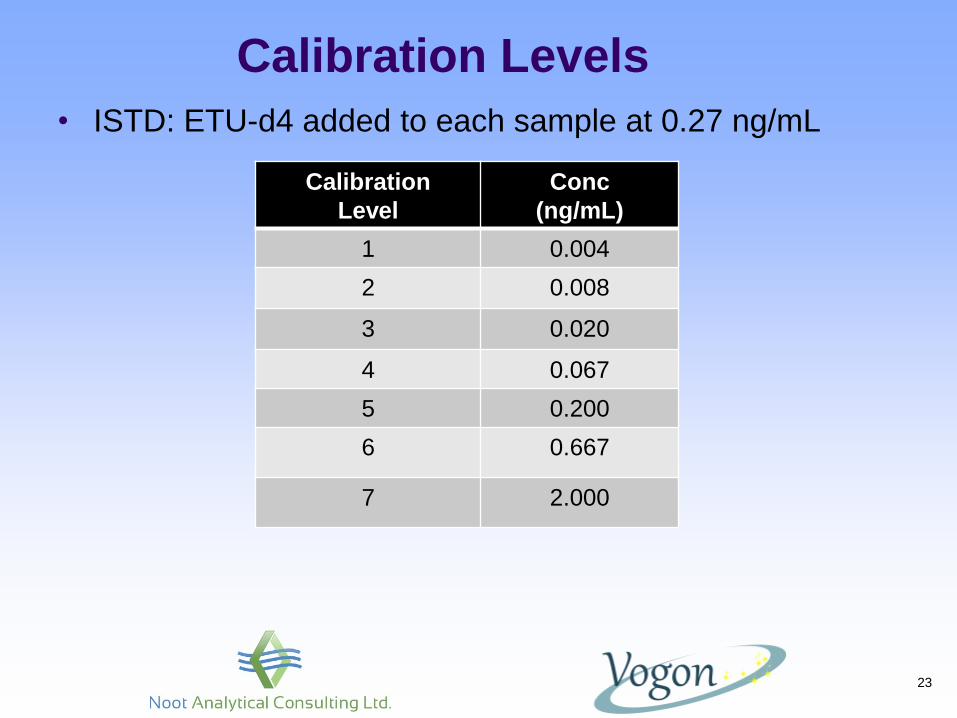
Calibration Levels
• ISTD: ETU-d4 added to each sample at 0.27 ng/mL
23
Calibration
Level
Conc
(ng/mL)
1 0.004
2 0.008
3 0.020
4 0.067
5 0.200
6 0.667
7 2.000
24
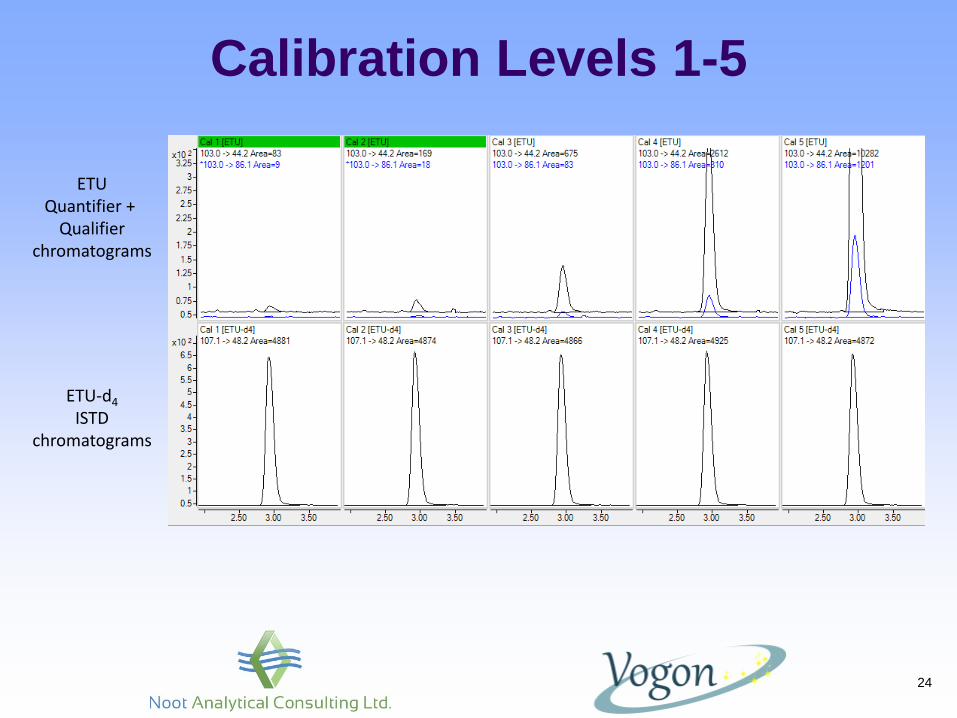
Calibration Levels 1-5
ETU Quantifier +
Qualifier chromatograms
ETU-d4
ISTD chromatograms
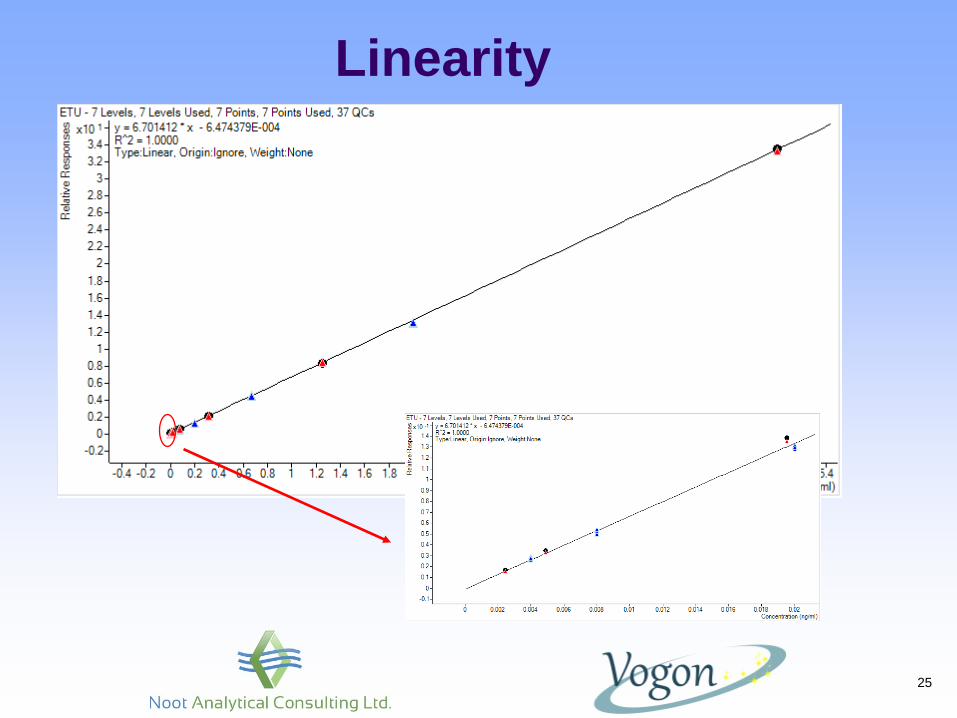
Linearity
25
Section 9.2 - Initial Demonstration of Capability (IDC)
26
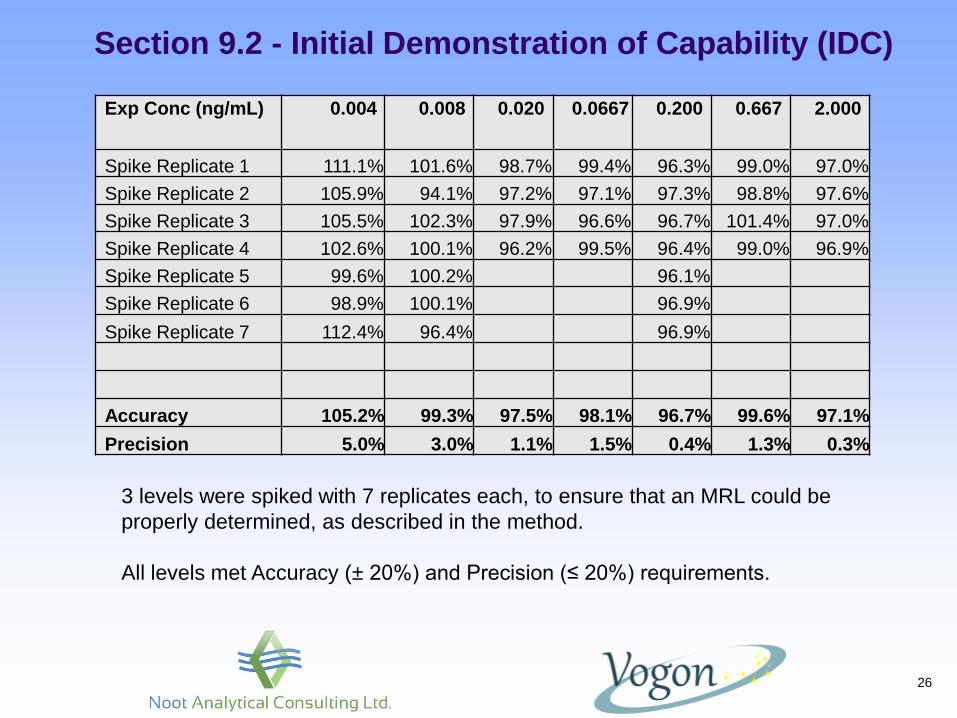
3 levels were spiked with 7 replicates each, to ensure that an MRL could be
properly determined, as described in the method.
All levels met Accuracy (± 20%) and Precision (≤ 20%) requirements.
Exp Conc (ng/mL) 0.004 0.008 0.020 0.0667 0.200 0.667 2.000
Spike Replicate 1 111.1% 101.6% 98.7% 99.4% 96.3% 99.0% 97.0%
Spike Replicate 2 105.9% 94.1% 97.2% 97.1% 97.3% 98.8% 97.6%
Spike Replicate 3 105.5% 102.3% 97.9% 96.6% 96.7% 101.4% 97.0%
Spike Replicate 4 102.6% 100.1% 96.2% 99.5% 96.4% 99.0% 96.9%
Spike Replicate 5 99.6% 100.2% 96.1%
Spike Replicate 6 98.9% 100.1% 96.9%
Spike Replicate 7 112.4% 96.4% 96.9%
Accuracy 105.2% 99.3% 97.5% 98.1% 96.7% 99.6% 97.1%
Precision 5.0% 3.0% 1.1% 1.5% 0.4% 1.3% 0.3%
LCMRL and DL Results - ETU
27
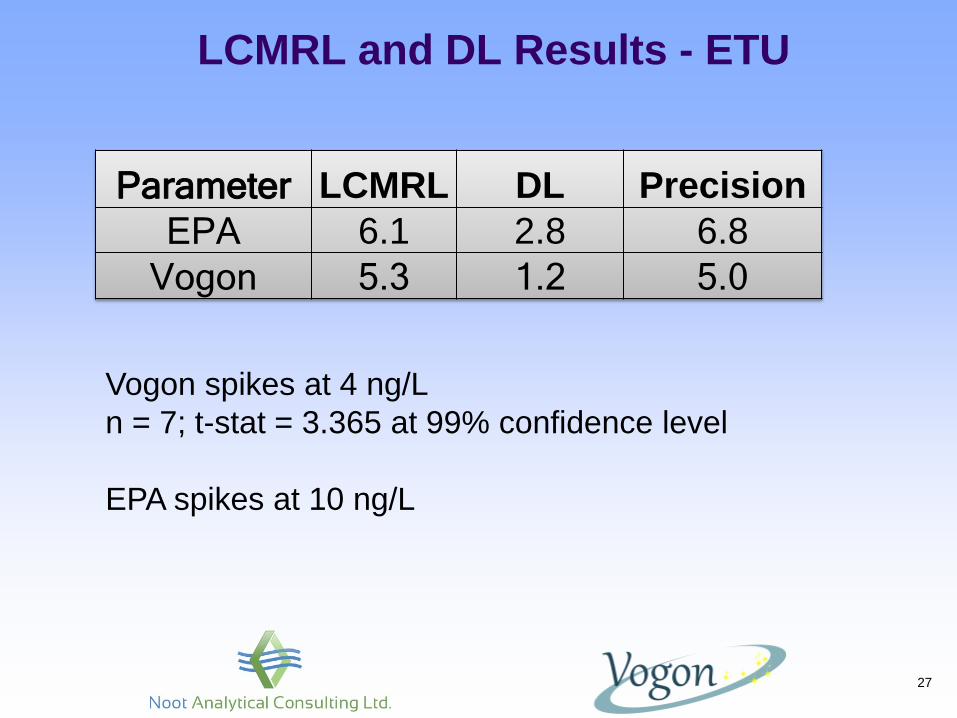
Parameter LCMRL DL Precision
EPA 6.1 2.8 6.8
Vogon 5.3 1.2 5.0
Vogon spikes at 4 ng/L
n = 7; t-stat = 3.365 at 99% confidence level
EPA spikes at 10 ng/L
Lower and Upper PIR
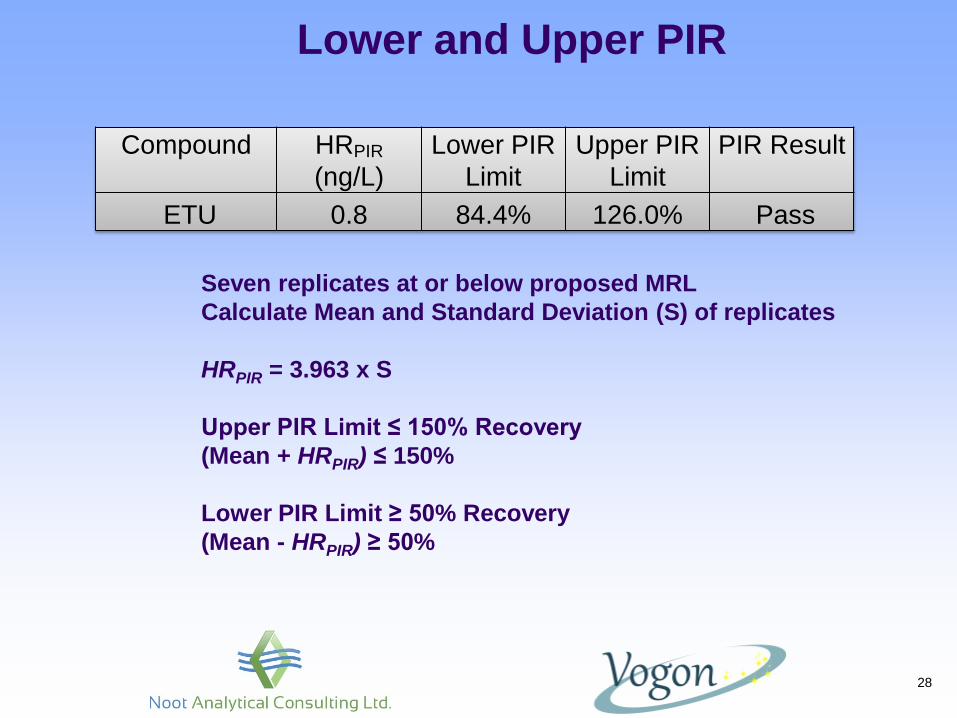
Seven replicates at or below proposed MRL
Calculate Mean and Standard Deviation (S) of replicates
HRPIR = 3.963 x S
Upper PIR Limit ≤ 150% Recovery
(Mean + HRPIR) ≤ 150%
Lower PIR Limit ≥ 50% Recovery
(Mean - HRPIR) ≥ 50%
28
Compound HRPIR
(ng/L)
Lower PIR
Limit
Upper PIR
Limit
PIR Result
ETU 0.8 84.4% 126.0% Pass
Summary
• Use of an Agilent 1290/6460 LC-MS/MS for the analysis of
ETU in drinking water can help laboratories meet the
stringent QC requirements of EPA Draft Method 509.1
• DLs can be lower than EPA levels, with LCMRL at 5.2 and
DL at 1.2 ng/L, respectively
• Method %RSDs ranged from 0.3 – 5.0% including all
fortification levels from 4 to 2,000 ng/L
29
30
• Some benefits of online SPE:
• reduced labor costs through automation,
• a high degree of precision as each sample is processed by
the instrument and not a person,
• improved sample turnaround due to vastly reduced sample
preparation time,
• reduced materials costs as the online SPE cartridges can
be used for many samples (likely hundreds)
• directly compatible with reversed phase LC
• seamless incorporation of online SPE into Agilent LC-
MS/MS systems using the Flexible Cube module
EPA 543 - Online SPE
31
• Online SPE can provide outstanding detection limits
• For example, in terms of the amount of target compound
on-column:
• online SPE using a 1.8 mL of sample volume
is equivalent to processing
360 mL sample by offline SPE
concentrating the eluant to 1 mL
and injecting 5 µL
Online SPE
• 6 mL sample vials with screw caps and pre-slit septa
• Agilent Bond Elut Online SPE, PLRP-S, 2.1x12.5 mm,
15-20 µm
• Water & ACN, Caledon HPLC grade
• Agilent Poroshell 120 PhenylHexyl, 3.0 x 100mm, 2.7µm
• Agilent 1260 / 1290 LC system
• Agilent 6460 QQQ, ESI with Agilent Jet Stream
Technology
Materials and Equipment
32
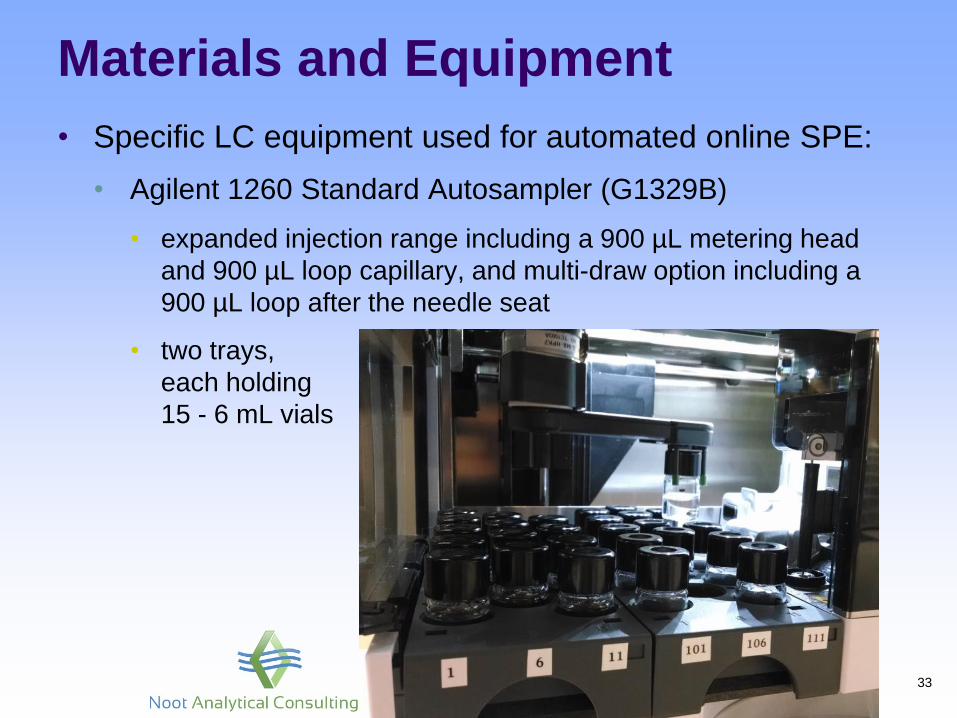
• Specific LC equipment used for automated online SPE:
• Agilent 1260 Standard Autosampler (G1329B)
• expanded injection range including a 900 µL metering head
and 900 µL loop capillary, and multi-draw option including a
900 µL loop after the needle seat
• two trays,
each holding
15 - 6 mL vials
Materials and Equipment
33
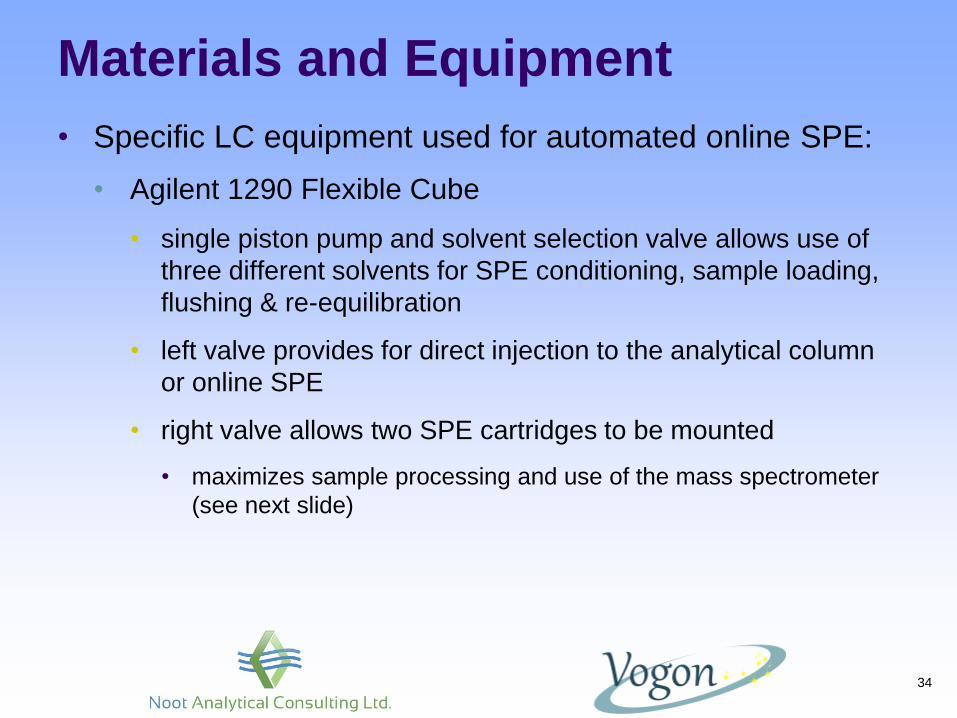
• Specific LC equipment used for automated online SPE:
• Agilent 1290 Flexible Cube
• single piston pump and solvent selection valve allows use of
three different solvents for SPE conditioning, sample loading,
flushing & re-equilibration
• left valve provides for direct injection to the analytical column
or online SPE
• right valve allows two SPE cartridges to be mounted
• maximizes sample processing and use of the mass spectrometer
(see next slide)
Materials and Equipment
34
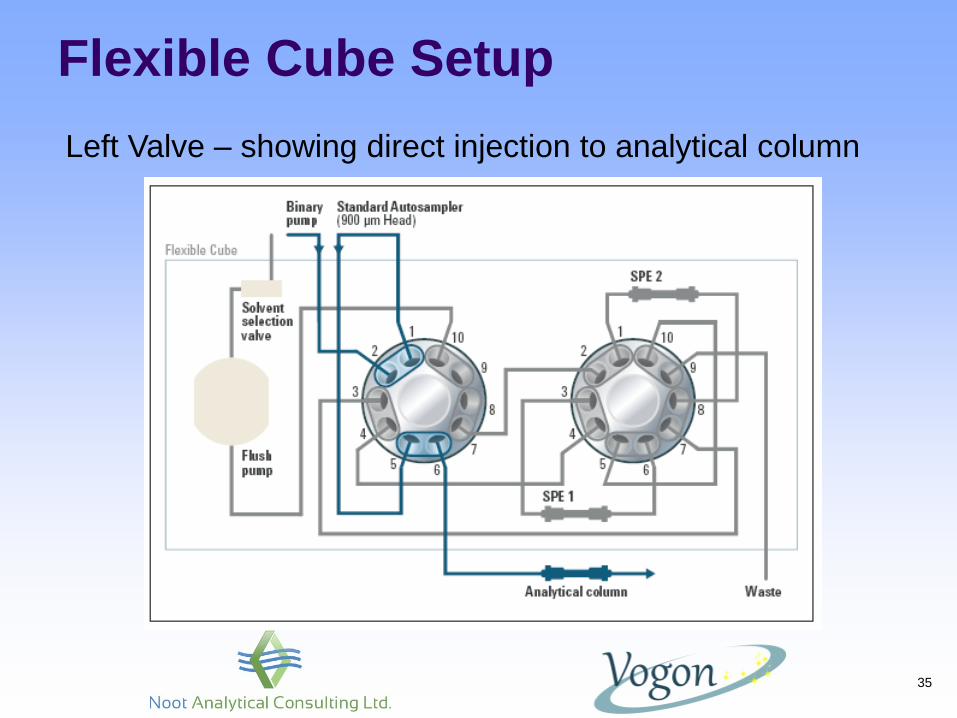
Flexible Cube Setup
35
Left Valve – showing direct injection to analytical column
• Agilent 1290 Flexible Cube Operation
• sample is loaded on the 1st SPE cartridge where the target
compounds are concentrated
• the right valve rotates and the target compounds are backflushed
off the SPE cartridge onto the analytical column for separation
and detection by the mass spectrometer
• during backflushing of the 1st cartridge, the 2nd cartridge
undergoes flushing with a strong solvent (e.g. ACN) and then re-
equilibration to initial sample conditions (e.g. buffered H2O)
• the next sample injection uses the 2nd cartridge for analysis while
the 1st cartridge undergoes flushing / re-equilibration
Materials and Equipment
36
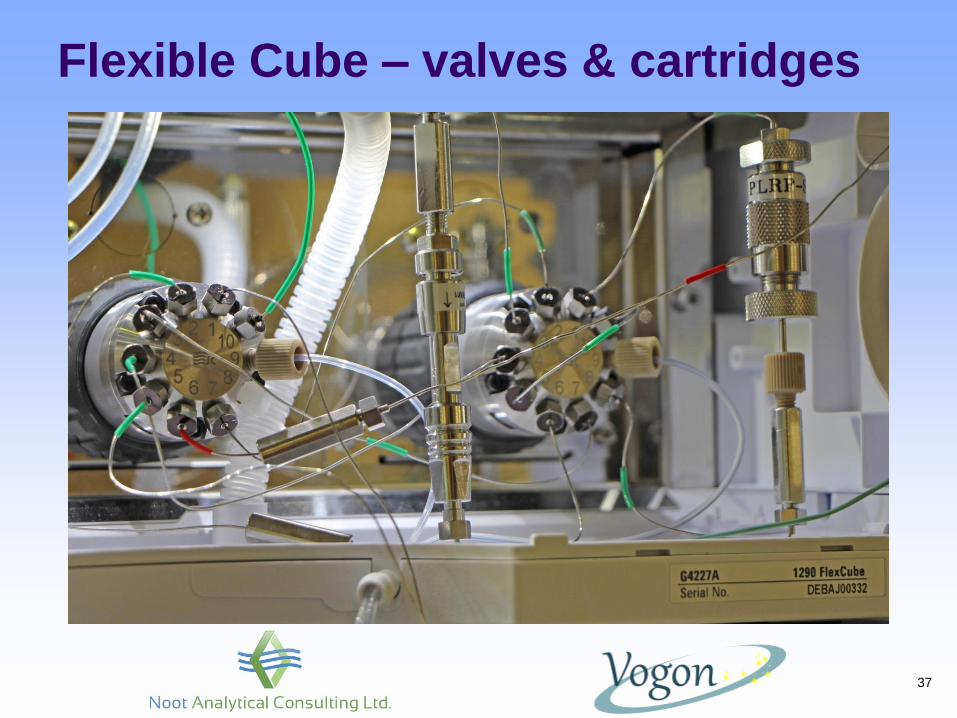
Flexible Cube – valves & cartridges
37
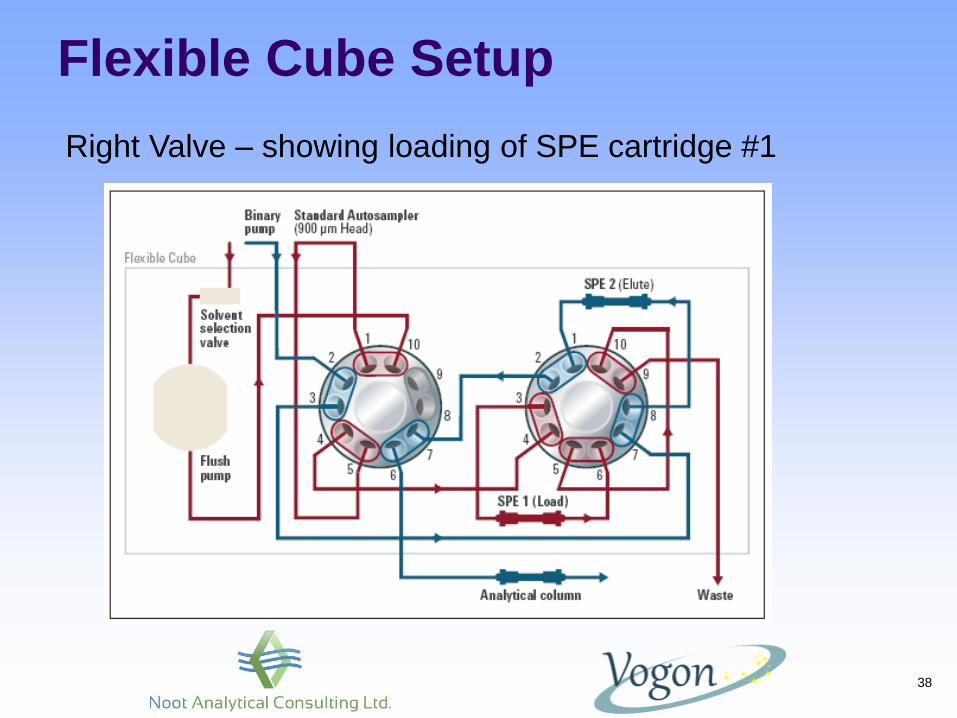
Flexible Cube Setup
38
Right Valve – showing loading of SPE cartridge #1
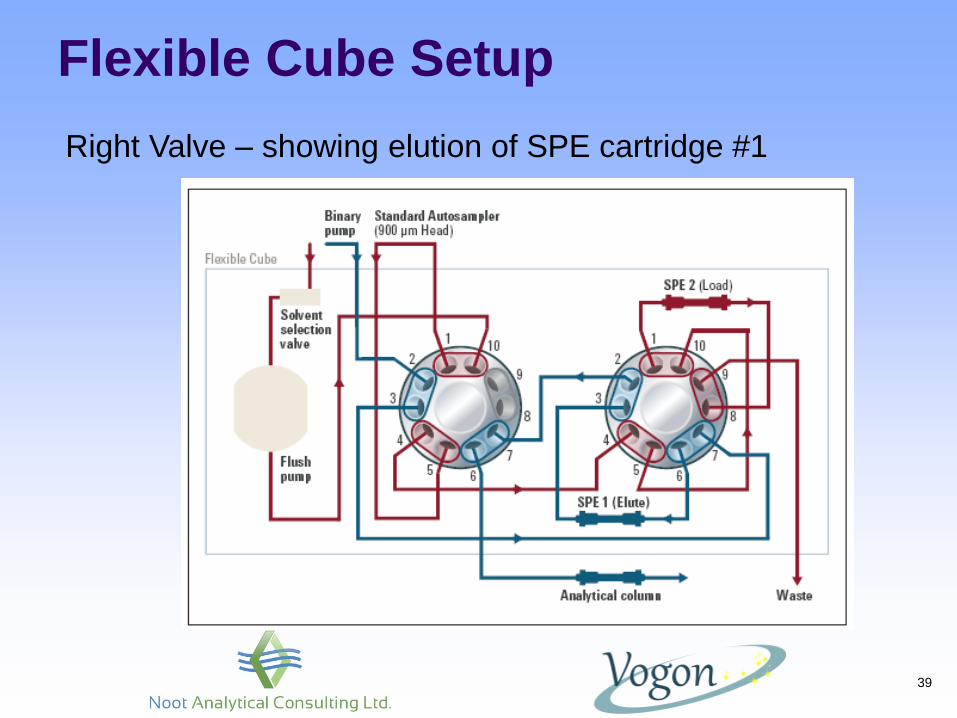
Flexible Cube Setup
39
Right Valve – showing elution of SPE cartridge #1
40
• USEPA Method 543 is an electrospray LC-MS/MS
method for the analysis of seven pesticides and
metabolites in finished drink water using online SPE
• Preserved water samples are fortified with internal
standards and processed automatically by online SPE
followed by LC-MS/MS analysis
• Precision of laboratory fortified blanks (LFB, reagent
water) must have %RSD ≤ 20%
• Accuracy must be ± 30% of the true value
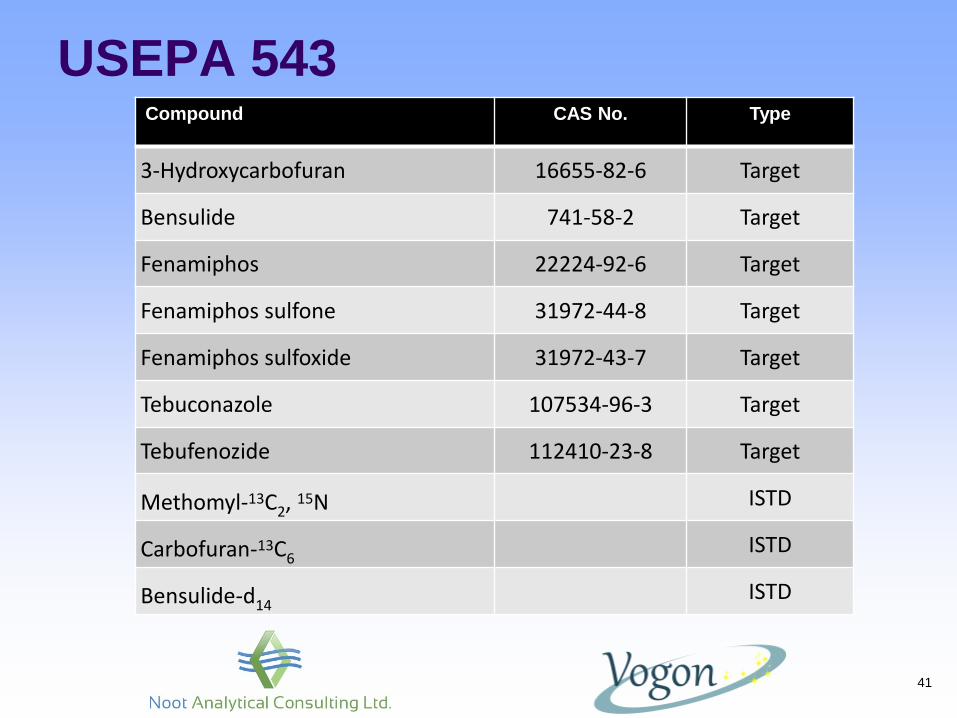
USEPA 543
USEPA 543
41
Compound CAS No. Type
3-Hydroxycarbofuran 16655-82-6 Target
Bensulide 741-58-2 Target
Fenamiphos 22224-92-6 Target
Fenamiphos sulfone 31972-44-8 Target
Fenamiphos sulfoxide 31972-43-7 Target
Tebuconazole 107534-96-3 Target
Tebufenozide 112410-23-8 Target
Methomyl-13C2, 15N ISTD
Carbofuran-13C6 ISTD
Bensulide-d14 ISTD
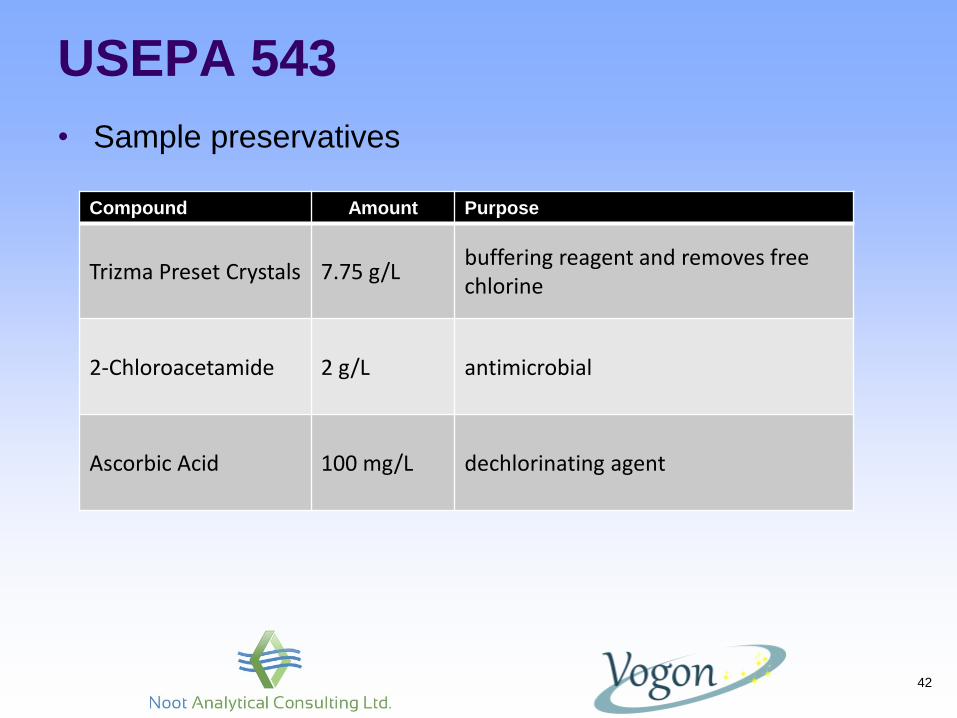
• Sample preservatives
USEPA 543
42
Compound Amount Purpose
Trizma Preset Crystals 7.75 g/L
buffering reagent and removes free chlorine
2-Chloroacetamide 2 g/L
antimicrobial
Ascorbic Acid 100 mg/L
dechlorinating agent
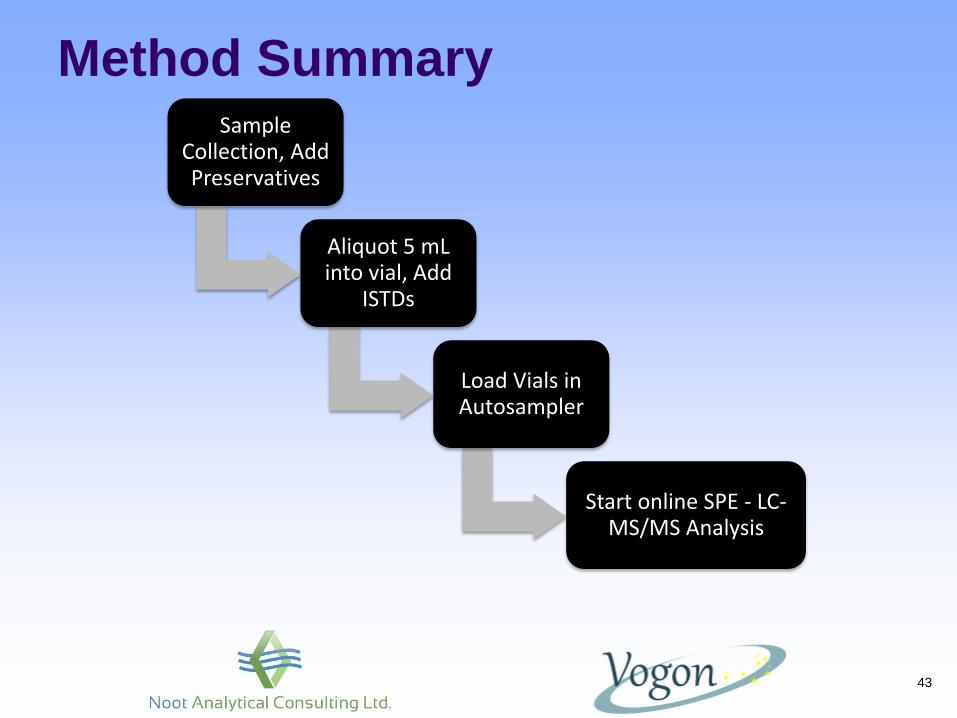
Method Summary
43
Sample Collection, Add Preservatives
Aliquot 5 mL into vial, Add
ISTDs
Load Vials in Autosampler
Start online SPE - LC-MS/MS Analysis

44
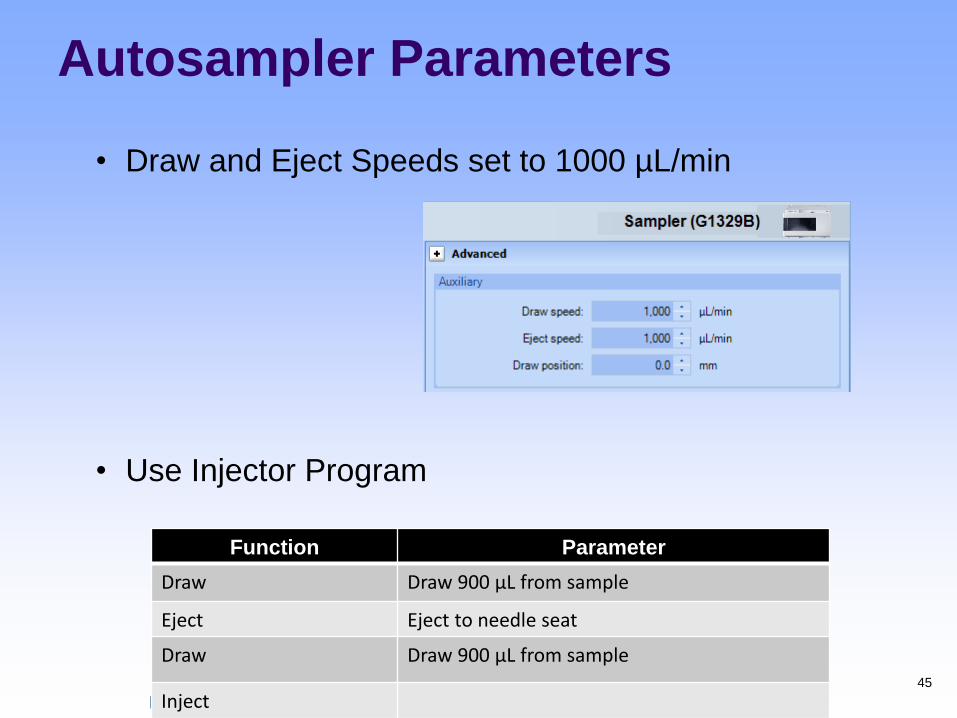
Autosampler Parameters
45
Function Parameter
Draw Draw 900 µL from sample
Eject Eject to needle seat
Draw Draw 900 µL from sample
Inject
• Draw and Eject Speeds set to 1000 µL/min
• Use Injector Program
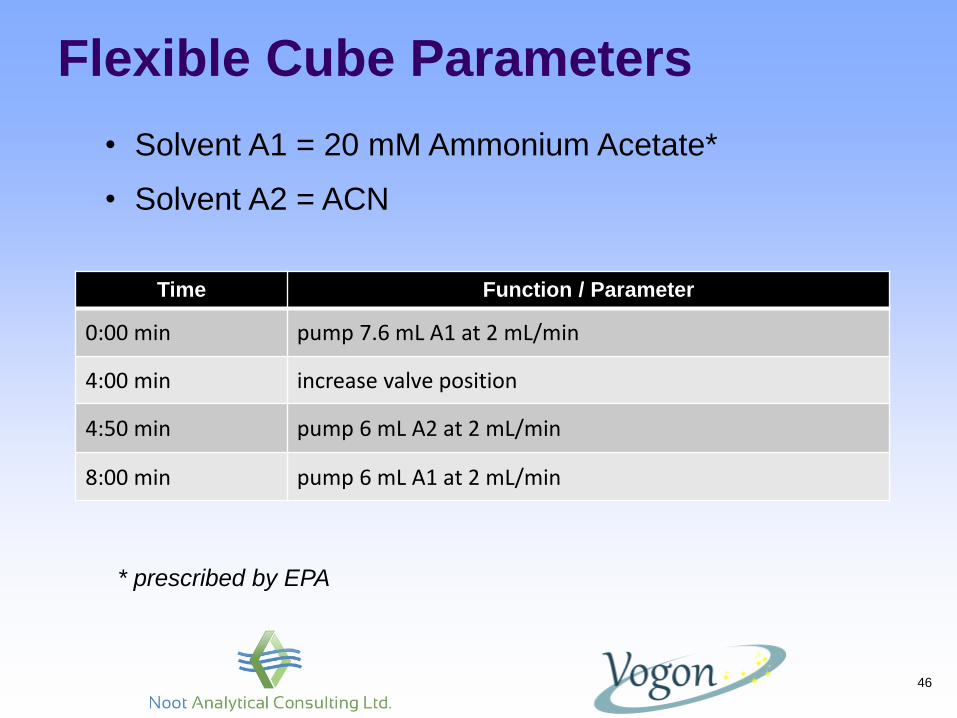
Flexible Cube Parameters
46
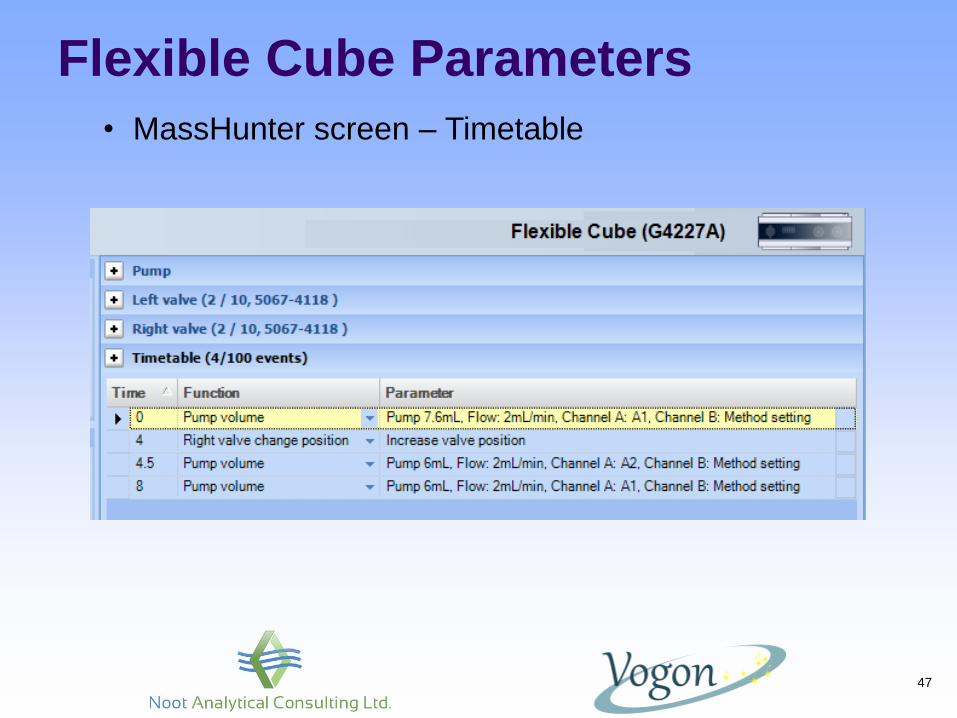
Time Function / Parameter
0:00 min pump 7.6 mL A1 at 2 mL/min
4:00 min increase valve position
4:50 min pump 6 mL A2 at 2 mL/min
8:00 min pump 6 mL A1 at 2 mL/min
• Solvent A1 = 20 mM Ammonium Acetate*
• Solvent A2 = ACN
* prescribed by EPA
Flexible Cube Parameters
47
• MassHunter screen – Timetable
Flexible Cube Parameters
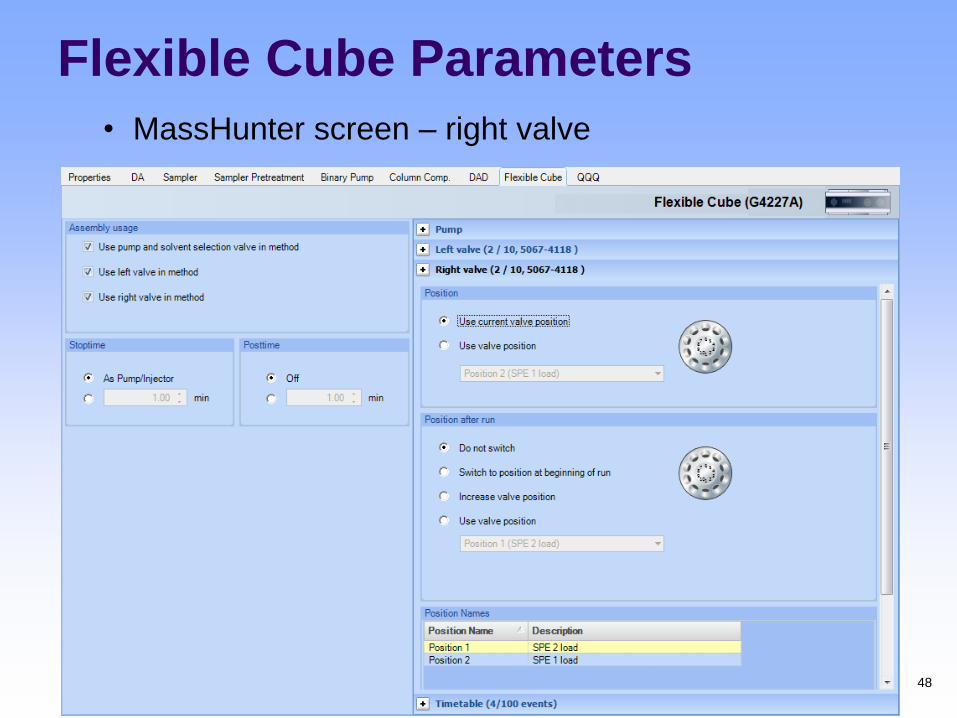
48
• MassHunter screen – right valve
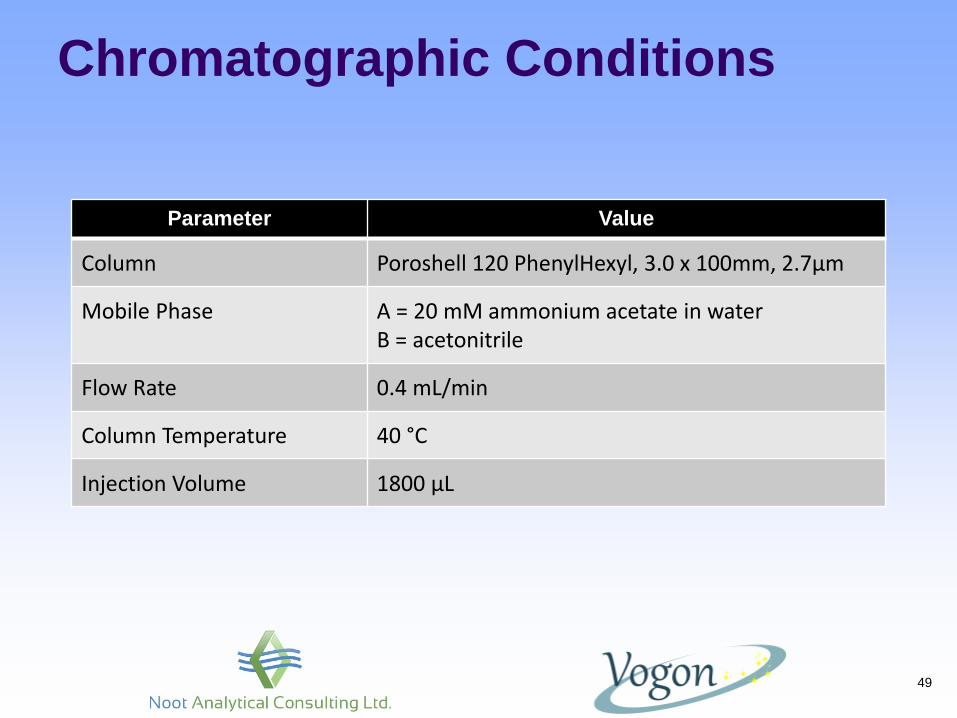
Chromatographic Conditions
49
Parameter Value
Column Poroshell 120 PhenylHexyl, 3.0 x 100mm, 2.7µm
Mobile Phase A = 20 mM ammonium acetate in water B = acetonitrile
Flow Rate 0.4 mL/min
Column Temperature 40 °C
Injection Volume 1800 μL
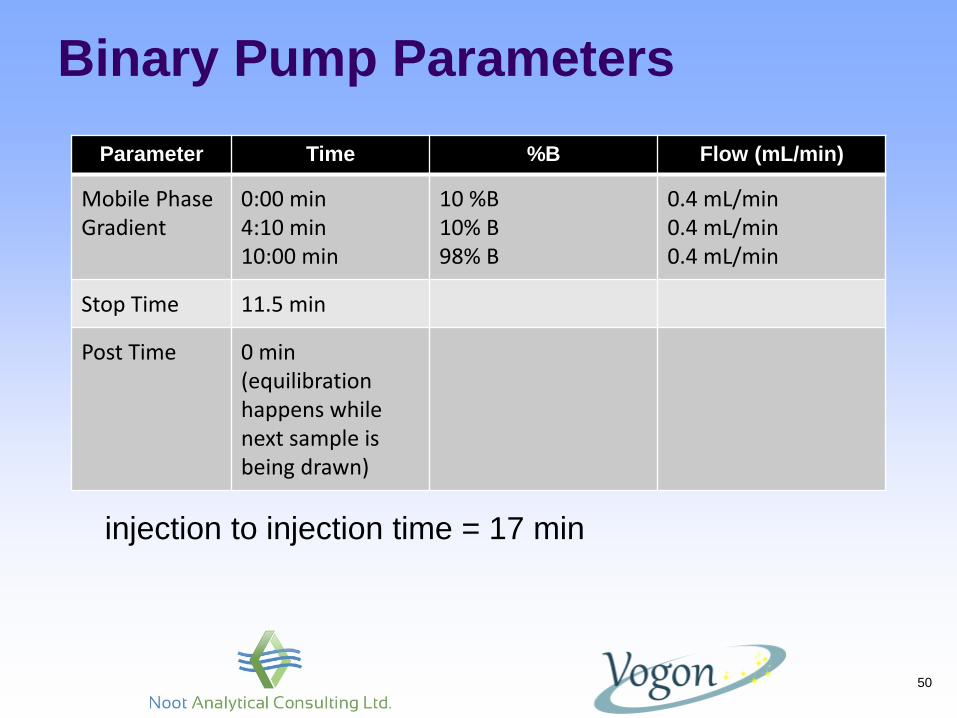
Binary Pump Parameters
50
Parameter Time %B Flow (mL/min)
Mobile Phase Gradient
0:00 min 4:10 min 10:00 min
10 %B 10% B 98% B
0.4 mL/min 0.4 mL/min 0.4 mL/min
Stop Time 11.5 min
Post Time 0 min (equilibration happens while next sample is being drawn)
injection to injection time = 17 min
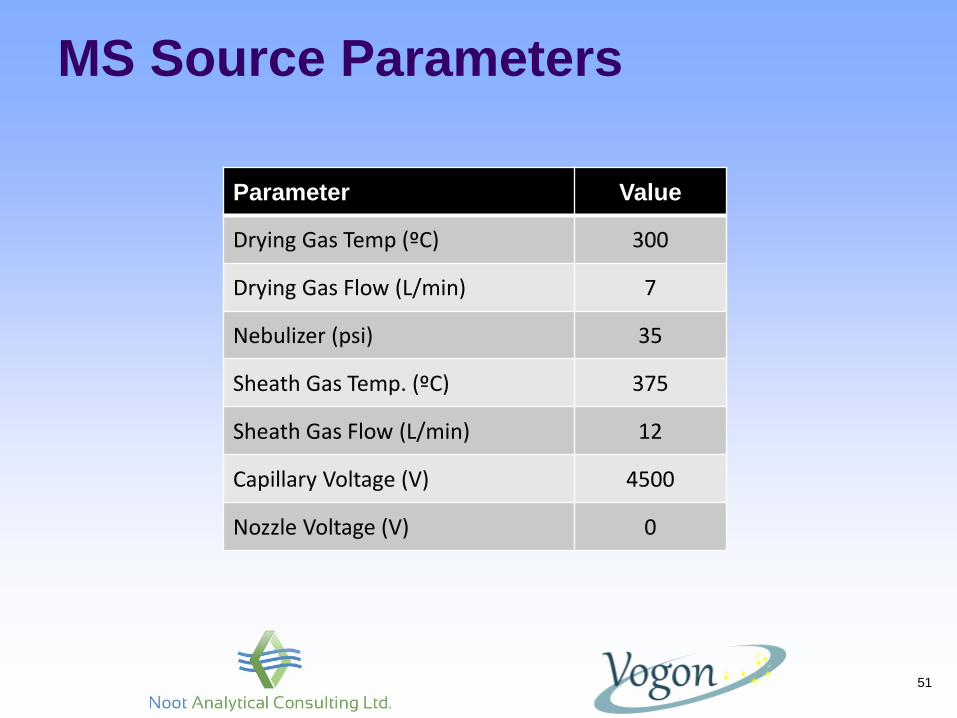
MS Source Parameters
51
Parameter Value
Drying Gas Temp (ºC) 300
Drying Gas Flow (L/min) 7
Nebulizer (psi) 35
Sheath Gas Temp. (ºC) 375
Sheath Gas Flow (L/min) 12
Capillary Voltage (V) 4500
Nozzle Voltage (V) 0
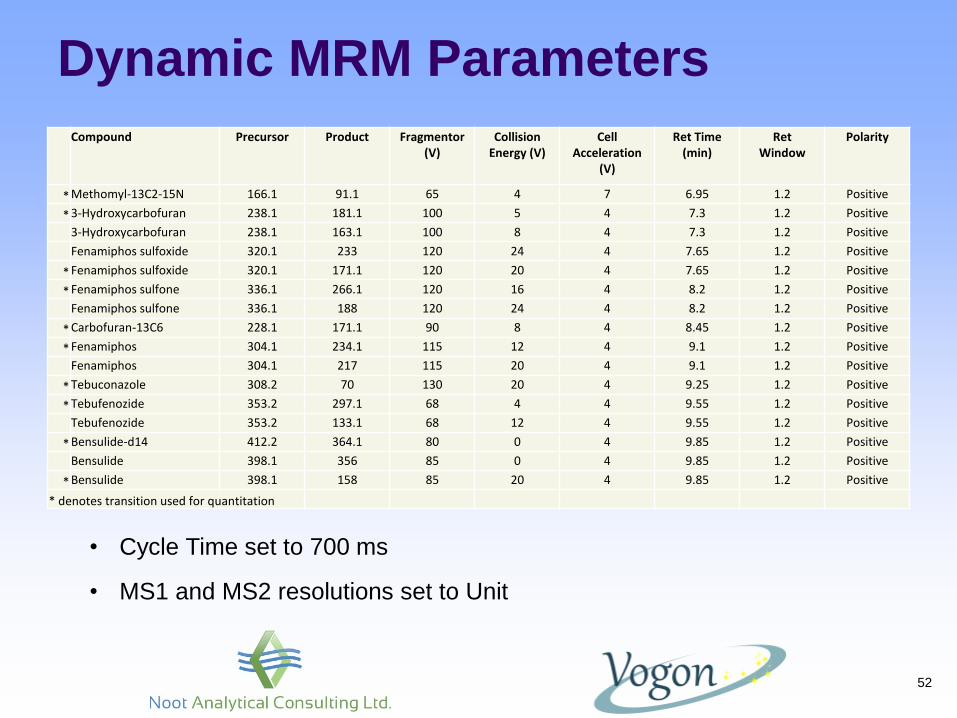
Dynamic MRM Parameters
52
Compound Precursor Product Fragmentor (V)
Collision Energy (V)
Cell Acceleration
(V)
Ret Time (min)
Ret Window
Polarity
* Methomyl-13C2-15N 166.1 91.1 65 4 7 6.95 1.2 Positive
* 3-Hydroxycarbofuran 238.1 181.1 100 5 4 7.3 1.2 Positive
3-Hydroxycarbofuran 238.1 163.1 100 8 4 7.3 1.2 Positive
Fenamiphos sulfoxide 320.1 233 120 24 4 7.65 1.2 Positive
* Fenamiphos sulfoxide 320.1 171.1 120 20 4 7.65 1.2 Positive
* Fenamiphos sulfone 336.1 266.1 120 16 4 8.2 1.2 Positive
Fenamiphos sulfone 336.1 188 120 24 4 8.2 1.2 Positive
* Carbofuran-13C6 228.1 171.1 90 8 4 8.45 1.2 Positive
* Fenamiphos 304.1 234.1 115 12 4 9.1 1.2 Positive
Fenamiphos 304.1 217 115 20 4 9.1 1.2 Positive
* Tebuconazole 308.2 70 130 20 4 9.25 1.2 Positive
* Tebufenozide 353.2 297.1 68 4 4 9.55 1.2 Positive
Tebufenozide 353.2 133.1 68 12 4 9.55 1.2 Positive
* Bensulide-d14 412.2 364.1 80 0 4 9.85 1.2 Positive
Bensulide 398.1 356 85 0 4 9.85 1.2 Positive
* Bensulide 398.1 158 85 20 4 9.85 1.2 Positive
* denotes transition used for quantitation
• Cycle Time set to 700 ms
• MS1 and MS2 resolutions set to Unit

53
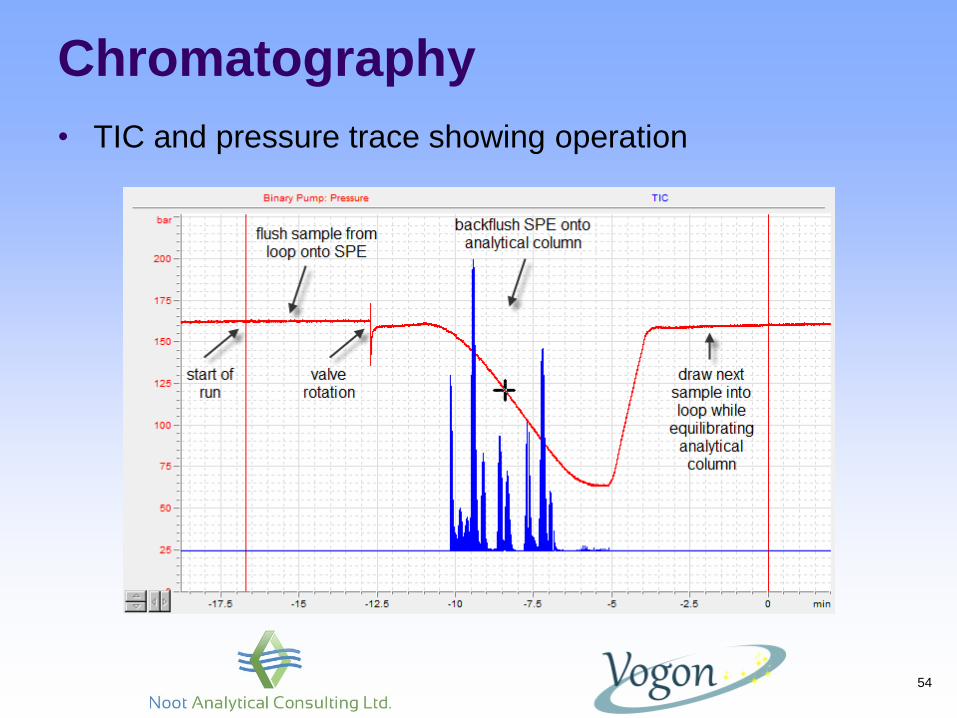
• TIC and pressure trace showing operation
Chromatography
54
55
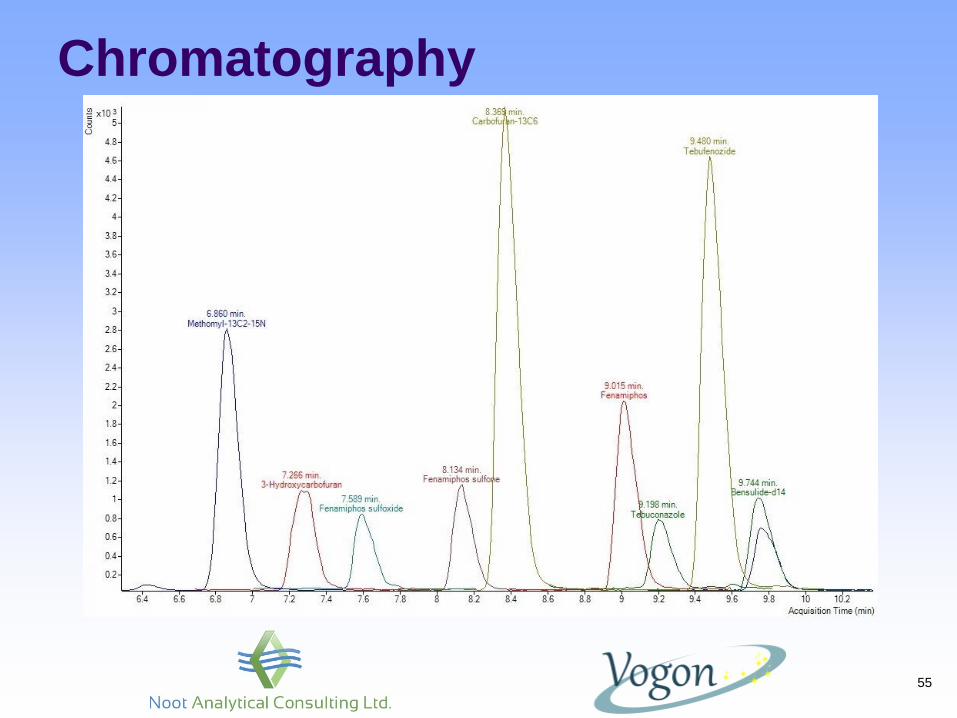
Chromatography
56
Results produced
(accuracy, precision and LCMRL)
were very similar to those
produced by the USEPA.
Direct Injection to SPE • Comparison to determine “recovery” of the SPE process
• Spiked samples were analysed by direct injection at
10 µL as well as 1000 µL injections of a 100x dilution by
online SPE
• Results were between 84 – 113% “recovery” (ESTD)
• Good recovery desired, although absolute recovery is
not critical as calibrators are analysed using same SPE
process
57
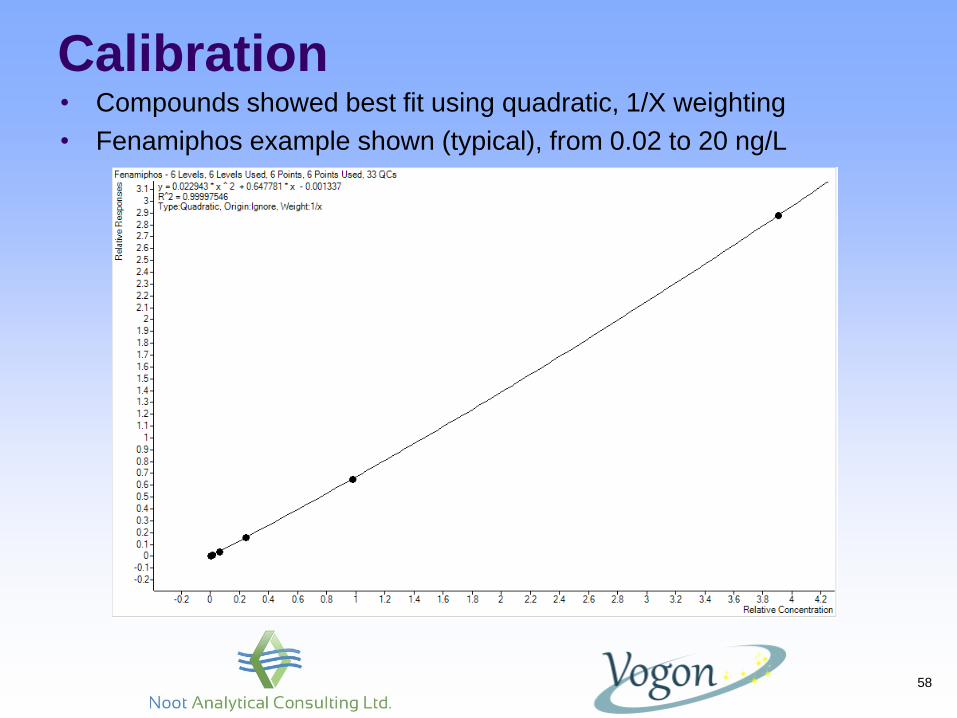
Calibration • Compounds showed best fit using quadratic, 1/X weighting
• Fenamiphos example shown (typical), from 0.02 to 20 ng/L
58
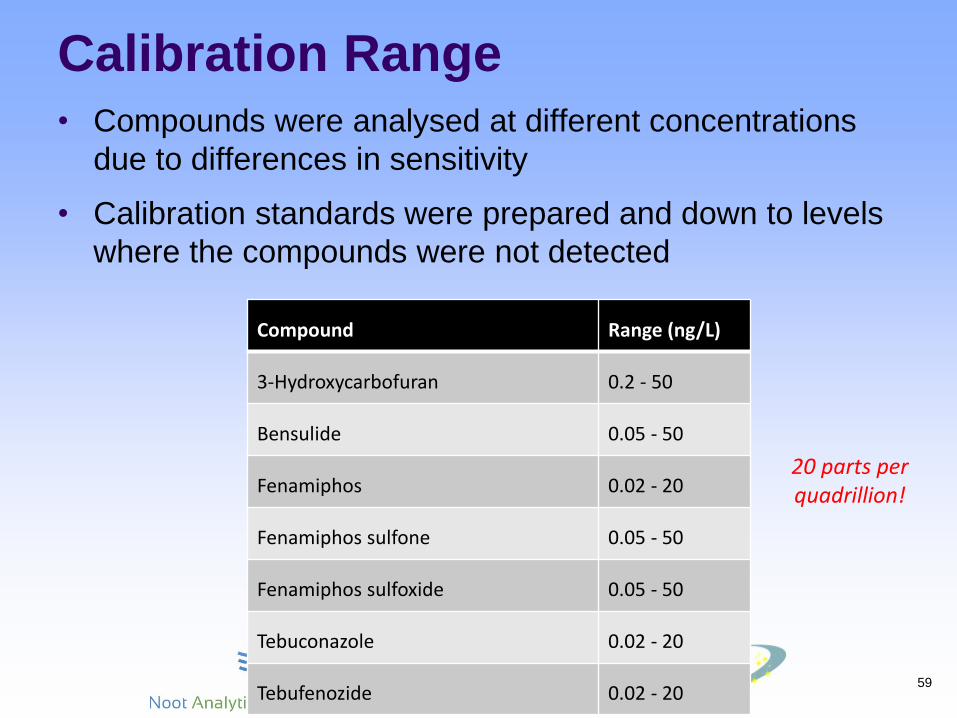
Calibration Range • Compounds were analysed at different concentrations
due to differences in sensitivity
• Calibration standards were prepared and down to levels
where the compounds were not detected
59
Compound Range (ng/L)
3-Hydroxycarbofuran 0.2 - 50
Bensulide 0.05 - 50
Fenamiphos 0.02 - 20
Fenamiphos sulfone 0.05 - 50
Fenamiphos sulfoxide 0.05 - 50
Tebuconazole 0.02 - 20
Tebufenozide 0.02 - 20
20 parts per quadrillion!
Accuracy and Precision • Preserved tap water (surface water source) was fortified
at a mid-level compared to the calibration curve range
• Seven fortified replicates were analysed to determine
Accuracy and Precision
• Accuracy is presented as the average % recovery of all
seven replicates
• Precision is presented as the % Relative Standard
Deviation (%RSD)
60
Accuracy (%)
61
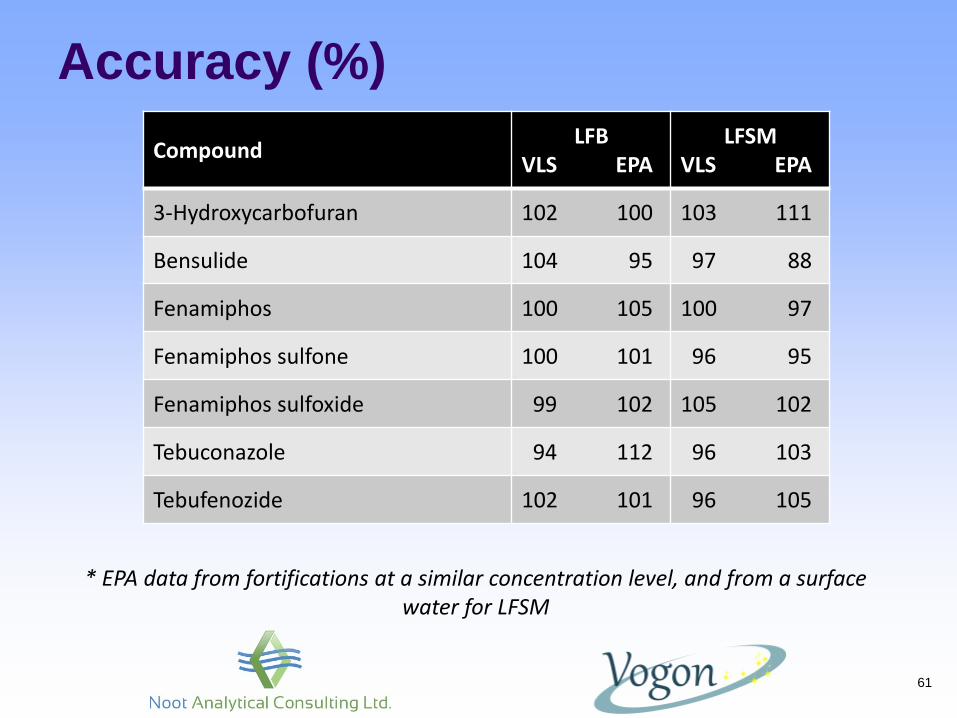
* EPA data from fortifications at a similar concentration level, and from a surface water for LFSM
Compound LFB
VLS EPA LFSM
VLS EPA
3-Hydroxycarbofuran 102 100 103 111
Bensulide 104 95 97 88
Fenamiphos 100 105 100 97
Fenamiphos sulfone 100 101 96 95
Fenamiphos sulfoxide 99 102 105 102
Tebuconazole 94 112 96 103
Tebufenozide 102 101 96 105
Precision (% RSD)
62
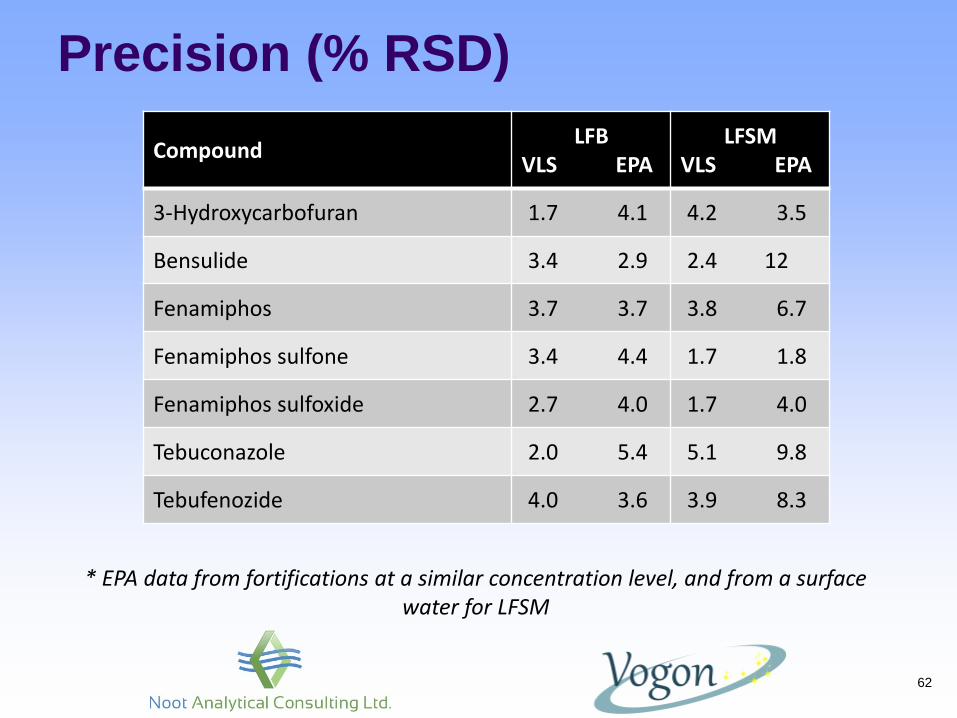
* EPA data from fortifications at a similar concentration level, and from a surface water for LFSM
Compound LFB
VLS EPA LFSM
VLS EPA
3-Hydroxycarbofuran 1.7 4.1 4.2 3.5
Bensulide 3.4 2.9 2.4 12
Fenamiphos 3.7 3.7 3.8 6.7
Fenamiphos sulfone 3.4 4.4 1.7 1.8
Fenamiphos sulfoxide 2.7 4.0 1.7 4.0
Tebuconazole 2.0 5.4 5.1 9.8
Tebufenozide 4.0 3.6 3.9 8.3
LCMRL Results (ng/L)
63
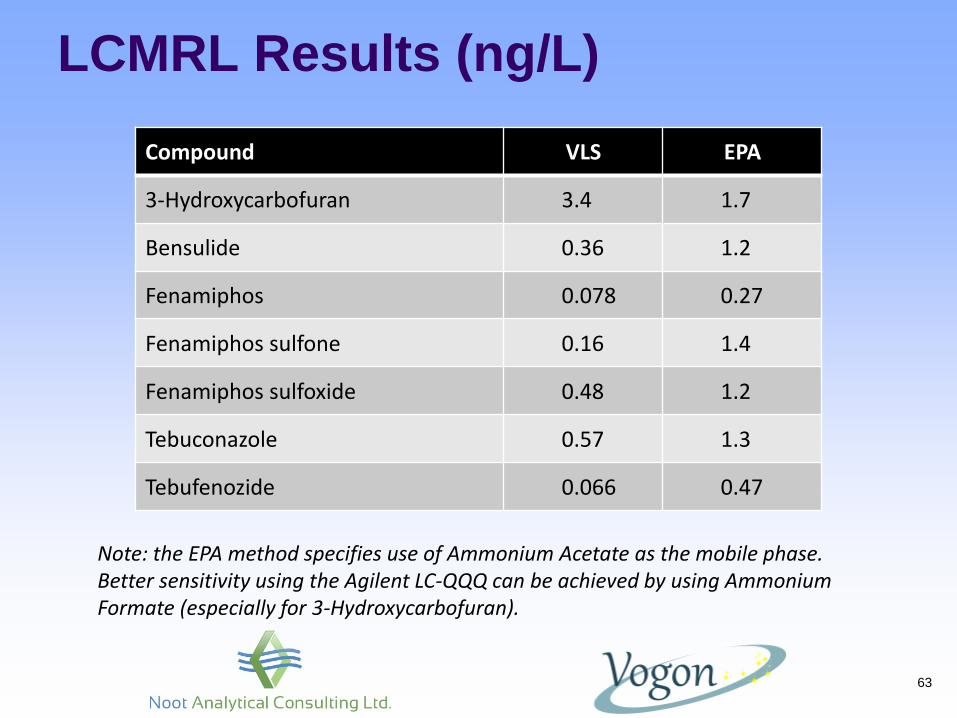
Note: the EPA method specifies use of Ammonium Acetate as the mobile phase. Better sensitivity using the Agilent LC-QQQ can be achieved by using Ammonium Formate (especially for 3-Hydroxycarbofuran).
Compound VLS EPA
3-Hydroxycarbofuran 3.4 1.7
Bensulide 0.36 1.2
Fenamiphos 0.078 0.27
Fenamiphos sulfone 0.16 1.4
Fenamiphos sulfoxide 0.48 1.2
Tebuconazole 0.57 1.3
Tebufenozide 0.066 0.47
• Understand the plumbing, remove some fittings to confirm
flow
• Keep tubing lengths same between two cartridges
• Be sure not to overlap timing in Flexible Cube programming
• Ensure sufficient solvent levels for bottles used for Flexible
Cube
• Be aware of possible overpressure issues with high flow
rates
• Run H2O blanks at start of worklist for both SPE cartridges
to ensure they are flushed and equilibrated
64
Discussion - Tips
• Online SPE using Agilent Bond Elut SPE PLRP-S
cartridges and an Agilent LC-MS/MS performs similarly to
the USEPA results for method 543.
• The Agilent Flexible Cube incorporates seamlessly into the
LC system and is controlled by MassHunter software.
Online SPE provides many benefits for the analytical lab.
• The analysis method time (injection to injection) of less than
17 minutes (including online SPE), allows many samples to
be automatically processed each day.
65
Conclusions – EPA 543

• Acronyms
• Frustrating restrictions
(moving towards performance based but…)
• Can you please calibrate your mass axis
EPA 539: product ions of 144.7, 96.6…
• Working with EPA methods gets easier after
you’ve done about three of them
66
Conclusions - EPA Methods
Acknowledgements
Many Thanks to:
• Trisa Robarge of Agilent Technologies for supplying the
Bond Elute SPE PLRP-S cartridges
• Sheher Mosin, Bettina Schuhn and Jean-Francois Roy of
Agilent Technologies for advice on setting up the Flexible
Cube
• Jody Shoemaker of USEPA for provision of standards
• Ralph Hindle of Vogon Labs
67
References
1. EPA Method 509.1 – Determination of Ethylenethiourea in Drinking Water by Liquid
Chromatography Electrospray Ionization Tandem Mass Spectrometry (LC-ESI-
MS/MS); EPA Draft Method; September 2012.
2. EPA Method 543 – Determination of Selected Organic Chemicals in Drinking Water
by On-Line Solid Phase Extraction and Liquid Chromatography/Tandem Mass
Spectrometry (On-line SPE-LC/MS/MS); Version 1.0, March 2015
3. Sheher Bano Mohsin and Michael Woodman, Quantitation of Trace Level Emerging
Contaminants in Water Using Online SPE with LC/MS/MS, Agilent Application Note
5991-2731EN, Oct. 2013.
4. Winslow, S. D.; Pepich, B. V.; Martin, J. J.; Hallberg, G. R.; Munch, D. J.; Frebis, C.
P.; Hedrick, E. J.; Krop, R. A. Environmental Science & Technology 2006, 40, 281.
68

Thanks for your attention!
69