second european union minorities and discrimination survey. … · 3 foreword some 80 % of roma...
TRANSCRIPT

EU-MIDIS II
Second European Union Minorities and Discrimination Survey
Roma – Selected findings

Photo (cover & inside): © Shutterstock (Tomas Vynikal) and FRA
More information on the European Union is available on the internet (http://europa.eu).
Luxembourg: Publications Office of the European Union, 2018
Print ISBN 978-92-9491-873-4 doi:10.2811/189587 TK-AN-16-111-EN-CPDF ISBN 978-92-9491-871-0 doi:10.2811/469 TK-AN-16-111-EN-N
© European Union Agency for Fundamental Rights, 2016
Reproduction is authorised provided the source is acknowledged.
Europe Direct is a service to help you find answers to your questions about the European Union
Freephone number (*):00 800 6 7 8 9 10 11
(*) The information given is free, as are most calls (though some operators, phone boxes or hotels may charge you).
Second European Union Minorities and Discrimination Survey
Roma – Selected findings


3
ForewordSome 80 % of Roma surveyed live below their country’s at-risk-of-poverty threshold; every third Roma lives in housing without tap water; every third Roma child lives in a household where someone went to bed hungry at least once in the previous month; and 50 % of Roma between the ages of six and 24 do not attend school. This report underscores an unsettling but unavoidable reality: the European Union’s largest ethnic minority continues to face intolerable discrimination and unequal access to vital services.
Highlighting persisting barriers to employment, education, housing and health services, this report also reveals that four out of 10 Roma surveyed felt discriminated against at least once in the past five years – yet only a fraction pursued the incident. With most Roma unaware of laws prohibiting discrimination, or of organisations that could offer support, such realities are hardly surprising. But they do raise serious questions about the fulfilment of the right to non-discrimination guaranteed by the Charter of Fundamental Rights of the European Union (EU) and the Racial Equality Directive.
The report is based on a large-scale survey that collected information on almost 34,000 persons living in Roma households in nine European Union (EU) Member States, deriving from nearly 8,000 face-to-face interviews with Roma. It presents a selection of results from the Second European Union Minorities and Discrimination Survey, which surveyed around 26,000 people with immigrant or ethnic minority background living in the EU.
The second European Union Minorities and Discrimination Survey is a major part of the EU Agency for Fundamental Right’s commitment to collecting and publishing data on groups not covered in general population surveys. It is the third survey of the agency to focus on Roma. The European Union Minorities and Discrimination Survey – conducted in 2008 – was the first effort to provide comparative evidence on their situation. The methodology of the second European Union Minorities and Discrimination Survey was adapted to provide the best possible results in terms of reliability and comparability across countries.
The data presented in this report constitute a unique resource for policymakers, making it possible to gauge progress over time and helping to identify both successes and shortfalls in implemented policies. Such insights are vital for formulating effective measures not just on Roma, but for all groups on the margins of society.
While the realities outlined in this publication are sobering, the EU Agency for Fundamental Rights hopes that they will reinvigorate efforts to promote the Roma’s full inclusion and for respect of their fundamental rights.
Michael O’FlahertyDirector

Country codesCountry code EU Member State
BG Bulgaria
CZ Czech Republic
EL Greece
ES Spain
HR Croatia
HU Hungary
PT Portugal
RO Romania
SK Slovakia
Country groupings
EU-28 Current 28 EU Member States9 MS Nine EU Member States in which EU-MIDIS II surveyed Roma
Acronyms and abbreviationsEU-MIDIS European Union Minorities and Discrimination Survey
EU-SILC European Union Statistics on Income and Living Conditions
ICESCR International Covenant on Economic, Social and Cultural Rights
ILO International Labour Office
LFS Labour Force Survey (Eurostat)
SDGs Sustainable Development Goals (United Nations)
UNDP United Nations Development Programme

5
ContentsFOREWORD ������������������������������������������������������������������������������������������������������������������������������������������������������������������������������ 3WHY IS THIS SURVEY NEEDED? ���������������������������������������������������������������������������������������������������������������������������������������������� 71 KEY FINDINGS AND FRA OPINIONS ������������������������������������������������������������������������������������������������������������������������������� 9
1.1. Poverty and social exclusion .................................................................................................................................... 91.2. Labour market participation ................................................................................................................................... 101.3. Education .................................................................................................................................................................... 101.4. Awareness of rights and reporting of discrimination .......................................................................................... 111.5. Towards more effective monitoring and evaluation ........................................................................................... 11
2 WHAT DO THE RESULTS SHOW? ����������������������������������������������������������������������������������������������������������������������������������� 132.1 Poverty and marginalised living conditions .......................................................................................................... 13
2.1.1. Income poverty ............................................................................................................................................. 132.1.2. Hunger ............................................................................................................................................................ 16
2.2. Labour market participation .................................................................................................................................... 172.2.1. Main activity status ...................................................................................................................................... 172.2.2. Paid work ....................................................................................................................................................... 192.2.3. Young people neither in employment nor in education or training ..................................................... 212.2.4. Low work intensity of households ............................................................................................................ 22
2.3 Education .................................................................................................................................................................... 232.3.1. Participation in education ........................................................................................................................... 232.3.2. Segregation in education ............................................................................................................................ 272.3.3. Educational attainment .............................................................................................................................. 28
2.4. Health ......................................................................................................................................................................... 292.4.1 Health insurance coverage and unmet medical care needs ................................................................. 292.4.2. Long-term activity limitations ................................................................................................................... 30
2.5. Housing ....................................................................................................................................................................... 312.5.1. Availability of space ..................................................................................................................................... 322.5.2. Access to public utilities and basic housing amenities ........................................................................... 332.5.3. Housing quality and surrounding environment ...................................................................................... 34
2.6. Discrimination and rights awareness .................................................................................................................... 362.6.1. Overall prevalence of discrimination ........................................................................................................ 362.6.2. Perceptions of the extent of discrimination on ground of ethnic origin ........................................... 382.6.3. Reporting of incidents of discrimination .................................................................................................. 402.6.4. Awareness of support organisations, equality bodies, laws and campaigns addressing
discrimination ............................................................................................................................................... 40THE SURVEY IN A NUTSHELL ������������������������������������������������������������������������������������������������������������������������������������������������ 43REFERENCES �������������������������������������������������������������������������������������������������������������������������������������������������������������������������� 47

6
Figures and tablesFigure 1: At-risk-of-poverty rate (below 60 % of median equivalised income after social transfers) of
Roma, compared with the rate of the general population in 2014 (EU-SILC), by EU Member State (%) .. 14Figure 2: At-risk-of-poverty rates and concentration of Roma in residential areas, by EU Member State (%) ........ 15Figure 3: Ability to ‘make ends meet’, Roma, by EU Member State (%) ........................................................................ 15Figure 4: Roma living in households where, in the previous month, at least one person went to bed
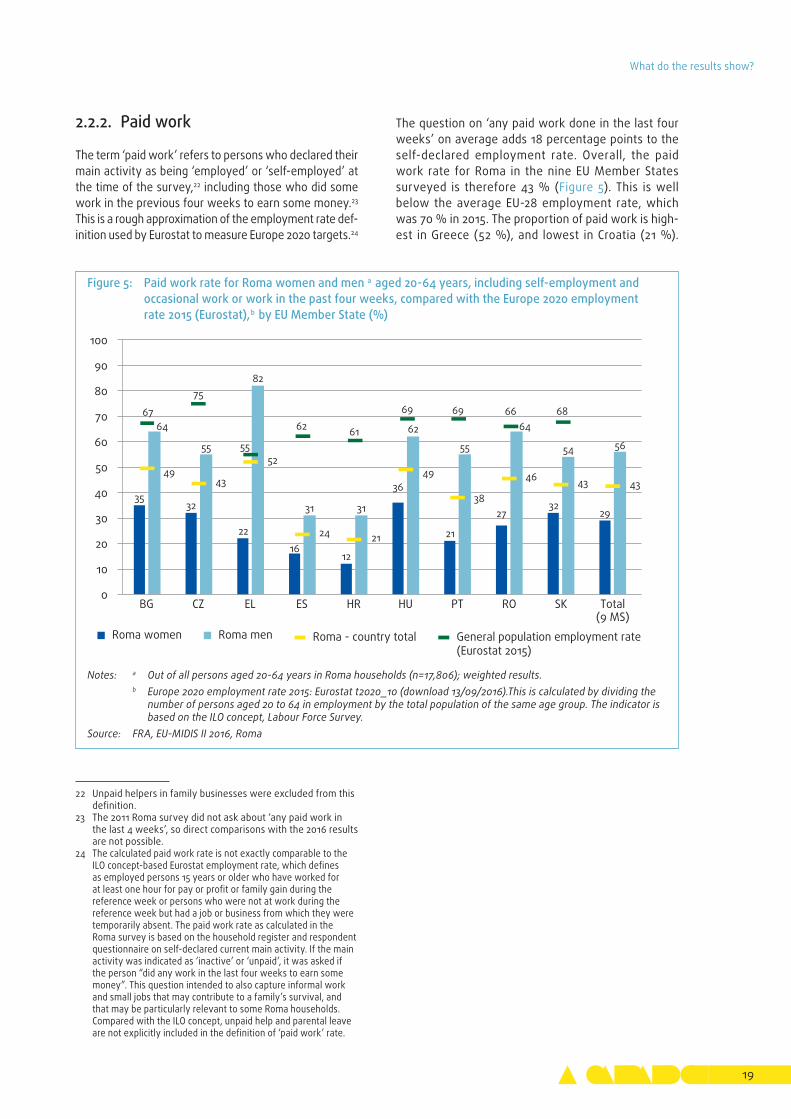
hungry once, a few times, or four or more times, by EU Member State (%) ................................................ 16Figure 5: Paid work rate for Roma women and men aged 20-64 years, including self-employment
and occasional work or work in the past four weeks, compared with the Europe 2020 employment rate 2015 (Eurostat), by EU Member State (%) ............................................................................ 19
Figure 6: Young Roma aged 16-24 years neither in work nor in education or training as their main activity, by EU Member State (%) ........................................................................................................................ 21
Figure 7: Roma aged 0-59 years living in households with a current low work intensity, by EU Member State (%) ................................................................................................................................................................... 22
Figure 8: Children aged between 4 years and the (country-specific) starting age of compulsory education who participate in early childhood education, by EU Member State (%) ................................... 23
Figure 9: Compulsory-school-age children (country-specific) participating in education, by EU Member State (%) .................................................................................................................................................................. 24
Figure 10: Roma aged 6-24 years by educational level they attend (%) ........................................................................ 26Figure 11: Early leavers from education and training, aged 18-24 years, by EU Member State (%) ........................... 27Figure 12: School segregation – concentration of Roma children aged 6-15 years in school, by
EU Member State (%) ............................................................................................................................................ 28Figure 13: Roma who have not completed any level of formal education (ISCED 0), by age group and
EU Member State (%) ............................................................................................................................................ 29Figure 14: Roma, aged 16 years or over, who indicate that they are covered by national basic health
insurance and/or additional insurance, by EU Member State (%) ................................................................. 30Figure 15: Long-term activity limitations of women and men, Roma and general population, by
EU Member State (%) ............................................................................................................................................. 31Figure 16: Average number of rooms per person in the household, Roma and general population
(mean) , by EU Member State ................................................................................................................................ 32Figure 17: Roma living in households without tap water inside the dwelling, compared with general
population, by EU Member State (%) .................................................................................................................. 33Figure 18: Roma living in dwellings without a toilet and shower or bathroom inside the dwelling,
compared with general population, by EU Member State (%) ....................................................................... 34Figure 19: Overall prevalence of discrimination based on Roma background in the past 5 years and
past 12 months, by EU Member State (%) ......................................................................................................... 36Figure 20: Roma who believe discrimination based on ethnic origin, skin colour or religious belief is very
or fairly widespread in their country, by EU Member State (%) .................................................................... 39Figure 21: Extent of discrimination on grounds of ethnic origin perceived by general population in
nine EU Member States (Special Eurobarometer 437), by country (%) ......................................................... 39Figure 22: Roma who reported or filed a complaint about the last incident of discrimination based on
Roma background, by EU Member State (%) .................................................................................................... 40Figure 23: Awareness among Roma of organisations that offer support or advice to victims of
discrimination (regardless of the grounds of discrimination), by EU Member State (%) ............................ 41Figure 24: Awareness among Roma of laws prohibiting discrimination based on skin colour, ethnic origin
or religion, by EU Member State (%) ................................................................................................................... 41
Table 1: Self-declared current main activity status in nine EU Member States, all persons in Roma households aged 16 years or over (%) ................................................................................................................ 18
Table 2: Paid work rate for Roma aged 20-64 years, including self-employment, occasional work and work in the previous four weeks, by age group and country (%) ................................................................. 20
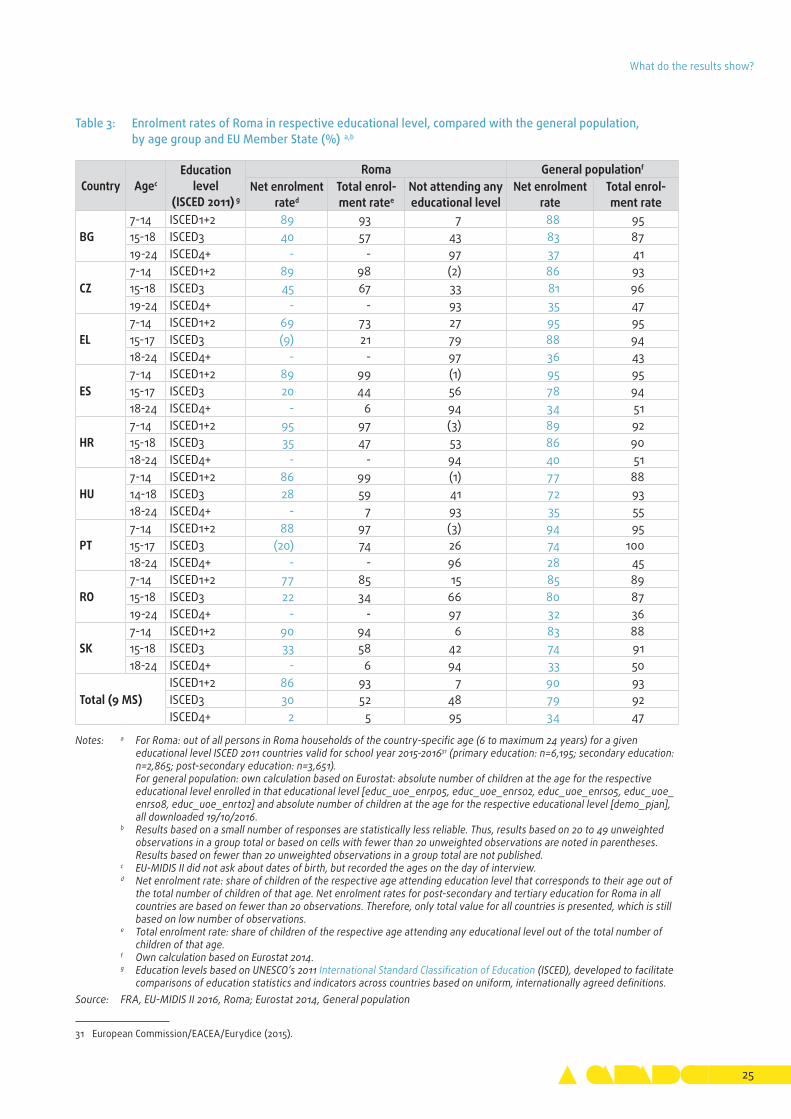
Table 3: Enrolment rates of Roma in respective educational level, compared with the general population, by age group and EU Member State (%) ....................................................................................... 25
Table 4: Roma living in dwellings with a leaking roof or damp walls or other problems with the housing structure and in dwellings that are too dark compared with general population, compared with general population, by EU Member State (%) ........................................................................ 35
Table 5: Environment of the dwelling – Roma living in areas affected by pollution, crime, violence and vandalism compared with general population, by EU Member State (%) .................................................... 35
Table 6: Prevalence of discrimination based on Roma background in the past 12 months in different areas of life, by EU Member State (%) .................................................................................................................. 37
Table 7: Prevalence of discrimination based on Roma background in the past 5 years in different areas of life, by EU Member States (%) ........................................................................................................................ 38
Table 8: Number of Roma individuals and households interviewed in EU-MIDIS II, by EU Member State .............. 44

7
Why is this survey needed?The European Union (EU) institutions have long underlined the need to ensure that Roma – the largest European minority – are treated equally with respect to their fundamental rights, as enshrined in the Char-ter of Fundamental Rights of the EU. They have also provided guidance and funding to EU Member States to achieve this.
In 2011, the European Commission proposed an EU Framework for National Roma Integration Strategies up to 2020. It aims to ensure Roma’s equal access to four key areas – employment, education, health and housing – to improve their socio-economic conditions. The communication highlights that Europe 2020, the EU’s strategy for smart, sustainable and inclusive growth, leaves no room for the persistent economic and social marginalisation of Europe’s largest ethnic minority. On 9 December 2013, the Council of the EU adopted a Recommendation on effective Roma integration measures in the Member States (2013 Council Recommendation),1 on the implementation of which the European Commission reports annually.
Although Roma are the largest ethnic minority in Europe,2 there is no systematic data collection on Roma in the EU Member States. Therefore, the Europe 2020 statistical indicators for employment, poverty and edu-cation cannot be disaggregated for Roma. With very few exceptions, the EU-wide large-scale surveys – such as the EU Statistics on Income and Living Conditions (EU-SILC) and the Labour Force Survey (LFS) – currently do not collect information on ethnicity and do not suf-ficiently cover ethnic minorities, including Roma.
1 Council of the European Union (2013), Council Recommendation 378/1 of 9 December 2013 on effective Roma integration measures in the Member States, OJ 2013 C 378.
2 European Commission, ‘EU and Roma’ (online), 5 August 2016 and Council of Europe (2012).
In 2016, the European Court of Auditors issued a special report to assess the impact of EU policy initiatives and financial support on Roma integration.3 Recommendation 8 (b) of this report calls on the European Commission to encourage Member States to collect comprehensive statistical data on ethnicity within the next two years. It further suggests that Eurostat could include relevant questions in EU-SILC and its Labour Force Survey. The European Commission, however, rejected this recommendation, commenting that collecting statistical data on ethnicity through European statistical instruments is technically difficult, expensive and legally challenging in some countries.
In the United Nations’ 2030 Agenda for Sustainable Development, Member States commit to reviewing the progress made in implementing targets and goals over the coming 15 years and to develop indicators to assist this work. Quality, accessible, timely and reliable disag-gregated data will be needed to help measure progress and ensure that no one is left behind.4
Responding to the need for dataThe EU Agency for Fundamental Rights (FRA) fills this data gap with its surveys on ethnic minorities and Roma. This report presents selected results for Roma, based on the second European Union Minorities and Discrimination Survey (EU-MIDIS II). The full results on Roma will be published in 2017.
In 2008, FRA surveyed Roma in seven EU Member States5 in the context of the first European Union Minorities and Discrimination Survey (EU-MIDIS I).6 In 2011 – together with the European Commission, the United Nations Development Programme (UNDP) and the World Bank – FRA conducted a second survey on Roma in 11 EU Member States.7 The survey collected data on their socio-economic situation in employment, education, housing and health, on experiences of dis-crimination and on rights awareness.8
In 2016, FRA surveyed Roma for a third time: as part of EU-MIDIS II, to assess progress over time, reflecting the impact of legal and policy developments on the
3 European Court of Auditors (ECA) (2016).4 For more information, see the 2030 Agenda’s website. 5 Bulgaria, Czech Republic, Greece, Hungary, Poland, Romania,
and Slovakia.6 FRA (2009).7 Bulgaria, the Czech Republic, France, Greece, Hungary, Italy,
Poland, Portugal, Romania, Slovakia and Spain.8 FRA (2012).
On terminologyThe Council of Europe uses ‘Roma’ as an umbrella term. It refers to Roma, Sinti, Kale and related groups in Eu-rope, including Travellers and the Eastern groups (Dom and Lom), and covers the wide diversity of the groups concerned, including persons who identify themselves as Gypsies.
For the purpose of the EU-MIDIS II survey, ‘Roma’ refers to autochthonous ‘Roma’ within selected EU Member States and does not focus on ‘Roma’ who have moved from one EU Member State to another.For more information, see Council of Europe (2012), Descriptive glossary of terms relating to Roma issues, Strasbourg.
Second European Union Minorities and Discrimination Survey | Roma – Selected findings
8
ground. This survey builds on experience gained from past surveys to allow comparisons with Eurostat data, while retaining, as far as possible, comparability with the previous surveys on Roma.
Collecting the data n Survey countries – EU-MIDIS II collected information
from over 25,500 respondents from different ethnic minority and immigrant backgrounds in all 28 EU Member States. The findings summarised in this report are based on 7,947 individual interviews with Roma respondents in Bulgaria, Croatia, the Czech Republic, Greece, Hungary, Portugal, Romania, Slovakia and Spain. In addition, the survey collected information on 33,785 individuals living in respondents’ households. Roma living in the nine countries surveyed represent about 80 % of Roma living in the EU, according to Council of Europe estimates.9 Of the nine countries surveyed in EU-MIDIS II, eight were surveyed in the 2011 Roma survey and six in the 2008 EU-MIDIS I survey.
n Survey results’ representativeness – the data are representative for Roma living in the nine EU Member States in geographic or administrative units with density of Roma population higher than 10 %, who self-identify as “Roma” or as members of one of the other groups covered by this umbrella term. Therefore, the findings presented in this report reflect the living conditions, enjoyment of fundamental rights and experiences with discrimination of up to 80 % of Roma living in the nine EU Member States surveyed (for more details, see ‘The survey in a nutshell’).
n Survey participants – individuals aged 16 years or older, living in private households, who self-iden-tify as Roma and whose usual place of residence was in the territory of the EU for at least 12 months, were eligible to participate in the survey.
9 Council of Europe (2012).
n Survey questions – respondents provided infor-mation about their personal situation and living conditions, as well as on basic socio-demographic characteristics of all household members. The sur-vey includes questions on experiences of discrimi-nation in employment, education, housing, health and when using public or private services, as well as on the extent of reporting such incidents. In ad-dition, the survey asks about experiences of crime victimisation (including hate crime). The survey also asks respondents about their awareness of their rights and redress mechanisms. The question-naire built on the EU-MIDIS I and 2011 Roma survey questions. It was further developed on the basis of stakeholder and expert consultations, followed in 2014 by a cognitive pre-test (a qualitative tool for improving questionnaire design).10 The survey interviews were conducted between October 2015 and April 2016.
n Selection of indicators – the indicator set presented in this report reflects the priority areas of the EU Framework for National Roma Integration Strategies up to 2020: employment and poverty, education, housing, health, discrimination and rights awareness. Detailed results and analysis of additional indicators will be published in 2017. Where possible, and to allow for analytical comparison, indicators are the same or similar to those applied in standard European surveys, such as EU SILC or the EU LFS. First comparisons with the 2011 Roma survey and EU-MIDIS I are made for comparable indicators and are reported only when larger differences are observed. Given improvements in the sampling methodology and application of sample design weights in 2016, comparability with the 2011 Roma survey or EU-MIDIS I is restricted, with certain caveats outlined in the individual cases (for more details, see ‘The survey in a nutshell’). Analyses of trends for each country surveyed should consider the methodological caveats and statistical variation and the need for further in-depth analysis.
10 See Willis, G. B. (2005), p. 3.
9
1
Key findings and FRA Opinions
The following FRA Opinions, which build on the key findings of EU-MIDIS II on Roma, should be read against the targets set out in the EU’s growth strategy ‘Europe 2020’ and, in particular, against the 2013 Council Recom-mendation on effective Roma integration measures in the Member States.
Europe 2020 sets a target of reducing, by 2020, the number of people threatened by poverty or social exclusion by 20 million. Roma are overrepresented among those affected by poverty and social exclusion: FRA’s first Roma survey in 2011 found that at least eight out of 10 of the Roma surveyed were at risk of poverty and, on average, fewer than one out of three reported to be in paid work, while almost half lived in housing lacking basic amenities, such as an indoor kitchen, indoor toilet, indoor shower or bath, and electricity.
In this context, the European Commission in April 2011 adopted an EU Framework for National Roma Integration Strategies, focusing on four key areas: education, employment, healthcare and housing. Member States developed their national Roma integration strategies and sets of integrated policy measures based on this framework. In December 2013, the Employment, Social Policy, Health and Consumer Affairs Council (EPSCO) issued a Recommendation providing guidance to Member States to enhance the effectiveness of
their Roma integration measures. At the same time, the EU allocated funding through the EU’s structural and investment funds, introducing a specific ex ante thematic conditionality, which requires an appropriate national Roma integration strategy to be in place for using funds for Roma integration.
1�1� Poverty and social exclusion
EU-MIDIS II shows that 80 % of Roma continue to live below the at-risk-of-poverty threshold of their coun-try; that every third Roma lives in housing without tap water; one in 10 in housing without electricity; and that every fourth Roma (27 %) and every third Roma child (30 %) live in a household that faced hunger at least once in the previous month.
This suggests that the 2013 Council Recommendation’s goal on effective Roma integration measures concerning poverty reduction through social investment is far from being reached. The same applies to the 2013 European Commission Recommendation ‘Investing in children: breaking the cycle of disadvantage’, which provides guidelines to Member States for organising and implementing policies to address child poverty and social exclusion.

Second European Union Minorities and Discrimination Survey | Roma – Selected findings
10
FRA Opinion 1
EU Member States should adapt their National Reform Programmes within the European Semester and give the highest priority to alleviating extreme forms of poverty, especially hunger, malnutrition and severe housing deprivation among Roma, as also envisaged in UN Sustainable Development Goal 1.
EU Member States should ensure that social protection systems and social services granted to disadvantaged persons, including Roma, are adequate, accessible and used by potential beneficiaries.
National targets of the Europe 2020 strategy and National Reform Programmes should explicitly address the vulnerability of Roma children, ensuring that households have, as a minimum, access to adequate housing with tap water, electricity and sufficient space.
EU Member States should make full use of the Fund for European Aid to the Most Deprived11 to provide free meals in schools and childcare facilities to all children, including Roma, who are in need and suffer from malnutrition.
1�2� Labour market participation
EU-MIDIS II finds that only one in four Roma aged 16 years or older reports ‘employed’ or ‘self-employed’ as their main activity at the time of the survey. Roma women report much lower employment rates than Roma men – 16 % compared with 34 %. Overall, the survey shows paid work rates for Roma aged 20-64 years to be 43 %, which is well below the EU average of 70 % in 2015. The situation of young people is substan-tially worse: on average, 63 % of Roma aged 16-24 were not employed, in education or training at the time of the survey, compared with the 12 % EU average on the NEET rate for the same age group. For this age group, the results also show a considerable gender gap, with 72 % of young Roma women not employed, in education or training, compared with 55 % of young Roma men.
This suggests that meeting the 2013 Council Recommendation’s goal of taking effective measures to ensure equal treatment of Roma in access to the labour market and to employment opportunities will be a considerable challenge.
11 The Fund for European Aid to the Most Deprived (FEAD) supports Member State actions to provide material assistance – for example, food, clothing and essential personal items – to the most deprived.
FRA Opinion 2
EU Member States should ensure that measures implementing the 2013 Council Recommendation’s provisions on access to employment pay adequate attention to the transition from education and training to employment to ensure that educational investment provides work opportunities for disadvantaged persons – including Roma, especially youth and women.
EU Member States should encourage stronger engagement of businesses, particularly at local level, and consider supporting the development of social enterprises to create sustainable workplaces for Roma, with a focus on Roma women.
EU Member States should implement the 2013 Council Recommendation’s provisions on promoting employment opportunities in the civil service for persons with minority ethnic origin, such as Roma, particularly women. Public administrations can benefit from an ethnically diverse staff, while improving their understanding of the particular challenges Roma face and providing positive role models to ethnic minority communities.
1�3� EducationThe results of the first Roma survey in 2011 were wor-rying. They showed that only one out of two Roma children surveyed attended pre-school or kindergarten, and a very small proportion continued school after com-pulsory education. EU-MIDIS II results show that Roma children lag behind their non-Roma peers on all educa-tion indicators. Only about half (53 %) of Roma children between the age of four and the starting age of com-pulsory primary education participate in early childhood education. On average, 18 % of Roma between 6 and 24 years of age attend an educational level lower than that corresponding to their age. The proportion of Roma early school-leavers is disproportionately high com-pared with the general population. School segregation remains a problem in Bulgaria, Greece, Hungary and Slo-vakia despite the legal prohibition of this practice and recent case law of the European Court of Human Rights.
This suggests that the 2013 Council Recommendation’s goal of taking effective measures to ensure equal treat-ment and full access to quality and mainstream educa-tion for Roma children and that all Roma pupils complete at least compulsory education has not been reached. The results suggest that public authorities have not implemented effective measures to ensure Roma chil-dren’s equal participation in pre-school or kindergarten, upper-secondary or tertiary education.

Key findings and FRA Opinions
11
FRA Opinion 3
EU Member States should implement the 2013 Council Recommendation’s provision calling for the elimination of any school segregation by taking immediate measures to ensure the equal participation of all Roma children in integrated schools and classes.
National educational authorities should work closely with Roma civil society and local authorities to resolve community conflicts and/or phenomena of anti-Gypsyism that prevent Roma parents from enrolling their children in integrated schools and classes.
Local authorities should take into account the overall living conditions and barriers Roma children face in regard to education. Policy measures should offer incentives, and social and learning support at schools to offset the multiple challenges Roma children face and boost their opportunities for an equal start.
National educational authorities should provide the necessary support and resources to schools with Roma student populations to ensure that Roma children enrol in classes according to their age and to reduce dropout rates.
1�4� Awareness of rights and reporting of discrimination
In the 2011 Roma survey, about half of the respondents indicated that they felt discriminated against because of their ethnic origin. Only a minority were aware of laws forbidding discrimination on grounds of ethnic origin when applying for a job.
EU-MIDIS II finds that Roma continue to face intolerable levels of discrimination in daily life – whether looking for work, at work, in education, healthcare, or when in contact with administrative bodies or entering a shop. Almost one in two Roma (41 %) felt discriminated against because of their ethnic origin at least once in one of these areas of daily life in the past five years. One in four Roma (26 %) indicates that the last incident of perceived discrimination happened in the 12 months preceding the survey. The highest prevalence of discrimination in the past 12 months is found when using public or private services (19 %) and when looking for work (16 %). However, on average, only 12 % of Roma report their experiences of discrimination to an authority. Moreover, almost a third (27 %) of the Roma surveyed do not know of any law prohibiting discrimination based on ethnic origin, and most Roma (82 %) do not know any organisations offering support to victims of discrimination.
This suggests that, although the 2013 Council Recom-mendation specifically refers to a range of horizontal policy measures to address discrimination, much remains to be done to ensure the effective and practical enforce-ment of the Racial Equality Directive (2000/43/EC),12 as explicitly required by the recommendation.
FRA Opinion 4
EU Member States should ensure that, as requested by the 2013 Council Recommendation, their public administration and equality bodies take the necessary measures to ensure the effective and practical enforcement of the Racial Equality Directive (2000/43/EC), with a particular focus on gender aspects.
EU Member States and the European Commission should strengthen support for civil society efforts to raise rights awareness among Roma.
EU Member States should fully implement Article 10 of Directive 2000/43/EC, which obliges Member States to ensure that provisions adopted pursuant to the directive, together with relevant provisions already in force, “are brought to the attention of the persons concerned by all appropriate means throughout their territory”.
1�5� Towards more effective monitoring and evaluation
One of the structural measures requested by the 2013 Council Recommendation concerns monitoring and evaluating policies. The European Commission and FRA have for several years promoted collecting data that can be disaggregated by ethnic origin and that is based on information about respondents’ self-identification, collected on a voluntary basis and in full respect of EU and national data protection regulations. In this context, FRA regularly conducts surveys on members of ethnic, religious and other minorities. Developing a common methodology, which provides relevant and comparable data on the Roma population across the Member States to monitor their social inclusion, can be best achieved at EU level in close cooperation with all Member States.
Against this background, the Court of Auditors – in Recommendation 8 of its 2016 special report on EU policy initiatives and financial support for Roma integration – calls on the European Commission to work with the
12 Council Directive 2000/43/EC of 29 June 2000 implementing the principle of equal treatment between persons irrespective of racial or ethnic origin, OJ L 180, 19 July 2000.

Second European Union Minorities and Discrimination Survey | Roma – Selected findings
12
Member States to develop a common methodology. The Commission is asked to “encourage Member States, in accordance with national legal frameworks and EU legislation, including existing possible derogations, to collect in a comprehensive manner statistical data on ethnicity within the next 2 years.”
FRA Opinion 5
The European Commission should encourage EU Member States to consider collecting statistical data on ethnicity in the Labour Force Survey (LFS) and in the European Union Statistics on Income and Living Conditions (EU-SILC). While collecting statistical data on the Roma population is technically and legally challenging, as well as expensive, individual Member States have successfully tested the inclusion of questions on ethnicity in EU-SILC and LFS.

13
2
What do the results show?
2�1 Poverty and marginalised living conditions
Article 25 of the Universal Declaration of Human Rights, referred to in Article 11 of the International Covenant on Economic, Social and Cultural Rights (ICESCR), enshrines the individual’s “right to a standard of living adequate for the health and well-being of himself and of his fam-ily, including food, clothing, housing, and medical care and necessary social services”.13 Together with the European Social Charter (Revised), these international human rights instruments provide a broader foundation for developing the new European pillar of social rights’ consultation, which was announced by the European Commission in 2016.14
Combating poverty and social exclusion is a headline target of the Europe 2020 strategy. The 2013 Council Recommendation on effective Roma integration meas-ures links poverty reduction with policies of labour market activation and enablement.15 It is also at the core of Goal 1 of the United Nations (UN) Sustainable Development Goals (SDGs), which calls for an end to poverty in all its manifestations by 2030 and aims to ensure social protection for the poor and vulnerable and increase access to basic services.16
13 United Nations (UN), General Assembly (GA), Universal Declaration of Human Rights, 10 December 1948, Art. 25. See also UN, GA, International Covenant on Economic, Social and Cultural Rights, 3 January 1976, Art. 11.
14 European Commission (2016).15 2013 Council Recommendation, Recommendation 2.6,
Poverty reduction through social investment.16 See SDG-1. See also FRA (2016).
2�1�1� Income poverty
The at-risk-of poverty rate includes those living in households with an equivalised household income below the national at-risk-of-poverty threshold, which is 60 % of the annual median income after social trans-fers and annually published by Eurostat.17
17 The rate calculated based on EU-MIDIS II is of limited compa-rability with the EU indicator ‘at risk of poverty after social transfer’. On the one hand, EU-MIDIS II information on income was collected in 2015-2016, but the poverty threshold applied is based on the 2014 EU-SILC data (the latest available at the time of drafting). As the poverty threshold 2015-2016 is expected to be higher, this report might underestimate the at-risk-of-poverty rate for Roma. EU-MIDIS II asked respondents about their current monthly household income. This can result in an underestima-tion of the annual household income and some relevant income components, meaning EU-MIDIS II may overestimate those at risk of poverty. By contrast, data collected for the Eurostat indi-cator provide information about annual household incomes.
UN Sustainable Development Goals and TargetsGoal 1: End poverty in all its forms everywhere.
Target 1. By 2030, eradicate extreme poverty for all people everywhere, currently measured as people living on less than $1.25 a day.
Target 2. By 2030, reduce at least by half the proportion of men, women and children of all ages living in poverty in all its dimensions according to national definitions.
Target 3. Implement nationally appropriate social protection systems and measures for all, including floors, and by 2030 achieve substantial coverage of the poor and the vulnerable.
Goal 10: Reduce inequality within and among countries.
Target 1. By 2030, progressively achieve and sustain in-come growth of the bottom 40 per cent of the population at a rate higher than the national average.
Second European Union Minorities and Discrimination Survey | Roma – Selected findings
14
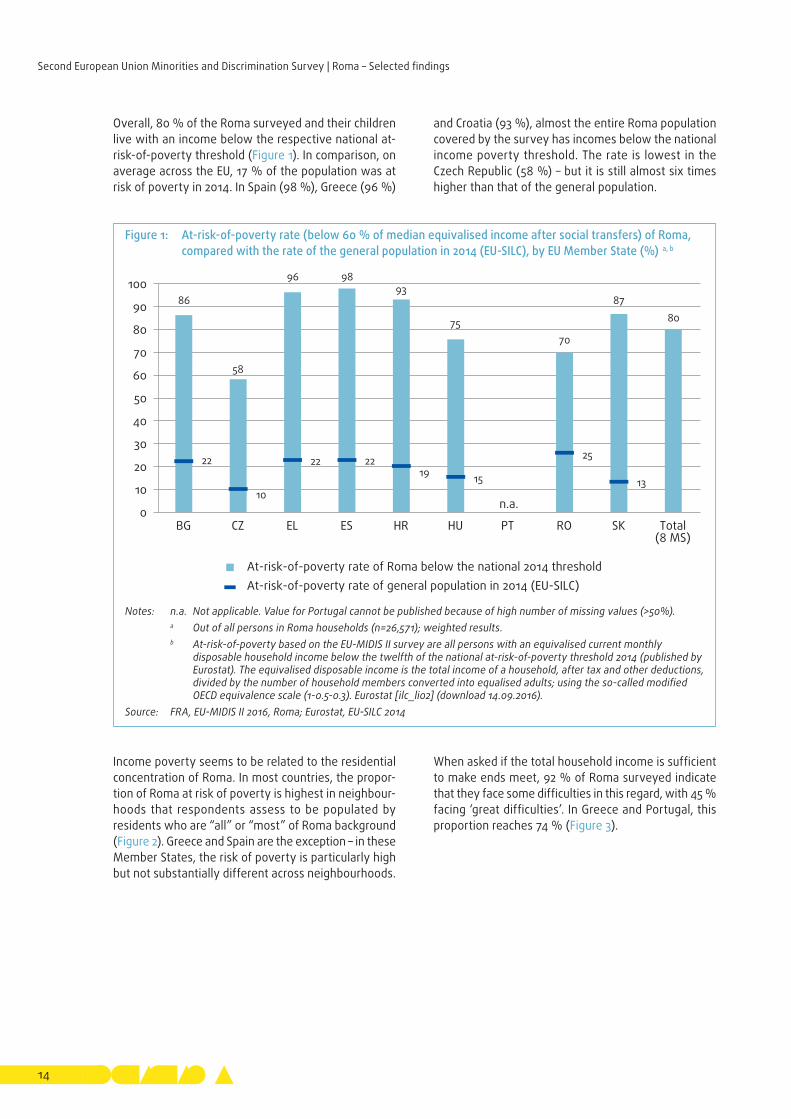
Overall, 80 % of the Roma surveyed and their children live with an income below the respective national at-risk-of-poverty threshold (Figure 1). In comparison, on average across the EU, 17 % of the population was at risk of poverty in 2014. In Spain (98 %), Greece (96 %)
and Croatia (93 %), almost the entire Roma population covered by the survey has incomes below the national income poverty threshold. The rate is lowest in the Czech Republic (58 %) – but it is still almost six times higher than that of the general population.
Figure 1: At-risk-of-poverty rate (below 60 % of median equivalised income after social transfers) of Roma, compared with the rate of the general population in 2014 (EU-SILC), by EU Member State (%) a, b
Notes: n.a. Not applicable. Value for Portugal cannot be published because of high number of missing values (>50%). a Out of all persons in Roma households (n=26,571); weighted results. b At-risk-of-poverty based on the EU-MIDIS II survey are all persons with an equivalised current monthly
disposable household income below the twelfth of the national at-risk-of-poverty threshold 2014 (published by Eurostat). The equivalised disposable income is the total income of a household, after tax and other deductions, divided by the number of household members converted into equalised adults; using the so-called modified OECD equivalence scale (1-0.5-0.3). Eurostat [ilc_li02] (download 14.09.2016).
Source: FRA, EU-MIDIS II 2016, Roma; Eurostat, EU-SILC 2014
86
58
96 9893
7570
8780
22
10
22 22 19 15
25
13
0
10
20
30
40
50
60
70
80
90
100
BG CZ EL ES HR HU PT RO SK Total(8 MS)
At-risk-of-poverty rate of Roma below the national 2014 threshold At-risk-of-poverty rate of general population in 2014 (EU-SILC)
n.a.
Income poverty seems to be related to the residential concentration of Roma. In most countries, the propor-tion of Roma at risk of poverty is highest in neighbour-hoods that respondents assess to be populated by residents who are “all” or “most” of Roma background (Figure 2). Greece and Spain are the exception – in these Member States, the risk of poverty is particularly high but not substantially different across neighbourhoods.
When asked if the total household income is sufficient to make ends meet, 92 % of Roma surveyed indicate that they face some difficulties in this regard, with 45 % facing ‘great difficulties’. In Greece and Portugal, this proportion reaches 74 % (Figure 3).

What do the results show?
15
Figure 2: At-risk-of-poverty rates a and concentration b of Roma in residential areas, by EU Member State (%) c
Notes: n.a. Not applicable. Value for Portugal cannot be published because of high number of missing values (>50%). a Out of all persons in Roma households, except for Portugal (n=26,419); weighted results. b Concentration was asked: “In the neighbourhood where you live, how many of the residents would you say are
of Roma background as you: all of the residents, most of them, some, or none of them?” c Due to rounding, sums of categories in the figure may deviate from the text by one percentage point.Source: FRA, EU-MIDIS II 2016, Roma
Figure 3: Ability to ‘make ends meet’, Roma, by EU Member State (%) a,b,c
Notes: a Out of all persons in Roma households (n=31,334); weighted results. b Survey question: “Thinking of your household’s total income, is your household able to make ends meet?” c Due to rounding, sums of categories in the figure may deviate from the text by one percentage point.Source: FRA, EU-MIDIS II 2016, Roma
n.a.
90
80
97 100 98
86
80
98
89 86
65
95 98
95
75 72
82 79 77
51
97 98
82
71
60
88
74
0
10
20
30
40
50
60
70
80
90
100
BG CZ EL ES HR HU PT RO SK Total(8 MS)
All are Roma Most of them are Roma Some/none are Roma
48
31
74 64
52 48
74
34 45 45
21
29
16 24
32 32
14
28
31 27
17 27
9 9 13 15 7
28
16 19
13 13 3 (1) 3 4 4
10 7 8
0
10
20
30
40
50
60
70
80
90
100
BG CZ EL ES HR HU PT RO SK Total(9 MS)
With great difficulty With difficulty With some difficulty Fairly easily/easily/very easily

Second European Union Minorities and Discrimination Survey | Roma – Selected findings
16
2�1�2� Hunger
Article 25 of the Universal Declaration of Human Rights and Article 11 of the ICESCR set out the individual’s right to food and necessary social services. The right to social assistance is also laid out in Article 34 of the EU Charter of Fundamental Rights (access to social security and social assistance). These are clearly violated if people suffer from hunger and malnutrition. The Committee on Economic, Social and Cultural Rights (CESCR) interpreted the right to adequate food in General Comment 12 (1999), establishing that the right is realised when every man, woman and child, alone or in a community with others, has the physical and economic access at all times to adequate food or means for its procurement. Putting an end to hunger and achieving food security is another pillar of the Sustainable Development Goals.
Figure 4 shows that 7 % of the Roma surveyed live in households in which at least one person regularly went to bed hungry in the preceding month (that is, 4 times or more). This is experienced by 17 % of Roma in Croatia, 13 % of Roma in Greece and 11 % of Roma in Hungary. In Greece, almost every second person (47 %) lives in a household in which a person had to go to bed hungry at least once in the preceding month. This is of particular concern as Greece shows the highest rates of Roma in paid work, which appears to be insufficient
to cover even basic needs, such as food. Moreover, the findings show that, on average, every third Roma child in the countries surveyed lives in a household that faced hunger at least once in the preceding month.
Compared with the 2011 survey findings, the propor-tion of Roma living in households in which at least one person went to bed hungry at least once in the pre-vious month declined in Bulgaria, the Czech Republic, Hungary and Romania. It did not change in Greece, Slovakia and Spain.
UN Sustainable Development Goals and TargetsGoal 2: End hunger, achieve food security and improve nutrition and promote sustainable agriculture.
Target 1. By 2030, end hunger and ensure access by all people, in particular the poor and people in vulnerable situations, including infants, to safe, nutritious and suf-ficient food all year round.
Target 2. By 2030, end all forms of malnutrition, including achieving, by 2025, the internationally agreed targets on stunting and wasting in children under 5 years of age, and address the nutritional needs of adolescent girls, pregnant and lactating women and older persons.
Figure 4: Roma living in households where, in the previous month, at least one person went to bed hungry once, a few times, or four or more times, by EU Member State (%) a, b
Notes: n.a. Not applicable. Value for Portugal cannot be published because of high number of missing values (>25%). a Out of all persons in Roma households (n=31,793); weighted results. b Survey question: “In the past month, have you or anyone in the household ever gone to bed hungry because
there was not enough money for food? If yes, how often did this happen in the past month?”Source: FRA, EU-MIDIS II 2016, Roma
7380
52
83
62
80
n.a.
68 69 73
75
9
2
3
3
6 7 5
1412
25
7
18
1117 15 14
6 313 8
176 9 9 7
0
10
20
30
40
50
60
70
80
90
100
BG CZ EL ES HR HU PT RO SK Total(8 MS)
Never Once A few times (2-3) Several times (4 or more)

What do the results show?
17
2�2� Labour market participation
Article 15 of the EU Charter of Fundamental Rights pro-tects the right to engage in work. The first headline target of the Europe 2020 Strategy is to ensure that 75 % of the EU population aged 20-64 is employed by 2020. The 2013 Council Recommendation recom-mends that Member States take effective measures to achieve this, including by combating discrimina-tion and supporting first work experience, vocational training, on-the-job training, lifelong learning and skills development, as well as supporting self-employment and entrepreneurship. Three of the targets of SDG Goal 8 – ‘Promote inclusive and sustainable economic growth, employment and decent work for all’ – focus on labour market participation.
2�2�1� Main activity status
On average, one in four Roma aged 16 years or older (25 %) described their main activity as ‘employed’ or ‘self-employed’ at the time of the survey (Table 1). This includes full-time and part-time work, as well as ’occasional work’ when considered as the main activity.18 Almost twice as many (64 %) persons indicate that they are in employment in the general population in the respective nine EU Member States.19 Compared with the 2011 survey findings, no substantial improvement can be observed. Self-declared employment rates of Roma are highest in Greece (43 %), followed by
18 ‘Main activity’ is asking all household members for their current status in regard to employment. It is distinct from the ILO concept of employment and the one used in the Labour Force Survey (variable MAINSTAT). ‘Employment’ also includes small amounts of unpaid work in family businesses, as this is for the family’s gain.
19 Based on a data request to Eurostat on the Labour Force Survey on self-declared labour status (variable MAINSTAT), 15 years and older.
Hungary (36 %) and Portugal (34 %). The lowest rates are observed in Croatia (8 %) and Spain (16 %).
One third of the surveyed Roma household members (34 %) declare themselves to be ‘unemployed’, with shares above 50 % in Croatia (62 %), Spain (57 %) and Bulgaria (55 %). In Romania, particularly low shares of self-declared unemployment, at 5 %, are observed, fol-lowed by Portugal with 17 % and Hungary with 23 %. As the perception of being unemployed and the share of persons in domestic work are linked, a closer inves-tigation on a country level would be required to analyse if there is a lack of registration for unemployment or withdrawal from the labour market, and if these are due to resignation.
Moreover, Table 1 shows a substantial gender gap: 34 % of Roma men indicate being ‘employed’ as their main activity, compared with only 16 % of Roma women. In comparison, the gender gap in the general population is still substantial, but it is not as large as among Roma (71 % of men being employed, compared with 57 % of women). The gender gap in labour market partici-pation among Roma could be explained by the higher engagement of women in domestic work as their main activity. The 2011 Roma survey also revealed a sub-stantial gender gap in labour market participation and a higher proportion of women being occupied mainly in ‘domestic work’, which in 2016 is (and was in 2011) the second highest category of self-reported activity after ‘unemployment’. According to EU-MIDIS II survey findings, 28 % of all Roma women surveyed indicate ‘domestic work’ as their main activity, compared with 6 % of all Roma men. This ratio is high for Roma women when compared with women of the general population, which could be explained in terms of expectations of traditional gender roles.20
Some 12 % of the Roma respondents indicate ‘retired’ as their main activity, with no considerable difference between men and women. This value is compara-tively low and reflects that, compared with the gen-eral population, Roma are on average younger. This could be explained by higher birth rates and lower life expectancy of Roma in most of the countries sur-veyed.21 The share of ‘retired’ Roma is lowest at 2 % in Croatia and Greece.
20 FRA (2014).21 Fundación Secretariado Gitano (ed.) (2009).
UN Sustainable Development Goals and TargetsGoal 8: Promote inclusive and sustainable economic growth, employment and decent work for all.
Target 5. By 2030, achieve full and productive employ-ment and decent work for all women and men, including for young people and persons with disabilities, and equal pay for work of equal value.
Target 6. By 2020, substantially reduce the proportion of youth not in employment, education or training.
Target 8. Protect labour rights and promote safe and secure working environments for all workers, including migrant workers, in particular women migrants, and those in precarious employment.

Second European Union Minorities and Discrimination Survey | Roma – Selected findings
18
Table 1: Self-declared current main activity status in nine EU Member States, all persons in Roma households aged 16 years or over (%) a,b
EU Member State Employed Unemployed
Not working due to illness or disability
Domestic work Retired
Other inactive (education, military
service, other)
BG
Women 16 59 (1) 6 16 3
Men 29 52 (1) (0) 13 5
Total 23 55 1 3 14 4
CZ
Women 21 30 5 18 18 8
Men 37 35 3 (1) 16 8
Total 29 32 4 9 17 8
EL
Women 20 26 2 48 (1) (2)
Men 67 25 4 (0) (2) (2)
Total 43 26 3 25 2 2
ES
Women 12 51 3 24 6 4
Men 21 63 5 (0) 6 5
Total 16 57 4 12 6 5
HR
Women 5 51 4 34 (1) 6
Men 11 74 3 (0) (2) 8
Total 8 62 4 17 2 7
HU
Women 26 22 8 14 13 17
Men 45 24 5 (0) 16 9
Total 36 23 6 7 14 13
PT
Women 23 12 (1) 46 9 9
Men 44 22 (1) (1) 15 18
Total 34 17 (1) 24 12 13
RO
Women 13 4 2 59 10 11
Men 42 6 4 22 13 13
Total 28 5 3 40 12 12
SK
Women 14 46 4 15 13 8
Men 26 50 4 (1) 11 8
Total 20 48 4 8 12 8
Total (9 MS)
Women 16 32 3 28 12 8
Men 34 35 4 6 12 9
Total 25 34 4 17 12 8
Notes: a Out of all persons aged 16 years or over in Roma households (n=22,097); weighted results. b Results based on a small number of responses are statistically less reliable. Thus, results based on 20 to
49 unweighted observations in a group total or based on cells with fewer than 20 unweighted observations are noted in parentheses. Results based on fewer than 20 unweighted observations in a group total are not published.
Source: FRA, EU-MIDIS II 2016, Roma
What do the results show?
19
2�2�2� Paid work
The term ‘paid work’ refers to persons who declared their main activity as being ‘employed’ or ‘self-employed’ at the time of the survey,22 including those who did some work in the previous four weeks to earn some money.23 This is a rough approximation of the employment rate def-inition used by Eurostat to measure Europe 2020 targets.24
22 Unpaid helpers in family businesses were excluded from this definition.
23 The 2011 Roma survey did not ask about ‘any paid work in the last 4 weeks’, so direct comparisons with the 2016 results are not possible.
24 The calculated paid work rate is not exactly comparable to the ILO concept-based Eurostat employment rate, which defines as employed persons 15 years or older who have worked for at least one hour for pay or profit or family gain during the reference week or persons who were not at work during the reference week but had a job or business from which they were temporarily absent. The paid work rate as calculated in the Roma survey is based on the household register and respondent questionnaire on self-declared current main activity. If the main activity was indicated as ‘inactive’ or ‘unpaid’, it was asked if the person “did any work in the last four weeks to earn some money”. This question intended to also capture informal work and small jobs that may contribute to a family’s survival, and that may be particularly relevant to some Roma households. Compared with the ILO concept, unpaid help and parental leave are not explicitly included in the definition of ‘paid work’ rate.
The question on ‘any paid work done in the last four weeks’ on average adds 18 percentage points to the self-declared employment rate. Overall, the paid work rate for Roma in the nine EU Member States surveyed is therefore 43 % (Figure 5). This is well below the average EU-28 employment rate, which was 70 % in 2015. The proportion of paid work is high-est in Greece (52 %), and lowest in Croatia (21 %).
Figure 5: Paid work rate for Roma women and men a aged 20-64 years, including self-employment and occasional work or work in the past four weeks, compared with the Europe 2020 employment rate 2015 (Eurostat), b by EU Member State (%)
Notes: a Out of all persons aged 20-64 years in Roma households (n=17,806); weighted results. b Europe 2020 employment rate 2015: Eurostat t2020_10 (download 13/09/2016).This is calculated by dividing the
number of persons aged 20 to 64 in employment by the total population of the same age group. The indicator is based on the ILO concept, Labour Force Survey.
Source: FRA, EU-MIDIS II 2016, Roma
0
10
20
30
40
50
60
70
80
90
100
BG CZ EL ES HR HU PT RO SK Total(9 MS)
Roma women Roma men Roma - country total General population employment rate(Eurostat 2015)
67
3532
22
1612
36
21
2732
29
64
55
82
31
24
31
21
49
38
46 43 43
5654
62
55
64
5249
43
75
62 61
69 69 66 68
55

Second European Union Minorities and Discrimination Survey | Roma – Selected findings
20
Table 2: Paid work rate for Roma aged 20-64 years, including self-employment, occasional work and work in the previous four weeks, by age group and country (%) a,b,c
EU Member State 20-24 years 25-54 years 55-64 years Total 20-64 years
BG 45 55 31 49
CZ 34 50 22 43
EL 45 55 48 52
ES 24 25 16 24
HR 22 22 (19) 21
HU 47 56 22 49
PT 28 37 49 38
RO 43 52 22 46
SK 35 48 23 43
Total 38 48 24 43
Notes: a Out of all persons aged 20-64 years in Roma households (n=17,806); weighted results. b Based on the household questionnaire and respondent questionnaire on self-declared current main activity. If main
activity is indicated as ‘inactive’, the survey asked if the person “did any work in the last four weeks to earn some money”. Persons providing unpaid help in family businesses are excluded.
c Results based on a small number of responses are statistically less reliable. Thus, results based on 20 to 49 unweighted observations in a group total or based on cells with fewer than 20 unweighted observations are noted in parentheses. Results based on fewer than 20 unweighted observations in a group total are not published.
Source: FRA, EU-MIDIS II 2016, Roma
In all countries, a substantial gender gap was observed, with the biggest differences in Greece (22 % of Roma women in paid work compared with 82 % of Roma men), followed by Romania (27 % versus 64 %). The smallest gender gap was observed in Spain, where 16 % of Roma women and 31 % of Roma men were in paid work in the previous four weeks.
The share of Roma in paid work is closest to that of the general population rate in Greece, and the rate for Roma men even exceeds it. On the one hand, this can be partly explained by the high proportion of Roma declaring them-selves as ‘self-employed’ and having occasional work, which was also observed in the 2011 Roma survey. On the other hand, the combination of high in-paid-work rate and high poverty rate (96 % in the case of Roma in Greece) points to many Roma ‘working poor’ or working primarily in low-paid occupations. In all other countries,
the in-paid-work rate for Roma is below that of the gen-eral population, for both Roma men and Roma women.
The rate of persons in paid work differs substantially by age (Table 2), with similar patterns in all countries sur-veyed. In total, 48 % of the 25-to-54-year-olds and 38 % of the 20-to-24-year-olds are in paid work. However, the situation of older people is substantially worse: on aver-age, only 24 % of Roma aged between 55 and 64 years are in paid work, compared with, on average, 53 % of the same age group in the EU-28. Only in Portugal (49 %) and Greece (48 %) are the paid work rates for Roma older than 55 close to employment rates in the general population, but for all groups the rates are far below the Europe 2020 target of 75 % in employment. The situation of young Roma – aged 16 to 24 years – is similarly dire: on average, only 27 % are in paid work, compared with an average of 33 % of young people in the same age group in the EU-28.

What do the results show?
21
2�2�3� Young people neither in employment nor in education or training
Eurostat annually publishes figures on people 15 to 24 years old who are ‘neither in employment, nor in educa-tion or training’ (NEET). This is an important indicator for the share of young people whose highest completed educational level is a lower secondary education and who are neither in employment nor in education or training.
A similar indicator computed for Roma aged 16 to 24 years based on EU-MIDIS II shows that the proportion of young Roma not in work or education or further training as their main activity is, on average, 63 %. Using it as a crude approximation of the Eurostat NEET rate, the comparison with 12 % of the general population of the same age group in the EU-28 illustrates the magnitude of the gap.25 This
25 Comparability between EU-MIDIS II and Eurostat NEET rate is restricted due to a different definition and age bands. Taking 15-year-olds into account would show values lower by a few percentage points for those who are not in employment, training or education. The Eurostat NEET rate is based on the ILO concept, which refers to having worked at least one hour in the past week, whereas EU-MIDIS II asked about self-declared main activity.
is particularly big between young Roma and the general population in the Czech Republic, where the share of Roma not in work or education or further training is six times higher than that of the general population (Figure 6).
The results also show a substantial gender gap. On average, in the nine countries surveyed, 72 % of Roma women aged 16 to 24 years are neither in work nor in education, compared with 55 % of young Roma men. The gender gap is highest in Greece, Portu-gal and Hungary. In Greece, 81 % of Roma women aged 16-24 are neither in work nor in education or training, compared with 38 % of young Roma men. This share amounts to 67 % in Portugal and 63 % in Hungary among young Roma women and 36 % and 38 %, respectively, among Roma men of the same age group.
Figure 6: Young Roma aged 16-24 years neither in work nor in education or training as their main activity, by EU Member State (%) a,b,c
Notes: a Out of all persons aged 16-24 years in Roma households (n=4,189); weighted results. b Based on the household questionnaire and respondent questionnaire on self-declared current main activity. c Restricted comparability with the Eurostat NEET rate 2015: edat_lfse_20 (download 13/10/2016). Percentage of the
population 15-24 years that is not employed and not involved in further education or training, based on the ILO concept.Source: FRA, EU-MIDIS II 2016, Roma; Eurostat, NEET rate 2015, General population
Roma women Roma men Roma - country total
79
52
81 81 82
63
67
77
70 72
52 51
38
74 72
38 36
52
61 55
65
51
60
77 77
51 52
64 65
63
19
8
17 16 19
12 11
18 14
0
10
20
30
40
50
60
70
80
90
100
BG CZ EL ES HR HU PT RO SK Total(9 MS)
Eurostat NEET rate 2015

Second European Union Minorities and Discrimination Survey | Roma – Selected findings
22
2�2�4� Low work intensity of households
One component of the social inclusion headline indicator ‘people at risk of poverty or social exclusion’ set out in the Europe 2020 strategy is ‘people living in households with very low work intensity’.
Work intensity is the ratio between the number of house-hold members of working age – 18 to 59 years, exclud-ing persons aged 18 to 24 years in education – who are currently working and the total number of persons of work-ing age in the household. Work intensity is defined as ‘low’ when it is below 20 % of the household’s total potential.26
26 There is restricted comparability with the work intensity as defined by Eurostat, which is the ratio between the number of months that household members of working age (person aged 18–59 years, excluding dependent children and young persons aged 18-24) worked during the income reference year and the total number of months that the same household members could theoretically have worked. For persons who declared that they worked part-time, the number of months worked in full-time equivalent roles is estimated on the basis of the number of hours usually worked at the time of the interview. The definition used for EU-MIDIS II only provides information on the current situation and does not take into account full time/part time; therefore, it might underestimate low work intensity.
The results, despite the restricted comparability, show a large gap between Roma and the general popula-tion in all survey countries except Greece (Figure 7). On average, 44 % of Roma live in low-work-intensity households, calculated as a rough approximation of the Eurostat 2014 indicator. In comparison, 11 % of EU-28 residents live in households with low work intensity, according to this indicator. The smallest difference from the general population can be observed in Greece (18 % versus 17 %), which can be explained by the high per-centage of self-employed Roma. In contrast, the big-gest gap is observed in Croatia (78 % versus 15 %) and Slovakia (53 % versus 15 %).
Figure 7: Roma aged 0-59 years living in households with a current low work intensity, by EU Member State (%) a, b, c
Notes: a Out of all persons aged 0-59 years in Roma households (n=33,785); weighted results. b People living in households with very low work intensity are defined as people of all ages (0-59) living in
households where the household members of working age (18-59) worked less than 20 % of their total potential, based on the current activity status.
c Eurostat Low work intensity rate 2014: ilc_lvhl11 (download 13/09/2016). People living in households with very low work intensity are defined as people of all ages (0-59) living in households where the members of working age (18-59) worked less than 20 % of their total potential during the previous 12 months.
Source: FRA, EU-MIDIS II 2016, Roma; Eurostat, EU-SILC 2014, General population
52
34
18
59
78
27
38 39
53
44
12 8
17 17 15 13 12 6 7
0
10
20
30
40
50
60
70
80
90
100
BG CZ EL ES HR HU PT RO SK Total(9 MS)
Roma living in households withvery low current workintensity
General population living in households with very lowwork intensity in the last 12 months (EU-SILC 2014)

What do the results show?
23
2�3 EducationThe right to education is protected under Article 28 of the UN Convention on the Rights of the Child – ratified by all EU Member States – and Article 14 of the EU Charter of Fundamental Rights. EU Member States are obliged to ensure that all children enjoy equal access to edu-cation, particularly compulsory education. According to UNESCO, individuals who do not complete at least compulsory education face a high risk of living in pov-erty and have limited opportunities to develop learning skills and reach their full potential.27
The 2013 Council Recommendation identifies access to education as a key thematic area. It recommends that EU Member States take effective measures to ensure equal treatment and full access to quality and main-stream education for Roma boys and girls, and to ensure
27 UNESCO (2010), p. 155.
that all Roma pupils complete at least compulsory edu-cation. The indicators presented in this section reflect the key measures suggested by the recommendation.
2�3�1� Participation in education
Early childhood education
Early childhood education and development is an important determinant of future life opportunities. Providing Roma children with an equal start in life compared with their non-Roma peers is essential to break the cycle of intergenerational transmission of poverty.28 The EU’s strategic framework for cooperation in education and training – Education and Training 2020 (ET 2020) – recognises the potential of early childhood education and care in addressing social inclusion and economic challenges. It has set a benchmark to ensure that at least 95 % of children aged between four and the
28 World Bank (2012).
Figure 8: Children aged between 4 years and the (country-specific) starting age of compulsory education who participate in early childhood education, by EU Member State (%) a,b,c,d
Notes: a Out of all persons aged between 4 years and the country-specific starting age of compulsory primary education in Roma households (n=1,776); weighted results.
b Survey question filled in by respondent for all children if they regularly attend public or private childcare (including nursery, preschool, etc.)
c Different age groups for participation in early childhood education in countries: 4-6 years in Bulgaria and Croatia; 4-5 years in remaining countries.30 Age is calculated on annual basis, hence the figures do not consider earlier or delayed start in primary education of an individual child.
d Eurostat: Education and Training 2020 target –educ_uoe_enra10 (downloaded 20/10/2016) using data from education facilities’ registers.
Source: FRA, EU-MIDIS II 2016, Roma; Eurostat 2014, General population
0
10
20
30
40
50
60
70
80
90
100
BG CZ EL ES HR HU PT RO SK Total(9 MS)
Roma girls Roma boys Roma - country total General population (Eurostat 2014)
ET 2020 target = 95%
69
35 27
93
37
90
(31)41
34
53 64
32 29
98
26
92
51
36 34
52
66
34
28
95
32
91
42 38
34
53
89 86 84
97
72
95 94
86
77

Second European Union Minorities and Discrimination Survey | Roma – Selected findings
24
starting age of compulsory primary education participate in early childhood education.29
The EU-MIDIS II results show that, of the nine countries surveyed, only Spain (95 %) and Hungary (91 %) have participation rates that come close to the ET 2020 tar-get (Figure 8). Elsewhere, with the exception of Bulgaria (66 %), less than half of the children between the age of four and the compulsory education starting age partici-pate in early childhood education.
Compared to the 2011 Roma survey, the EU-MIDIS II results suggest an increase in participation rates in all countries, except Portugal and Romania. However, these rates fall short of the EU benchmark for 2020 on early childhood education, and are far below the general population rates.
Compulsory-age education
All children who fall under the age defined as “compulsory-schooling age” are obliged by law to attend school. In
29 Eurostat (2016). 30 European Commission/EACEA/Eurydice (2015).
three out of the nine countries, almost all Roma children who should be in education (pre-primary, primary, lower secondary or upper secondary) attend school – 99 % in Spain, 98 % in the Czech Republic, and 98 % in Hungary (Figure 9). In Romania and Greece, the share of Roma children of compulsory-school age who attend school is 77 % and 69 %, respectively. Compared with the 2011 Roma survey, EU-MIDIS II finds slightly higher enrolment rates in compulsory schooling in most countries – with the exception of Romania and Slovakia, where there are no substantial changes. Croatia was not included in the 2011 Roma survey; the EU-MIDIS II data show that participation rates in compulsory school (94 %) are above average compared with the other survey countries.
However, the participation rates outlined in Figure 9 do not reveal the complete picture. Apart from ‘participating’ in compulsory education, it is important that children attend school at the level corresponding to their age. Table 3 suggests that this is not always the case in all countries surveyed.
Figure 9: Compulsory-school-age children (country-specific) participating in education, by EU Member State (%) a,b
Notes: a Out of all persons of a country-specific compulsory schooling age in Roma households (n=7,364); weighted results.
b Different age groups for compulsory-schooling age in countries valid for school year 2015/2016: starting age in years – 7 (BG), 6 (CZ, ES, HR, PT, RO, SK) and 5 (EL, HU); ending age – 17 (PT), 16 (RO), 15 (BG, ES, HU, SK) and 14 (CZ, EL, HR) (Source: European Commission/EACEA/Eurydice (2015)). Age is calculated on annual basis, hence the figures do not consider earlier or delayed start in primary education of an individual child.
Source: FRA, EU-MIDIS II 2016, Roma
Roma girls Roma boys Roma - country total
91 99
66
99 94 98 90
8395 91 92 98
72
98 93 99 90
74
93 89
91 98
69
99 94 98 90
78
94 90
0
10
20
30
40
50
60
70
80
90
100
BG CZ EL ES HR HU PT RO SK Total(9 MS)
What do the results show?
25
Table 3: Enrolment rates of Roma in respective educational level, compared with the general population, by age group and EU Member State (%) a,b
Country Agec
Education level
(ISCED 2011) g
Roma General populationf
Net enrolment rated
Total enrol-ment ratee
Not attending any educational level
Net enrolment rate
Total enrol-ment rate
BG7-14 ISCED1+2 89 93 7 88 9515-18 ISCED3 40 57 43 83 8719-24 ISCED4+ - - 97 37 41
CZ7-14 ISCED1+2 89 98 (2) 86 9315-18 ISCED3 45 67 33 81 9619-24 ISCED4+ - - 93 35 47
EL7-14 ISCED1+2 69 73 27 95 9515-17 ISCED3 (9) 21 79 88 9418-24 ISCED4+ - - 97 36 43
ES7-14 ISCED1+2 89 99 (1) 95 9515-17 ISCED3 20 44 56 78 9418-24 ISCED4+ - 6 94 34 51
HR7-14 ISCED1+2 95 97 (3) 89 9215-18 ISCED3 35 47 53 86 9018-24 ISCED4+ - - 94 40 51
HU7-14 ISCED1+2 86 99 (1) 77 8814-18 ISCED3 28 59 41 72 9318-24 ISCED4+ - 7 93 35 55
PT7-14 ISCED1+2 88 97 (3) 94 9515-17 ISCED3 (20) 74 26 74 10018-24 ISCED4+ - - 96 28 45
RO7-14 ISCED1+2 77 85 15 85 8915-18 ISCED3 22 34 66 80 8719-24 ISCED4+ - - 97 32 36
SK7-14 ISCED1+2 90 94 6 83 8815-18 ISCED3 33 58 42 74 9118-24 ISCED4+ - 6 94 33 50
Total (9 MS)ISCED1+2 86 93 7 90 93ISCED3 30 52 48 79 92ISCED4+ 2 5 95 34 47
Notes: a For Roma: out of all persons in Roma households of the country-specific age (6 to maximum 24 years) for a given educational level ISCED 2011 countries valid for school year 2015-201631 (primary education: n=6,195; secondary education: n=2,865; post-secondary education: n=3,651).
For general population: own calculation based on Eurostat: absolute number of children at the age for the respective educational level enrolled in that educational level [educ_uoe_enrp05, educ_uoe_enrs02, educ_uoe_enrs05, educ_uoe_enrs08, educ_uoe_enrt02] and absolute number of children at the age for the respective educational level [demo_pjan], all downloaded 19/10/2016.
b Results based on a small number of responses are statistically less reliable. Thus, results based on 20 to 49 unweighted observations in a group total or based on cells with fewer than 20 unweighted observations are noted in parentheses. Results based on fewer than 20 unweighted observations in a group total are not published.
c EU-MIDIS II did not ask about dates of birth, but recorded the ages on the day of interview. d Net enrolment rate: share of children of the respective age attending education level that corresponds to their age out of
the total number of children of that age. Net enrolment rates for post-secondary and tertiary education for Roma in all countries are based on fewer than 20 observations. Therefore, only total value for all countries is presented, which is still based on low number of observations.
e Total enrolment rate: share of children of the respective age attending any educational level out of the total number of children of that age.
f Own calculation based on Eurostat 2014. g Education levels based on UNESCO’s 2011 International Standard Classification of Education (ISCED), developed to facilitate
comparisons of education statistics and indicators across countries based on uniform, internationally agreed definitions.Source: FRA, EU-MIDIS II 2016, Roma; Eurostat 2014, General population
31 European Commission/EACEA/Eurydice (2015).

Second European Union Minorities and Discrimination Survey | Roma – Selected findings
26
As for children who are attending school at a level other than the one they should be at given their age – what level of education do they attend? Data visualised in Figure 10 suggest that half of the Roma between 6 and 24 years of age do not attend school. Of those who do, only 1 % attend school at a higher level than
the one corresponding to their age; 18 % attend at an educational level lower than the one corresponding to their age, either because they repeated classes, started school later, or both. This share is highest (20 %) among Roma of the age for upper secondary education.
Figure 10: Roma aged 6-24 years by educational level they attend (%) a
Notes: a Out of all persons in Roma households of the country-specific age (6 to maximum 24 years) for a given educational level (primary education: n=6,195; secondary education: n=2,865; post-secondary education: n=3,651); weighted results.
Source: FRA, EU-MIDIS II 2016, Roma
7
20
3
9
18
86
30
2
41
81
2
1
1
7
48
95
50
Children of the agefor primary and
lower secondaryeducation
(ISCED 1+2)
Children of the agefor upper secondaryeducation (ISCED 3)
Young persons ofthe age for
post-secondary andtertiary education
(ISCED 4+)
Roma aged6-24 years
Roma aged6-24 years
attending education
Attending educational level lower than the one corresponding to the age of the child
Attending educational level corresponding to the age of the child
Attending educational level higher than the one corresponding to the age of the child
Not attending education
Early leavers from education and training
Early school leavers are those “aged 18-24 with at most lower secondary education and not in further education or training”.32 The headline target of the Europe 2020 Strategy is to reduce the share of early leavers of educa-tion and training to less than 10 %. The survey results suggest that this target might be unachievable by 2020 for Roma in all the countries surveyed (Figure 11).
32 See the European Commission's webpage on the topic.

What do the results show?
27
2�3�2� Segregation in education
The 2013 Council Recommendation requires the elimination of school segregation. Official statistics on school segregation do not exist. Therefore, EU-MIDIS II asked respondents to estimate the proportion of Roma among the classmates or schoolmates of children in their households, allowing the calculation of proxy indicators for assessing levels of segregation in educational settings. The results show that the proportion of Roma children attending schools in which all schoolmates are Roma ranges from 27 % in Bulgaria to 3 % in Spain (Figure 12). The share of children attending such schools is below 10 % in the Czech Republic (5 %), Croatia, Hungary and Romania (8 % each). In Slovakia (62 %), Hungary (61 %) and Bulgaria (60 %), the majority of Roma children attend schools in which all or most of their schoolmates are Roma. It should be noted that
the ethnic composition of schools (overrepresentation of children from one particular ethnic group) can reflect the demography of the locality in which the school is located.
Segregation in classes is similar to school segregation. The proportion of Roma children attending classes where ‘all classmates are Roma’ ranges from 29 % in Bulgaria to 4 % in Spain. If classes in which ‘most’ class-mates are Roma are considered as segregated, the share of children attending education in segregated classes ranges from 63 % in Slovakia to 19 % in Portugal.33
33 Comparison with the 2011 Roma survey is limited, as the 2011 survey response categories were: ‘all are Roma’, ‘many are Roma’, ‘some are Roma’, ‘none are Roma’ or ‘mixed’. The category ‘mixed’ was difficult to interpret and was therefore dropped in the 2016 survey.
Figure 11: Early leavers from education and training, d aged 18-24 years, by EU Member State (%) a,b,c
Notes: a Out of all persons aged 18-24 years in Roma households (n=4,152); weighted results. b Based on household questionnaire. The same definition used as for the general population, with the exception
for the participation in non-formal education or training. This was not asked for in EU-MIDIS II, but is considered by Eurostat for the general population.
c Eurostat rate 2015: edat_lfse_14 (download 12/09/2016). Percentage of the population aged 18 to 24 years having attained at most lower secondary education and not being involved in further education or training.
d Early leavers from education and training denotes the percentage of the population aged 18-24 years having attained at most lower secondary education (ISCED 2011 levels 0, 1 or 2) and not being involved in further education or training. There are some deviations from the Eurostat definition. Eurostat includes persons who are not in education and training (neither formal nor non-formal) in the four weeks preceding the LFS survey. EU-MIDIS II asks for “currently attending school or vocational training” and not asking explicitly for non-formal education.
Source: FRA, EU-MIDIS II 2016, Roma; Eurostat, Labour Force Survey (LFS) 2015, General population
Roma women Roma men Roma - country total
77
55
94
69 78
67
91
79
61 71
57 59
90
7160
68
89
76
54
66
67
57
92
70 68 68
90
77
58
68
13
6 8
20
3
12 14 19
7
0
10
20
30
40
50
60
70
80
90
100
BG CZ EL ES HR HU PT RO SK Total(9 MS)
General population (LFS 2015)
Europe 2020target

Second European Union Minorities and Discrimination Survey | Roma – Selected findings
28
Channelling Roma children to special-needs schools is a specific form of educational segregation. As explained in the questionnaire, a ‘special school’ is a school for children with special educational needs. It can refer to a school that provides education to children with learn-ing, physical or developmental disabilities or with behav-ioural issues. The 2013 Council Recommendation requires ending inappropriate placements of Roma pupils in such schools. This practice is particularly widespread in the Czech Republic and Slovakia: 16 % and 18 %, respec-tively, of Roma children aged 6-15 who are in education attended special schools in 2016. These two countries already had the highest share of children attending ‘special schools’ in 2011. The 2011 Roma survey asked whether a child had ever been to a special school or class that was mainly for Roma, even if only for a short period; EU-MIDIS II asked about current attendance of special schools. Although not directly comparable, the data for 2016 clearly indicate insufficient progress.34
34 This question was only asked in Bulgaria, Croatia, the Czech Republic, Greece, Hungary, Romania and Slovakia.
2�3�3� Educational attainment
No formal education completed
EU-MIDIS II results indicate persisting low levels of edu-cational achievement among the Roma population. The highest proportion of Roma without any formal educa-tion in all three age groups is found in Greece (Figure 13). High proportions can also be seen in Portugal, Spain and Croatia, while the survey found low proportions in the Czech Republic, Slovakia and Bulgaria.
Figure 12: School segregation – concentration of Roma children aged 6-15 years in school, by EU Member State (%) a,b,c
Notes: a Out of all persons aged 6-15 years in Roma households who are in education (n=6,518); weighted results. b Survey question filled in by respondents for all children aged 6-15 years in education: “Now please think about
the school [NAME] attends. How many of the schoolmates would you say are Roma: all of them, most of them, some or none of them?”
c Results based on a small number of responses are statistically less reliable. Thus, results based on 20 to 49 unweighted observations in a group total or based on cells with fewer than 20 unweighted observations are noted in parentheses. Results based on fewer than 20 unweighted observations in a group total are not published.
Source: FRA, EU-MIDIS II 2016, Roma
13
22
8
11
8
8
3
12
5
27
33
40
21
(3)
53
32
28
36
25
33
53
38
71
84
38
56
62
51
66
38
2
(0)
(0)
(1)
(0)
4
7
(1)
4
(3)
0 10 20 30 40 50 60 70 80 90 100
Total(9 MS)
SK
RO
PT
HU
HR
ES
EL
CZ
BG
All of them are Roma Most of them are Roma Some of them are Roma None of them is Roma

What do the results show?
29
2�4� HealthIn March 2014, the third multi-annual programme of EU action in the field of health – ‘Health for Growth’35 – was adopted for the period 2014-2020, linking health and economic prosperity, as health influences economic outcomes. The 2013 Council Recommendation calls for effective measures to ensure equal access to univer-sally available healthcare services for Roma.
2�4�1 Health insurance coverage and unmet medical care needs
Availability of health insurance is a major determinant of access to healthcare systems and is explicitly listed in the 2013 Council Recommendation. Insurance cover-age is also included in the set of European Core Health Indicators (indicator 76).36 EU-MIDIS II asked respond-ents whether the respective national basic insurance
35 For more information, see the Commission’s webpage on the programme.
36 See the European Commission’s webpage on the indicators.
scheme currently covered their health care expenses and whether they had any additional health insurance.
The results show that 95 % to 98 % of Roma in Spain, Portugal and Slovakia are covered either by the national basic health insurance scheme or additional insurance (Figure 14). In contrast, only 45 % of Roma in Bulgaria and 54 % of Roma in Romania indicated that this is the case.
By comparison, according to the Organisation for Economic Cooperation and Development (OECD),37 health insurance coverage for the general population ranges from 94 % to 100 % in the Czech Republic, Hungary, Portugal, Slovakia and Spain; in Greece, 86 % of the general population is covered by public or private health insurance.38
37 Eurostat does not provide data on health insurance coverage in the EU.
38 See the OECD’s wepage on health status statistics.
Figure 13: Roma who have not completed any level of formal education (ISCED 0), by age group and EU Member State (%) a,b,c,d
Notes: a Out of all persons aged 16+ in Roma households (n=21,896); weighted results. b Survey question filled in by respondents for all 16-year-olds: “What is the highest level of education [NAME] has
completed?”. c ISCED 2011 classification used. d Results based on a small number of responses are statistically less reliable. Thus, results based on 20 to 49
unweighted observations in a group total or based on cells with fewer than 20 unweighted observations are noted in parentheses. Results based on fewer than 20 unweighted observations in a group total are not published.
Source: FRA, EU-MIDIS II 2016, Roma
5 (2)
42
3 5 8
(2)6
4 6 10
3
56
19
28
10
17
12
5 11 11 9
82
57
46
25
69
20
8
23
0
10
20
30
40
50
60
70
80
90
100
BG CZ EL ES HR HU PT RO SK Total(9 MS)
16-24 25-44 45+

Second European Union Minorities and Discrimination Survey | Roma – Selected findings
30
Differences in the share of Roma covered by health insurance between the 2011 Roma survey and the pre-sent survey are relatively small. Bulgaria and Romania continue to show the lowest insurance coverage rates.39
The survey also asked respondents if they needed a medical examination or treatment during the past 12 months; if so, whether they had that examina-tion/treatment; and, in case they did not, why. Over-all, depending on the country, between 1 % and 7 % of respondents indicated that it was not possible for them to get the necessary care or treatment. The results for the Czech Republic, Hungary, Portugal and Spain – where the lowest rates of unmet medical care needs were recorded – are less reliable due to the small number of observations.
2�4�2� Long-term activity limitations
EU-MIDIS II asked respondents if they had been limited (severely or not severely) in their usual activities because of a long-term health problem. This corresponds to indicator 35 (‘Long-term activity limitations’) of the European Core Health Indicators. The reported “activity limitation rate” suggests that in Croatia, the Czech Republic and Slovakia, about one in three Roma (33 %, 35 % and 34 %, respectively)
39 The 2011 Roma survey asked: “Do you have any form of medical insurance in [country of survey]?”
indicate that their everyday activities have been limited in some way – either severely or to some degree – by health problems. In Bulgaria, Hungary, Romania and Spain, the percentage of Roma indicating long-term activity limitations varies between 22 % and 29 %, while the activity limitation rates for Roma in Greece is 13 % and in Portugal, 16 %.
In four countries – Bulgaria, the Czech Republic, Croatia and Slovakia – the share of Roma facing long-term activ-ity limitations is higher than the share of the general population experiencing similar problems. In Romania, this is the case with Roma men, and in Spain, for Roma women (Figure 15). Also, among Roma in six of the nine countries surveyed, women are more likely than men to say that they have been severely or somewhat lim-ited in their everyday activities due to a health prob-lem – a pattern that can also be seen in the general population. The biggest difference between women and men’s experiences is in Spain, where 17 % of Roma men say that they have been limited in their daily activi-ties, while almost one in three women (30 %) feel that health problems have limited their activities in some way. On the other hand, in the Czech Republic, Greece and Hungary, there is little or no difference between Roma women and men.
Figure 14: Roma, aged 16 years or over, who indicate that they are covered by national basic health insurance and/or additional insurance, by EU Member State (%) a,b
Notes: a Out of all Roma respondents (n=7,826), excluding those who declined to answer; weighted results. b Survey question: “Does the [NATIONAL BASIC HEALTH INSURANCE SCHEME] currently cover your health care
expenses? Do you have any additional health insurance?”Source: FRA, EU-MIDIS II 2016, Roma
45
79
79
98
82
86
96
54
95
74
0 20 40 60 80 100
BG
CZ
EL
ES
HR
HU
PT
RO
SK
Total (9 MS)

What do the results show?
31
2�5� HousingAccess to housing is a fundamental human right. The ICESCR guarantees the right to adequate housing. The Racial Equality Directive (2000/43/EC) provides protec-tion and guarantees for equal treatment in access to and supply of goods and services, including housing. Access to secure housing with basic infrastructure is a core aspect of social inclusion. The European Platform
against Poverty and Social Exclusion notes that “housing exclusion represents one of the most extreme forms of poverty and deprivation, which…risks depriving house-holds not only from heating or cooling but also from hot water, lights and other essential domestic necessities”.40 The provision of affordable, adequate and social
40 European Commission (2010), p. 5.
Figure 15: Long-term activity limitations of women and men, Roma and general population, by EU Member State (%) a,b,c
Notes: n.a. Not applicable. a EU-MIDIS II results are based on all respondents (n=7,909), excluding those who declined to answer; weighted
results. The same definition used as for the general population. b Eurostat rate 2014: [hlth_silc_06], downloaded 20 October 2016. In the Eurostat database, the result for activity
limitations of men in the Czech Republic has been flagged as having low reliability. c Includes respondents who say that, for the past six months, their everyday activities have been ‘severely
limited’ or ‘limited but not severely’ due to a health problem.Source: FRA, EU-MIDIS II 2016, Roma; Eurostat, EU-SILC 2014, General population
25
19
35
35
13
13
30
17
35
31
23
24
18
14
30
28
37
31
30
26
19.7
16.4
25.1
21.8
26.4
21.8
26.4
21
31.6
26.4
29.3
22.7
40.2
29.6
29.6
20.7
31.3
28.4
0 20 40 60 80 100
Female
Male
Female
Male
Female
Male
Female
Male
Female
Male
Female
Male
Female
Male
Female
Male
Female
Male
Female
Male
BG
CZ
EL
ES
HR
HU
PT
RO
SK
Tota
l(9
MS) n.a.
n.a.
Roma 2016
General population(EU-SILC 2014)

Second European Union Minorities and Discrimination Survey | Roma – Selected findings
32
housing is primarily within the responsibility of national and regional policies. The 2013 Council Recommenda-tion calls on Member States to develop more effective measures to eliminate spatial segregation, promote non-discriminatory access to social housing, and ensure access to public utilities and infrastructure for housing in compliance with national legal requirements.41 UN Sus-tainable Development Goals 6 and 11 also prominently reflect housing issues, and some of their targets are particularly relevant for Roma.42
41 See 2013 Council Recommendation, p. 4. 42 See SDG-6 and SDG-11.
2�5�1� Availability of space
The availability of sufficient personal space at home is a key indicator of housing quality. Eurostat meas-ures housing quality and looks particularly at the over-crowding rate, which measures the space available to the household, taking into account the household’s size and its members’ ages and family situation.43 The EU-SILC also measures the average number of rooms per person by tenure status and dwelling type. This indicator can be compared against EU-MIDIS II findings on Roma households. Results suggest that insufficient space remains a problem in Roma households, which contributes to severe housing deprivation. The results show considerable differences between Roma and the general population (Figure 16).
Compared with the 2011 Roma survey, all countries have improved on the ‘availability of space’ indicator. The biggest improvements can be observed in Romania, Portugal and Spain.
43 For an explanation of Eurostat housing statistics, see the Commission’s website.
UN Sustainable Development Goals and TargetsGoal 6: Ensure access to water and sanitation for all.
Target 1. By 2030, achieve universal and equitable access to safe and affordable drinking water for all.
Target 2. By 2030, achieve access to adequate and equita-ble sanitation and hygiene for all and end open defecation, paying special attention to the needs of women and girls and those in vulnerable situations.
Goal 11: Make cities inclusive, safe, resilient and sustainable.
Target 1. By 2030, ensure access for all to adequate, safe and affordable housing and basic services and upgrade slums.
Figure 16: Average number of rooms per person in the household, Roma and general population (mean) a,b , by EU Member State
Notes: a All persons living in Roma households (n=33,648); weighted results. b Based on the mean value of number of rooms per person in the household (without kitchen); for the general
population, based on Eurostat, EU-SILC 2014, [ilc_lvho03, download 08.09.2016].Sources: FRA, EU-MIDIS II 2016, Roma; Eurostat, EU-SILC 2014, General population
0.7 0.7
0.5
0.9
0.5 0.50.6
0.80.7 0.7
1.1
1.4
1.2
1.9
1.1 1.2
1.7
1.0 1.1
0.0
0.2
0.4
0.6
0.8
1.0
1.2
1.4
1.6
1.8
2.0
BG CZ EL ES HR HU PT RO SK Total(9 MS)
Roma 2016 (mean) General population (EU-SILC 2014)

What do the results show?
33
2�5�2� Access to public utilities and basic housing amenities
Housing deprivation is assessed through various indicators of housing deficiencies. These include a lack of basic sanitary facilities, such as a bath, shower and indoor flushing toilet; and the dwelling’s general condition, such as a leaking roof or being too dark, or rot in the walls or window frames.
Access to electricity is a key social inclusion indicator, as it is essential for daily activities, such as cleaning and cooking and for providing light so that children can do their homework. EU-MIDIS II results show a slight improvement compared with the results of the 2011 Roma survey. Nearly all Roma live in households with
electricity supply in Bulgaria, the Czech Republic, Spain and Hungary (97-98 %); in Portugal, 88 % of Roma and in Greece, 89 % of Roma do so. In all nine Member States, the share of the general population with access to electricity is close to 100 %.
The situation is worse with regard to access to clean drinking water through a connection to a water supply system with public access. EU-MIDIS II results show that, with the exception of the Czech Republic and Spain, the share of Roma living in households without tap water inside their dwelling is much higher than for the general population (Figure 17). For Roma, this ranges from 9 % in Greece to 68 % in Romania. Compared to results from the 2011 Roma survey, the situation seems to have improved in Slovakia, Bulgaria, Greece and Romania.
Figure 17: Roma living in households without tap water inside the dwelling, compared with general population, by EU Member State (%) a,b,c
Notes: n.a. Not applicable. a Out of all persons in Roma households (n=33,767); weighted results. b Based on the share of people living in Roma households without tap water inside the dwelling; for the general
population, based on Eurostat, EU-SILC 2013 (latest available), “population connected to public water supply” [end_wat_pop], downloaded 8 September 2016.
c Data for the general population are not available for all countries. A lack of available tap water is considered a rare phenomenon and relevant data are not published regularly in the EU.
Sources: FRA, EU-MIDIS II 2016, Roma; Eurostat, EU-SILC 2013, General population
Roma 2016 General population (EU-SILC 2013)
23
2 9
2
34 33
14
68
27 30
0.7 6.3
38.1
12.6
0102030405060708090
100
BG CZ EL n.a. n.a. n.a. n.a.0.0
ES HR HU PT RO SK Total(9 MS)
While many Roma live in households without tap water inside the dwelling across the 9 EU Member States, an even higher percentage live in households without a toilet and shower or bathroom inside their homes. This rate ranges from 17 % in Portugal to 44 % in Bulgaria and 79 % in Romania. Roma households least deprived of basic sanitation amenities are in the Czech Republic (4 %) and Spain (1 %). According to Eurostat data, in seven of the nine Member States – the Czech
Republic, Greece, Spain, Croatia, Hungary, Portugal and Slovakia – nearly the entire general population lives in households with these amenities. By contrast, in Bulgaria and Romania, approximately 12 % and 31.2% of the general population also lack access to these amenities, respectively (Figure 18). However, the situation for Roma is much worse. Compared to 2011, improvement was observed in Bulgaria, the Czech Republic, Romania and Slovakia.

Second European Union Minorities and Discrimination Survey | Roma – Selected findings
34
Looking at the various housing quality indicators as a whole, a substantial proportion of Roma live in households without access to needed public utilities and basic housing amenities. This puts them at risk of severe housing deprivation. Interestingly, while in Bulgaria and Hungary almost all Roma households have access to an electricity supply, a lower percentage of Roma in these Member States live in households with access to tap water and a toilet or bathroom inside the house.
2�5�3� Housing quality and surrounding environment
More Roma dwellings face major problems with housing quality compared to those of the general population. The share of people reporting their dwelling to have a leaking roof, damp walls, floors or foundation, or rot in the window frames or floor, is highest in Portugal, both for Roma and the general population (Table 4). Availability of light in the dwelling is another important characteristic that influences quality of life. The gap between the Roma and the general population is even more pronounced under this indicator. Roma in Portugal, Slovakia, Hungary and Croatia report the highest share of people with insufficient light in their dwellings.
In all countries, Roma score worse than the general population on both indicators of housing quality.
A considerable number of Roma feel that pollution, grime and other environmental problems – such as smoke, dust and unpleasant smells or polluted water – are a problem, particularly in the Czech Republic and Portugal, where 41 % and 36 %, respectively, indicate this to be an issue. This is the case for nearly one in every three Roma in Slovakia and Croatia, and for more than every fourth in Hungary, Spain, Bulgaria and Greece. Romania is the only country in which the share of Roma living in a polluted environment is lower than that of the general population (Table 5). The picture regarding crime, violence and vandalism in the local area is more diverse. The highest share of Roma affected by such problems live in the Czech Republic and Spain (46 % and 42 %, respectively). By contrast, only 9 % of Roma indicate problems with crime, violence and vandalism in Bulgaria – though 26.8 % of the general population cites problems with these issues.
Figure 18: Roma living in dwellings without a toilet and shower or bathroom inside the dwelling, compared with general population, by EU Member State (%) a,b
Notes: a Out of all persons in Roma households (n=33,764); weighted results. b Based on the share of people “living in households without toilet and shower or bathroom inside the dwelling”.
For general population – [ilc_mdho05, downloaded 08 September 2016].Sources: FRA, EU-MIDIS II 2016, Roma; Eurostat, EU-SILC 2014, General population
Roma 2016 General population (EU-SILC 2014)
44
4
29
1
41 38
17
79
29
38
12.0
0.2 0.5 0.1 1.6 4.0 0.9
31.2
0.60
10
20
30
40
50
60
70
80
90
100
BG CZ EL ES HR HU PT RO SK Total(9 MS)
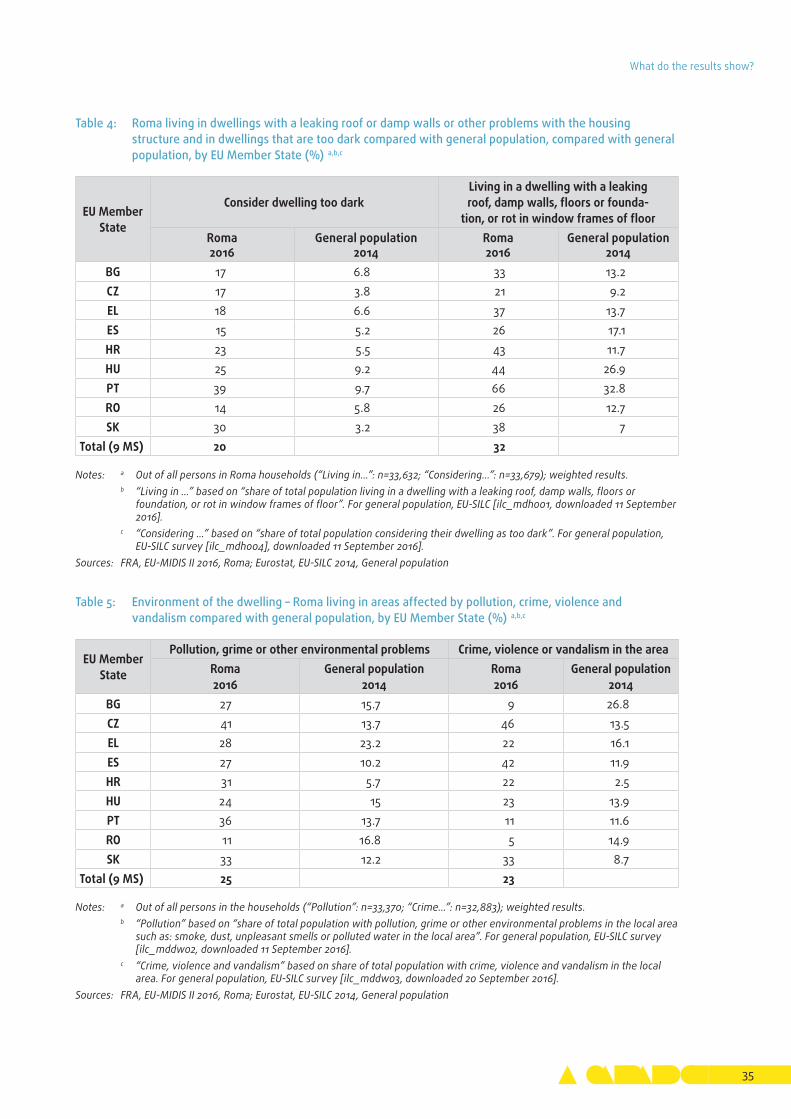
What do the results show?
35
Table 4: Roma living in dwellings with a leaking roof or damp walls or other problems with the housing structure and in dwellings that are too dark compared with general population, compared with general population, by EU Member State (%) a,b,c
EU Member State
Consider dwelling too darkLiving in a dwelling with a leaking roof, damp walls, floors or founda-
tion, or rot in window frames of floor Roma 2016
General population2014
Roma 2016
General population2014
BG 17 6.8 33 13.2CZ 17 3.8 21 9.2EL 18 6.6 37 13.7ES 15 5.2 26 17.1HR 23 5.5 43 11.7HU 25 9.2 44 26.9PT 39 9.7 66 32.8RO 14 5.8 26 12.7SK 30 3.2 38 7
Total (9 MS) 20 32
Notes: a Out of all persons in Roma households (“Living in…”: n=33,632; “Considering…”: n=33,679); weighted results. b “Living in …” based on “share of total population living in a dwelling with a leaking roof, damp walls, floors or
foundation, or rot in window frames of floor”. For general population, EU-SILC [ilc_mdho01, downloaded 11 September 2016].
c “Considering …” based on “share of total population considering their dwelling as too dark”. For general population, EU-SILC survey [ilc_mdho04], downloaded 11 September 2016].
Sources: FRA, EU-MIDIS II 2016, Roma; Eurostat, EU-SILC 2014, General population
Table 5: Environment of the dwelling – Roma living in areas affected by pollution, crime, violence and vandalism compared with general population, by EU Member State (%) a,b,c
EU Member State
Pollution, grime or other environmental problems Crime, violence or vandalism in the areaRoma2016
General population2014
Roma2016
General population2014
BG 27 15.7 9 26.8CZ 41 13.7 46 13.5EL 28 23.2 22 16.1ES 27 10.2 42 11.9HR 31 5.7 22 2.5HU 24 15 23 13.9PT 36 13.7 11 11.6RO 11 16.8 5 14.9SK 33 12.2 33 8.7
Total (9 MS) 25 23
Notes: a Out of all persons in the households (“Pollution”: n=33,370; “Crime…”: n=32,883); weighted results. b “Pollution” based on “share of total population with pollution, grime or other environmental problems in the local area
such as: smoke, dust, unpleasant smells or polluted water in the local area”. For general population, EU-SILC survey [ilc_mddw02, downloaded 11 September 2016].
c “Crime, violence and vandalism” based on share of total population with crime, violence and vandalism in the local area. For general population, EU-SILC survey [ilc_mddw03, downloaded 20 September 2016].
Sources: FRA, EU-MIDIS II 2016, Roma; Eurostat, EU-SILC 2014, General population

Second European Union Minorities and Discrimination Survey | Roma – Selected findings
36
2�6� Discrimination and rights awareness
Respect for human rights, including the rights of persons belonging to minorities, is a fundamental value underpin-ning the very foundations and Treaties of the European Union. Article 21 of the EU Charter of Fundamental Rights prohibits discrimination on grounds of racial or ethnic origin. The Racial Equality Directive (2000/43/EC) bans discrimination on these grounds in the areas of employ-ment, education, social protection, including social secu-rity and healthcare, and goods and services, including housing.44 UN Sustainable Development Goal 10 to reduce inequality within and among countries addresses dis-crimination in the context of inequality.45
44 Racial Equality Directive, pp. 22–26.45 See SDG-10.
2�6�1� Overall prevalence of discrimination
The survey sought to determine the overall prevalence of discrimination by establishing the proportion of Roma respondents who personally felt discriminated against on the grounds of skin colour, ethnic origin, and reli-gion or religious belief. Respondents who indicated having felt discriminated against on at least one of these three grounds were asked in a follow-up ques-tion to specify if the last incident took place in the past 12 months. The survey applied the generic term ‘Roma background’ to cover ethnic origin and skin colour – in all follow-up questions.
On average, 41 % of Roma in the nine EU Member States surveyed felt discriminated against because of their Roma background at least once in the past five years in at least one area of daily life asked about in the sur-vey, such as looking for work, at work, housing, health and education (Figure 19). One in four Roma (26 %) indicated that the last incident of discrimination based on their Roma background took place in the 12 months preceding the survey.
UN Sustainable Development Goals and TargetsGoal 10: Reduce inequality within and among countries.
Target 2. By 2030, empower and promote the social, economic and political inclusion of all, irrespective of age, sex, disability, race, ethnicity, origin, religion or economic or other status.
Target 3. Ensure equal opportunity and reduce inequalities of outcome, including by eliminating discriminatory laws, policies and practices and promoting appropriate legislation, policies and action in this regard.
Figure 19: Overall prevalence of discrimination based on Roma background in the past 5 years and past 12 months, by EU Member State (%) a,b,c
Notes: a Out of all Roma respondents at risk of discrimination on grounds of Roma background in at least one of the domains of daily life asked about in the survey (‘the past 5 years’: n=7,745; ‘the past 12 months’: n=7,875); weighted results.
b Domains of daily life asked about in the survey: looking for work, at work, education (self or as parent), health, housing, and other public or private services (public administration, restaurant or bar, public transport, shop).
c Discrimination experiences in ‘access to health care’ were asked about only for the past 12 months, which explains the different sample sizes (n) for the two reference periods.
Source: FRA, EU-MIDIS II 2016, Roma
Past 5 years Past 12 months
22
61 61 51 50
32
71
29
54
41
14
32
48
35 37
21
47
21
30 26
0102030405060708090
100
BG CZ EL ES HR HU PT RO SK Total(9 MS)

What do the results show?
37
Table 6 shows the prevalence of discrimination based on ethnic origin in the 12 months preceding the survey in different areas of life in the nine EU Member States where Roma populations were surveyed. Overall, and consistent with the results of the two previous surveys of Roma – EU-MIDIS I and the 2011 Roma survey – most Roma feel discriminated against because of their Roma background when in contact with public or private ser-vices, such as administrative offices, public transport or when accessing a shop, restaurant or bar (19 %), and when looking for work (16 %).
The number of Roma, however, who felt discrimi-nated against when looking for work in the preceding 12 months is considerably lower than that reported in EU-MIDIS I (38 % in 2008 compared with 16 % in 2016). This may reflect an improvement in the survey sampling design, as well as a significant decrease in reported rates. In contrast, compared with the 2011 Roma survey find-ings, a marked decrease in this specific domain can only be observed for the Bulgaria, Czech Republic, Hungary, and Romania; overall, there is a decrease by eight per-centage points. Meanwhile, the prevalence of discrimi-nation when looking for work substantially increased for Roma in Portugal.
Table 6: Prevalence of discrimination based on Roma background in the past 12 months in different areas of life, by EU Member State (%) d
EU Member State
Looking for worka At worka Education
(self or as parent)a Housinga Other public/ private servicesa,c Healtha Overallb
BG 7 3 (4) (3) 10 (3) 14CZ 28 6 9 25 17 8 32EL 24 10 (10) (1) 43 20 48ES 13 5 7 14 30 7 35HR 29 (9) 15 (29) 27 10 37HU 13 4 9 (8) 15 4 21PT 47 11 (2) (5) 38 5 47RO 10 6 4 (6) 17 12 21SK 22 5 7 (8) 23 11 30
Total (9 MS) 16 5 7 12 19 8 26
Notes: a Out of all Roma respondents at risk of discrimination on grounds of Roma background in the past 12 months in the particular domain; weighted results.
b Out of all Roma respondents at risk of discrimination in at least one of the domains of daily life asked about in the survey in the past 12 months (n=7,875); weighted results.
c Other public/private services include: night club, bar, restaurant, hotel, administrative offices or public services, public transport and shop.
d Results based on a small number of responses are statistically less reliable. Therefore, results based on less than 20 to 49 unweighted observations in a group total or based on cells with less than 20 unweighted observations are noted in parentheses. Results based on less than 20 unweighted observations in a group total are not published.
Source: FRA, EU-MIDIS II 2016, Roma
Table 7 shows the five-year prevalence rates of discrimination on grounds of Roma background across the different domains. There is a similar distribution pattern of discrimination prevalence rates when compared with the 12-month rates, except for the domain ‘access to housing’. This is a domain that
involves an activity that is not frequent, so the five-year reference period is more relevant. The results addressing the past five years show that the prevalence of discrimination in access to housing (41 %) is as high as in the domain ‘when looking for work’ (40 %) in that time period.

Second European Union Minorities and Discrimination Survey | Roma – Selected findings
38
Table 7: Prevalence of discrimination based on Roma background in the past 5 years in different areas of life, by EU Member States (%) d
EU Member State
Looking for worka At worka Education
(self or as a parent)a Housinga Other public/private servicesa,c Overallb
BG 21 11 6 (14) 11 22CZ 61 17 19 65 40 61EL 63 38 20 44 52 61ES 34 23 15 45 37 51HR 50 17 22 53 32 49HU 33 11 15 22 18 32PT 76 40 13 75 45 71RO 34 19 10 (13) 21 29SK 53 18 16 30 44 54
Total (9 MS) 40 17 14 41 28 41
Notes: a Out of all Roma respondents at risk of discrimination on grounds of Roma background in the past 5 years in the particular domain; weighted results.
b Out of all Roma respondents at risk of discrimination in the past 5 years in at least one of the domains asked about in the survey (except access to health care) (n=7,745); weighted results.
c Other public/private services include night club, bar, restaurant, hotel, administrative offices or public services, public transport and shop.
d Results based on a small number of responses are statistically less reliable. Therefore, results based on less than 20 to 49 unweighted observations in a group total or based on cells with less than 20 unweighted observations are noted in parentheses. Results based on less than 20 unweighted observations in a group total are not published.
Source: FRA, EU-MIDIS II 2016, Roma
2�6�2� Perceptions of the extent of discrimination on ground of ethnic origin
Respondents were asked to assess how widespread discrimination based on skin colour, ethnic origin, and religion or religious beliefs is in their respective countries. The proportion of Roma who feel discriminated against is slightly lower than the share of those who think discrimination based on ethnic origin or on skin colour is widespread in their society – this finding reflects the fact that respondents not only assess their own experiences but also those of family members and friends. Almost one out of two Roma consider discrimination on grounds of ethnic origin or skin colour to be fairly or very widespread in their country (Figure 20).
The results of the Special Eurobarometer 437 on discrimination in the EU in 2015 (Figure 21) show that, on average, large proportions of the general population in the nine EU Member States also consider discrimination based on ethnic origin to be fairly or very widespread in their country.46 However, there are notable differences between the average perception of Roma and that of the general population. The proportion of people who think discrimination on the ground of ethnic origin is widespread in their country is higher among the general population (Figure 21) than among Roma (Figure 20) in all countries surveyed except the Czech Republic and Croatia. In the Czech Republic, 52 % of the general population thinks discrimination based on ethnic origin is widespread, compared with 85 % of Roma. In Croatia, the difference is not as pronounced: 56 % of Roma versus 50 % of the general population.
46 The EU-28 average is 64 % for discrimination based on ethnic origin and 50 % for discrimination based on religion or beliefs. See European Commission (2015), p. 14.
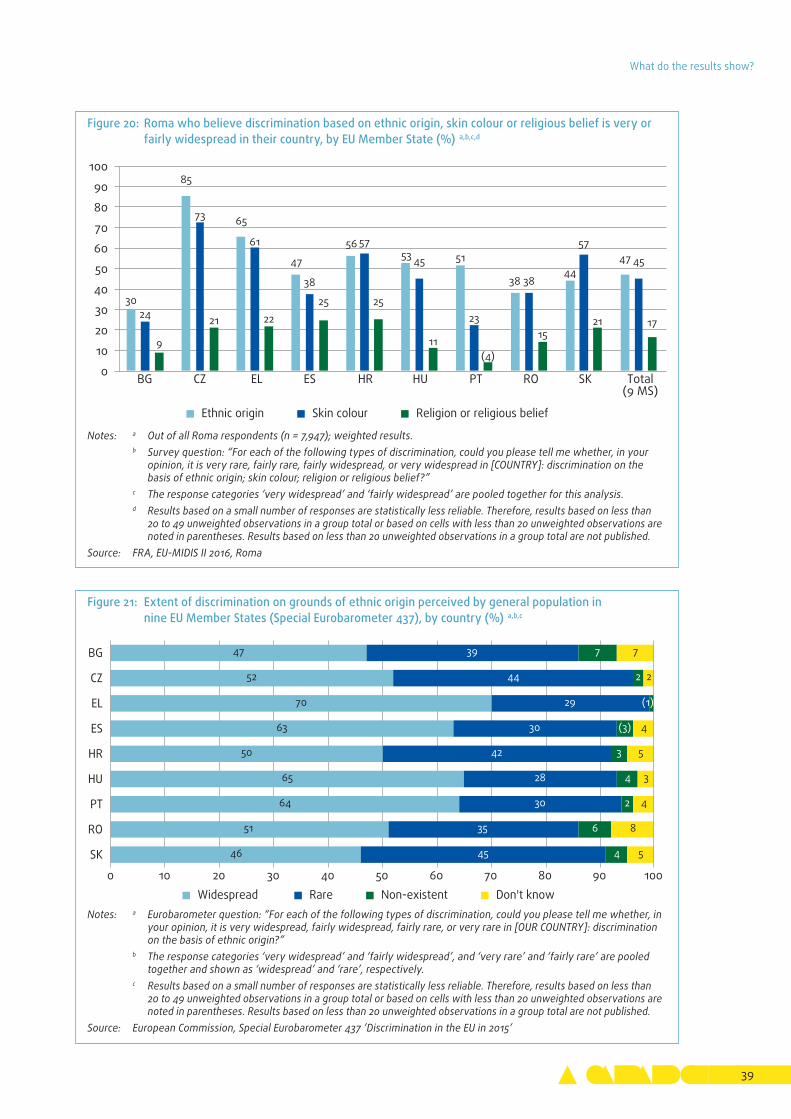
What do the results show?
39
Figure 20: Roma who believe discrimination based on ethnic origin, skin colour or religious belief is very or fairly widespread in their country, by EU Member State (%) a,b,c,d
Notes: a Out of all Roma respondents (n = 7,947); weighted results. b Survey question: “For each of the following types of discrimination, could you please tell me whether, in your
opinion, it is very rare, fairly rare, fairly widespread, or very widespread in [COUNTRY]: discrimination on the basis of ethnic origin; skin colour; religion or religious belief?”
c The response categories ‘very widespread’ and ‘fairly widespread’ are pooled together for this analysis. d Results based on a small number of responses are statistically less reliable. Therefore, results based on less than
20 to 49 unweighted observations in a group total or based on cells with less than 20 unweighted observations are noted in parentheses. Results based on less than 20 unweighted observations in a group total are not published.
Source: FRA, EU-MIDIS II 2016, Roma
Figure 21: Extent of discrimination on grounds of ethnic origin perceived by general population in nine EU Member States (Special Eurobarometer 437), by country (%) a,b,c
Notes: a Eurobarometer question: “For each of the following types of discrimination, could you please tell me whether, in your opinion, it is very widespread, fairly widespread, fairly rare, or very rare in [OUR COUNTRY]: discrimination on the basis of ethnic origin?”
b The response categories ‘very widespread’ and ‘fairly widespread’, and ‘very rare’ and ‘fairly rare’ are pooled together and shown as ‘widespread’ and ‘rare’, respectively.
c Results based on a small number of responses are statistically less reliable. Therefore, results based on less than 20 to 49 unweighted observations in a group total or based on cells with less than 20 unweighted observations are noted in parentheses. Results based on less than 20 unweighted observations in a group total are not published.
Source: European Commission, Special Eurobarometer 437 ’Discrimination in the EU in 2015’
30
85
65
47
5653 51
3844
47
24
73
61
38
57
45
23
38
57
45
9
21 2225 25
11(4)
1521 17
0
10
20
30
40
50
60
70
80
90
100
BG CZ EL ES HR HU PT RO SK Total(9 MS)
Ethnic origin Skin colour Religion or religious belief
46
51
64
65
50
63
70
52
47
45
35
30
28
42
30
29
44
39
4
6
2
4
3
(3)
2
7
5
8
4
3
5
4
2
7
0 10 20 30 40 50 60 70 80 90 100
SK
RO
PT
HU
HR
ES
EL
CZ
BG
Widespread Rare Non-existent Don't know
(1)

Second European Union Minorities and Discrimination Survey | Roma – Selected findings
40
2�6�3� Reporting of incidents of discrimination
The survey results show that not reporting discriminatory incidents remains common among Roma. On average, only 12 % of the respondents who felt discriminated against because of their Roma background at least once in the preceding 12 months reported the last incident to an authority or filed a complaint (Figure 22). The
low reporting rates – for example, in Greece at 7 % – should be read against the high prevalence rates of discrimination based on ethnic origin, which in Greece is 48 %. When looking at EU-MIDIS I results – where 21 % of the Roma surveyed in seven EU Member States indicated having reported the last incident of discrimination to an authority – no improvement in reporting discrimination or filing a complaint can be discerned.
Figure 22: Roma who reported or filed a complaint about the last incident of discrimination based on Roma background, by EU Member State (%) a,b,c
Notes: a Out of all Roma respondents who indicated that the last incident of discrimination based on skin colour or ethnic origin occurred in the past 12 months (n=3,730); weighted results.
b Question: “LAST TIME you felt discriminated against because of your Roma background when [domain], did you report or make a complaint about the incident?”
c Results based on a small number of responses are statistically less reliable. Therefore, results based on less than 20 to 49 unweighted observations in a group total or based on cells with less than 20 unweighted observations are noted in parentheses. Results based on less than 20 unweighted observations in a group total are not published.
Source: FRA, EU-MIDIS II 2016, Roma
12
18
11
(5)
6
18
5
7
15
14
0 10 20 30 40 50 60 70 80 90 100
Total (9 MS)
SK
RO
PT
HU
HR
ES
EL
CZ
BG
2�6�4� Awareness of support organisations, equality bodies, laws and campaigns addressing discrimination
The level of awareness of organisations that offer support and advice in the case of discrimination is examined by asking respondents whether they recognise one or more of up to three preselected equality bodies. In addition, they are asked a general question on their awareness of any organisations that offer support or advice to people who have been discriminated against, regardless of the grounds of discrimination.
On average, and similarly to the findings of EU-MIDIS I, most respondents (82 %) are not aware of any such organisation in their country (Figure 23). In Portugal, Greece and Romania, almost none of the Roma surveyed know of such a support service or organisation, which could explain the low reporting rates. When prompted with a name of an organisation or an equality body, over-all, 29 % of Roma respondents indicate that they recog-nise the organisation; results, however, vary by country.
On average, 36 % of Roma respondents know that there is a law prohibiting discrimination based on skin colour, ethnic origin or religion (Figure 24), while about one third (35 %) say that there is no such law, and 27 % do not know whether such legislation exists. The results differ considerably across countries, with the lowest awareness levels in Portugal.

What do the results show?
41
Figure 23: Awareness among Roma of organisations that offer support or advice to victims of discrimination (regardless of the grounds of discrimination), by EU Member State (%) a,b,c
Notes: a Out of all Roma respondents (n = 7,947); weighted results. b Survey question: “Do you know of any organisations in [COUNTRY] that offer support or advice to people who
have been discriminated against – for whatever reason?” c Results based on a small number of responses are statistically less reliable. Therefore, results based on less than
20 to 49 unweighted observations in a group total or based on cells with less than 20 unweighted observations are noted in parentheses. Results based on less than 20 unweighted observations in a group total are not published.
Source: FRA, EU-MIDIS II 2016, Roma
15
16
9
8
15
22
17
8
21
16
82
80
88
91
82
74
83
88
74
81
2
3
3
5
0 10 20 30 40 50 60 70 80 90 100Total (9 MS)
SK
RO
PT
HU
HR
ES
EL
CZ
BG
Yes No Don’t know
(2)
(1)
(4)
(3)
(2)
Figure 24: Awareness among Roma of laws prohibiting discrimination based on skin colour, ethnic origin or religion, by EU Member State (%) a,b,c
Notes: a Out of all Roma respondents (n = 7,947); weighted results. b Question: “As far as you are aware is there a law in [COUNTRY] that forbids discrimination based on skin colour,
ethnic origin or religion?” c Results based on a small number of responses are statistically less reliable. Therefore, results based on less than
20 to 49 unweighted observations in a group total or based on cells with less than 20 unweighted observations are noted in parentheses. Results based on less than 20 unweighted observations in a group total are not published.
Source: FRA, EU-MIDIS II 2016, Roma
36
51
32
13
31
54
21
31
55
28
35
24
35
22
41
32
62
28
20
35
27
22
31
64
27
14
17
38
24
34
2
3
4
0 10 20 30 40 50 60 70 80 90 100
Total (9 MS)
SK
RO
PT
HU
HR
ES
EL
CZ
BG
Yes, there is a law No, there is no law Don’t know Other
(2)
(1)
(2)
(2)
(1)


43
The survey in a nutshellThe selected findings presented in this report are based on a survey of Roma in nine EU Member States. The survey on Roma was a part of FRA’s EU-MIDIS II sur-vey, which collected data on immigrants and ethnic minorities’ experiences and opinions in all 28 EU Mem-ber States. The methodology used in EU-MIDIS II built upon experience gained through the implementation of FRA’s first survey on immigrants and ethnic minori-ties in 2008 (EU-MIDIS I) and the Roma survey in 2011. Compared with earlier surveys, in EU-MIDIS II the set of questions was extended and the coverage of the survey’s target groups was improved through the use of advanced sampling approaches.
Selection criteriaAs information relevant for respondent selection was not readily available from administrative data sources, EU-MIDIS II respondents were screened for eligibility to take part in the survey by self-identification – as was done in EU-MIDIS I and the 2011 Roma survey. When carrying out the interviews for the Roma sample, after contacting a household and introducing the survey, the interviewer asked a screening question (‘Is there anyone aged 16 or over living in this household who is Roma?’) to determine whether there were eligible Roma persons in the household to take part in the sur-vey. In some countries, the term ‘Roma’ was replaced with a show card listing all relevant terms commonly used in the country and included under the umbrella term ‘Roma’ adopted in the survey.
Only one person per household was interviewed in Roma households, while a number of questions in the survey asked about the situation of each household member. The EU-MIDIS II survey collected information on 7,947 Roma households, including 33,785 household members in total. Therefore, depending on the type of analysis (respondent-level versus household-level), the results presented in this report are based either on the experiences of the 7,947 respondents (one per house-hold) or 33,785 persons (all individuals living in Roma households). The number of respondents available as a basis for the presented results is indicated under each table and figure.
Implementation of data collectionIpsos MORI, a large international survey company based in the United Kingdom, undertook the fieldwork for EU-MIDIS II under the supervision of FRA staff, who moni-tored compliance with strict quality control procedures.
FRA staff participated in interviewer training sessions and observed data collection activities.
The main interview mode for EU-MIDIS II was Computer Assisted Personal Interview (CAPI) – that is, face-to-face interviews administered by interviewers using a com-puterised questionnaire. The English master version of the survey questionnaire was translated into the nine official languages of the countries in which Roma were surveyed. The median length of the interviews with Roma respondents was 43 minutes.
SamplingThe EU-MIDIS II survey set out to achieve a probability sample of Roma in each of the nine EU Member States where Roma were interviewed. In all nine countries, the Roma households were selected through the use of ran-dom route sampling techniques – that is, in the absence of lists of individuals or addresses, the interviewers followed pre-defined instructions within randomly selected areas to contact every nth household. This involved a multi-stage clustered sampling approach, where – as a first step – data concerning the population size was gathered at the lowest possible regional level (for example, data from censuses or other sources). This information served for the preparation of the sampling frame – a list of areas to be sampled, also known as the Primary Sampling Units (PSUs). In Spain, Portugal, and Greece, expert knowledge of local Roma NGOs and the sampling frames for the 2011 Roma pilot survey were used to identify the primary sampling units and concentrations of Roma in the areas. Primary sampling units were selected with probability proportional to size of the target population within strata. The selection of primary sampling units was further stratified by region and urbanity, to ensure sufficient coverage of different parts of the country as well as rural and urban areas. To optimise the use of resources, in some countries primary sampling units with high densities/concentra-tions were over-sampled and low density areas were excluded from the survey, when including them would have involved very high costs but a low impact on the overall results.
In the nine countries where Roma were surveyed, administrative units with Roma population density below a certain country-specific threshold were excluded from the sampling frame – for example, if administrative units had fewer than a certain number of Roma households (between 15 in Hungary and 200 in Spain) or the density of Roma was under the agreed threshold (5-10 % of the total population in the area, depending on the country). The thresholds were

Second European Union Minorities and Discrimination Survey | Roma – Selected findings
44
negotiated with the fieldwork agency and depended on the overall size of the PSUs. The exclusion of areas with the lowest density of Roma led to a slight decrease in the coverage of all Roma living in the nine EU Member States covered, resulting in a coverage ranging between 60 % and 80 % in the countries where Roma were surveyed. To increase sampling efficiency in areas where Roma were estimated to make up less than 25 % of the population, Adaptive Cluster Sampling (ACS) was applied in Bulgaria, Hungary and Romania. Adaptive cluster sampling allows for screening of neighbouring addresses around an eligible household to find other eligible households.47 Irrespective of the method used for sampling households, in each case one respondent was selected from the household using a randomised method.
WeightingWhen analysing the survey results, the data were weighted to reflect the selection and response probabilities of each household and individual based on the multi-stage sampling design. This was also needed to correct the results for unequal selection probabilities, which were used to increase the efficiency of the data collection (higher density areas were oversampled in some countries). The weights also account for the differences in the (estimated) size of the Roma population in each of the countries. As the sample sizes are not proportional to the size of the Roma population in each of the countries, countries with bigger Roma populations receive higher weights, accordingly. This allows for the calculation of aggregate statistics when combining different countries.
Roma sample sizesThe target sample sizes for each of the nine EU Member States in which Roma were interviewed are based on the estimated number of Roma living in each country. In total 7,947 interviews with Roma respondents were carried out across the nine EU Member States, ranging from 508 interviews in Greece to 1,408 in Romania, as shown in Table 8. Altogether 35,400 addresses were contacted to obtain the sample of 7,947 interviews, including invalid and ineligible addresses.
47 For a description of the method, see Verma Vijay (2014).
Table 8: Number of Roma individuals and households interviewed in EU-MIDIS II, by EU Member State
EU Member State
Households/selected
respondents
Individuals in Roma
householdsBulgaria 1,078 4,278Croatia 538 2,800Czech Republic 817 3,245Greece 508 2,719Hungary 1,171 4,941Portugal 553 1,992Romania 1,408 5,764Slovakia 1,098 4,987Spain 776 3,059Total (9 MS) 7,947 33,785
Comparability between different surveys
To date, three FRA surveys – EU-MIDIS I (2008), the Roma survey (2011) and EU-MIDIS II (2016) – have collected data on Roma in six EU Member States: Bulgaria, the Czech Republic, Greece, Hungary, Romania and Slovakia. In addition to this, Roma in Portugal and Spain were covered in both the 2011 Roma survey and EU-MIDIS II. The 2011 Roma survey did not cover Roma in Croatia.
Whereas EU-MIDIS I focused on respondents’ experiences of discrimination, crime victimisation, police stops and rights awareness, the 2011 Roma survey and EU-MIDIS II asked a broader set of questions concerning various areas of respondents’ everyday life. Therefore, all three surveys collected data on issues such as discrimination and rights awareness, while results concerning other issues such as poverty, educational attainment and housing were only collected in the 2011 Roma survey and EU-MIDIS II. In some instances, the wording of questions changed between surveys, which may limit the comparability of results.
EU-MIDIS I, the 2011 Roma survey, and EU-MIDIS II were all carried out using a similar methodology, applying a multi-stage selection of respondents. To optimise the sampling approach, EU-MIDIS II further developed the methodology applied in 2011. Despite similar meth-odological approaches used in the surveys, there are some limitations, which need to be considered when comparing the results.
The EU-MIDIS II survey further improved the sampling and weighting methods developed for the 2011 Roma survey – therefore, the results of EU-MIDIS II should

The survey in a nutshell
45
be considered to be a more accurate representation of the situation and experiences of Roma in the countries covered in the two surveys. Roma are an example of the so-called ‘hard-to-reach’ groups for survey sampling, which means that achieving a representative sample is more difficult compared with general population sur-veys. The following points affect the comparability of the two surveys.
The 2016 EU-MIDIS II survey data were adjusted, taking into account unequal selection probabilities and multi-stage sampling. No weights were applied to the 2011 survey results (see information on weighting). This means that even if the sample in a country is similar, the 2016 data would yield more accurate results.
Geographical coverage
The geographical coverage of regions on a NUTS248 level was similar in seven out of the eight countries where data on Roma was collected in both the EU-MIDIS II survey and the 2011 Roma survey. Only in Greece was the sample spread over more geographic areas in the 2011 Roma survey than in EU-MIDIS II.
Differences in samples
When comparing the distributions of both the 2011 sample and the 2016 sample, it should be noted that results based on the 2016 survey are always based on a weighted sample, which was not the case in 2011.
48 NUTS stands for ’Nomenclature of territorial units for statistics’. For more information, see Eurostat’s webpage on the classification.
In the 2016 survey, the sample shows in all countries a higher percentage of smaller households (1-or 2-person households), compared with 2011. This is also related to fewer children (0 to 15) living in the households in the 2016 survey and a higher average age group. How-ever, compared with the general population, the Roma households in EU-MIDIS II were on average younger, with more children and less one-person households. This change in household structure between the two surveys indicates a general demographic change of the Roma population towards smaller households, but also supports the assumption that the methodology improved, covering a more diverse population in 2016. The gender distribution of respondents is similar in the eight countries that were covered in both surveys.
Sampling error
All sample surveys are affected by sampling error, given that the survey interviews only a fraction of the total population. Therefore, all results presented are point estimates underlying statistical variation. Small differ-ences of a few percentage points between groups of respondents have to be interpreted within the range of statistical variation and only more substantial differ-ences between population groups should be considered as evidence of actual differences.


47
ReferencesCouncil of Europe (2012), ‘Estimates and official numbers of Roma in Europe’, updated on 2 July 2012.
European Commission (2010), The European Platform against Poverty and Social Exclusion: A European framework for social and territorial cohesion, COM(2010) 758 final, Brussels, 16 December 2010.
European Commission (2015), Specia l Euro-barometer 437 ‘Discrimination in the EU in 2015’, Luxembourg, Publications Office.
European Commission (2016), Communication from the Commission to the European Parliament, the Council, the European Economic and Social Committee and the Committee of the Regions, Launching a consultation on a European Pillar of Social Rights, COM(2016) 127 final, Strasbourg, 8 March 2016.
European Commission/EACEA/Eurydice (2015), The Structure of the European Education Systems 2015/16: Schematic Diagrams. Eurydice Facts and Figures, Luxembourg, Publications Office of the European Union (Publications Office).
European Court of Auditors (ECA) (2016), EU policy initiatives and financial support for Roma integration: significant progress made over the last decade, but additional efforts needed on the ground, Special report, Luxembourg, Publications Office.
Eurostat (2016), Eurostat Statistics Explained – Europe 2020 indicators – education.
FRA (European Union Agency for Fundamental Rights) (2009), EU-MIDIS - Main Results Report, Luxembourg, Publications Office.
FRA (2012), The situation of Roma in 11 EU Member States - Survey results at a glance, Luxembourg, Publications Office.
FRA (2014), Roma survey – Data in focus: Discrimination against and living conditions of Roma women in 11 EU Member States, Luxembourg, Publications Office.
FRA (2016), Measuring Roma inclusion strategies – a fundamental rights based approach to indicators, UNECE Working paper 20.
Fundación Secretariado Gitano (ed.) (2009), Health and the Roma community: Analysis of the situation in Europe. Bulgaria, Czech Republic, Greece, Portugal, Romania, Slovakia, Spain, Cuadernos Técnicos Nº 97, Madrid, 2009.
UNESCO (2010), EFA Global Monitoring Report 2010, Reaching the marginalized, Paris.
Verma Vijay (2014), Sampling Elusive Populations: Applications to Studies of Child Labour, Geneva: International Labour Office.
Willis, Gordon B. (2005), Cognitive interviewing. A tool for improving questionnaire design, London, Sage, p. 3.
World Bank (2012), Towards an equal start: Closing the early learning gap for Roma children in Eastern Europe.


HOW TO OBTAIN EU PUBLICATIONS
Free publications:• one copy:
via EU Bookshop (http://bookshop.europa.eu);
• more than one copy or posters/maps: from the European Union’s representations (http://ec.europa.eu/represent_en.htm); from the delegations in non-EU countries (http://eeas.europa.eu/delegations/index_en.htm); by contacting the Europe Direct service (http://europa.eu/europedirect/index_en.htm) or calling 00 800 6 7 8 9 10 11 (freephone number from anywhere in the EU) (*).
(*) The information given is free, as are most calls (though some operators, phone boxes or hotels may charge you).
Priced publications:• via EU Bookshop (http://bookshop.europa.eu).

With 80 % of Roma surveyed living below their country’s at-risk-of-poverty threshold, every third Roma living in housing without tap water, every third Roma child lives in a household where someone went to bed hungry at least once in the previous month, and Roma children lagging behind their non-Roma peers in education, this report underscores an unsettling but unavoidable reality: the European Union’s largest ethnic minority continues to face discrimination and unequal access to various vital services.
Highlighting persisting barriers to employment, education, housing and health services, this report also reveals that four out of 10 Roma surveyed felt discriminated against at least once in the past five years – yet only a fraction pursued the incident. While sobering, this report presents vital information that can serve as a unique resource for policymakers committed to ensuring that Roma are treated equally with respect to their fundamental rights.
The report is based on a survey that collected information on almost 34,000 persons living in Roma households in nine European Union (EU) Member States, derived from nearly 8,000 face-to-face interviews with Roma. It presents a selection of results from FRA’s Second European Union Minorities and Discrimination Survey (EU-MIDIS II), which surveyed around 26,000 people with immigrant or ethnic minority background living in the EU. The European Union Minorities and Discrimination Survey is a major part of the agency’s commitment to collecting and publishing data on groups not covered in general population surveys. It is the third survey of the agency to focus on Roma.
FRA - EUROPEAN UNION AGENCY FOR FUNDAMENTAL RIGHTSSchwarzenbergplatz 11 – 1040 Vienna – AustriaTel. +43 1580 30-0 – Fax +43 1580 30-699fra.europa.eu – [email protected]/fundamentalrightslinkedin.com/company/eu-fundamental-rights-agencytwitter.com/EURightsAgency
HELPING TO MAKE FUNDAMENTAL RIGHTS A REALITY FOR EVERYONE IN THE EUROPEAN UNION
doi:10.2811/469 TK-AN
-16-111-EN-N
ISBN 978-92-9491-871-0