second derivative uv spectrophotometric determination of hydrochlorothiazide and...
TRANSCRIPT
International JournalofPharmaceutics, 51 (1989) 169-174 169 Elsevier
IJP 01729
Second derivative UV spectrophotometric determination of hydrochlorothiazide and hydrochlorothiazide-amiloride
combination in tablets
M. Parissi-Poulou 1, V. Reizopoulou 1, M. Kouppar is 2 and P. Macheras 1 Departments of i Pharmacy and " Chemistry, Unit, ersity of Athens, Athens (Greece)
(Received 16 June 1988) (Modified version received 19 August 1988)
(Accepted 30 August 1988)
Key words: Deriva t ive UV spec t ropho tomet ry ; Hydroch lo ro th iaz ide ; Ami lo r ide ; Hydroch lo ro th i az ide -ami lo r ide combina t ion tablet
Summary
Assay procedures based on second-order derivative UV spectrometry (D2) have been developed for the determination of hydrochlorothiazide and amiloride, alone or in combination, in tablets. Hydrochlorothiazide (2-12 /~g/ml) and amiloride (2-7 t~g/ml) can be determined separately by measuring the amplitudes of maximum-minimum D2(278_264nm) and D2(381_365nm}, respectively. Combinations of amiloride (2-7/~g/ml) and hydrochlorothiazide (20-70 #g/ml) in ratios ranging from 0.08 to 0.3 can be determined using the simultaneous equations method with measurements of the amplitudes of maximum-minimum D2(381_365nm) and D/~334_312nm). The linearity of the calibration curves was excellent (r > 0.9993), the precision (RSD) better than 1.3% and relative errors less than 1.5%. No spectral interferences from tablet excipi'ents were found. Applications are given for the assay of commercial tablets and content uniformity test. The procedures proved to be suitable for a rapid and reliable quality control.
Ul t rav io le t der ivat ive spec t romet ry has recent ly p roven useful for de te rmin ing drugs in mul t i com- ponen t fo rmula t ion and biological f luids in the presence of in terferences or ig inat ing f rom ei ther the coexis t ing drugs or the sample matr ix. UV der ivat ive spec t romet ry enhances the qual i ta t ive features and thus increases the f ingerpr in t ing uti l- i ty of UV spec t romet ry for selective ident i f ica t ion a n d q u a n t i f i c a t i o n o f o r g a n i c c o m p o u n d s ( O ' H a v e r and Green, 1976; O 'Have r , 1979). Drugs with poor ly deve loped m a x i m a or with spectral
Correspondence: P. Macheras, Department of Pharmacy, Athens University, 104 Solonos Str., Athens 10680, Greece.
interferences by excipients and o ther active in- gredients can be accura te ly de t e rmined by UV derivat ive spec t romet ry (Dav idson and Elsheikh, 1982; Gil l et al., 1982; Fel l et al., 1981; Mar t inez and Gimenez, 1981; Bermego et al., 1985; Corany et al., 1984; A b d e l - H a m i d et al., 1984; Nob i l e et al., 1987; Bedair et al., 1986; Poulou and Mac- heras, 1986).
In this pape r an app l i ca t ion of UV der ivat ive (O2) spec t romet ry to permi t a s imple, accura te and rap id assay of hydroch lo ro th i az ide (Hy) and h y d r o c h l o r o t h i a z i d e - a m i l o r i d e ( H y - A m ) combi - na t ion in tablets is descr ibed. The de t e rmina t i on of H y a lone is based on the measu remen t of the m a x i m u m - m i n i m u m a m p l i t u d e of the D 2 spec-
0378-5173/89/$03.50 © 1989 Elsevier Science Publishers B.V. (Biomedical Division)
170
trum at 278-264 nm, while the combination of Hy-Am is determined by using the method of the simultaneous equations and measuring maxi- m u m - m i n i m u m amplitudes at 381-365 and 334-312 nm.
A double-beam UV-vis spectrophotometer (Perkin Elmer Lambda 7) with the capability of derivative mode was used. The optimized operat- ing conditions for recording the D 2 spectra, using 1.000 cm quartz cells, were: scan speed 240 n m / m i n ; response time 5 s; spectral slit width 2 nm; abscissa format 20 or 50 n m / c m .
Methanol, used as the solvent, was of analytical
reagent grade. Hy and Am were obtained from local manufacturers and their purity was tested using HPLC. Several excipients, used for the inter- ference study were obtained from commercial sources.
Working standard solutions of Hy (2-12 /~g/ml), Am ( 2 - 7 / ~ g / m l ) and Hy-Am mixtures, with a ratio of A m / H y in the range of 0.08-0.3 (keeping Am in the range 2 - 7 / ~ g / m l and Hy in the range of 20-70 /~g/ml) were prepared daily from stock solutions of Hy (1000/~g/ml) and Am (100/~g/ml) in methanol.
For the determination of Hy, the second-order
d2A
, , , i , , 2.0 A E3
0.70
1.2 -.I I~[ I.- O, L2
d2A
-0 .4 4 / l ~,\W-- X )! I.- - 0.1/-,
!,1, I I,~'~
? I [ I I
260 300 X ( n m l
-1.2 --FI ,L - 0./.. 2
, - 2 . 0 ~ - 0 . 7 0 340 300 /-+00
X ( n m)
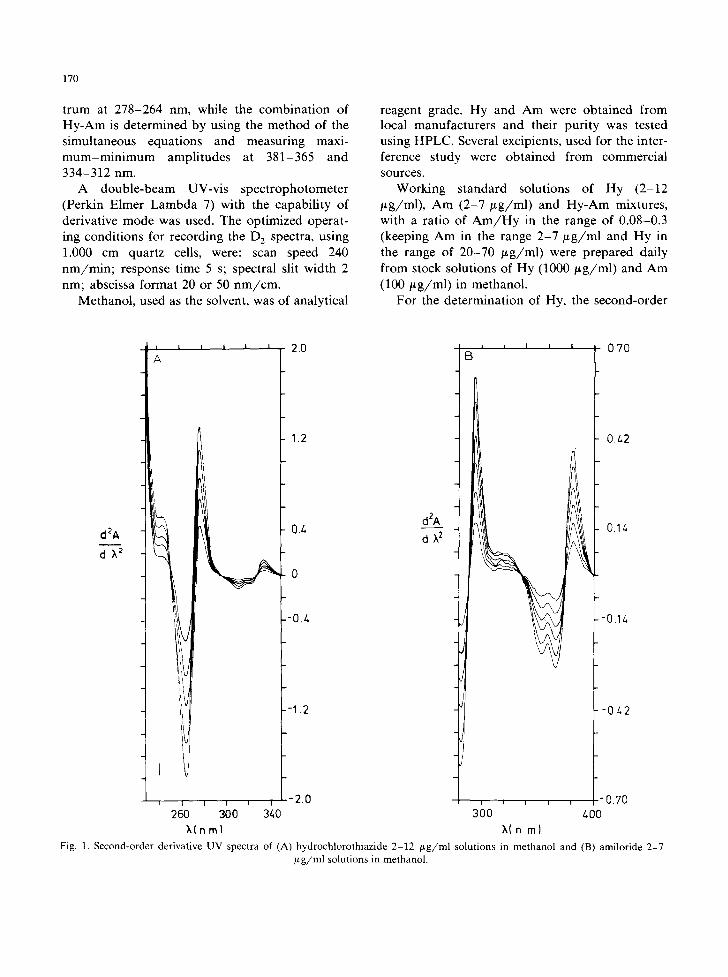
Fig. 1. Second-order derivative UV spectra of (A) hydrochlorothiazide 2-12 ~g/ml solutions in methanol and (B) amiloride 2-7 /~g/ml solutions in methanol.

(D2) UV spectra of Hy working standard solu- tions, containing 2-12 /~g/ml of Hy, were re- corded over the 230-300 nm range against a methanol blank. The calibration curve was then constructed by plotting the graphically measured (mm) a m p l i t u d e s of m a x i m u m - m i n i m u m
D2(278_264nm) vs the corresponding Hy concentra- tions (/~g/ml).
For the simultaneous determination of Hy and Am, two calibration curves were constructed as follows. The D 2 UV spectra of Am working stan- dard solutions, containing 2 -7 # g / m l of Am, and mixed Am-Hy working standard solutions were recorded over the 270-400 nm range against a methanol blank. A first calibration curve, for the estimation of Am, was constructed by plotting the measured (ram) amplitudes of maximum-mini -
mum D2(381_365nm) vs the corresponding Am con- centrations (/~g/ml). A second calibration curve, for the estimation of A m / H y concentration ratio
was constructed by plotting the D2(381_365nm) / D2(334_312nm) vs the respective A m / H y concentra- tion ratios of the mixed working standard solu- tions.
The procedures for the determination of drugs in tablets containing either Hy or a combination
171
of Hy-Am were as follows. A port ion of the fine and homogenized powder of the tablets, which were sampled and treated according to the USP XXI procedure, equivalent to about 5 mg of Am and 50 mg Hy, was accurately weighed and trans- ferred in a 50-ml volumetric flask with 20 ml of methanol. The mixture was vigorously shaken for about 10 min, then the volume was completed to the mark with methanol and the obtained solution was filtered or centrifuged. For tablets containing only Hy, 1.00 ml of the obtained clear solution was diluted to 100 ml with methanol. The D 2 spectrum of this solution was recorded, the ampli-
tude D2(278_ 264nm) was measured (mm) and the Hy concentration in the sample solution was obtained by interpolating the calibration curve. For tablets containing a combination of Hy-Am, 5.00 ml of the obtained clear solution was diluted to 100 ml
with methanol. The D2(381_365nm) and D2(334_312nrn ) were measured (mm) and Am concentration and A m / H y concentration ratio in the sample solu- tion were obtained by interpolating the corre- sponding calibration curve.
The zero-order (Do) absorption UV spectrum of Hy exhibits a profile with two absorption bands, namely a strong one with ~max = 271 nm (A~ m =
TABLE 1
Effect of tablet additives on zero- and second-order spectrophotometric determinations of hydrochlorothiazide
Additive Concentration ratio (additive/Hy)
Recovery % (n = 3)
Do D2 Lactose 6 103.6 98.2 Gelatin 6 105.4 100.2 Starch 6 107.4 100.9 Carbopol a 6 104.4 99.4 Sodium lauryl sulfate 6 99.8 99.4 Magnesium stearate 6 103.0 100.2 Carbowax b 6 145.9 141.8 Carbowax b 3 102.1 98.9 PVP K30 c 6 102.6 99.4 CAHP ,t 6 103.9 99.2 PVP c 6 104.5 100.2 Hydroxypropyl-methyl cellulose 6 107.8 106.2 Hydroxypropyl-methyl cellulose 3 98.9 99.4
a Carboxypolymethylene. b Polyethylene glycol 4000. ¢ Polyvinylpyrrolidone. d Cellulose acetate hydroxyphthalate.
172
660) and a weak one with ~krnax = 318 nm ( A ~ = 120). These two bands are converted in sharp bands of the same relative amplitude when the second-order UV spectrum is recorded (Fig. 1A). Although a sensitive spectrophotometric de- termination of Hy is feasible, using the zero-order spectrum at 271 nm, with a measurable limit of less than 1 /~g/ml, spectral interferences by the excipients are expected when this method is ap- plied to formulation assays. In view of this, a second-order derivative UV spectrophotometric method was devised to determine Hy alone in tablets. The amplitude of max imum-min imum 278-264 nm of the second-order spectrum was found to be linear with Hy concentrations in the range 2-12 ~g /ml , with a least-squares linear regression equation:
y ( m m ) = -0.532(_+3.05)
+ 13 .81(±0 .29) . Cuy ( / t g /ml )
r = 0.9993, n = 6
Eight replicate determinations carried out on a Hy standard solution of 10.0 # g / m l gave a rela- tive standard deviation (RSD) of 1.3% and a rela- tive error of -0.80%.
In order to examine the effect of common excipients, used in the formulation of tablets, on the zero- and second-order UV spectrophotomet- ric determinations of Hy, recovery experiments were carried out f rom synthetic s tandard methanolic solutions containing 10.0 # g / m l of Hy and various excipients in excess. From the results shown in Table 1 it is evident that the D 2 spectro- photometric determination does not suffer from the spectral interference of the excipients and the direct determination of Hy in tablets without any isolation of the analyte being successful.
A further comparison of the proposed D 2 spec- trophotometric method vs the zero-order spectro- photometric determination was made by analyzing commercial tablets containing 25.0 mg of hydro- chlorothiazide (Essidrex) the exact content of which was confirmed by the USP official proce- dure (UV spectrophotometric method after a col- umn chromatographic isolation of the analyte).
The results gave a mean of 24.82 ± 0.33 mg/ tab le t (n = 5), i.e. RSD = 1.3%, and relative error -0 .72%. The results obtained by the D o spectrophotometric method, carried out for com- parative purposes, gave 26.46 + 0.23 (n = 5) i.e. RSD = 0.86% and relative error + 5.8%. Again the superiority of the O 2 method is clear.
The zero-order UV spectrum of Am exhibits a profile with two absorption bands of about the same intensity (Xma×= 285 nm with A~, m = 540 and )kma x = 360 nm with AlUm = 640). The second-order spectrum shows two m a x i m u m - minimum pairs at 292-282 nm and 381-365 nm (Fig. 1B). By comparing the D 2 spectra of Hy and Am (Fig. 1A and B, respectively) it is clear that the amplitude of m a x i m u m - m i n i m u m D2~38 ~_ 365nm)
of Am is not affected by the presence of Hy allowing the selective determination of Am in Am-Hy mixtures. The amplitude of m a x i m u m - minimum 381-365 nm was found to be linearly related to Am concentration in the range of 2 -7 ~ g / m l with a least-squares linear regression equa- tion:
y ( m m ) = --0.819( ± 1.23)
+ 14.38( ± 0.26). Cam ( / t g /ml )
r = 0.9993, n = 6
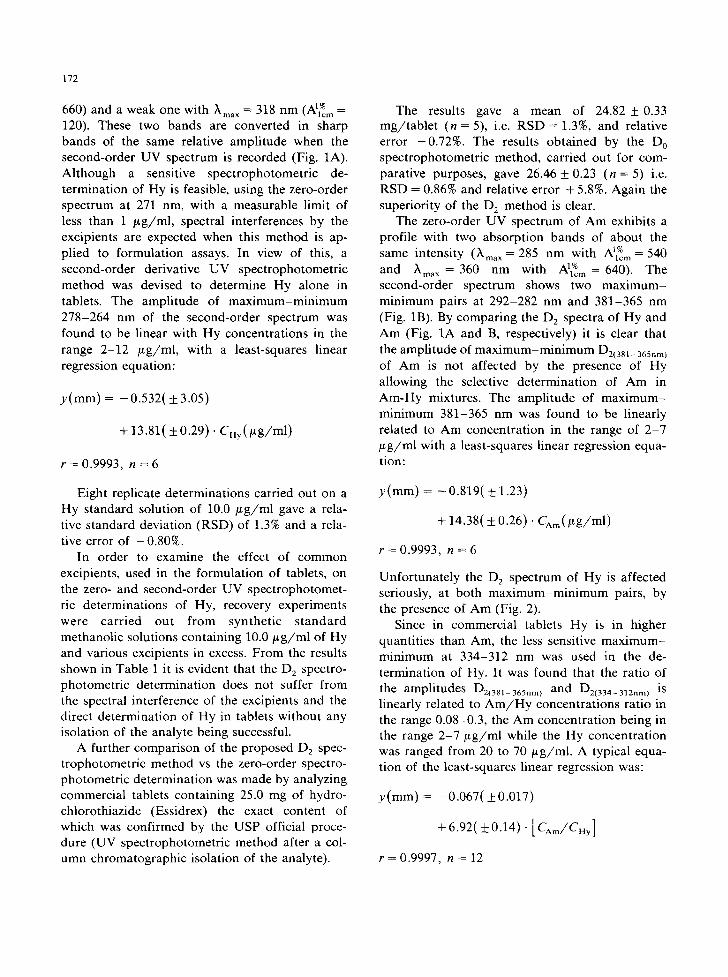
Unfortunately the D 2 spectrum of Hy is affected seriously, at both m a x i m u m - m i n i m u m pairs, by the presence of Am (Fig. 2).
Since in commercial tablets Hy is in higher quantities than Am, the less sensitive m a x i m u m - minimum at 334-312 nm was used in the de- termination of Hy. It was found that the ratio of the amplitudes Oz(381_365nm) and D2(334_312nm) is linearly related to A m / H y concentrations ratio in the range 0.08-0.3, the Am concentration being in the range 2 - 7 / L g / m l while the Hy concentration was ranged from 20 to 70/xg/ml . A typical equa- tion of the least-squares linear regression was:
y ( m m ) = - 0.067( _+ 0.017)
+6 .92(+0 .14) - [CAm/CHy ] r = 0.9997, n = 12

173
A
A 1.0
0,8
0.6
[ 0./.
0.2
d2A
d X 2
0.70
0.42
0.1&
-0.14
-0.42
00 -0.70 /.0t 300 /..00
)~lam) X { n r n ]
Fig. 2. Absorption (zero-order) UV spectrum (A) and second order derivative UV spectrum (B) of hydrochlorothiazide (50 /~g/ml)-amiloride (5 ~g/ml) mixture in methanol.
The D2-spectrophotometric method for the simultaneous determination of Am and Hy was tested by analysing a s tandard synthet ic methanolic solution containing 4 .00/~g/ml of Am and 50.0 /~g/ml of Hy. Ten replicate determina- tions gave 3.94 _+ 0.04 /~g/ml for Am (RSD = 1.0%, relative e r r o r = - 1 . 5 % ) and 49.2 + 0.5 # g / m l for Hy (RSD--1 .0%, relative e r ro r= - 1 . 6 % ) .
The proposed D2-method for the simultaneous determinations of Am and Hy was further evaluated in the assay of commercial tablets of the
Am-Hy combination (Moduretic, 5 mg of Am, 50 mg of Hy), and the results were compared to those obtained by the time-consuming HPLC method of the USP. A very good agreement (based on the t-test) between the two methods was found.
The advantages of the proposed D2-spectropho- tometric method (i.e. short analysis time, unneces- sary sample pretreatment and good precision and accuracy), make the method attractive in content uniformity tests, where a great number of assays on individual tablets is required. Thirty individual Moduretic tablets (5 mg of Am, 50 mg of Hy),
174
were a n a l y z e d for A m . Al l tab le ts were f o u n d to
be in the r ange o f 1 0 1 - 1 0 5 % of the s ta ted c o n t e n t
w i th an R S D = 1.3%. T h e ana ly t i ca l w o r k l o a d is
e n o u g h m i n i m i z e d by us ing the p r o p o s e d D2-spec-
t r o p h o t o m e t r i c m e t h o d whe re o n l y the r e c o r d i n g
of a D2- spec t rum of a f i l te red s a m p l e so lu t ion is
r equ i red .
In s u m m a r y , the p r o p o s e d ana ly t i ca l p r o c e -
du res ba sed on s e c o n d - o r d e r de r iva t i ve U V spec-
t r o m e t r y o f fe r the a d v a n t a g e o f an inc reased reso-
l u t i on and d e c r e a s e d spec t ra l i n t e r f e rences and
c o u l d be used for a r ap id and re l iab le qua l i t y
con t ro l o f c o m m e r c i a l f o r m u l a t i o n s c o n t a i n i n g hy-
d r o c h l o r o t h i a z i d e a n d ami lo r ide , a l one o r in c o m -
b ina t ion .
References
Abdel-Hamid, M.E., Abdel-Khalek, M.M. and Mahrous, M.S., Application of difference and derivative ultraviolet spec- trometry for the assay of some benzodiazepines. Anal Lett., 17 (1984) 1353-1371.
Bedair, M., Korany, M.A. and El-Yazbi, F.A., UV-Derivative spectrophotometric determination of hydralazine hydro- chloride in combination with hydrochlorothiazide or pro- pranolol hydrochloride. Sci. Pharm., 54 (1986) 31-35.
Bermego, A., Loper-Rivadulla, M., Pernadez, P. and Con- cheiro, L., Application of derivative spectroscopy to the
determination of plasma theophylline in the presence of phenobarbital. J. Anal. Toxicol., 9 (1985) 76-79.
Corany, M.A., Wahbi, A.M., Elsayed, M.A. and Mandour, S., First derivative spectrophotometric determination of cer- tain drugs in two-component mixtures. AnaL Lett., 17 (B12) (1984) 1373-1386.
Davidson, A.G. and Elsheikh, Assay of ephedrine or pseudo- ephedrine in pharmaceutical preparations by second and fourth derivative ultraviolet spectrophotometry. Analyst, 107 (1982) 879-881.
Fell, A.F., Jarvie, D.R. and Stewart, M.J., Analysis of paraquat by second and fourth derivative spectroscopy. Clin. Chem., 27 (1981) 286-292.
Gill, R., Bal, T.S. and Moffat, A.C., The application of deriva- tive UV-visible spectroscopy in forensic toxicology. J. Fo- rensic Sci. Soc., 22 (1982) 165-171.
Martinez, D., and Gimenez, M.P., Determination of benzodi- azepines by derivative spectroscopy. J. Anal, Toxicol., 5 (1981) 10-13.
Nobile, L., Cavrini, V., Raggi, M.A. and Di Pietra, A.M., Analysis of thiamphenicol glycinate salts in pharmaceutical formulations by derivative UV spectroscopy. Int. J. Pharm., 40 (1987) 85-91.
O'Haver, T.C., Potential clinical applications of derivative and wavelength-modulation spectrometry. Clin. Chem., 25 (1979) 1548-1559.
O'Haver, T.C. and Green, G.L., Numerical error analysis of derivative spectrometry for the quantitative analysis of mixtures. Anal, Chem., 48 (1976) 312-318.
Poulou, M. and Macheras, P., Determination of nitrofurantoin in urine by derivative spectroscopy. Int. J. Pharm., 34 (1986) 29-34.